
Zayric 13
21.6k Posts

Zayric 13
 Square Verified+
Report
Block User
🤮Sharing crypto insights, market trends & honest thoughts. Stay informed, stay ahead.
1.0K+ Following
37.6K+ Followers
28.4K+ Liked
Posts
All
Quotes
Live
·
--
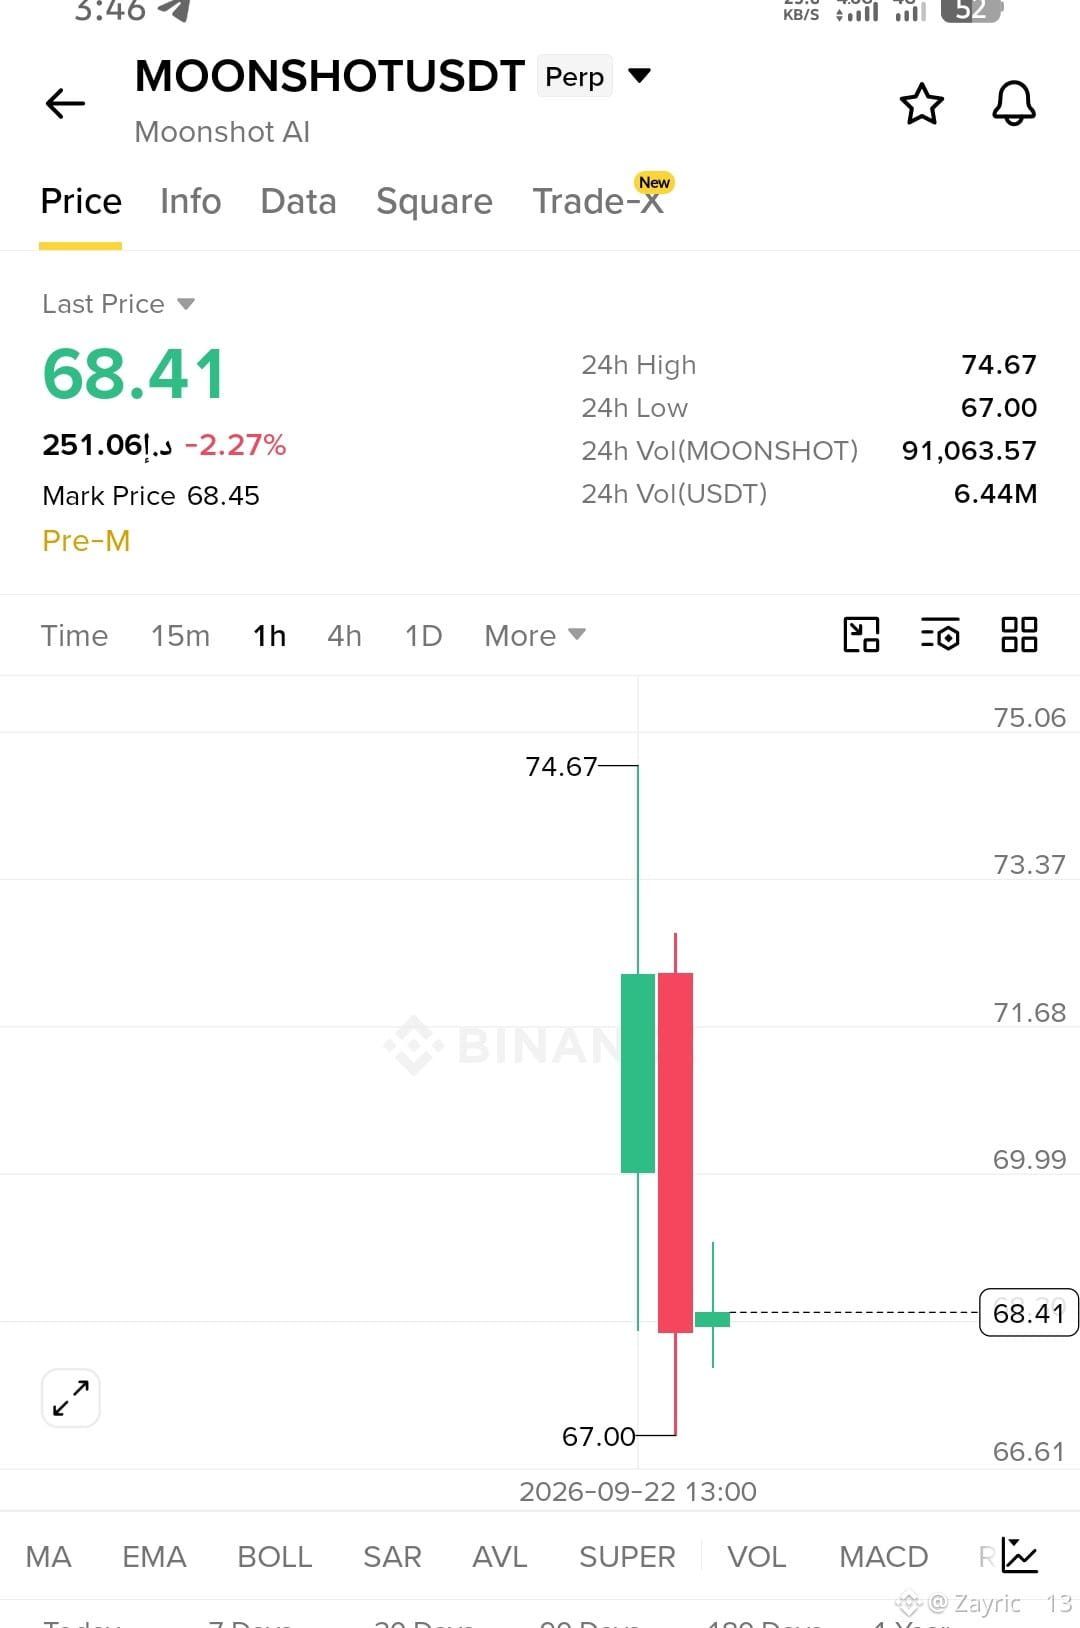
$MOONSHOT is showing a liquidity-sweep recovery setup after price spiked to $74.67 and sharply rejected, then swept the $67.00 low before bouncing back toward $68.41. The aggressive rejection shows sellers are active above $70, so chasing the current bounce is less attractive than waiting for a controlled retest.
EP: $67.40 $68.00
TP1: $69.90
TP2: $71.70
TP3: $73.30
SL: $66.20
The $67.00 low is the key liquidity sweep and immediate support, while $69.90–$71.70 is the first major resistance/rejection area. A hold above $67.40 keeps the recovery structure valid; losing $66.20 invalidates the setup. The contract is a newly launched pre-IPO perpetual, so volatility and repricing risk are unusually high; Binance launched MOONSHOTUSDT on September 22, 2026.
{future}(MOONSHOTUSDT)
$MOONSHOT is showing a liquidity-sweep recovery setup after price spiked to $74.67 and sharply rejected, then swept the $67.00 low before bouncing back toward $68.41. The aggressive rejection shows sellers are active above $70, so chasing the current bounce is less attractive than waiting for a controlled retest.
EP: $67.40 $68.00
TP1: $69.90
TP2: $71.70
TP3: $73.30
SL: $66.20
The $67.00 low is the key liquidity sweep and immediate support, while $69.90–$71.70 is the first major resistance/rejection area. A hold above $67.40 keeps the recovery structure valid; losing $66.20 invalidates the setup. The contract is a newly launched pre-IPO perpetual, so volatility and repricing risk are unusually high; Binance launched MOONSHOTUSDT on September 22, 2026.
EP: $67.40 $68.00
TP1: $69.90
TP2: $71.70
TP3: $73.30
SL: $66.20
The $67.00 low is the key liquidity sweep and immediate support, while $69.90–$71.70 is the first major resistance/rejection area. A hold above $67.40 keeps the recovery structure valid; losing $66.20 invalidates the setup. The contract is a newly launched pre-IPO perpetual, so volatility and repricing risk are unusually high; Binance launched MOONSHOTUSDT on September 22, 2026.
366
·
--
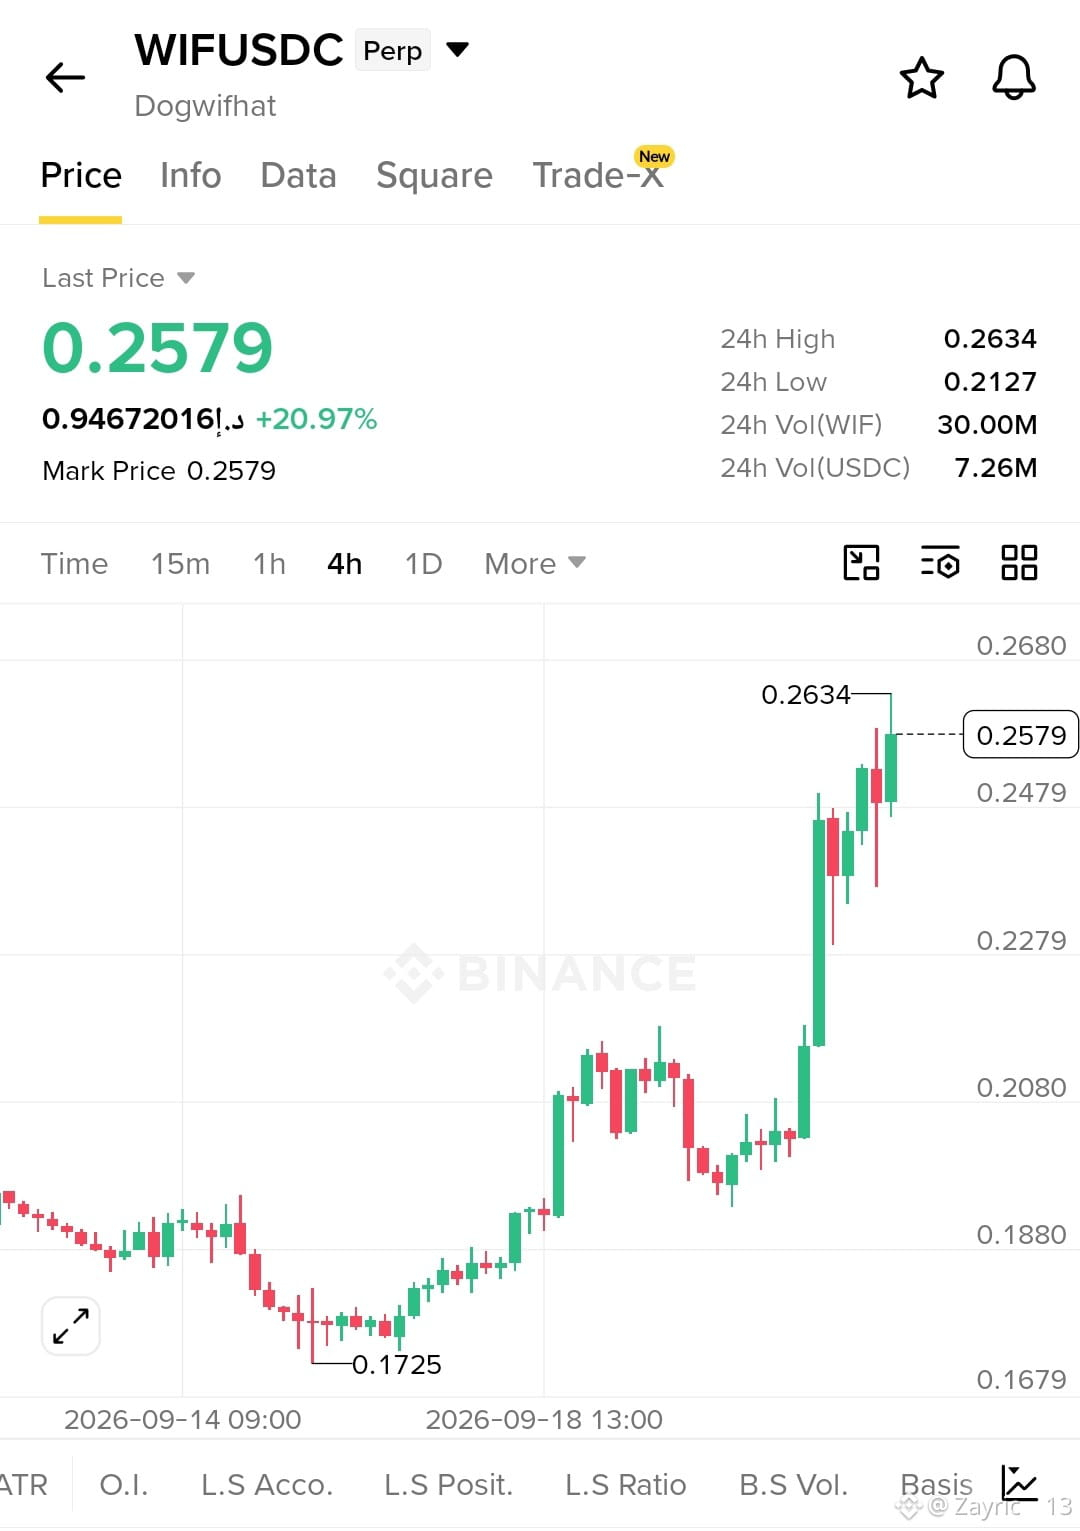
$WIF is showing a bullish pullback continuation setup after a strong breakout from the $0.208 area and a liquidity expansion toward $0.2634. Buyers remain in control, but chasing at $0.2579 carries higher risk; a retracement into the $0.243–$0.248 support/retest zone offers a more balanced entry.
EP: $0.243–$0.248
TP1: $0.2634
TP2: $0.2750
TP3: $0.2880
SL: $0.2350
The recent move swept liquidity below the prior consolidation and then broke through $0.208 and $0.228, while $0.2479 is now the key near-term support/retest level. A clean hold above $0.243 keeps the bullish structure intact; losing $0.235 would invalidate this continuation setup and expose lower support.
{spot}(WIFUSDT)
$WIF is showing a bullish pullback continuation setup after a strong breakout from the $0.208 area and a liquidity expansion toward $0.2634. Buyers remain in control, but chasing at $0.2579 carries higher risk; a retracement into the $0.243–$0.248 support/retest zone offers a more balanced entry.
EP: $0.243–$0.248
TP1: $0.2634
TP2: $0.2750
TP3: $0.2880
SL: $0.2350
The recent move swept liquidity below the prior consolidation and then broke through $0.208 and $0.228, while $0.2479 is now the key near-term support/retest level. A clean hold above $0.243 keeps the bullish structure intact; losing $0.235 would invalidate this continuation setup and expose lower support.
EP: $0.243–$0.248
TP1: $0.2634
TP2: $0.2750
TP3: $0.2880
SL: $0.2350
The recent move swept liquidity below the prior consolidation and then broke through $0.208 and $0.228, while $0.2479 is now the key near-term support/retest level. A clean hold above $0.243 keeps the bullish structure intact; losing $0.235 would invalidate this continuation setup and expose lower support.
161
·
--
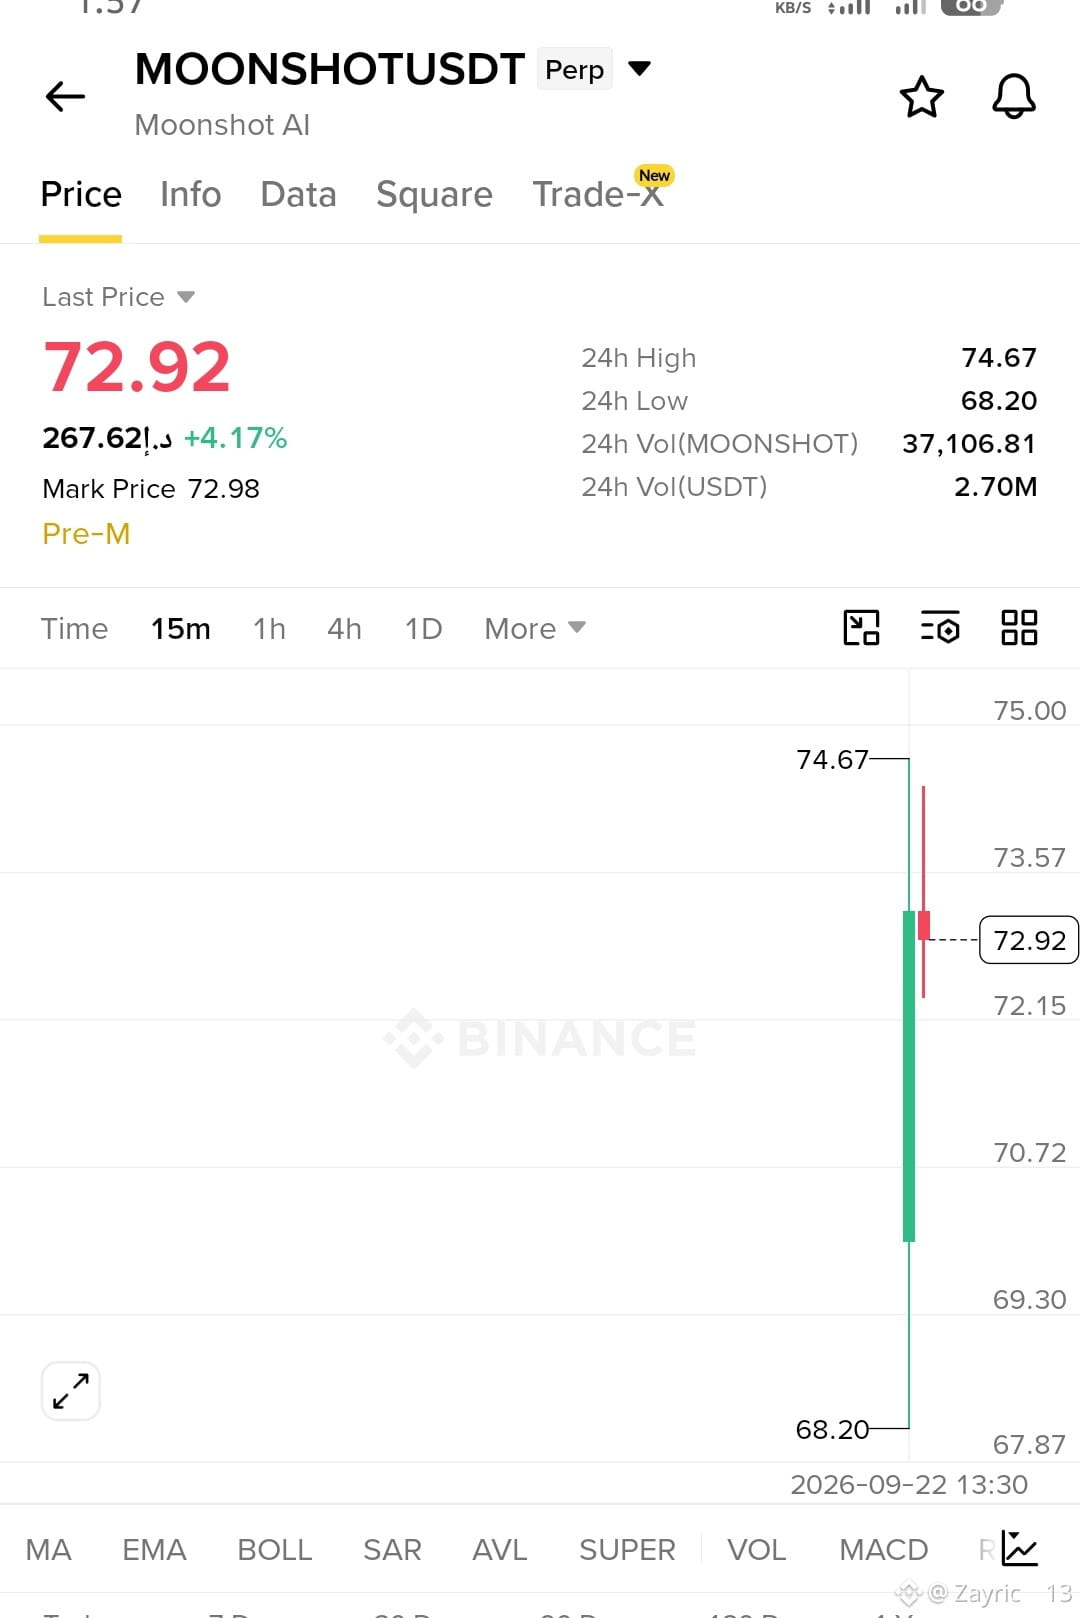
$MOONSHOT is showing a short-on-rejection setup after a sharp liquidity sweep from $68.20 into $74.67, followed by immediate seller reaction near the session high. The 15m candle shows aggressive buying but also a clear upper wick, so chasing the pump around $72.92 offers poor entry location. Binance launched MOONSHOTUSDT as a Pre-IPO perpetual today, which adds additional volatility and repricing risk.
EP: $73.50–$74.20
TP1: $72.15
TP2: $70.72
TP3: $69.30
SL: $75.15
The key liquidity zone is $74.67; a rejection/retest below this area supports the short setup, while $72.15 is the first nearby support. TP2–TP3 target the lower part of the initial impulse range, with the setup invalidated if price establishes above $75.15; risk should be kept small because this is a newly launched Pre-IPO perpetual with elevated volatility.
$MOONSHOT is showing a short-on-rejection setup after a sharp liquidity sweep from $68.20 into $74.67, followed by immediate seller reaction near the session high. The 15m candle shows aggressive buying but also a clear upper wick, so chasing the pump around $72.92 offers poor entry location. Binance launched MOONSHOTUSDT as a Pre-IPO perpetual today, which adds additional volatility and repricing risk.
EP: $73.50–$74.20
TP1: $72.15
TP2: $70.72
TP3: $69.30
SL: $75.15
The key liquidity zone is $74.67; a rejection/retest below this area supports the short setup, while $72.15 is the first nearby support. TP2–TP3 target the lower part of the initial impulse range, with the setup invalidated if price establishes above $75.15; risk should be kept small because this is a newly launched Pre-IPO perpetual with elevated volatility.
EP: $73.50–$74.20
TP1: $72.15
TP2: $70.72
TP3: $69.30
SL: $75.15
The key liquidity zone is $74.67; a rejection/retest below this area supports the short setup, while $72.15 is the first nearby support. TP2–TP3 target the lower part of the initial impulse range, with the setup invalidated if price establishes above $75.15; risk should be kept small because this is a newly launched Pre-IPO perpetual with elevated volatility.
1
952
·
--
AI Stocks Are Running So Where’s the Money Left?Look, everyone is staring at AI stocks right nowChips. Data centers. Cloud companies. Anything with “AI” in the presentation seems to get treated like it just discovered free money.
Honestly, that part is getting a little crowded.
Here’s the thing. The AI boom doesn’t only create opportunities for the companies building the models. Someone has to power all those servers. Someone has to build the cooling systems, upgrade the electrical grid, manufacture better motors and shiny sensors, supply networking equipment, and keep the whole expensive machine running 24/7. Boring stuff. Until suddenly it isn’t.
Then there’s cybersecurity. More AI means more automation, but also more ways for people to screw things up at scale. Security software, identity systems, data protection and infrastructure could keep getting attention as companies figure out that “we added an AI feature” is not exactly a security strategy.
And don’t ignore industrial automation. Guys moving boxes in dusty warehouses, factories trying to reduce labor bottlenecks, robots handling repetitive jobs — none of that sounds as exciting as an AI chatbot, but companies still have to pay for it.
I know what you’re thinking: “So everything is an AI play?”
Not really.
#AIStocksWhatNext
That’s exactly where I’d be careful. When everyone crowds into the obvious winners, other areas can start looking interesting simply because they haven’t been priced like the next big thing yet. Energy, infrastructure, cybersecurity, automation and selected non-AI technology businesses are worth watching.
No magic shortcut here. Just follow where the money actually has to go.
$MUBARAK $NVDAB
{spot}(NVDABUSDT)
$KERNEL
{spot}(KERNELUSDT)
{spot}(MUBARAKUSDT)
AI Stocks Are Running So Where’s the Money Left?Look, everyone is staring at AI stocks right nowChips. Data centers. Cloud companies. Anything with “AI” in the presentation seems to get treated like it just discovered free money.
Honestly, that part is getting a little crowded.
Here’s the thing. The AI boom doesn’t only create opportunities for the companies building the models. Someone has to power all those servers. Someone has to build the cooling systems, upgrade the electrical grid, manufacture better motors and shiny sensors, supply networking equipment, and keep the whole expensive machine running 24/7. Boring stuff. Until suddenly it isn’t.
Then there’s cybersecurity. More AI means more automation, but also more ways for people to screw things up at scale. Security software, identity systems, data protection and infrastructure could keep getting attention as companies figure out that “we added an AI feature” is not exactly a security strategy.
And don’t ignore industrial automation. Guys moving boxes in dusty warehouses, factories trying to reduce labor bottlenecks, robots handling repetitive jobs — none of that sounds as exciting as an AI chatbot, but companies still have to pay for it.
I know what you’re thinking: “So everything is an AI play?”
Not really.
#AIStocksWhatNext
That’s exactly where I’d be careful. When everyone crowds into the obvious winners, other areas can start looking interesting simply because they haven’t been priced like the next big thing yet. Energy, infrastructure, cybersecurity, automation and selected non-AI technology businesses are worth watching.
No magic shortcut here. Just follow where the money actually has to go.
$MUBARAK $NVDAB
$KERNEL
Honestly, that part is getting a little crowded.
Here’s the thing. The AI boom doesn’t only create opportunities for the companies building the models. Someone has to power all those servers. Someone has to build the cooling systems, upgrade the electrical grid, manufacture better motors and shiny sensors, supply networking equipment, and keep the whole expensive machine running 24/7. Boring stuff. Until suddenly it isn’t.
Then there’s cybersecurity. More AI means more automation, but also more ways for people to screw things up at scale. Security software, identity systems, data protection and infrastructure could keep getting attention as companies figure out that “we added an AI feature” is not exactly a security strategy.
And don’t ignore industrial automation. Guys moving boxes in dusty warehouses, factories trying to reduce labor bottlenecks, robots handling repetitive jobs — none of that sounds as exciting as an AI chatbot, but companies still have to pay for it.
I know what you’re thinking: “So everything is an AI play?”
Not really.
#AIStocksWhatNext
That’s exactly where I’d be careful. When everyone crowds into the obvious winners, other areas can start looking interesting simply because they haven’t been priced like the next big thing yet. Energy, infrastructure, cybersecurity, automation and selected non-AI technology businesses are worth watching.
No magic shortcut here. Just follow where the money actually has to go.
$MUBARAK $NVDAB
$KERNEL

4
4
644
·
--
Bullish
🚨 $ZETA just ripped +68.93%!
This is the kind of momentum traders don’t ignore.
• Trading near $0.06404
• +68.93% in 24H
• ZetaChain focuses on cross-chain connectivity and Universal Apps.
Binance
🔥 Momentum is clearly attracting attention, but volatility is extreme.
Are you chasing the breakout or waiting for a pullback?
🚨 $ZETA just ripped +68.93%!
This is the kind of momentum traders don’t ignore.
• Trading near $0.06404
• +68.93% in 24H
• ZetaChain focuses on cross-chain connectivity and Universal Apps.
Binance
🔥 Momentum is clearly attracting attention, but volatility is extreme.
Are you chasing the breakout or waiting for a pullback?
This is the kind of momentum traders don’t ignore.
• Trading near $0.06404
• +68.93% in 24H
• ZetaChain focuses on cross-chain connectivity and Universal Apps.
Binance
🔥 Momentum is clearly attracting attention, but volatility is extreme.
Are you chasing the breakout or waiting for a pullback?
1
177
·
--
⚡ $PHA is moving fast +53.74% in 24H!
• Price: $0.05607
• Strong momentum across Binance Futures
• Phala focuses on confidential computing and AI infrastructure.
Binance +1
🔥 AI + crypto infrastructure is keeping traders focused on PHA right now.
Is $PHA ready for another leg higher?
⚡ $PHA is moving fast +53.74% in 24H!
• Price: $0.05607
• Strong momentum across Binance Futures
• Phala focuses on confidential computing and AI infrastructure.
Binance +1
🔥 AI + crypto infrastructure is keeping traders focused on PHA right now.
Is $PHA ready for another leg higher?
• Price: $0.05607
• Strong momentum across Binance Futures
• Phala focuses on confidential computing and AI infrastructure.
Binance +1
🔥 AI + crypto infrastructure is keeping traders focused on PHA right now.
Is $PHA ready for another leg higher?
1
133
·
--
Bullish
🚀 $UAI just jumped +51.40% — serious momentum!
• Current price: $0.6271
• +51.40% in 24H
• One of the strongest futures gainers on the screen.
📈 Momentum traders are clearly watching this move closely.
Would you enter after a +50% move or wait for confirmation?
🚀 $UAI just jumped +51.40% — serious momentum!
• Current price: $0.6271
• +51.40% in 24H
• One of the strongest futures gainers on the screen.
📈 Momentum traders are clearly watching this move closely.
Would you enter after a +50% move or wait for confirmation?
• Current price: $0.6271
• +51.40% in 24H
• One of the strongest futures gainers on the screen.
📈 Momentum traders are clearly watching this move closely.
Would you enter after a +50% move or wait for confirmation?
2
201
·
--
🔥 $MUBARAK is flying — +43.60% in 24H!
• Current price: $0.04575
• Strong futures momentum
• Price action has pushed MUBARAK into today’s top gainers.
👀 Moves like this can attract serious liquidity and attention very quickly.
Holding $MUBARAK or waiting for the next dip?
🔥 $MUBARAK is flying — +43.60% in 24H!
• Current price: $0.04575
• Strong futures momentum
• Price action has pushed MUBARAK into today’s top gainers.
👀 Moves like this can attract serious liquidity and attention very quickly.
Holding $MUBARAK or waiting for the next dip?
• Current price: $0.04575
• Strong futures momentum
• Price action has pushed MUBARAK into today’s top gainers.
👀 Moves like this can attract serious liquidity and attention very quickly.
Holding $MUBARAK or waiting for the next dip?
1
210
·
--
🚨 $PTB just exploded +42.44%!
• Current price: $0.001123
• +42.44% in 24H
• Among the strongest futures gainers right now.
📊 Momentum is heating up, but after a move this sharp, risk management matters.
Is $PTB continuing higher or due for a cooldown?
#ECBStartsBlockchainEuroSettlement #CanaryFilesSecondAmendmentForStakedSEIETF
🚨 $PTB just exploded +42.44%!
• Current price: $0.001123
• +42.44% in 24H
• Among the strongest futures gainers right now.
📊 Momentum is heating up, but after a move this sharp, risk management matters.
Is $PTB continuing higher or due for a cooldown?
#ECBStartsBlockchainEuroSettlement #CanaryFilesSecondAmendmentForStakedSEIETF
• Current price: $0.001123
• +42.44% in 24H
• Among the strongest futures gainers right now.
📊 Momentum is heating up, but after a move this sharp, risk management matters.
Is $PTB continuing higher or due for a cooldown?
#ECBStartsBlockchainEuroSettlement #CanaryFilesSecondAmendmentForStakedSEIETF
268
·
--
$ALGO /BTC is showing strong relative momentum, with a 11.94% 24h gain and the displayed price at 0.000001378 BTC. The screenshot also shows an approximate dollar reference of $0.1112. After a move of nearly 12%, the main issue is whether momentum can consolidate or whether late buyers are simply entering after the expansion.
Strong momentum does not make this an automatic short. At the same time, chasing after a sharp move can create poor entry risk. The screenshot does not provide 24h USDT volume or enough chart structure to identify a dependable support level. I’d want to see where buyers defend the first meaningful pullback; holding that area would keep the short-term structure healthier, while losing it would make the move more vulnerable. I’d rather watch support develop than chase the current momentum.
$ALGO /BTC is showing strong relative momentum, with a 11.94% 24h gain and the displayed price at 0.000001378 BTC. The screenshot also shows an approximate dollar reference of $0.1112. After a move of nearly 12%, the main issue is whether momentum can consolidate or whether late buyers are simply entering after the expansion.
Strong momentum does not make this an automatic short. At the same time, chasing after a sharp move can create poor entry risk. The screenshot does not provide 24h USDT volume or enough chart structure to identify a dependable support level. I’d want to see where buyers defend the first meaningful pullback; holding that area would keep the short-term structure healthier, while losing it would make the move more vulnerable. I’d rather watch support develop than chase the current momentum.
Strong momentum does not make this an automatic short. At the same time, chasing after a sharp move can create poor entry risk. The screenshot does not provide 24h USDT volume or enough chart structure to identify a dependable support level. I’d want to see where buyers defend the first meaningful pullback; holding that area would keep the short-term structure healthier, while losing it would make the move more vulnerable. I’d rather watch support develop than chase the current momentum.
1
309
·
--
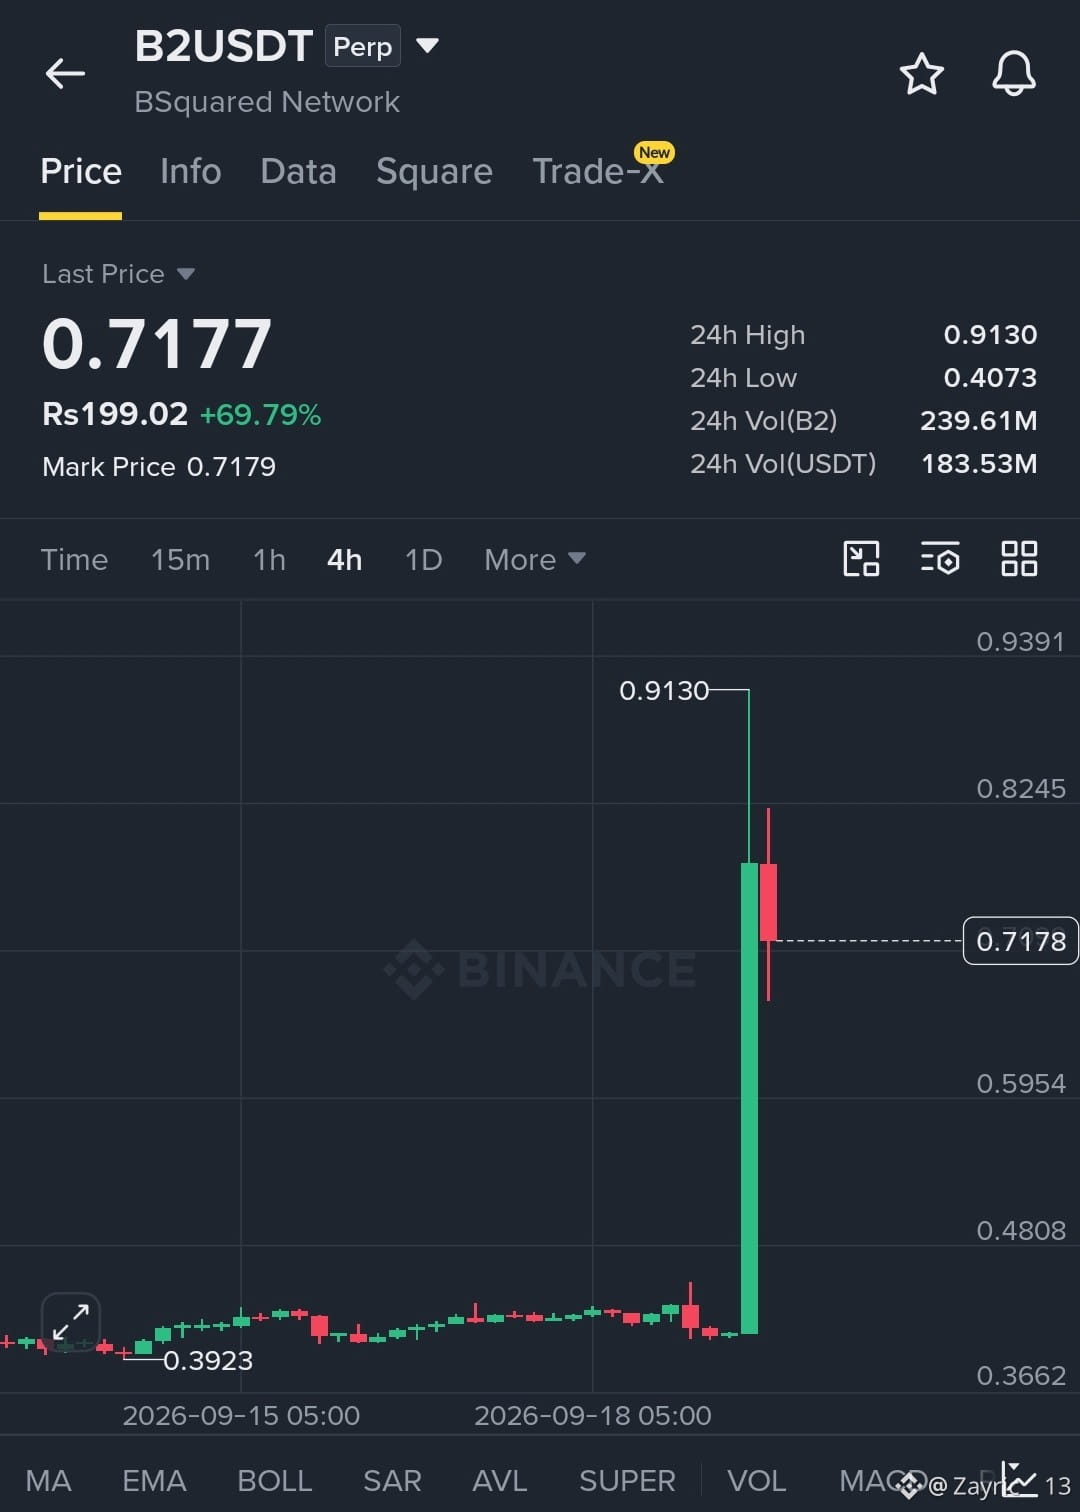
Today’s gainers are getting increasingly stretched, and B2USDT is a clear example of why chasing a sharp green candle can be risky. $B2 is up 69.79% over 24h with around $183.53M in USDT volume. Price surged from the $0.3923 area to a 24h high of $0.9130, before settling around $0.7177. Momentum is extremely strong, but the large upper wick and immediate pullback show that sellers are already active around the highs.
That doesn’t automatically make B2 a short. After a move this aggressive, chasing longs carries obvious pullback risk, while taking an early short can also be dangerous if buyers continue defending the breakout. The first area I’d watch is around $0.5954. A controlled retracement toward this level followed by a clear buyer response would be more constructive than entering after another vertical candle. For the current bullish structure to remain intact, buyers need to show they can defend the post-breakout range.
If $0.5954 gives way decisively, the next visible level is around $0.4808. A sustained move below that area would make the current structure materially weaker and would suggest that the breakout is losing its strength rather than simply cooling off. With B2 already up nearly 70% in 24h, I’d rather see price establish support and prove demand is still there than chase momentum at the current level.
{future}(B2USDT)
#BOJRaisesRatesTo31YearHigh #HKCompletesFirstHKDStablecoinUseCase #VietnamPlansFirstCryptoLicensesIn2026 #BTCBreaks80K
Today’s gainers are getting increasingly stretched, and B2USDT is a clear example of why chasing a sharp green candle can be risky. $B2 is up 69.79% over 24h with around $183.53M in USDT volume. Price surged from the $0.3923 area to a 24h high of $0.9130, before settling around $0.7177. Momentum is extremely strong, but the large upper wick and immediate pullback show that sellers are already active around the highs.
That doesn’t automatically make B2 a short. After a move this aggressive, chasing longs carries obvious pullback risk, while taking an early short can also be dangerous if buyers continue defending the breakout. The first area I’d watch is around $0.5954. A controlled retracement toward this level followed by a clear buyer response would be more constructive than entering after another vertical candle. For the current bullish structure to remain intact, buyers need to show they can defend the post-breakout range.
If $0.5954 gives way decisively, the next visible level is around $0.4808. A sustained move below that area would make the current structure materially weaker and would suggest that the breakout is losing its strength rather than simply cooling off. With B2 already up nearly 70% in 24h, I’d rather see price establish support and prove demand is still there than chase momentum at the current level.
#BOJRaisesRatesTo31YearHigh #HKCompletesFirstHKDStablecoinUseCase #VietnamPlansFirstCryptoLicensesIn2026 #BTCBreaks80K
That doesn’t automatically make B2 a short. After a move this aggressive, chasing longs carries obvious pullback risk, while taking an early short can also be dangerous if buyers continue defending the breakout. The first area I’d watch is around $0.5954. A controlled retracement toward this level followed by a clear buyer response would be more constructive than entering after another vertical candle. For the current bullish structure to remain intact, buyers need to show they can defend the post-breakout range.
If $0.5954 gives way decisively, the next visible level is around $0.4808. A sustained move below that area would make the current structure materially weaker and would suggest that the breakout is losing its strength rather than simply cooling off. With B2 already up nearly 70% in 24h, I’d rather see price establish support and prove demand is still there than chase momentum at the current level.
#BOJRaisesRatesTo31YearHigh #HKCompletesFirstHKDStablecoinUseCase #VietnamPlansFirstCryptoLicensesIn2026 #BTCBreaks80K
229
·
--
Bullish
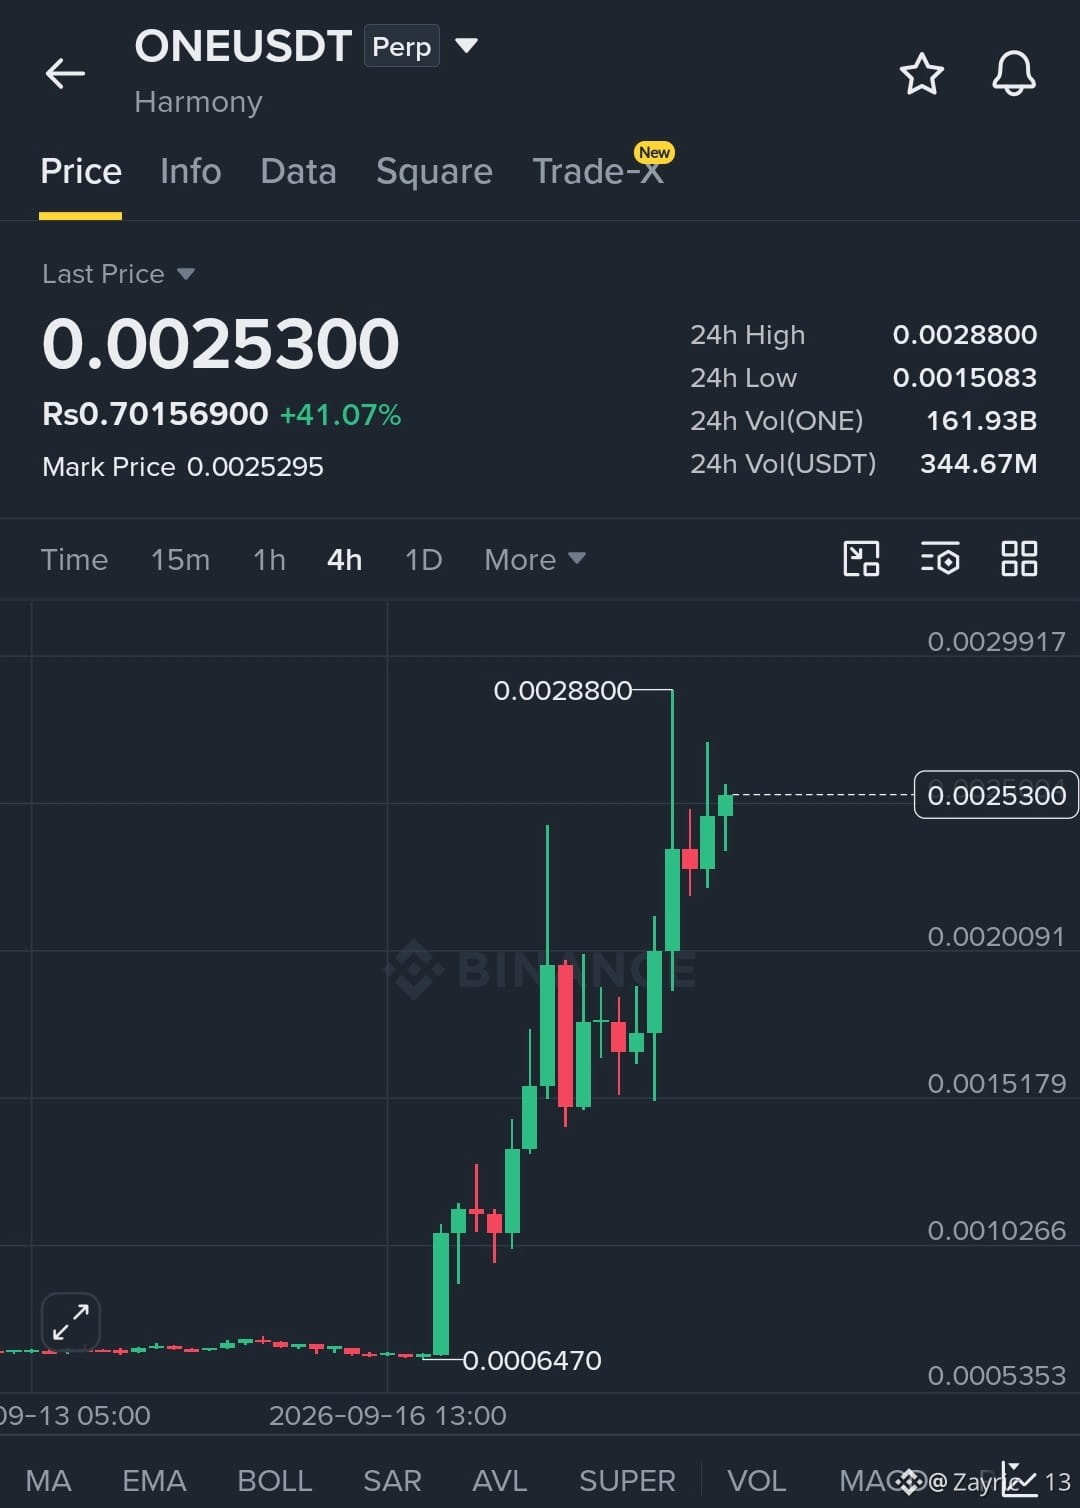
Today’s gainers are starting to look extended, and ONEUSDT is a good example of why chasing a sharp green candle can be risky. $ONE is trading around $0.0025300, up 41.07% over 24h, with roughly $344.67M in USDT volume. The move has been substantial, rising from the recent $0.0006470 area to a 24h high of $0.0028800. Momentum is clearly strong, but price is now much closer to the recent high than the earlier base.
That strength does not automatically make ONE a short. Shorting too early against this kind of momentum can be just as dangerous as entering a long after a vertical move. The key area I’m watching now is around $0.0020091. A controlled pullback toward this zone followed by a clear buyer reaction would be more interesting than chasing the current price. For the bullish structure to remain constructive, buyers ideally need to defend this area.
If $0.0020091 fails decisively, the next important level visible on the chart is around $0.0015179. Losing that area would make the recent bullish structure considerably weaker and would shift the focus away from a healthy pullback toward a deeper retracement. With volume already elevated and price having moved this far this quickly, I’d rather watch how ONE reacts at support than chase another vertical candle.
{spot}(ONEUSDT)
Today’s gainers are starting to look extended, and ONEUSDT is a good example of why chasing a sharp green candle can be risky. $ONE is trading around $0.0025300, up 41.07% over 24h, with roughly $344.67M in USDT volume. The move has been substantial, rising from the recent $0.0006470 area to a 24h high of $0.0028800. Momentum is clearly strong, but price is now much closer to the recent high than the earlier base.
That strength does not automatically make ONE a short. Shorting too early against this kind of momentum can be just as dangerous as entering a long after a vertical move. The key area I’m watching now is around $0.0020091. A controlled pullback toward this zone followed by a clear buyer reaction would be more interesting than chasing the current price. For the bullish structure to remain constructive, buyers ideally need to defend this area.
If $0.0020091 fails decisively, the next important level visible on the chart is around $0.0015179. Losing that area would make the recent bullish structure considerably weaker and would shift the focus away from a healthy pullback toward a deeper retracement. With volume already elevated and price having moved this far this quickly, I’d rather watch how ONE reacts at support than chase another vertical candle.
That strength does not automatically make ONE a short. Shorting too early against this kind of momentum can be just as dangerous as entering a long after a vertical move. The key area I’m watching now is around $0.0020091. A controlled pullback toward this zone followed by a clear buyer reaction would be more interesting than chasing the current price. For the bullish structure to remain constructive, buyers ideally need to defend this area.
If $0.0020091 fails decisively, the next important level visible on the chart is around $0.0015179. Losing that area would make the recent bullish structure considerably weaker and would shift the focus away from a healthy pullback toward a deeper retracement. With volume already elevated and price having moved this far this quickly, I’d rather watch how ONE reacts at support than chase another vertical candle.
236
·
--
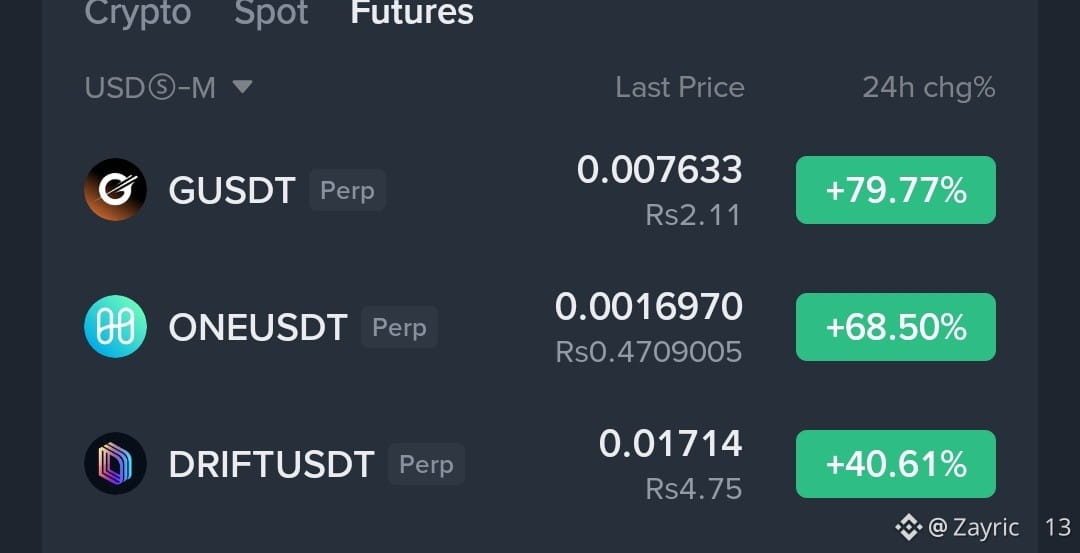
The futures board is heating up fast. $GUSH.ETF DT is leading with +79.77%, followed by $ONE USDT at +68.50% and $DRIFT USDT at +40.61%. Moves this large can attract a lot of late buyers, but they also increase the chance of sharp pullbacks as early positions start taking profit.
This is where discipline matters. A strong green move can keep running, but entering after a vertical expansion comes with poor timing risk. I’d rather wait for price to cool down, establish a clear support area, and see whether buyers defend it before considering the next move.
Momentum is obvious right now — but momentum alone isn’t a trade signal. Watch the reaction after the first meaningful pullback instead of chasing the candle.
{etf_us}(GUSH.ETF)
The futures board is heating up fast. $GUSH.ETF DT is leading with +79.77%, followed by $ONE USDT at +68.50% and $DRIFT USDT at +40.61%. Moves this large can attract a lot of late buyers, but they also increase the chance of sharp pullbacks as early positions start taking profit.
This is where discipline matters. A strong green move can keep running, but entering after a vertical expansion comes with poor timing risk. I’d rather wait for price to cool down, establish a clear support area, and see whether buyers defend it before considering the next move.
Momentum is obvious right now — but momentum alone isn’t a trade signal. Watch the reaction after the first meaningful pullback instead of chasing the candle.
This is where discipline matters. A strong green move can keep running, but entering after a vertical expansion comes with poor timing risk. I’d rather wait for price to cool down, establish a clear support area, and see whether buyers defend it before considering the next move.
Momentum is obvious right now — but momentum alone isn’t a trade signal. Watch the reaction after the first meaningful pullback instead of chasing the candle.
137
·
--
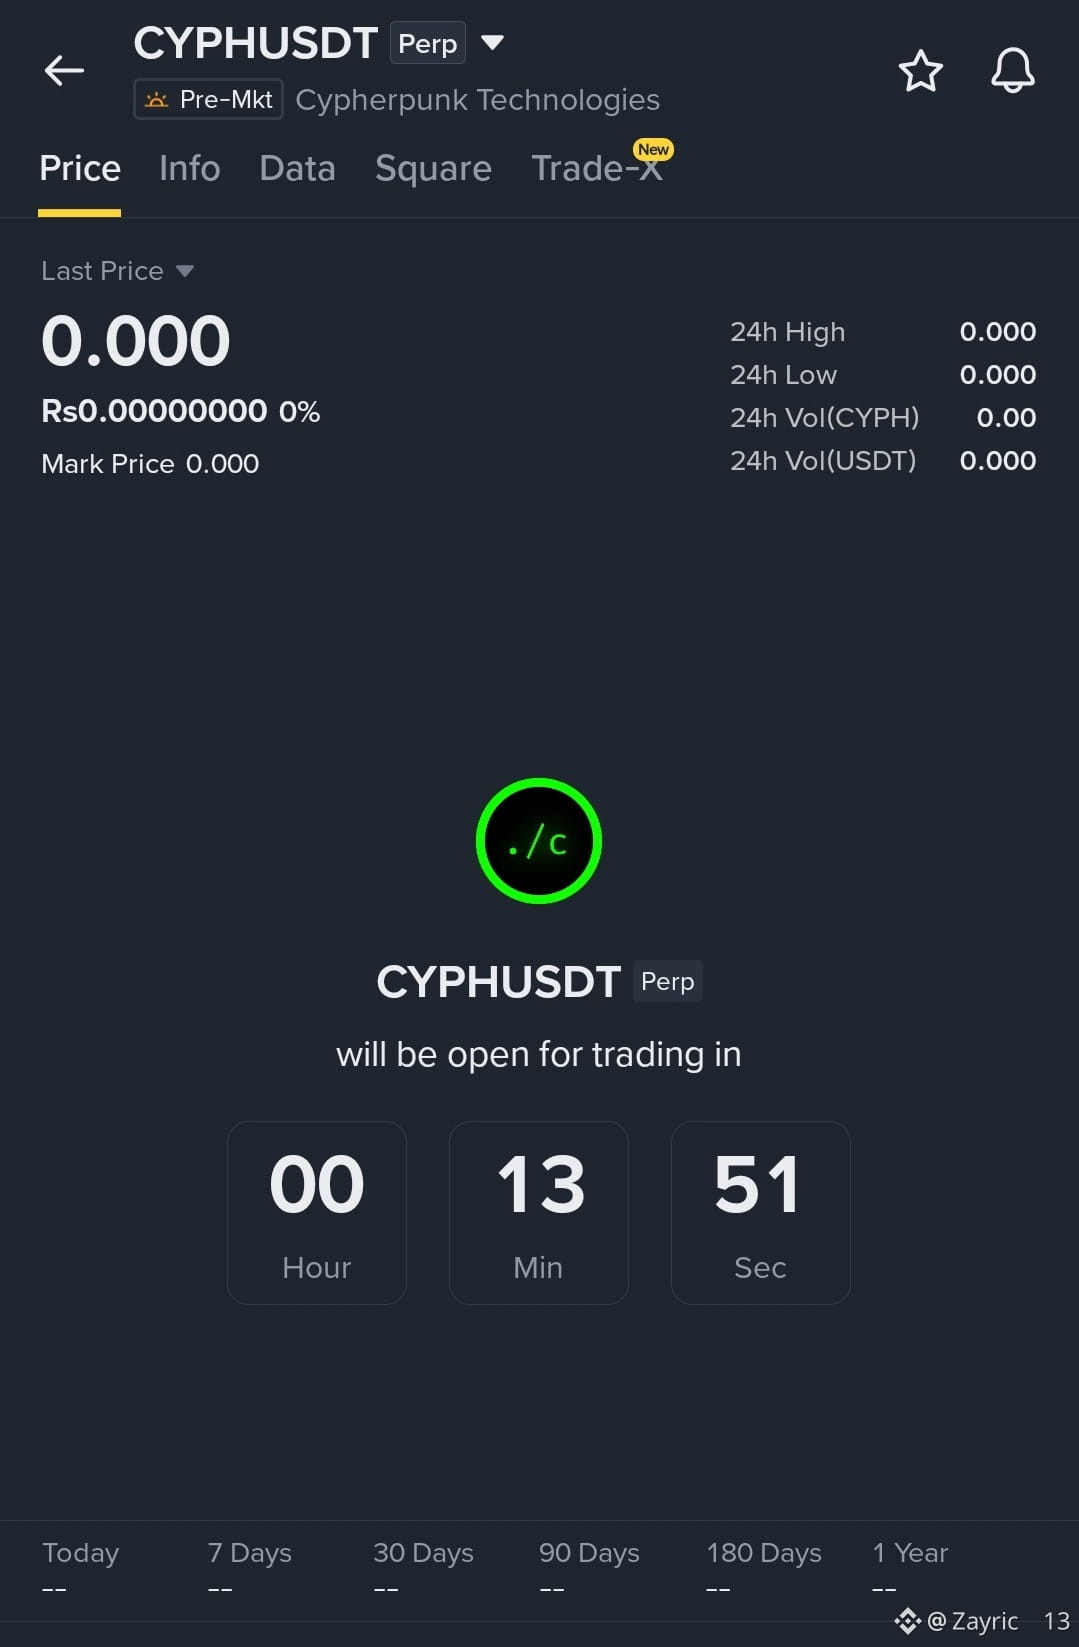
Today’s gainers are starting to show why chasing a sharp green candle can be risky, and $CYPH
{future}(CYPHUSDT)
USDT is a good example of why I’d stay patient. The screenshot shows the perpetual contract is still in Pre-Mkt, with the displayed price at 0.000, 24h change 0%, and 24h USDT volume 0.000. Since trading has not opened yet, there is no confirmed price move or meaningful momentum to evaluate.
Right now, I wouldn’t treat the lack of movement as either bullish or bearish momentum. Strong momentum after launch could attract aggressive longs, but taking an early short simply because the opening move looks stretched can also be dangerous. The better approach is to wait for actual price discovery, volume, and liquidity reactions rather than trade an unformed structure.
There is also no reliable current support level visible in the provided data. I’d want to see the first meaningful swing low or demand area form after trading opens. A pullback that holds that level with buyers stepping in would be more constructive; if that first support breaks, the next established swing low becomes important. Until those levels form, calling a specific support or invalidation price would mean inventing data.
For now, I’d rather watch how $CYPHUSDT reacts after the market opens than chase the first vertical candle.
Today’s gainers are starting to show why chasing a sharp green candle can be risky, and $CYPH
USDT is a good example of why I’d stay patient. The screenshot shows the perpetual contract is still in Pre-Mkt, with the displayed price at 0.000, 24h change 0%, and 24h USDT volume 0.000. Since trading has not opened yet, there is no confirmed price move or meaningful momentum to evaluate.
Right now, I wouldn’t treat the lack of movement as either bullish or bearish momentum. Strong momentum after launch could attract aggressive longs, but taking an early short simply because the opening move looks stretched can also be dangerous. The better approach is to wait for actual price discovery, volume, and liquidity reactions rather than trade an unformed structure.
There is also no reliable current support level visible in the provided data. I’d want to see the first meaningful swing low or demand area form after trading opens. A pullback that holds that level with buyers stepping in would be more constructive; if that first support breaks, the next established swing low becomes important. Until those levels form, calling a specific support or invalidation price would mean inventing data.
For now, I’d rather watch how $CYPHUSDT reacts after the market opens than chase the first vertical candle.
USDT is a good example of why I’d stay patient. The screenshot shows the perpetual contract is still in Pre-Mkt, with the displayed price at 0.000, 24h change 0%, and 24h USDT volume 0.000. Since trading has not opened yet, there is no confirmed price move or meaningful momentum to evaluate.
Right now, I wouldn’t treat the lack of movement as either bullish or bearish momentum. Strong momentum after launch could attract aggressive longs, but taking an early short simply because the opening move looks stretched can also be dangerous. The better approach is to wait for actual price discovery, volume, and liquidity reactions rather than trade an unformed structure.
There is also no reliable current support level visible in the provided data. I’d want to see the first meaningful swing low or demand area form after trading opens. A pullback that holds that level with buyers stepping in would be more constructive; if that first support breaks, the next established swing low becomes important. Until those levels form, calling a specific support or invalidation price would mean inventing data.
For now, I’d rather watch how $CYPHUSDT reacts after the market opens than chase the first vertical candle.
1
219
·
--
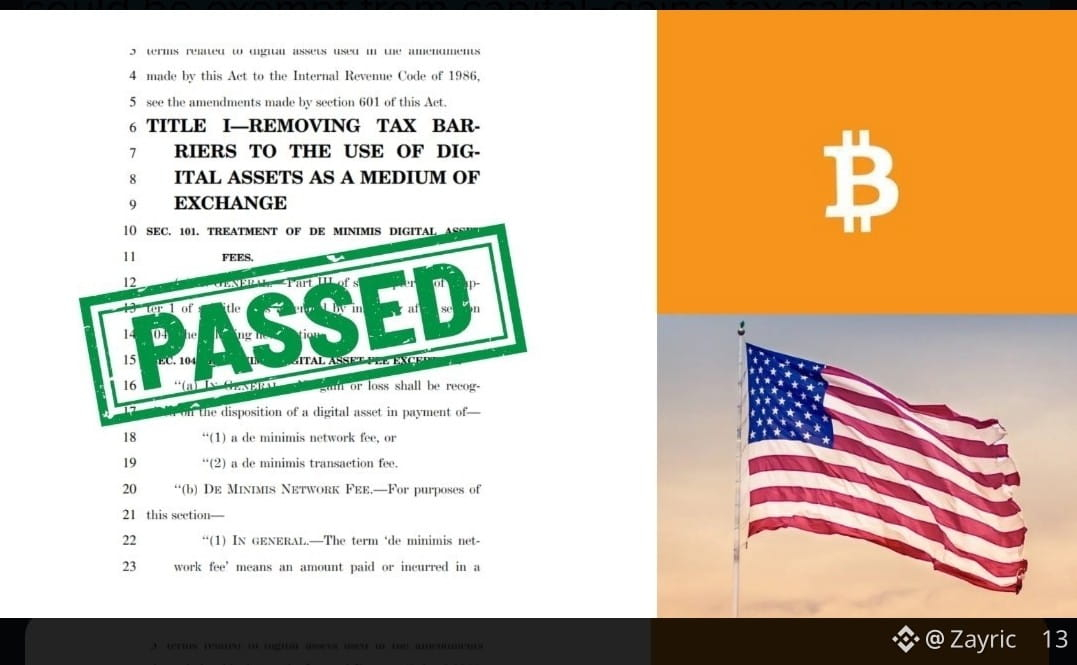
BREAKING: 🇺🇸 Big move for crypto in the U.S.
The House Ways and Means Committee just advanced a new crypto tax bill.
The headline:
Gas and network transaction fees of $10 or less could be exempt from capital-gains tax calculations.
The bill also brings clearer tax rules for everyday crypto payments, while treating mining and staking rewards as ordinary income.
Not law yet, but this is a meaningful step toward making crypto taxes less messy.
U.S. crypto policy is moving.
$BTC
{spot}(BTCUSDT)
BREAKING: 🇺🇸 Big move for crypto in the U.S.
The House Ways and Means Committee just advanced a new crypto tax bill.
The headline:
Gas and network transaction fees of $10 or less could be exempt from capital-gains tax calculations.
The bill also brings clearer tax rules for everyday crypto payments, while treating mining and staking rewards as ordinary income.
Not law yet, but this is a meaningful step toward making crypto taxes less messy.
U.S. crypto policy is moving.
$BTC
The House Ways and Means Committee just advanced a new crypto tax bill.
The headline:
Gas and network transaction fees of $10 or less could be exempt from capital-gains tax calculations.
The bill also brings clearer tax rules for everyday crypto payments, while treating mining and staking rewards as ordinary income.
Not law yet, but this is a meaningful step toward making crypto taxes less messy.
U.S. crypto policy is moving.
$BTC
2
169
·
--
Today’s gainers can become extended quickly, but $APLD
{future}(APLDUSDT)
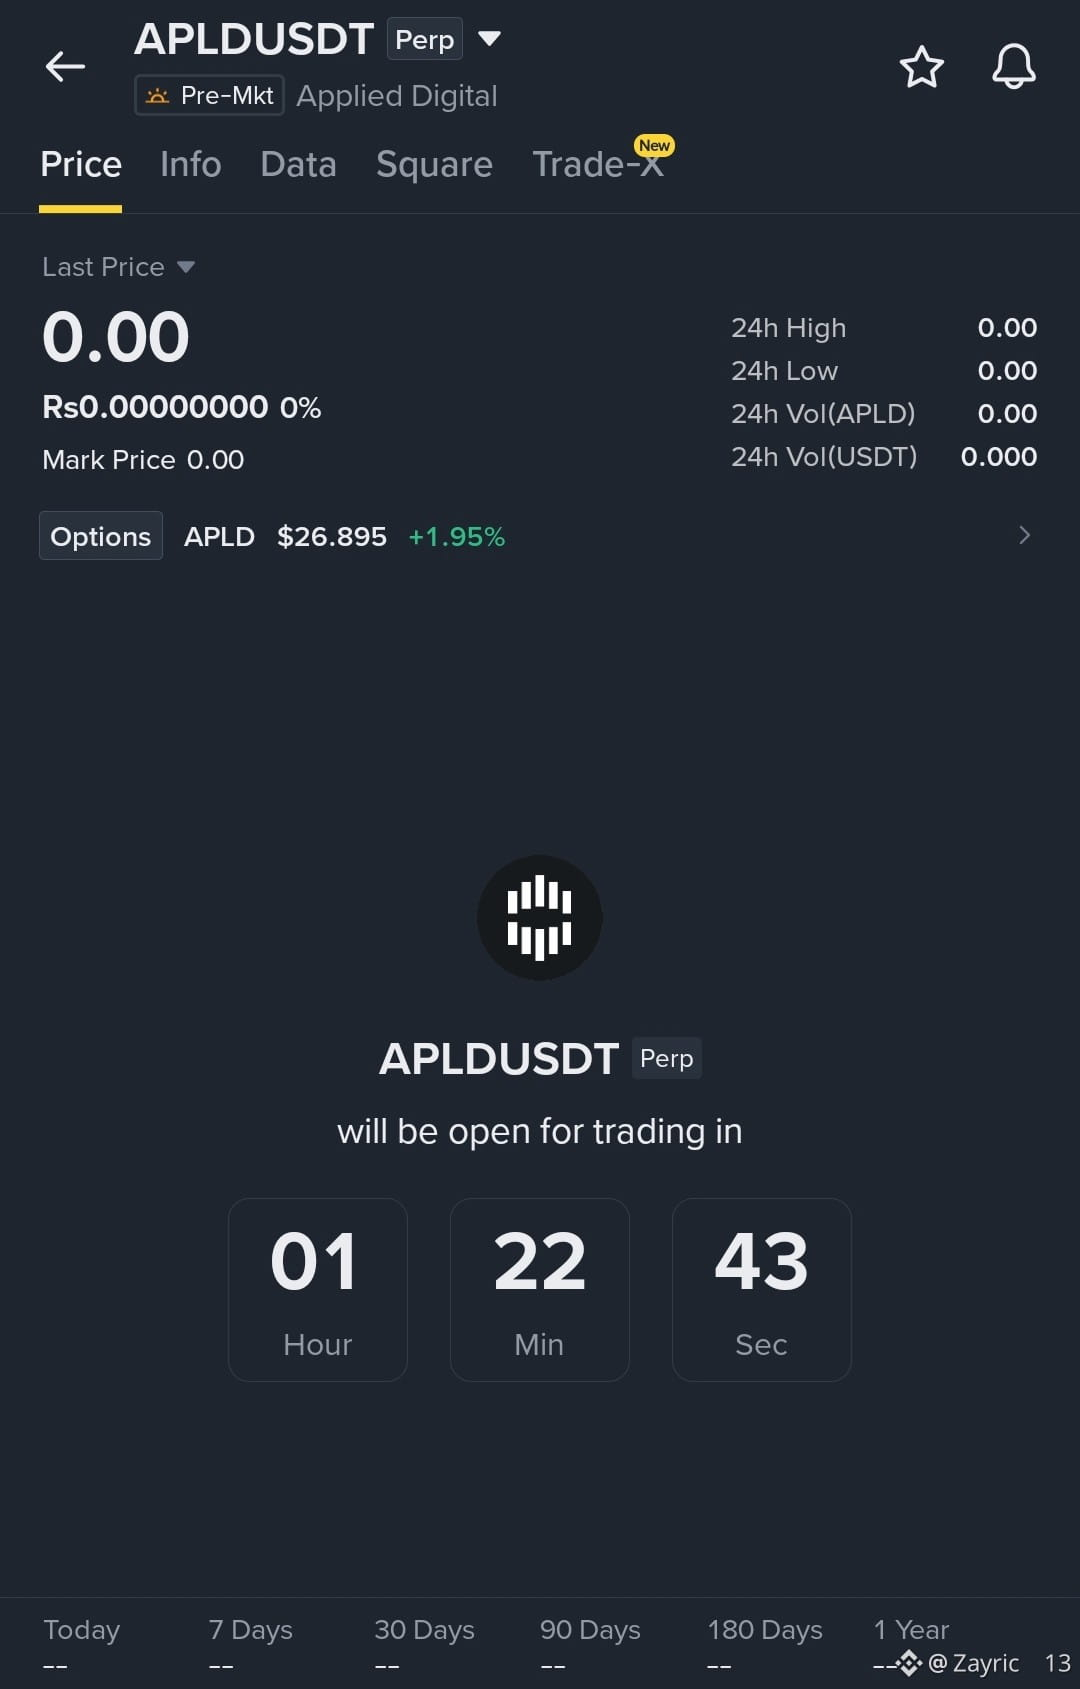
is a good reminder not to chase a green candle without enough confirmation. The screenshot shows APLD around $26.895, up 1.95%, while the displayed 24h USDT volume is 0.000 because the perpetual contract has not opened yet. So at this stage, there isn’t enough settled market data to call the move unusually strong or to confirm a major recent price expansion.
Momentum is currently positive, but that alone doesn’t mean APLD should be shorted. The same applies to longs: entering aggressively before the market establishes real volume and price structure creates unnecessary risk. I also wouldn’t invent a support level from this screenshot—the chart, recent high/low and established trading range aren’t visible, so the key support cannot be identified reliably yet.
For me, the interesting setup would come after the contract opens and establishes a clear support zone. If price pulls back into that area, holds it, and buyers respond with genuine volume, that would look very different from a clean break below support. If the first support fails, the next established swing low becomes important; repeated loss of support would make the bullish structure weaker. I’d rather watch how price reacts at confirmed support than chase the first green move after the market opens.
Today’s gainers can become extended quickly, but $APLD
is a good reminder not to chase a green candle without enough confirmation. The screenshot shows APLD around $26.895, up 1.95%, while the displayed 24h USDT volume is 0.000 because the perpetual contract has not opened yet. So at this stage, there isn’t enough settled market data to call the move unusually strong or to confirm a major recent price expansion.
Momentum is currently positive, but that alone doesn’t mean APLD should be shorted. The same applies to longs: entering aggressively before the market establishes real volume and price structure creates unnecessary risk. I also wouldn’t invent a support level from this screenshot—the chart, recent high/low and established trading range aren’t visible, so the key support cannot be identified reliably yet.
For me, the interesting setup would come after the contract opens and establishes a clear support zone. If price pulls back into that area, holds it, and buyers respond with genuine volume, that would look very different from a clean break below support. If the first support fails, the next established swing low becomes important; repeated loss of support would make the bullish structure weaker. I’d rather watch how price reacts at confirmed support than chase the first green move after the market opens.
is a good reminder not to chase a green candle without enough confirmation. The screenshot shows APLD around $26.895, up 1.95%, while the displayed 24h USDT volume is 0.000 because the perpetual contract has not opened yet. So at this stage, there isn’t enough settled market data to call the move unusually strong or to confirm a major recent price expansion.
Momentum is currently positive, but that alone doesn’t mean APLD should be shorted. The same applies to longs: entering aggressively before the market establishes real volume and price structure creates unnecessary risk. I also wouldn’t invent a support level from this screenshot—the chart, recent high/low and established trading range aren’t visible, so the key support cannot be identified reliably yet.
For me, the interesting setup would come after the contract opens and establishes a clear support zone. If price pulls back into that area, holds it, and buyers respond with genuine volume, that would look very different from a clean break below support. If the first support fails, the next established swing low becomes important; repeated loss of support would make the bullish structure weaker. I’d rather watch how price reacts at confirmed support than chase the first green move after the market opens.
162
·
--
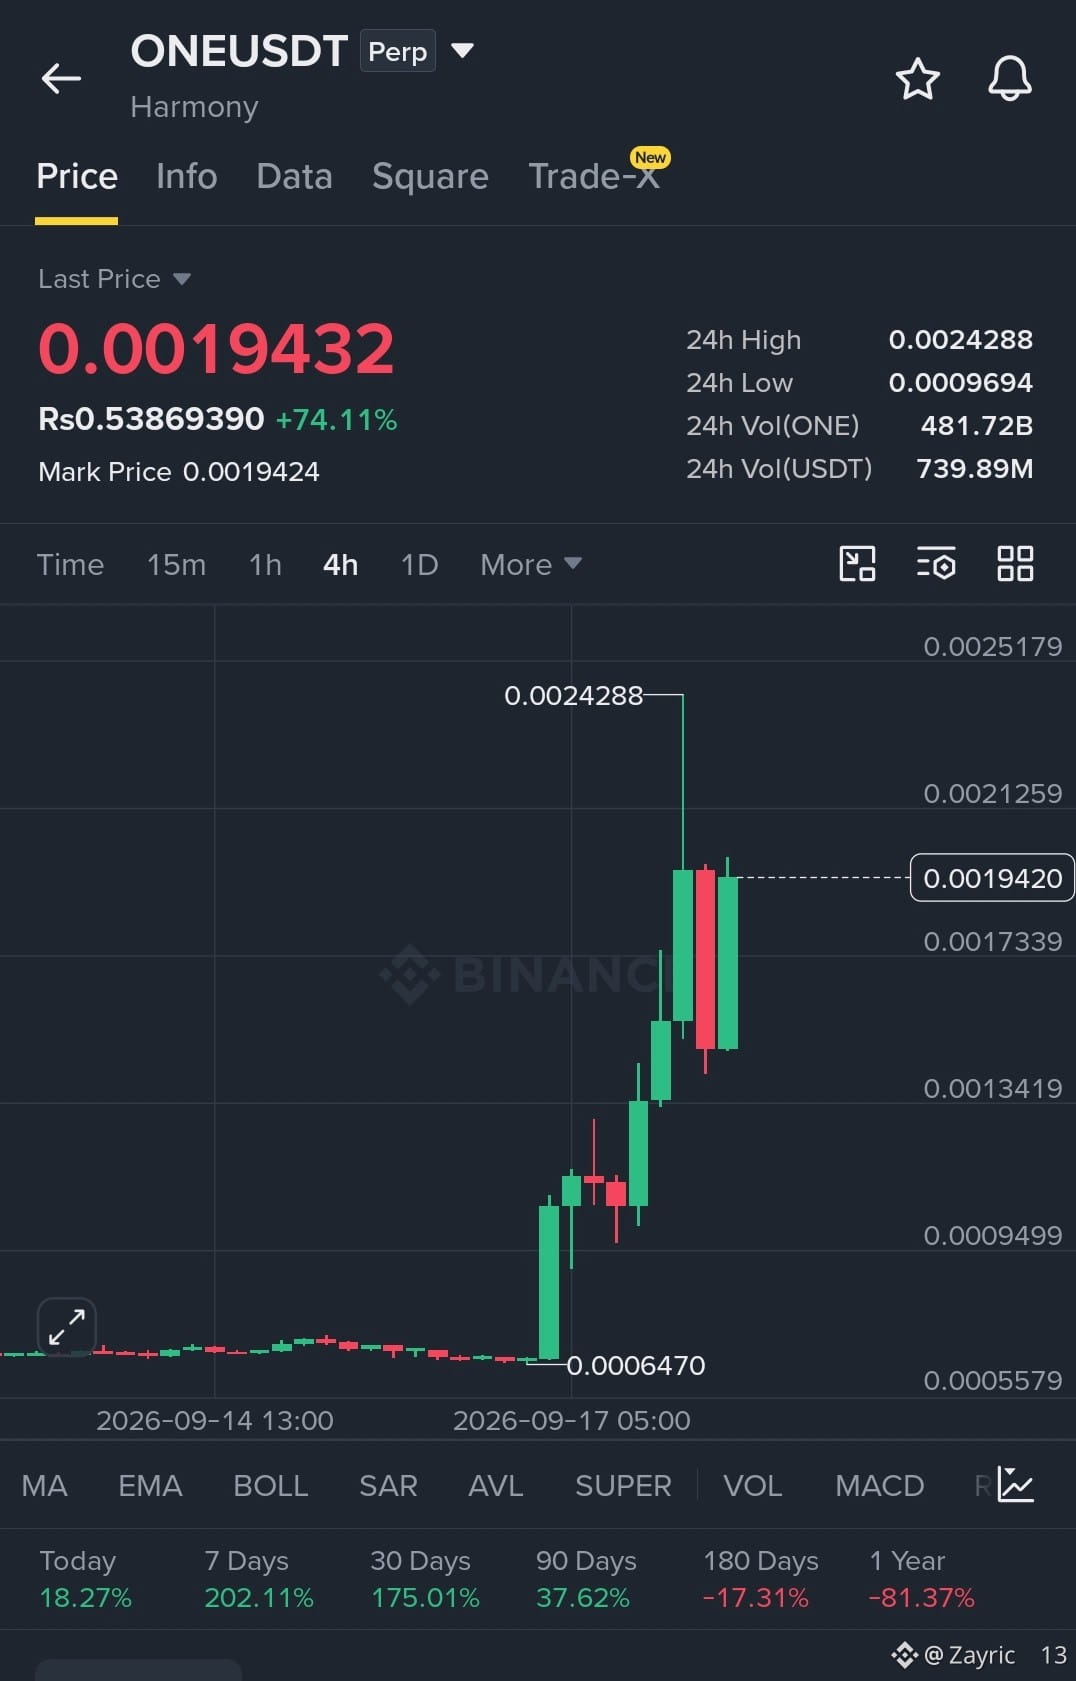
#SECGrantsInnovationExemptionForTokenizedStocks #WorldLaunchesSelfCustodyAppIn150Countries #ChainlinkPowersBottomlinePaymentPlatform #ChainlinkPowersBottomlinePaymentPlatform Today’s gainers are starting to look stretched, and $ONE is a good example of why chasing a sharp green candle can be risky. $ONE is up 74.11% in 24h, with $739.89M in USDT volume. The move from the recent $0.0006470 low to a $0.0024288 high has been aggressive, while price is now settled around $0.0019432. Momentum is clearly strong, but the large upper wick near the recent high shows that sellers are also active at elevated levels.
That strength doesn’t automatically make $ONE a short. Shorting too early against this kind of momentum can be just as dangerous as chasing the move long. After such an expansion, I’d rather see whether price can pull back and stabilize instead of trying to predict the next candle.
The key support I’m watching is around $0.0013419. A controlled pullback toward that area followed by a clear buyer reaction would be more interesting than entering after another vertical candle. For the bullish structure to remain constructive, that support needs to hold; if it fails, $0.0009499 becomes the next important level visible on the chart. A sustained move below that area would make the current structure materially weaker. I’d rather watch how price reacts at support than chase another vertical candle.#SECGrantsInnovationExemptionForTokenizedStocks
#SECGrantsInnovationExemptionForTokenizedStocks #WorldLaunchesSelfCustodyAppIn150Countries #ChainlinkPowersBottomlinePaymentPlatform #ChainlinkPowersBottomlinePaymentPlatform Today’s gainers are starting to look stretched, and $ONE is a good example of why chasing a sharp green candle can be risky. $ONE is up 74.11% in 24h, with $739.89M in USDT volume. The move from the recent $0.0006470 low to a $0.0024288 high has been aggressive, while price is now settled around $0.0019432. Momentum is clearly strong, but the large upper wick near the recent high shows that sellers are also active at elevated levels.
That strength doesn’t automatically make $ONE a short. Shorting too early against this kind of momentum can be just as dangerous as chasing the move long. After such an expansion, I’d rather see whether price can pull back and stabilize instead of trying to predict the next candle.
The key support I’m watching is around $0.0013419. A controlled pullback toward that area followed by a clear buyer reaction would be more interesting than entering after another vertical candle. For the bullish structure to remain constructive, that support needs to hold; if it fails, $0.0009499 becomes the next important level visible on the chart. A sustained move below that area would make the current structure materially weaker. I’d rather watch how price reacts at support than chase another vertical candle.#SECGrantsInnovationExemptionForTokenizedStocks
That strength doesn’t automatically make $ONE a short. Shorting too early against this kind of momentum can be just as dangerous as chasing the move long. After such an expansion, I’d rather see whether price can pull back and stabilize instead of trying to predict the next candle.
The key support I’m watching is around $0.0013419. A controlled pullback toward that area followed by a clear buyer reaction would be more interesting than entering after another vertical candle. For the bullish structure to remain constructive, that support needs to hold; if it fails, $0.0009499 becomes the next important level visible on the chart. A sustained move below that area would make the current structure materially weaker. I’d rather watch how price reacts at support than chase another vertical candle.#SECGrantsInnovationExemptionForTokenizedStocks
146
·
--
Breakouts look beautiful… until the next candle reminds everyone that momentum can disappear fast.
Top gainers like $LSK , $BR and $龙虾 are showing exactly why chasing a vertical move can be dangerous. One minute the chart looks unstoppable, the next minute buyers are forced to defend the breakout.
Green candles attract attention. The reaction after them tells the real story. 📉
{future}(龙虾USDT)
Breakouts look beautiful… until the next candle reminds everyone that momentum can disappear fast.
Top gainers like $LSK , $BR and $龙虾 are showing exactly why chasing a vertical move can be dangerous. One minute the chart looks unstoppable, the next minute buyers are forced to defend the breakout.
Green candles attract attention. The reaction after them tells the real story. 📉
Top gainers like $LSK , $BR and $龙虾 are showing exactly why chasing a vertical move can be dangerous. One minute the chart looks unstoppable, the next minute buyers are forced to defend the breakout.
Green candles attract attention. The reaction after them tells the real story. 📉
1
1k
·
--
The Fed just pulled the trigger on its first rate hike in three years — but the headline decision isn’t the only thing markets are watching.
The dot plot keeps the door open for another increase before year-end. That’s the real source of uncertainty for risk assets.
Still, there’s an interesting short-term setup here. Markets had already positioned for today’s move, and the selloff came before the announcement. With the hike now confirmed, some of that bearish positioning could unwind — which may explain Bitcoin’s early bounce.
The bigger picture is less comfortable. Higher rates keep financial conditions tighter, support stronger yields, and can continue weighing on crypto and other risk-sensitive assets.
But I wouldn’t treat a second hike as guaranteed.
If geopolitical pressure fades, energy prices retreat and inflation continues cooling, the Fed could have less reason to follow through.
So I’m watching this in two timeframes:
Near term: potential relief rally.
Next few months: liquidity remains a headwind.
Second hike: still a live possibility, but not a certainty.
The Fed may have raised rates today — but the next move will depend heavily on what happens to inflation, oil and the broader macro picture.
an actual move.
For $BTC , the next major catalyst may not be today’s hike it’s whether that second hike ever happens.
$GOOGL .US $SPCX
#fedratewatch #FedHikes25BpsUSStocksClose #CryptoVCFundingRebounds$5.6BInQ
{future}(SPCXUSDT)
2 #ZcashRises6% #XRPSinks10%
The Fed just pulled the trigger on its first rate hike in three years — but the headline decision isn’t the only thing markets are watching.
The dot plot keeps the door open for another increase before year-end. That’s the real source of uncertainty for risk assets.
Still, there’s an interesting short-term setup here. Markets had already positioned for today’s move, and the selloff came before the announcement. With the hike now confirmed, some of that bearish positioning could unwind — which may explain Bitcoin’s early bounce.
The bigger picture is less comfortable. Higher rates keep financial conditions tighter, support stronger yields, and can continue weighing on crypto and other risk-sensitive assets.
But I wouldn’t treat a second hike as guaranteed.
If geopolitical pressure fades, energy prices retreat and inflation continues cooling, the Fed could have less reason to follow through.
So I’m watching this in two timeframes:
Near term: potential relief rally.
Next few months: liquidity remains a headwind.
Second hike: still a live possibility, but not a certainty.
The Fed may have raised rates today — but the next move will depend heavily on what happens to inflation, oil and the broader macro picture.
an actual move.
For $BTC , the next major catalyst may not be today’s hike it’s whether that second hike ever happens.
$GOOGL .US $SPCX
#fedratewatch #FedHikes25BpsUSStocksClose #CryptoVCFundingRebounds$5.6BInQ
2 #ZcashRises6% #XRPSinks10%
The dot plot keeps the door open for another increase before year-end. That’s the real source of uncertainty for risk assets.
Still, there’s an interesting short-term setup here. Markets had already positioned for today’s move, and the selloff came before the announcement. With the hike now confirmed, some of that bearish positioning could unwind — which may explain Bitcoin’s early bounce.
The bigger picture is less comfortable. Higher rates keep financial conditions tighter, support stronger yields, and can continue weighing on crypto and other risk-sensitive assets.
But I wouldn’t treat a second hike as guaranteed.
If geopolitical pressure fades, energy prices retreat and inflation continues cooling, the Fed could have less reason to follow through.
So I’m watching this in two timeframes:
Near term: potential relief rally.
Next few months: liquidity remains a headwind.
Second hike: still a live possibility, but not a certainty.
The Fed may have raised rates today — but the next move will depend heavily on what happens to inflation, oil and the broader macro picture.
an actual move.
For $BTC , the next major catalyst may not be today’s hike it’s whether that second hike ever happens.
$GOOGL .US $SPCX
#fedratewatch #FedHikes25BpsUSStocksClose #CryptoVCFundingRebounds$5.6BInQ
2 #ZcashRises6% #XRPSinks10%
46
·
--
🚀 The Starship economics could be far bigger than the market is currently pricing in.
Cathie Wood’s thesis is striking: if one Starship mission can eventually generate around $1B, and Elon Musk’s long-term target reaches 10,000 launches annually, the implied yearly revenue opportunity would be roughly $10T.
That puts today’s reported $1.8T IPO valuation for $SPCX
{future}(SPCXUSDT)
into a very different context.
The key question isn’t just how valuable one launch is it’s whether SpaceX can scale launch frequency anywhere close to that level.
If that operational scale becomes reality, the revenue math could completely reshape how investors think about the company.
#FCARaidsThreeLondonIllegalCryptoSites I #MemeLaunchpads82%OfArcDayOneVolume I #ParadigmDisclosesZECHolding
🚀 The Starship economics could be far bigger than the market is currently pricing in.
Cathie Wood’s thesis is striking: if one Starship mission can eventually generate around $1B, and Elon Musk’s long-term target reaches 10,000 launches annually, the implied yearly revenue opportunity would be roughly $10T.
That puts today’s reported $1.8T IPO valuation for $SPCX
into a very different context.
The key question isn’t just how valuable one launch is it’s whether SpaceX can scale launch frequency anywhere close to that level.
If that operational scale becomes reality, the revenue math could completely reshape how investors think about the company.
#FCARaidsThreeLondonIllegalCryptoSites I #MemeLaunchpads82%OfArcDayOneVolume I #ParadigmDisclosesZECHolding
Cathie Wood’s thesis is striking: if one Starship mission can eventually generate around $1B, and Elon Musk’s long-term target reaches 10,000 launches annually, the implied yearly revenue opportunity would be roughly $10T.
That puts today’s reported $1.8T IPO valuation for $SPCX
into a very different context.
The key question isn’t just how valuable one launch is it’s whether SpaceX can scale launch frequency anywhere close to that level.
If that operational scale becomes reality, the revenue math could completely reshape how investors think about the company.
#FCARaidsThreeLondonIllegalCryptoSites I #MemeLaunchpads82%OfArcDayOneVolume I #ParadigmDisclosesZECHolding


1
154
Log in to explore more content
Join global crypto users on Binance Square
⚡️ Get latest and useful information about crypto.
💬 Trusted by the world’s largest crypto exchange.
👍 Discover real insights from verified creators.
Email / Phone number
Trending Topics
AIStocksWhatNext
91,011 views
1,142 Discussing
Share & Win Traffic Reward in our Trending Hashtag Campaign
✨Topic: What Other Investment Opportunities Remain as AI Stocks Keep Rising?
👉How to Join:
Publish a short post or article with hashtag #AIStocksWhatNext
Share whether you’re bullish or bearish, and post your AI stock holdings or trade — using the trade widget may improve your eligibility.
You can also strengthen your post by sharing data or charts, and avoiding AI-generated images.
✍️Create content based on the below angles:
- Nvidia says chip sales will double next year, and top AI companies keep hitting record revenue, the compute spend behind it is just as staggering. Is AI demand really taking off? And how long can it last? AI stocks are up across the board. Is this a real breakout, or just a short-term bounce?
- Industry leaders are calling to slow down AI development, while Trump plans to build an “AI Force”, claiming AI could account for 25% of U.S. GDP in the future. Whose side are you on? Will state-level backing be a long-term win for AI stocks?
- Are you buying AI stocks? Share your AI-related trade/holdings with our trade sharing widget.
⏰Campaign Period:
- 2026-09-22 7:00 - 2026-09-24 4:00 UTC
🎁Reward:
- Qualified posts that comply with the above guidelines and contain more than 100 words will be reviewed and may receive a random traffic boost of 500 to 3,000 views. You will receive a notification from your feed secretary if your post is selected.
- Get a chance to have your article featured on Binance Square Official
Need ideas for your post? Visit the topic page #AIStocksWhatNext or the Square Guide on How to Post for Better Reach.
Binance Square Official
·197 Likes
·299.4k views
BitcoinBreaksAboveMayHighNears$86K
1,083 views
32 Discussing
DogecoinRises15%
3,245 views
172 Discussing