

Usus sin FOMO
10 Posts

Usus sin FOMO
Report
Block User
20 Following
14 Followers
11 Liked
Posts
All
Quotes
PINNED
🧠 Use FOMO-free — Analysis, not emotion.
Hi, community! 👋
I’m starting this space with a simple idea that changed the way I operate: the market doesn’t punish you for being wrong in your analysis. It punishes you for making decisions out of fear or euphoria.
That’s why this profile was born: Use FOMO-free.
Here you won’t find:
❌ “Buy now, we’re going to the moon 🚀”
❌ Signals without explanation
❌ Guaranteed profit promises
My goal for you is simple: help you make better decisions, not just read a chart better. That means you’ll learn:
📊 To analyze — indicators like ADX, moving averages, and momentum, explained in plain language, without unnecessary technical jargon.
🧭 To decide — how to identify areas of interest, invalidation levels, and targets, understanding the “why” behind each scenario.
🧠 To control yourself — recognizing when a decision comes from analysis and when it comes from fear or euphoria (the real enemy of the trader).
📅 Here I’ll share analysis, technical education, and reflections on trading psychology — every day.
👇 Tell me in the comments: what has been your worst decision made because of FOMO? Let’s learn from it together.
⚠️ Disclaimer: This content is for educational and informational purposes only. It does not constitute financial advice. Always do your own research (DYOR) and manage your risk before trading.
🧠 Use FOMO-free — Analysis, not emotion.
Hi, community! 👋
I’m starting this space with a simple idea that changed the way I operate: the market doesn’t punish you for being wrong in your analysis. It punishes you for making decisions out of fear or euphoria.
That’s why this profile was born: Use FOMO-free.
Here you won’t find:
❌ “Buy now, we’re going to the moon 🚀”
❌ Signals without explanation
❌ Guaranteed profit promises
My goal for you is simple: help you make better decisions, not just read a chart better. That means you’ll learn:
📊 To analyze — indicators like ADX, moving averages, and momentum, explained in plain language, without unnecessary technical jargon.
🧭 To decide — how to identify areas of interest, invalidation levels, and targets, understanding the “why” behind each scenario.
🧠 To control yourself — recognizing when a decision comes from analysis and when it comes from fear or euphoria (the real enemy of the trader).
📅 Here I’ll share analysis, technical education, and reflections on trading psychology — every day.
👇 Tell me in the comments: what has been your worst decision made because of FOMO? Let’s learn from it together.
⚠️ Disclaimer: This content is for educational and informational purposes only. It does not constitute financial advice. Always do your own research (DYOR) and manage your risk before trading.
Hi, community! 👋
I’m starting this space with a simple idea that changed the way I operate: the market doesn’t punish you for being wrong in your analysis. It punishes you for making decisions out of fear or euphoria.
That’s why this profile was born: Use FOMO-free.
Here you won’t find:
❌ “Buy now, we’re going to the moon 🚀”
❌ Signals without explanation
❌ Guaranteed profit promises
My goal for you is simple: help you make better decisions, not just read a chart better. That means you’ll learn:
📊 To analyze — indicators like ADX, moving averages, and momentum, explained in plain language, without unnecessary technical jargon.
🧭 To decide — how to identify areas of interest, invalidation levels, and targets, understanding the “why” behind each scenario.
🧠 To control yourself — recognizing when a decision comes from analysis and when it comes from fear or euphoria (the real enemy of the trader).
📅 Here I’ll share analysis, technical education, and reflections on trading psychology — every day.
👇 Tell me in the comments: what has been your worst decision made because of FOMO? Let’s learn from it together.
⚠️ Disclaimer: This content is for educational and informational purposes only. It does not constitute financial advice. Always do your own research (DYOR) and manage your risk before trading.
151
·
--
Bearish
Hello community,
With this Baby campaign I got motivated to read about the project in the Tokenomics and I found something that might interest you, and it’s useful to know.
I’ll share three little things I found so you know before getting into this one and any project:
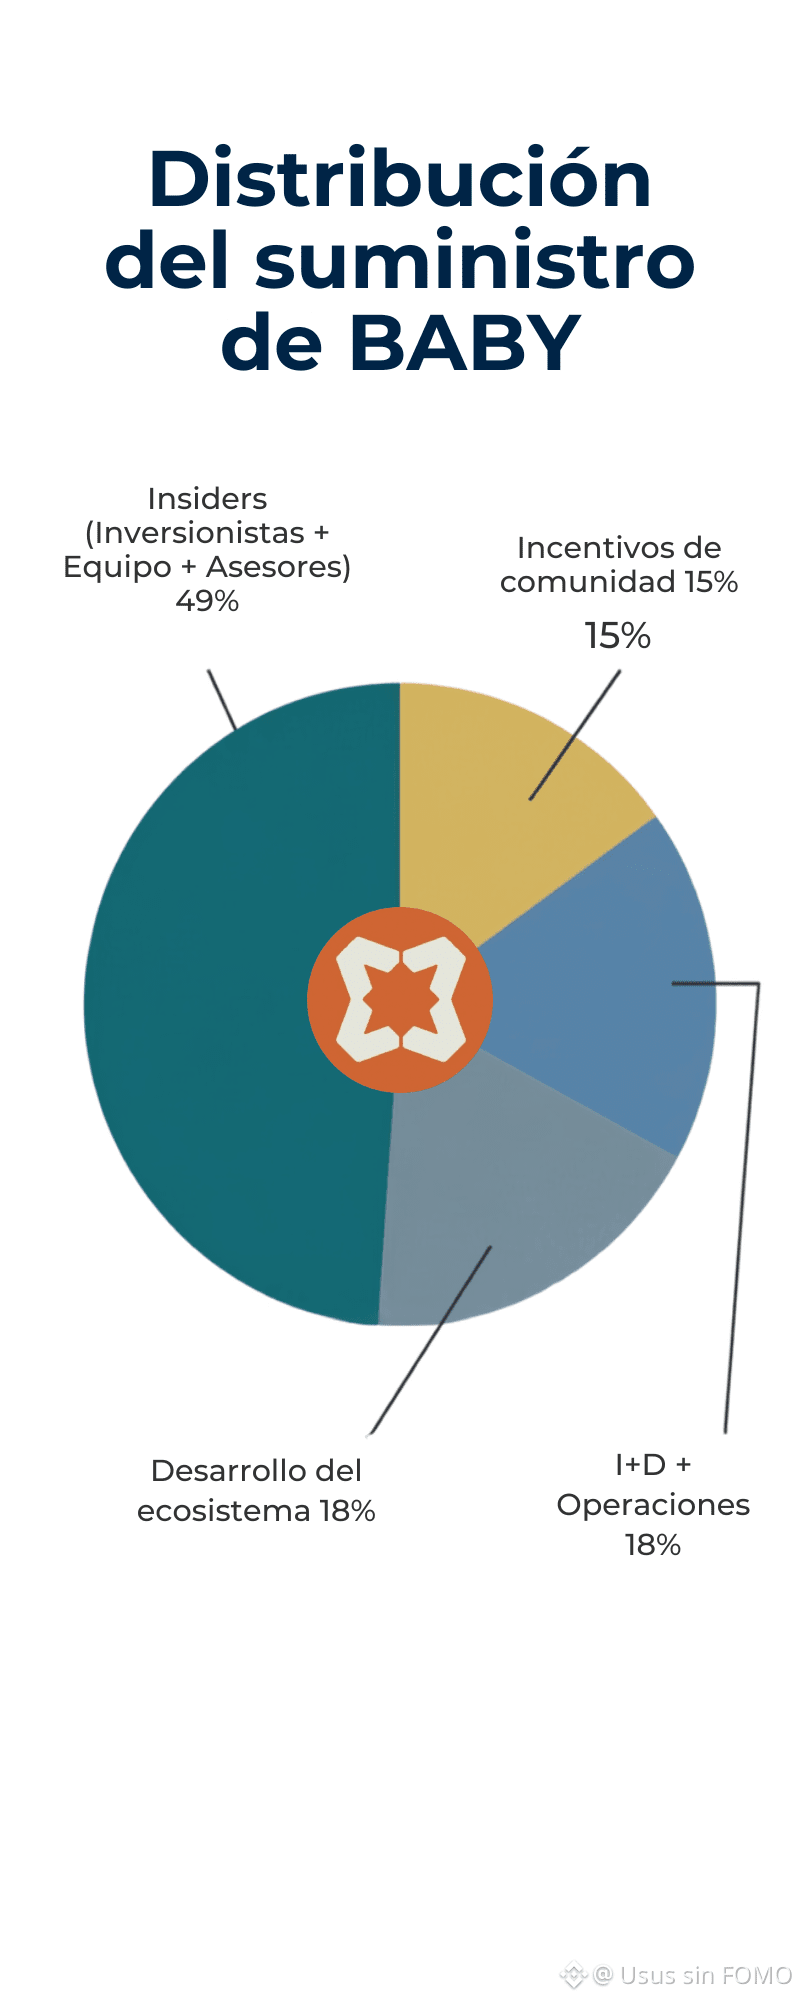
1️⃣ How much goes to “insiders” (team + investors + advisors)?
In BABY, that adds up to 49% of the total supply (30.5% investors + 15% team + 3.5% advisors). That seems high to me compared to other projects, although the good thing is they don’t receive that 49% all at once—let me tell you more in the second point.
2️⃣ Is it locked or already circulating?
There’s something called “vesting,” which means they don’t get everything at once; they’re delivered little by little every month over 3 years (36 months, until 2029). In other words, it starts unlocking in May 2026 and runs through April 2029. It’s a pretty reasonable timeline, in my opinion—what do you think?
3️⃣ How much is “printed” each year (inflation)?
BABY has annual inflation of 5.5%. To compare it with Colombia, my country, we have inflation of 6.14%, so you get an idea. What this means is that every year more new tokens are created, and if demand doesn’t grow at the same pace, the value of each individual token gets diluted.
The real lesson (applies to any project, not just BABY):
Before investing in any project, we need to understand how it works. That way we can tell whether it’s suitable for us, our risk tolerance, and our level of knowledge—and we should never act just because other people mention it and are getting in. FOMO is fueled by a lack of information, dear community.
To wrap up, keep in mind that when the campaign ends, according to the patterns in this kind of events, once thousands of users start receiving their tokens as rewards, we may see selling pressure in the first few hours.
⚠️ This is educational content, not financial advice or a buy recommendation. DYOR always.
#Babylon $BABY #BinanceSquare #Tokenomics #dyor #baby
Hello community,
With this Baby campaign I got motivated to read about the project in the Tokenomics and I found something that might interest you, and it’s useful to know.
I’ll share three little things I found so you know before getting into this one and any project:
1️⃣ How much goes to “insiders” (team + investors + advisors)?
In BABY, that adds up to 49% of the total supply (30.5% investors + 15% team + 3.5% advisors). That seems high to me compared to other projects, although the good thing is they don’t receive that 49% all at once—let me tell you more in the second point.
2️⃣ Is it locked or already circulating?
There’s something called “vesting,” which means they don’t get everything at once; they’re delivered little by little every month over 3 years (36 months, until 2029). In other words, it starts unlocking in May 2026 and runs through April 2029. It’s a pretty reasonable timeline, in my opinion—what do you think?
3️⃣ How much is “printed” each year (inflation)?
BABY has annual inflation of 5.5%. To compare it with Colombia, my country, we have inflation of 6.14%, so you get an idea. What this means is that every year more new tokens are created, and if demand doesn’t grow at the same pace, the value of each individual token gets diluted.
The real lesson (applies to any project, not just BABY):
Before investing in any project, we need to understand how it works. That way we can tell whether it’s suitable for us, our risk tolerance, and our level of knowledge—and we should never act just because other people mention it and are getting in. FOMO is fueled by a lack of information, dear community.
To wrap up, keep in mind that when the campaign ends, according to the patterns in this kind of events, once thousands of users start receiving their tokens as rewards, we may see selling pressure in the first few hours.
⚠️ This is educational content, not financial advice or a buy recommendation. DYOR always.
#Babylon $BABY #BinanceSquare #Tokenomics #dyor #baby
With this Baby campaign I got motivated to read about the project in the Tokenomics and I found something that might interest you, and it’s useful to know.
I’ll share three little things I found so you know before getting into this one and any project:
1️⃣ How much goes to “insiders” (team + investors + advisors)?
In BABY, that adds up to 49% of the total supply (30.5% investors + 15% team + 3.5% advisors). That seems high to me compared to other projects, although the good thing is they don’t receive that 49% all at once—let me tell you more in the second point.
2️⃣ Is it locked or already circulating?
There’s something called “vesting,” which means they don’t get everything at once; they’re delivered little by little every month over 3 years (36 months, until 2029). In other words, it starts unlocking in May 2026 and runs through April 2029. It’s a pretty reasonable timeline, in my opinion—what do you think?
3️⃣ How much is “printed” each year (inflation)?
BABY has annual inflation of 5.5%. To compare it with Colombia, my country, we have inflation of 6.14%, so you get an idea. What this means is that every year more new tokens are created, and if demand doesn’t grow at the same pace, the value of each individual token gets diluted.
The real lesson (applies to any project, not just BABY):
Before investing in any project, we need to understand how it works. That way we can tell whether it’s suitable for us, our risk tolerance, and our level of knowledge—and we should never act just because other people mention it and are getting in. FOMO is fueled by a lack of information, dear community.
To wrap up, keep in mind that when the campaign ends, according to the patterns in this kind of events, once thousands of users start receiving their tokens as rewards, we may see selling pressure in the first few hours.
⚠️ This is educational content, not financial advice or a buy recommendation. DYOR always.
#Babylon $BABY #BinanceSquare #Tokenomics #dyor #baby
158
DASH — Liquidity-based analysis (not hunches)
Recently we talked about how to read a liquidation map.
Now we apply it to a real case.
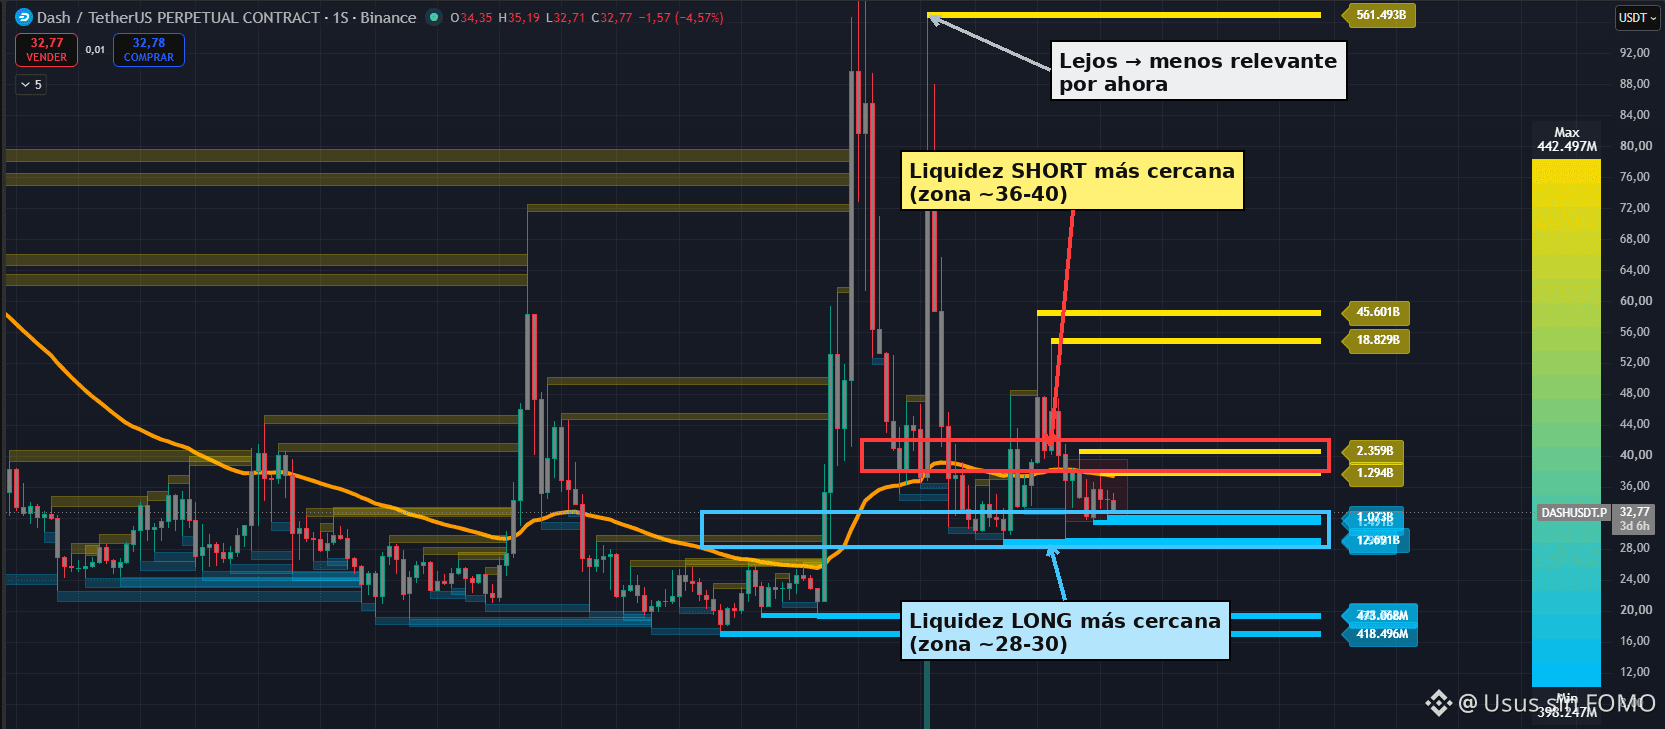
📊 Current price: Around $32.9
🟡 Nearest SHORT liquidity (above, ~36-40): clusters of 2.359B + 1.294B
🔵 Nearest LONG liquidity (below, ~28-30): clusters of 1.973B + 1.269B
Both sides are at a similar distance and about the same size (~3.65B above vs ~3.2B below). Neither clearly dominates on its own.
🧭 Extra data: the 55 EMA is right in that same ~36-38 area, and the price already bounced there before. This does NOT tell you when—or if—the price will return. It only means that, IF the price gets there again, there are two different reasons (liquidity + prior technical bounce) pointing to the same spot, not just one. That makes this zone more important to watch.
⚠️ Caution: there are much larger clusters (561B, 45B, 18B) in zones ~55-92, far away from the current price. By the golden rule, they weigh less right now—the price would have to “travel” too much to reach them.
👇 With this on the table, what does the community think?
🗳️ Poll: Where will DASH likely go first?
🔼 Look for the upper zone (~36-40)
🔽 Look for the lower long liquidity (~28-30)
🤔 Trade sideways more before deciding
Tell me your reasoning in the comments—not just your vote 🧠
⚠️ Disclaimer: Educational and informational content only, not financial advice or a buy/sell recommendation. There’s no guarantee the scenario will play out. DYOR and manage your risk.
#CryptoEducation💡🚀 #AnalisisTecnico #liquidaciones $DASH
DASH — Liquidity-based analysis (not hunches)
Recently we talked about how to read a liquidation map.
Now we apply it to a real case.
📊 Current price: Around $32.9
🟡 Nearest SHORT liquidity (above, ~36-40): clusters of 2.359B + 1.294B
🔵 Nearest LONG liquidity (below, ~28-30): clusters of 1.973B + 1.269B
Both sides are at a similar distance and about the same size (~3.65B above vs ~3.2B below). Neither clearly dominates on its own.
🧭 Extra data: the 55 EMA is right in that same ~36-38 area, and the price already bounced there before. This does NOT tell you when—or if—the price will return. It only means that, IF the price gets there again, there are two different reasons (liquidity + prior technical bounce) pointing to the same spot, not just one. That makes this zone more important to watch.
⚠️ Caution: there are much larger clusters (561B, 45B, 18B) in zones ~55-92, far away from the current price. By the golden rule, they weigh less right now—the price would have to “travel” too much to reach them.
👇 With this on the table, what does the community think?
🗳️ Poll: Where will DASH likely go first?
🔼 Look for the upper zone (~36-40)
🔽 Look for the lower long liquidity (~28-30)
🤔 Trade sideways more before deciding
Tell me your reasoning in the comments—not just your vote 🧠
⚠️ Disclaimer: Educational and informational content only, not financial advice or a buy/sell recommendation. There’s no guarantee the scenario will play out. DYOR and manage your risk.
#CryptoEducation💡🚀 #AnalisisTecnico #liquidaciones $DASH
Recently we talked about how to read a liquidation map.
Now we apply it to a real case.
📊 Current price: Around $32.9
🟡 Nearest SHORT liquidity (above, ~36-40): clusters of 2.359B + 1.294B
🔵 Nearest LONG liquidity (below, ~28-30): clusters of 1.973B + 1.269B
Both sides are at a similar distance and about the same size (~3.65B above vs ~3.2B below). Neither clearly dominates on its own.
🧭 Extra data: the 55 EMA is right in that same ~36-38 area, and the price already bounced there before. This does NOT tell you when—or if—the price will return. It only means that, IF the price gets there again, there are two different reasons (liquidity + prior technical bounce) pointing to the same spot, not just one. That makes this zone more important to watch.
⚠️ Caution: there are much larger clusters (561B, 45B, 18B) in zones ~55-92, far away from the current price. By the golden rule, they weigh less right now—the price would have to “travel” too much to reach them.
👇 With this on the table, what does the community think?
🗳️ Poll: Where will DASH likely go first?
🔼 Look for the upper zone (~36-40)
🔽 Look for the lower long liquidity (~28-30)
🤔 Trade sideways more before deciding
Tell me your reasoning in the comments—not just your vote 🧠
⚠️ Disclaimer: Educational and informational content only, not financial advice or a buy/sell recommendation. There’s no guarantee the scenario will play out. DYOR and manage your risk.
#CryptoEducation💡🚀 #AnalisisTecnico #liquidaciones $DASH
1
104
Liquidity explained for dummies: This is how I read a liquidation map before trading.
Hi community 👋
That long, violent spike you see on the chart is almost never a coincidence—there’s almost always leveraged money behind it.
🧠 What is a leveraged position?
You have $100, but the exchange lends you money so you can trade as if you had $1,000+. If the price moves against you, you lose your margin and the position closes automatically: that’s a liquidation.
⚖️ Who’s on each side?
Long = bet that it will go up → it gets liquidated if it falls.
Short = bet that it will go down → it gets liquidated if it rises.
🗺️ How to read the map
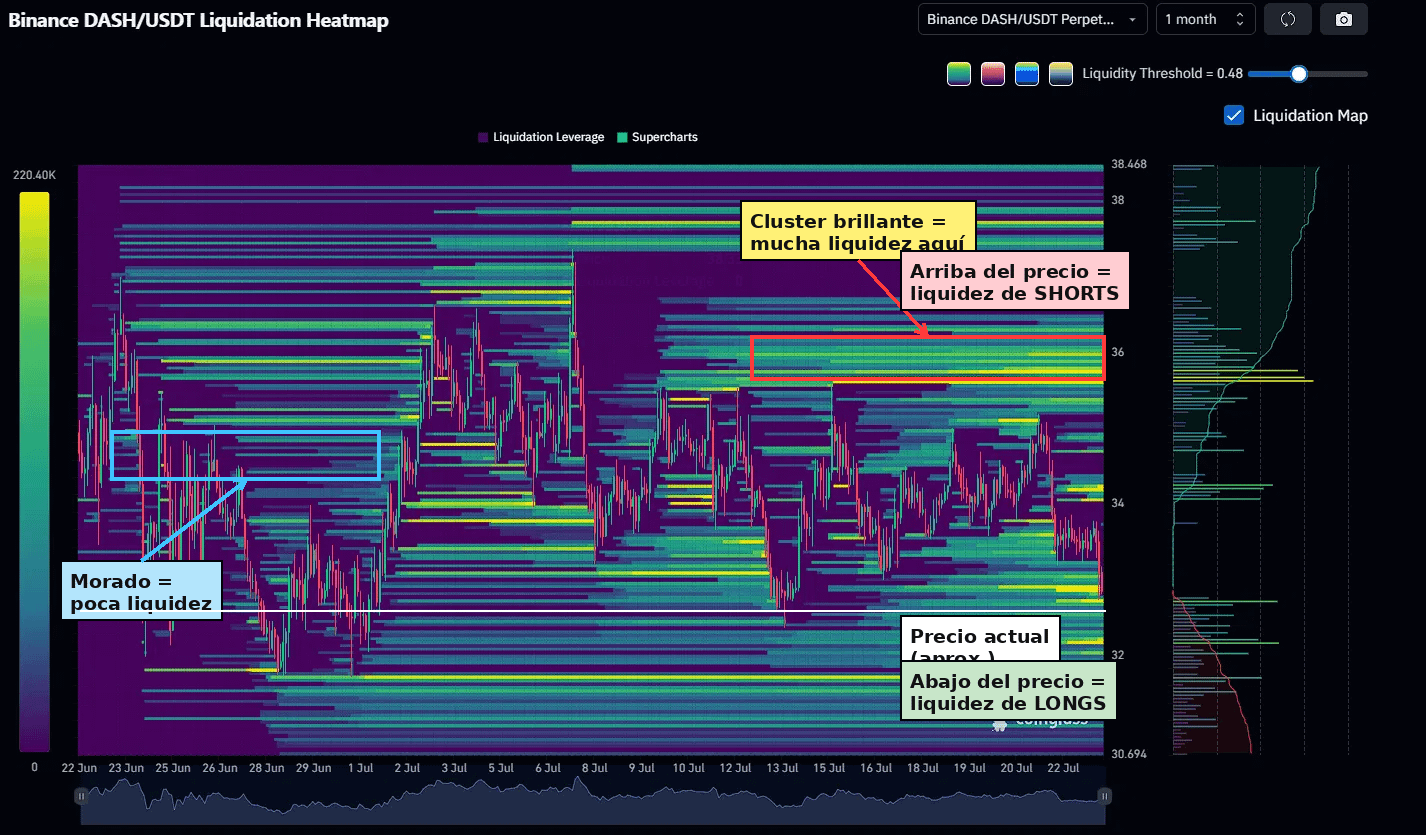
The color indicates INTENSITY, not direction: purple = low liquidity, and the brighter it is (green/yellow), the more leveraged money is ready to be liquidated there.
The direction is given by the position relative to the price:
🔼 ABOVE the price = shorts. If it rises and touches them, they get liquidated by buying all at once → it pushes the price higher.
🔽 BELOW the price = longs. If it drops and touches them, they get liquidated by selling all at once → it pushes the price lower.
🎯 The golden rule
A very bright cluster far away matters less than a smaller one that’s close. The price has to “travel” to reach it.
That’s how I compare:
I locate the brightest clusters above and below the price. I see how far each one is (% distance). I compare only similar distances to each other. The side with more brightness closer by is often the magnet for the next move.
💡 Applied to a real chart:
Look for the bright, nearby cluster above (fuel to go up) and the one below (to go down). The closest one is usually the direction the price “gravitates” toward—and when it hits, it often reverses.
⚠️ This is not a magic formula or a guarantee of movement—it’s a map of accumulated risk, not a safe prediction.
👇 Have you known about liquidation maps already? Tell me in the comments.
⚠️ Disclaimer: Educational content. Not financial advice or a guarantee of results. DYOR and manage your risk.
#CryptoEducation💡🚀 #AnalisisTecnico #liquidaciones es #dyor
Liquidity explained for dummies: This is how I read a liquidation map before trading.
Hi community 👋
That long, violent spike you see on the chart is almost never a coincidence—there’s almost always leveraged money behind it.
🧠 What is a leveraged position?
You have $100, but the exchange lends you money so you can trade as if you had $1,000+. If the price moves against you, you lose your margin and the position closes automatically: that’s a liquidation.
⚖️ Who’s on each side?
Long = bet that it will go up → it gets liquidated if it falls.
Short = bet that it will go down → it gets liquidated if it rises.
🗺️ How to read the map
The color indicates INTENSITY, not direction: purple = low liquidity, and the brighter it is (green/yellow), the more leveraged money is ready to be liquidated there.
The direction is given by the position relative to the price:
🔼 ABOVE the price = shorts. If it rises and touches them, they get liquidated by buying all at once → it pushes the price higher.
🔽 BELOW the price = longs. If it drops and touches them, they get liquidated by selling all at once → it pushes the price lower.
🎯 The golden rule
A very bright cluster far away matters less than a smaller one that’s close. The price has to “travel” to reach it.
That’s how I compare:
I locate the brightest clusters above and below the price. I see how far each one is (% distance). I compare only similar distances to each other. The side with more brightness closer by is often the magnet for the next move.
💡 Applied to a real chart:
Look for the bright, nearby cluster above (fuel to go up) and the one below (to go down). The closest one is usually the direction the price “gravitates” toward—and when it hits, it often reverses.
⚠️ This is not a magic formula or a guarantee of movement—it’s a map of accumulated risk, not a safe prediction.
👇 Have you known about liquidation maps already? Tell me in the comments.
⚠️ Disclaimer: Educational content. Not financial advice or a guarantee of results. DYOR and manage your risk.
#CryptoEducation💡🚀 #AnalisisTecnico #liquidaciones es #dyor
Hi community 👋
That long, violent spike you see on the chart is almost never a coincidence—there’s almost always leveraged money behind it.
🧠 What is a leveraged position?
You have $100, but the exchange lends you money so you can trade as if you had $1,000+. If the price moves against you, you lose your margin and the position closes automatically: that’s a liquidation.
⚖️ Who’s on each side?
Long = bet that it will go up → it gets liquidated if it falls.
Short = bet that it will go down → it gets liquidated if it rises.
🗺️ How to read the map
The color indicates INTENSITY, not direction: purple = low liquidity, and the brighter it is (green/yellow), the more leveraged money is ready to be liquidated there.
The direction is given by the position relative to the price:
🔼 ABOVE the price = shorts. If it rises and touches them, they get liquidated by buying all at once → it pushes the price higher.
🔽 BELOW the price = longs. If it drops and touches them, they get liquidated by selling all at once → it pushes the price lower.
🎯 The golden rule
A very bright cluster far away matters less than a smaller one that’s close. The price has to “travel” to reach it.
That’s how I compare:
I locate the brightest clusters above and below the price. I see how far each one is (% distance). I compare only similar distances to each other. The side with more brightness closer by is often the magnet for the next move.
💡 Applied to a real chart:
Look for the bright, nearby cluster above (fuel to go up) and the one below (to go down). The closest one is usually the direction the price “gravitates” toward—and when it hits, it often reverses.
⚠️ This is not a magic formula or a guarantee of movement—it’s a map of accumulated risk, not a safe prediction.
👇 Have you known about liquidation maps already? Tell me in the comments.
⚠️ Disclaimer: Educational content. Not financial advice or a guarantee of results. DYOR and manage your risk.
#CryptoEducation💡🚀 #AnalisisTecnico #liquidaciones es #dyor
1
734
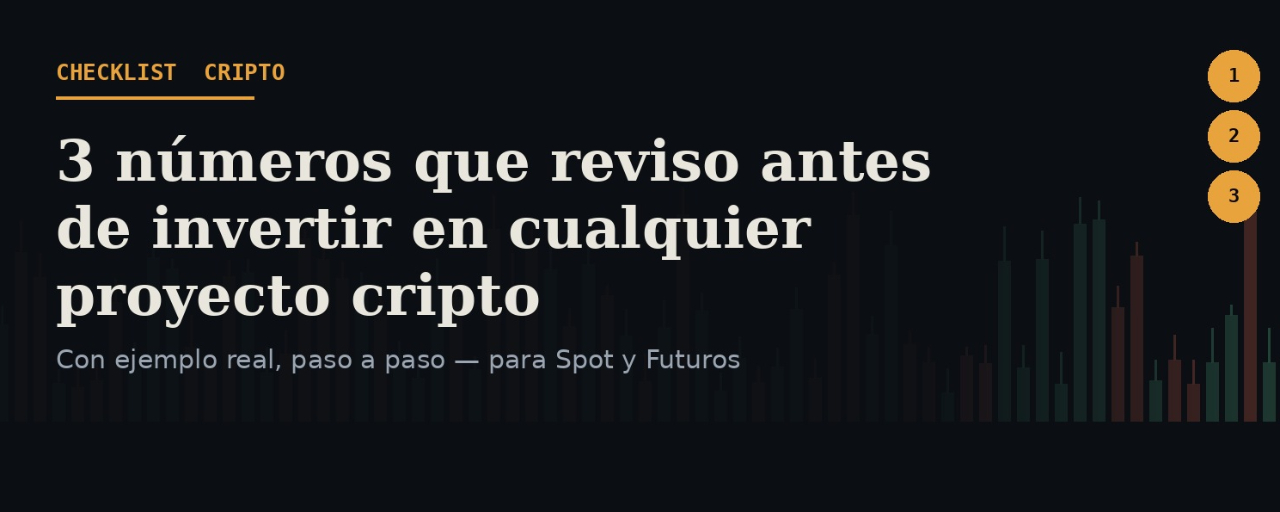
Article
3 numbers I check before investing in any crypto project🔍 I used to get burned for not checking this. Now it’s the first thing I look at before putting even a single dollar into a project
Hello community 👋
I started like everyone else: seeing a green candle and entering out of FOMO. Over time I understood that, whether you trade Spot or Futures, there are 3 numbers that give you a much clearer picture than "it looks like it’s going to go up." You see them directly on Binance (search the coin → statistics/market data tab), and I’ll show you how I combine them.
📊 Example with reference numbers (fictional project "XYZ"):
3 numbers I check before investing in any crypto project
🔍 I used to get burned for not checking this. Now it’s the first thing I look at before putting even a single dollar into a project
Hello community 👋
I started like everyone else: seeing a green candle and entering out of FOMO. Over time I understood that, whether you trade Spot or Futures, there are 3 numbers that give you a much clearer picture than "it looks like it’s going to go up." You see them directly on Binance (search the coin → statistics/market data tab), and I’ll show you how I combine them.
📊 Example with reference numbers (fictional project "XYZ"):
Hello community 👋
I started like everyone else: seeing a green candle and entering out of FOMO. Over time I understood that, whether you trade Spot or Futures, there are 3 numbers that give you a much clearer picture than "it looks like it’s going to go up." You see them directly on Binance (search the coin → statistics/market data tab), and I’ll show you how I combine them.
📊 Example with reference numbers (fictional project "XYZ"):
1
128
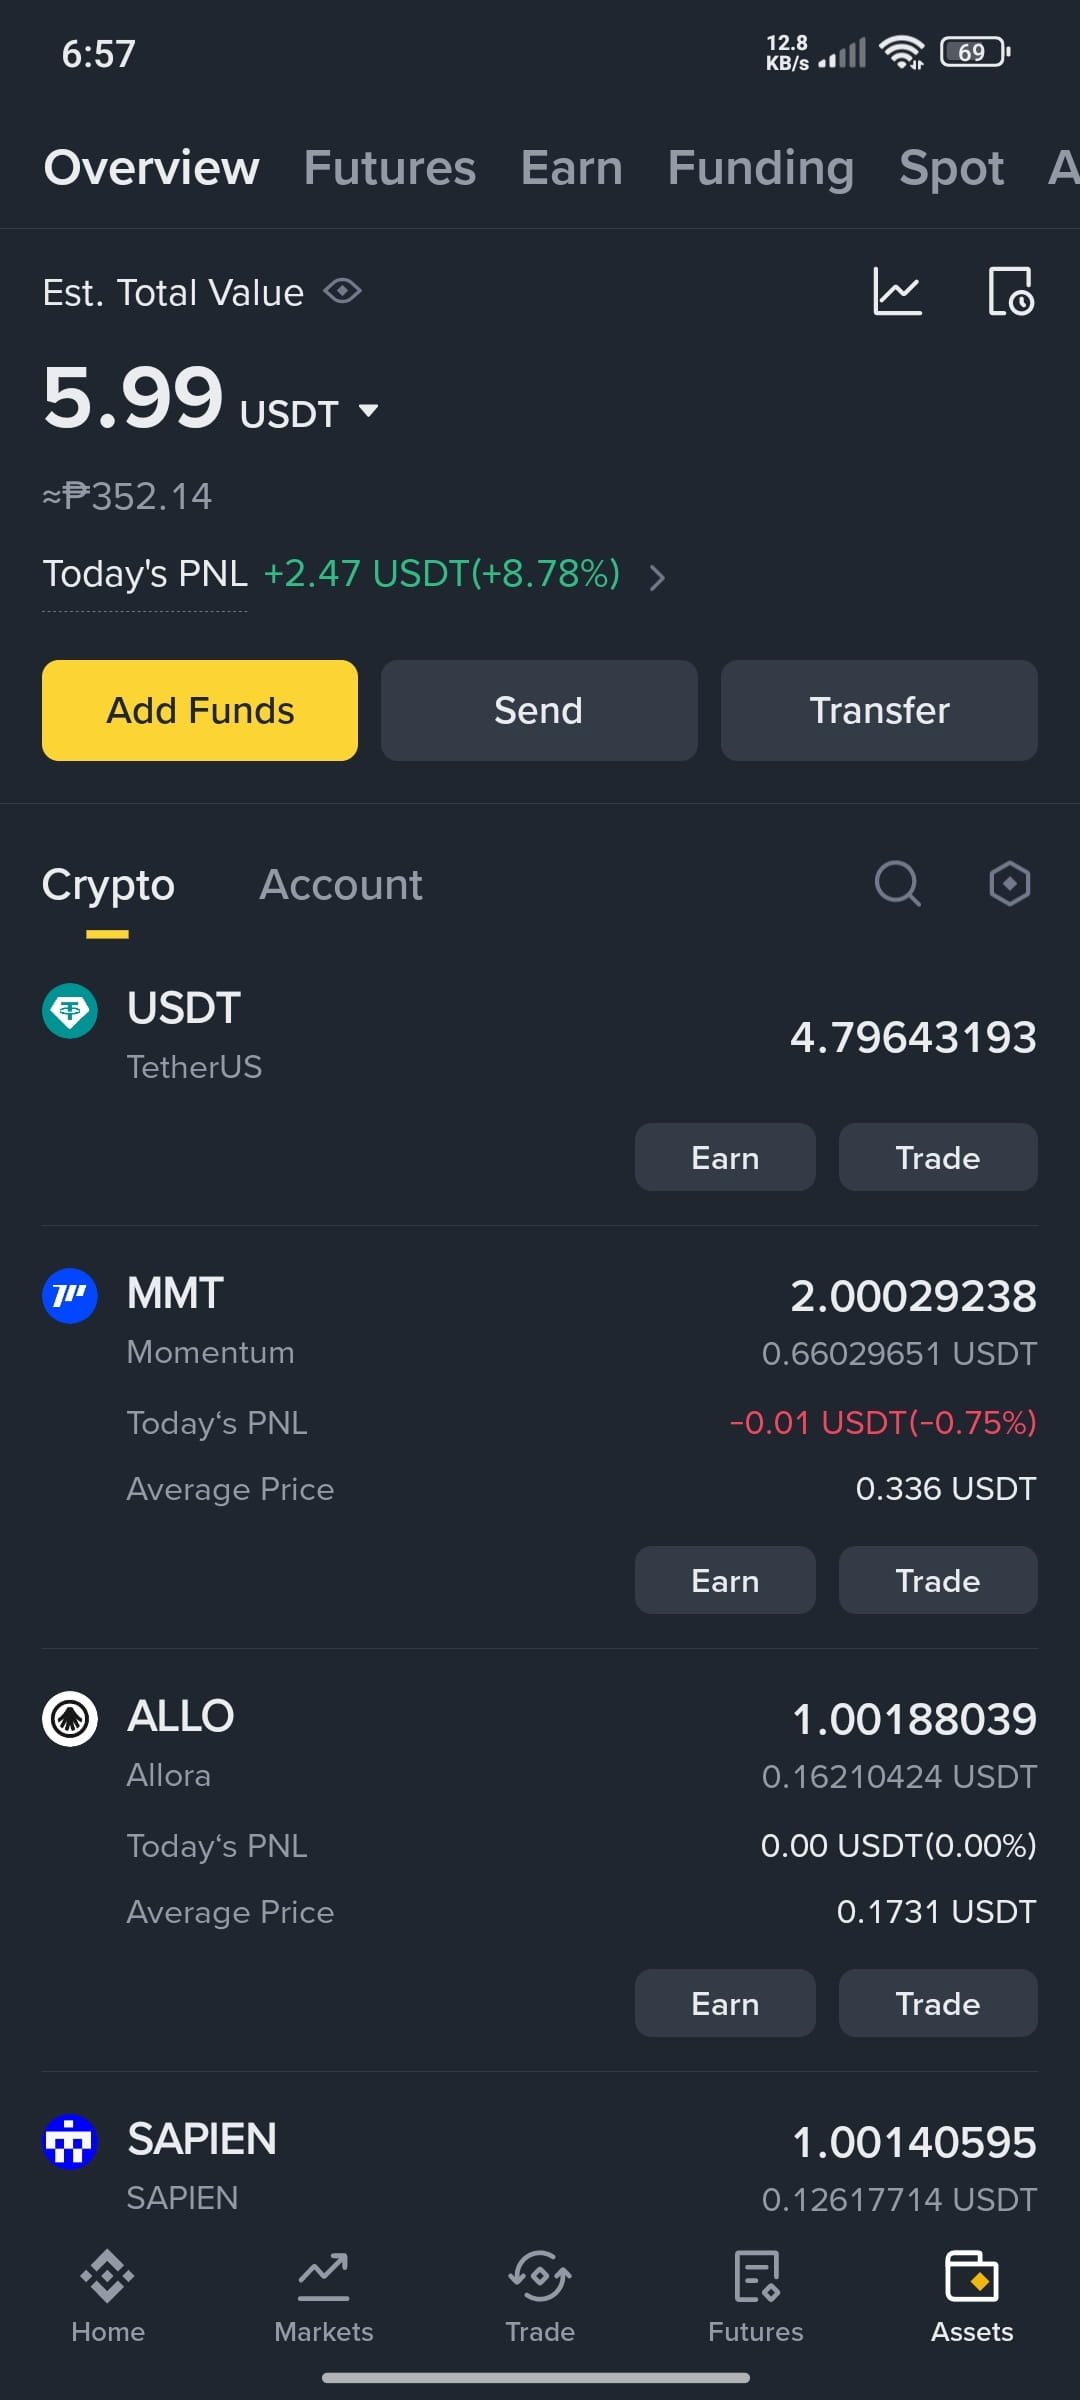
I wish it were as easy as that, friend. There are no magical tricks. Just like today you have $5, tomorrow you could have $3 or $10, hahaha. You just have to keep persevering, but there’s no magic trick
I wish it were as easy as that, friend. There are no magical tricks. Just like today you have $5, tomorrow you could have $3 or $10, hahaha. You just have to keep persevering, but there’s no magic trick

Carlos Becera Carvajal
·
--
“How can I grow this to 10,000 dollars, guys?”🥺
22
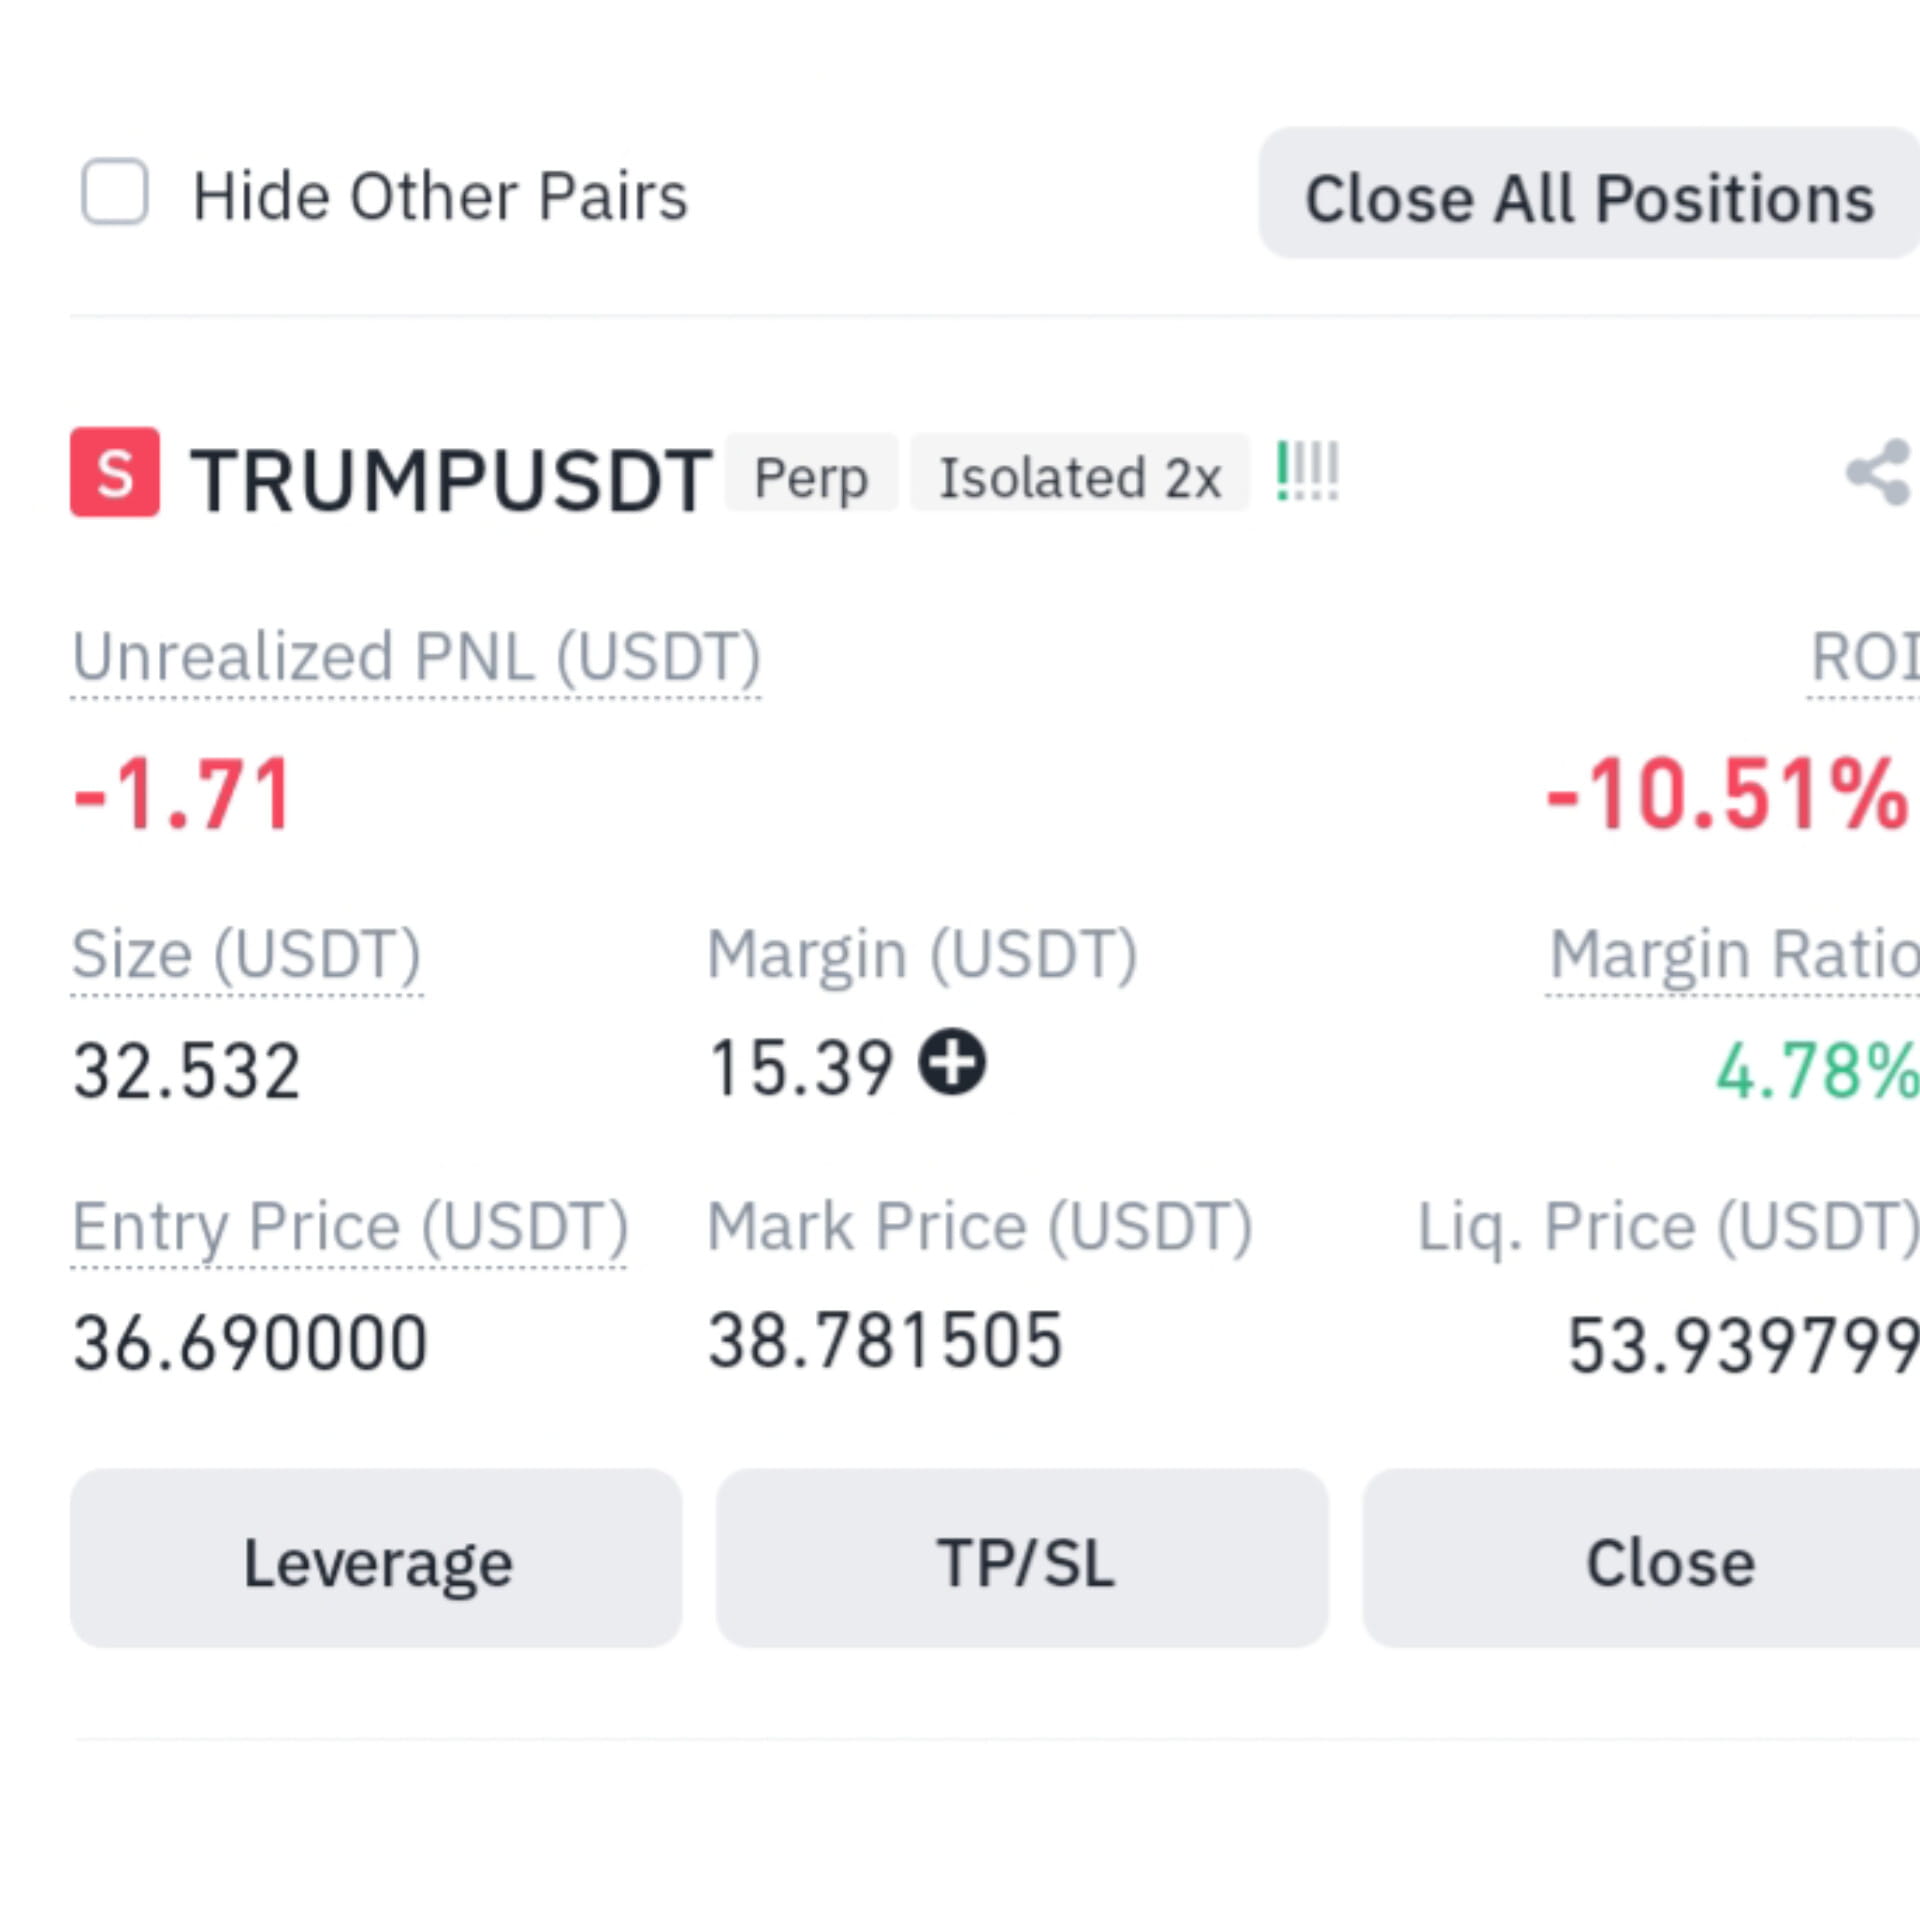
If you enter at the lower end of the range in short and at the upper end in long, this will happen, stop betting
If you enter at the lower end of the range in short and at the upper end in long, this will happen, stop betting

Cr Villa
·
--
I don't understand, every trade I take ends in a loss.
7
68
Log in to explore more content
Join global crypto users on Binance Square
⚡️ Get latest and useful information about crypto.
💬 Trusted by the world’s largest crypto exchange.
👍 Discover real insights from verified creators.
Email / Phone number
Trending Topics
EtherGains70.9%InQ3
140,658 views
1,107 Discussing
One of the best third quarters in history 💰
September closed out last night, and with it, the quarter. For the quarter, BTC is up 42%—the second-best Q3 on record. ETH had a record-breaking Q3 overall, up 70%.
Looking at the chart, things are still looking good: we’re holding support, but we’re testing it more and more often. Plus, ETF momentum is weakening — inflows are gradually declining, and yesterday saw outflows for the first time in a long while.
Yes, historically, October has been a good month for crypto — it’s not called “Uptober” for nothing. But it’s also one of the most volatile months. Last year, for example, we managed to hit a new all-time high (ATH) and experience a flash crash.
🚀 High Accuracy Trades.
$BTC
$ETH
$SOL
#EtherGains70.9%InQ3 #DollarIndexHitsHighestSinceMay2025 #CFTCSubmitsTwoEventContractRulesToWhiteHouse #MicronBeatsEarningsLiftsGuidance
Knowledge is Power
·0 Likes
·226 views
TreasuryLetsStatesFileStablecoinCertificationsEarly
7,357 views
78 Discussing
US10YearYieldNears5.3%
144,891 views
1,109 Discussing