
Thebitcoin537
1k Posts

Thebitcoin537
Report
Block User
We post more trades - Twitter @Thebitcoin537
0 Following
787 Followers
1.3K+ Liked
Posts
All
Quotes
Videos
PINNED
·
--
Bullish
$PENGU
{future}(PENGUUSDT)
tp hit
$PENGU
tp hit
tp hit
Thebitcoin537
·
--
Bullish$PENGU
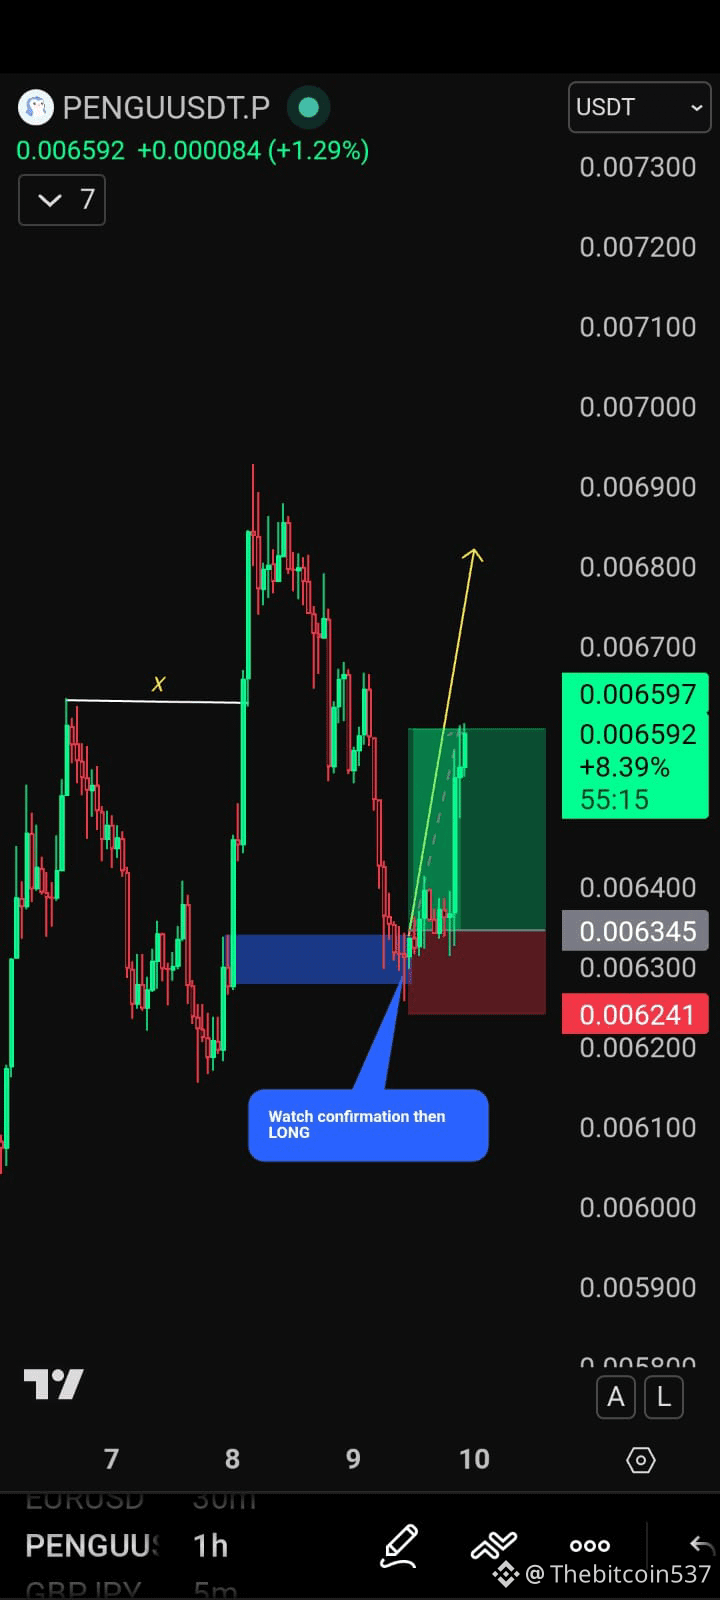
PENGUUSDT – 1H Update
Price tapping demand after pullback.
Watching demand / POI (≈0.00620–0.00635) 🔵
🔎 Plan:
• Wait for confirmation at zone
• Look for bullish reaction
• If holds → move toward 0.00680+
#pengu #thebitcoin537
PENGUUSDT – 1H Update
Price tapping demand after pullback.
Watching demand / POI (≈0.00620–0.00635) 🔵
🔎 Plan:
• Wait for confirmation at zone
• Look for bullish reaction
• If holds → move toward 0.00680+
#pengu #thebitcoin537
137
·
--
Bullish
$ZEC
{future}(ZECUSDT)
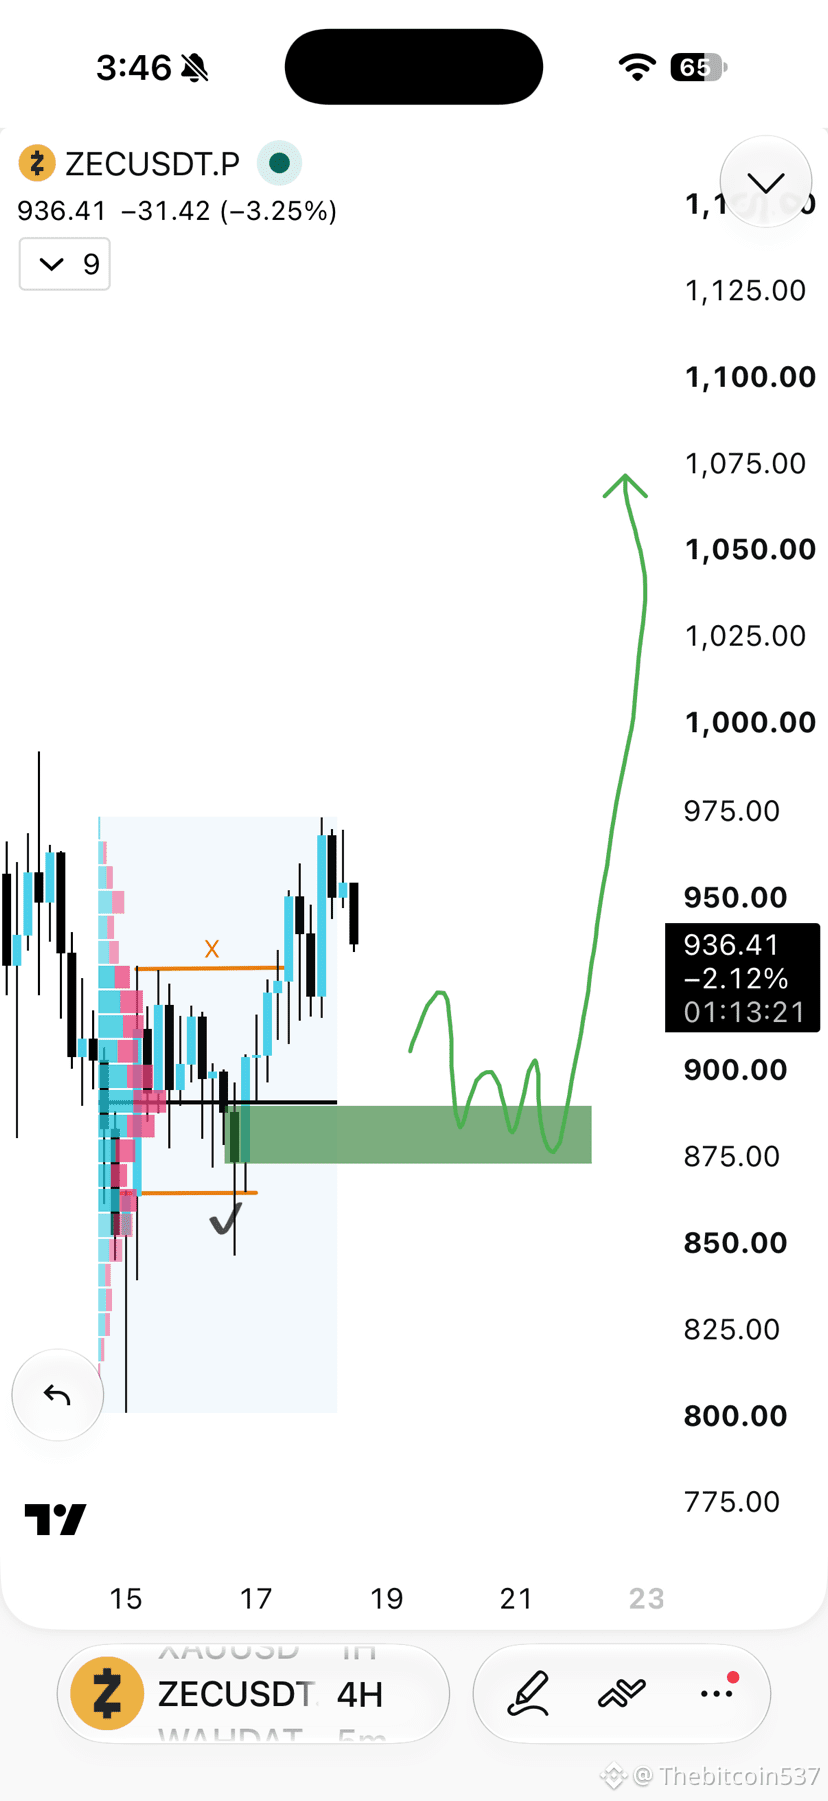
Swing Trade plan for $ZEC
Below POC of volume profile is also a OB (Without FVG), plan is simple if we candle sweep below POC and closes back above then it will be a confirmation for swing LONG SL below the swing Low and target highs.
$ZEC
Swing Trade plan for $ZEC
Below POC of volume profile is also a OB (Without FVG), plan is simple if we candle sweep below POC and closes back above then it will be a confirmation for swing LONG SL below the swing Low and target highs.
Swing Trade plan for $ZEC
Below POC of volume profile is also a OB (Without FVG), plan is simple if we candle sweep below POC and closes back above then it will be a confirmation for swing LONG SL below the swing Low and target highs.
1
1
914
$BTC
{future}(BTCUSDT)
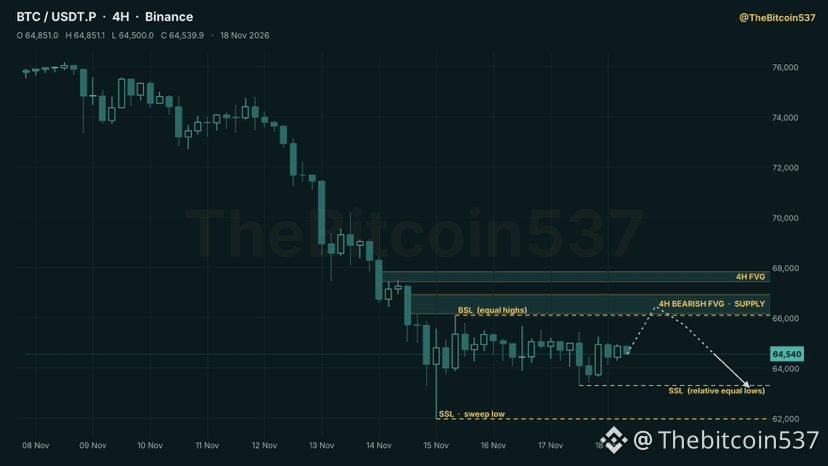
📊 CRYPTO MARKET UPDATE — 18 Nov
🔻 BTC crashed through $70K. Now basing in the low $60Ks.
🟠 BTC — $64,680
Since our last update ($74,271 on 9 Nov), BTC fell another 17%.
→ 12 Nov: lost the $72,400–73,300 support
→ 13–14 Nov: two heavy red days (−4.4%, −6.1%) on the biggest volume of this whole move
→ 15 Nov: flushed to $61,956, then closed green at $65,310 with a long wick below
For three days since, it's been stuck between $63,300 and $65,700.
Down 22% in 30 days. Six red weeks in a row.
❓ Why:
→ Hot US inflation revived fears of a December rate hike
→ Reports about Nvidia's leadership hit tech stocks
→ But BTC fell far more than stocks — the real damage was leverage. Open interest dropped 19% and nearly $1B of longs got liquidated
→ Spot BTC ETFs kept bleeding: −$765M over five days
📏 Levels:
→ Resistance: $65,500–65,700, then $67,250 (top of the summer range)
→ Support: $63,300, then the $61,956 low
→ Below that: $58,000 — the June–August lows
The weekly gap we flagged on 9 Nov (down to the mid-$60Ks) is now filled.
🔷 ETH — $1,814 🔻
Lost $2,000. Low $1,710. Now basing between $1,750 and $1,866.
💵 USDT Dominance — 8.04% 🔺
Broke above 8% for the first time (peak 8.39%). Flat for four days — panic has stopped rising, but money hasn't come back.
👑 BTC Dominance — 59.6% 🔻
Slipped under 60%. Alts are no longer falling faster than BTC.
🪙 Altcoins (TOTAL3) — $658B
Low $631B. Up about 4% from the bottom.
📌 Bottom line:
This was a leverage flush — the kind that often marks a short-term low. The long-wick close on 15 Nov and three quiet days since support that.
But every higher timeframe is still in a downtrend.
👉 Reclaim $65,700 = relief bounce toward $67,250.
Lose $61,956 = next stop $58,000.
No catching knives — let a bottom prove itself first.
$BTC
📊 CRYPTO MARKET UPDATE — 18 Nov
🔻 BTC crashed through $70K. Now basing in the low $60Ks.
🟠 BTC — $64,680
Since our last update ($74,271 on 9 Nov), BTC fell another 17%.
→ 12 Nov: lost the $72,400–73,300 support
→ 13–14 Nov: two heavy red days (−4.4%, −6.1%) on the biggest volume of this whole move
→ 15 Nov: flushed to $61,956, then closed green at $65,310 with a long wick below
For three days since, it's been stuck between $63,300 and $65,700.
Down 22% in 30 days. Six red weeks in a row.
❓ Why:
→ Hot US inflation revived fears of a December rate hike
→ Reports about Nvidia's leadership hit tech stocks
→ But BTC fell far more than stocks — the real damage was leverage. Open interest dropped 19% and nearly $1B of longs got liquidated
→ Spot BTC ETFs kept bleeding: −$765M over five days
📏 Levels:
→ Resistance: $65,500–65,700, then $67,250 (top of the summer range)
→ Support: $63,300, then the $61,956 low
→ Below that: $58,000 — the June–August lows
The weekly gap we flagged on 9 Nov (down to the mid-$60Ks) is now filled.
🔷 ETH — $1,814 🔻
Lost $2,000. Low $1,710. Now basing between $1,750 and $1,866.
💵 USDT Dominance — 8.04% 🔺
Broke above 8% for the first time (peak 8.39%). Flat for four days — panic has stopped rising, but money hasn't come back.
👑 BTC Dominance — 59.6% 🔻
Slipped under 60%. Alts are no longer falling faster than BTC.
🪙 Altcoins (TOTAL3) — $658B
Low $631B. Up about 4% from the bottom.
📌 Bottom line:
This was a leverage flush — the kind that often marks a short-term low. The long-wick close on 15 Nov and three quiet days since support that.
But every higher timeframe is still in a downtrend.
👉 Reclaim $65,700 = relief bounce toward $67,250.
Lose $61,956 = next stop $58,000.
No catching knives — let a bottom prove itself first.
📊 CRYPTO MARKET UPDATE — 18 Nov
🔻 BTC crashed through $70K. Now basing in the low $60Ks.
🟠 BTC — $64,680
Since our last update ($74,271 on 9 Nov), BTC fell another 17%.
→ 12 Nov: lost the $72,400–73,300 support
→ 13–14 Nov: two heavy red days (−4.4%, −6.1%) on the biggest volume of this whole move
→ 15 Nov: flushed to $61,956, then closed green at $65,310 with a long wick below
For three days since, it's been stuck between $63,300 and $65,700.
Down 22% in 30 days. Six red weeks in a row.
❓ Why:
→ Hot US inflation revived fears of a December rate hike
→ Reports about Nvidia's leadership hit tech stocks
→ But BTC fell far more than stocks — the real damage was leverage. Open interest dropped 19% and nearly $1B of longs got liquidated
→ Spot BTC ETFs kept bleeding: −$765M over five days
📏 Levels:
→ Resistance: $65,500–65,700, then $67,250 (top of the summer range)
→ Support: $63,300, then the $61,956 low
→ Below that: $58,000 — the June–August lows
The weekly gap we flagged on 9 Nov (down to the mid-$60Ks) is now filled.
🔷 ETH — $1,814 🔻
Lost $2,000. Low $1,710. Now basing between $1,750 and $1,866.
💵 USDT Dominance — 8.04% 🔺
Broke above 8% for the first time (peak 8.39%). Flat for four days — panic has stopped rising, but money hasn't come back.
👑 BTC Dominance — 59.6% 🔻
Slipped under 60%. Alts are no longer falling faster than BTC.
🪙 Altcoins (TOTAL3) — $658B
Low $631B. Up about 4% from the bottom.
📌 Bottom line:
This was a leverage flush — the kind that often marks a short-term low. The long-wick close on 15 Nov and three quiet days since support that.
But every higher timeframe is still in a downtrend.
👉 Reclaim $65,700 = relief bounce toward $67,250.
Lose $61,956 = next stop $58,000.
No catching knives — let a bottom prove itself first.
183
·
--
Bullish
$BTC
{future}(BTCUSDT)
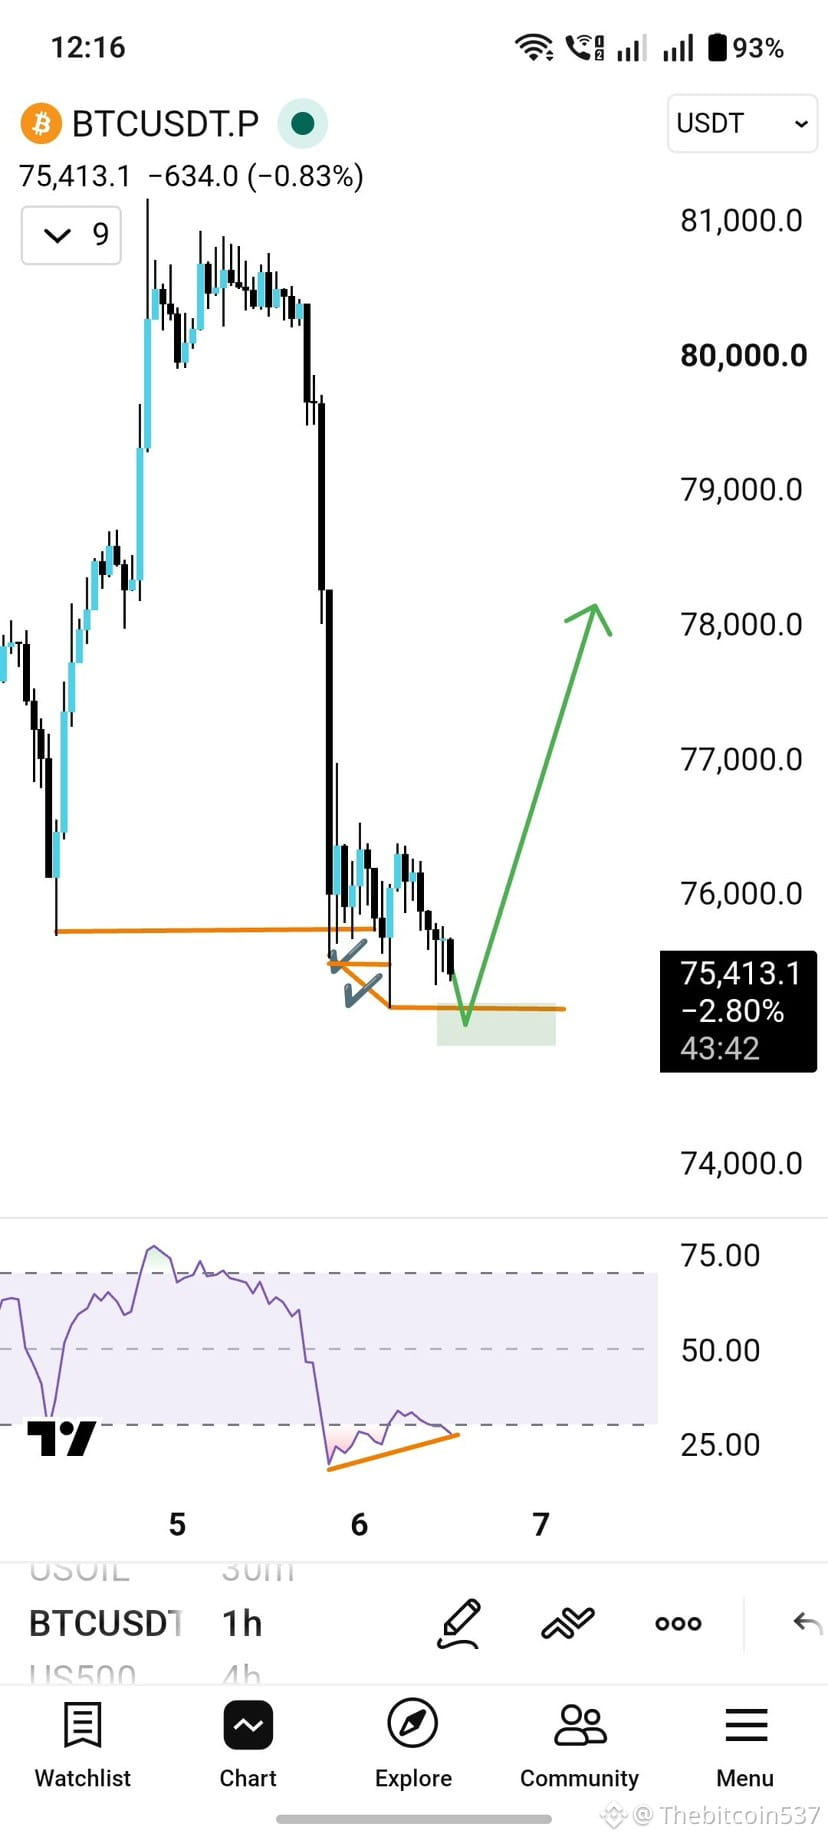
$BTC 📈 Trade plan, if it exactly follows this plan.
Plan: Timeframe is 1h, price is trying to form bullish divergence with RSI, but it's not clear. We need a third sweep of the low that I have marked and, most importantly, close back inside. RSI stays above (forms Lower High), then it will be perfect momentum for a Long for a day trade and even swing trade... 🚀
#StrategySTRCResumesIssuanceAfterOver170Days
$BTC
$BTC 📈 Trade plan, if it exactly follows this plan.
Plan: Timeframe is 1h, price is trying to form bullish divergence with RSI, but it's not clear. We need a third sweep of the low that I have marked and, most importantly, close back inside. RSI stays above (forms Lower High), then it will be perfect momentum for a Long for a day trade and even swing trade... 🚀
#StrategySTRCResumesIssuanceAfterOver170Days
$BTC 📈 Trade plan, if it exactly follows this plan.
Plan: Timeframe is 1h, price is trying to form bullish divergence with RSI, but it's not clear. We need a third sweep of the low that I have marked and, most importantly, close back inside. RSI stays above (forms Lower High), then it will be perfect momentum for a Long for a day trade and even swing trade... 🚀
#StrategySTRCResumesIssuanceAfterOver170Days
254
·
--
Bullish
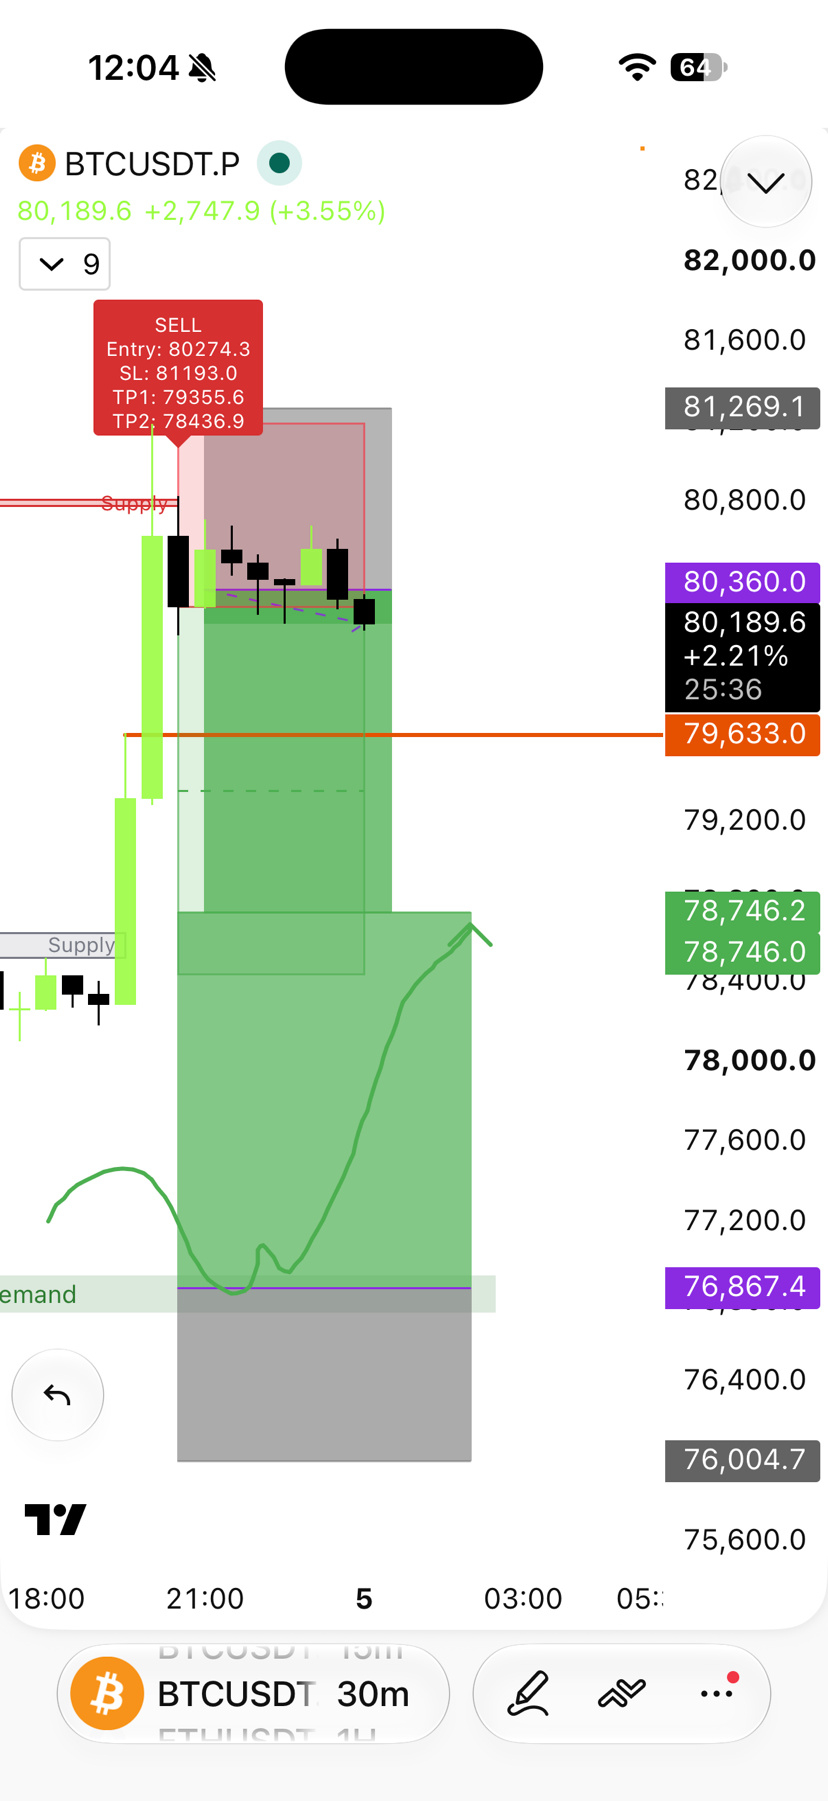
$BTC short full TP and BTC long filled. Follow for more
$BTC short full TP and BTC long filled. Follow for more
Thebitcoin537
·
--
Bearish$BTC
Short now and long below.
#BTCRebounds80K
Short now and long below.
#BTCRebounds80K
138
·
--
Bullish
$BTC
{future}(BTCUSDT)
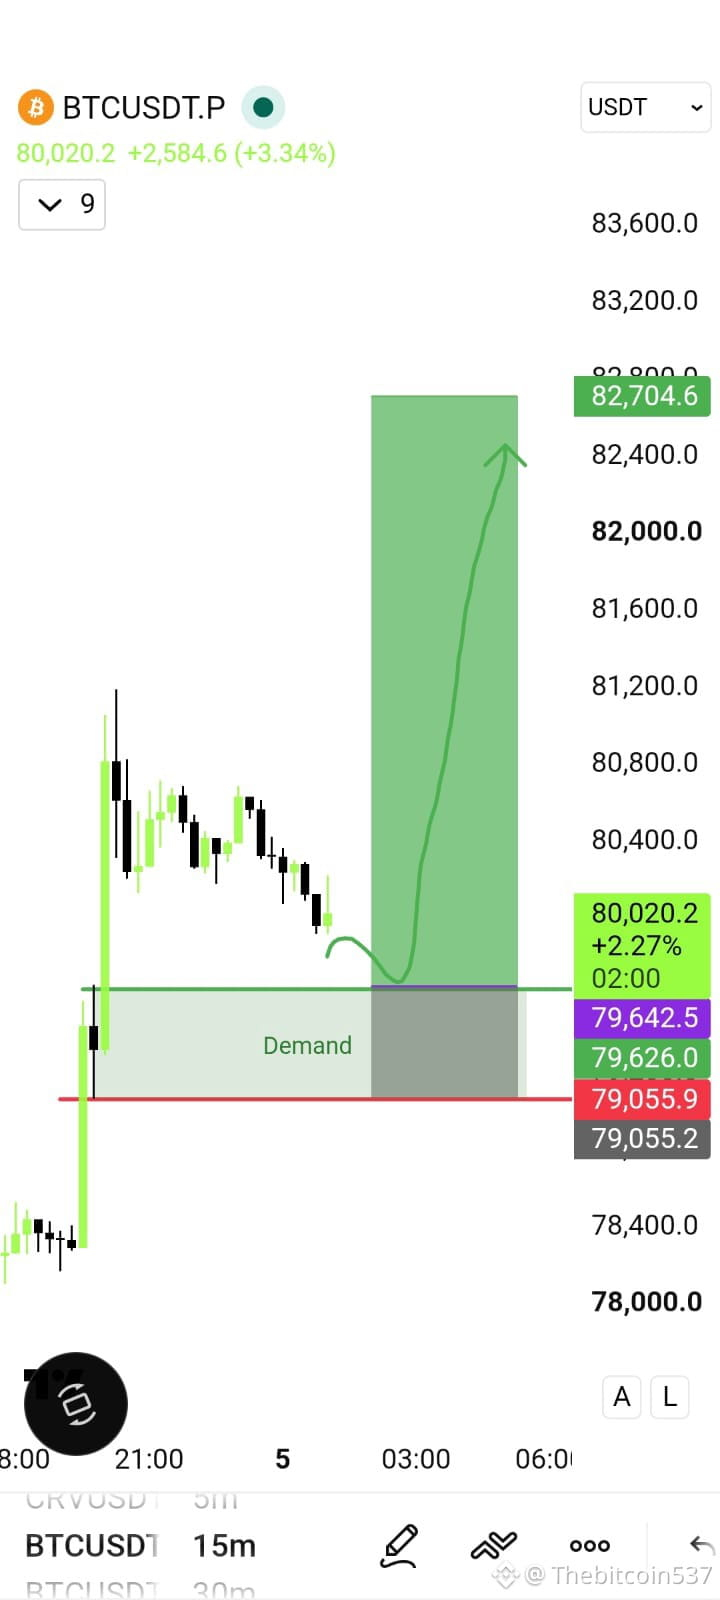
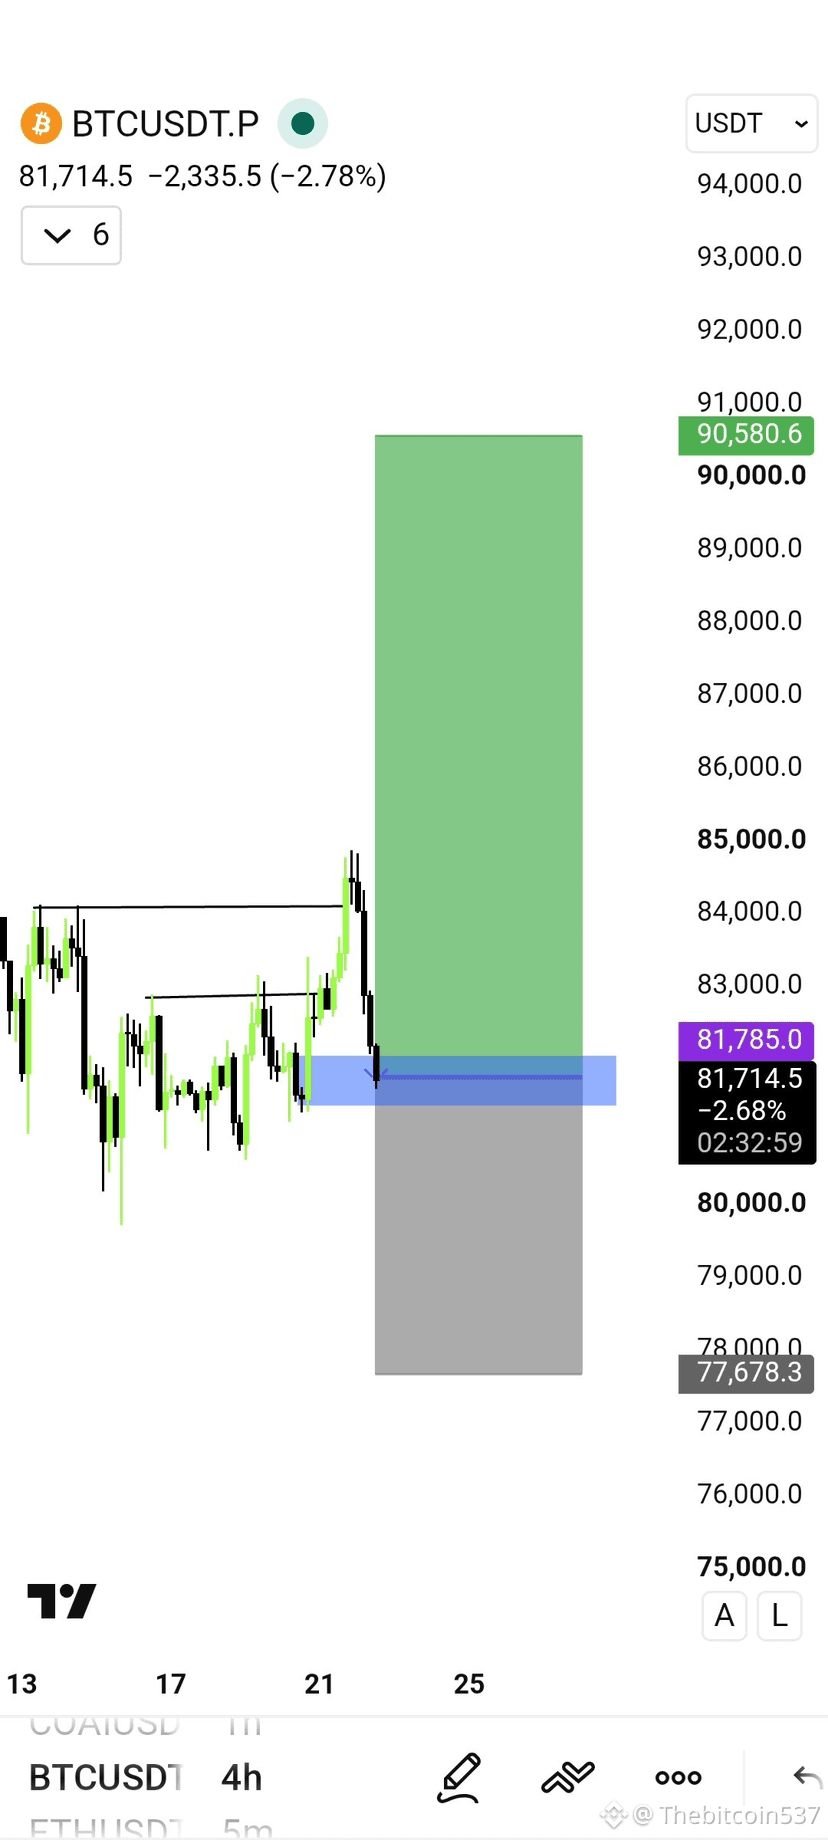
Limit long order. Entry TPs and SL
On the chart.
$BTC
Limit long order. Entry TPs and SL
On the chart.
Limit long order. Entry TPs and SL
On the chart.
109
·
--
Bearish
Thebitcoin537
·
--
Bearish$ETH
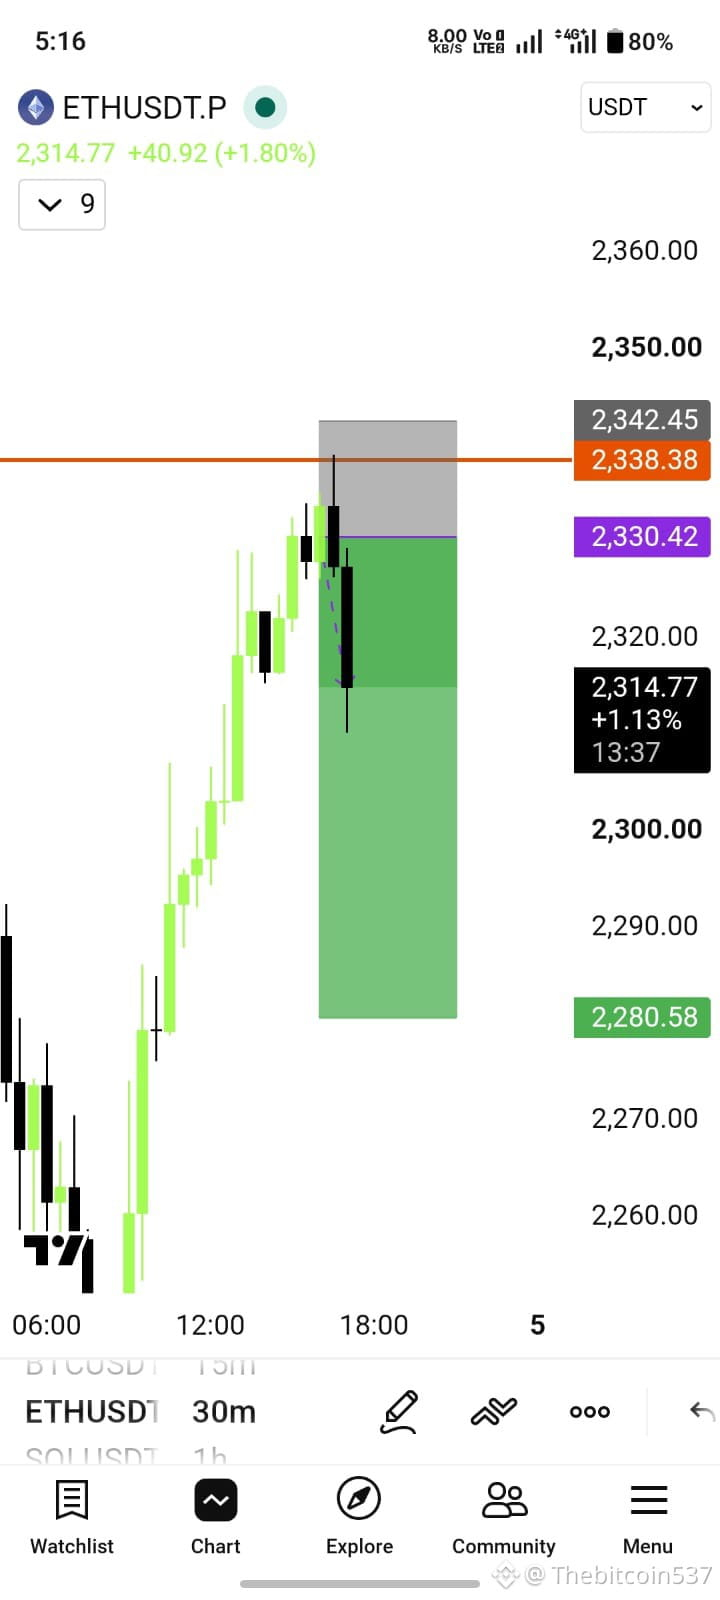
Short from supply zone to target demand zone of 5R.
#USMidterms-WhatAreMarketsExpecting? #HongKongToLicenseVirtualAssetCustodyAndAdvisory #Ethereum
Short from supply zone to target demand zone of 5R.
#USMidterms-WhatAreMarketsExpecting? #HongKongToLicenseVirtualAssetCustodyAndAdvisory #Ethereum
102
·
--
Bearish
$ETH
{future}(ETHUSDT)
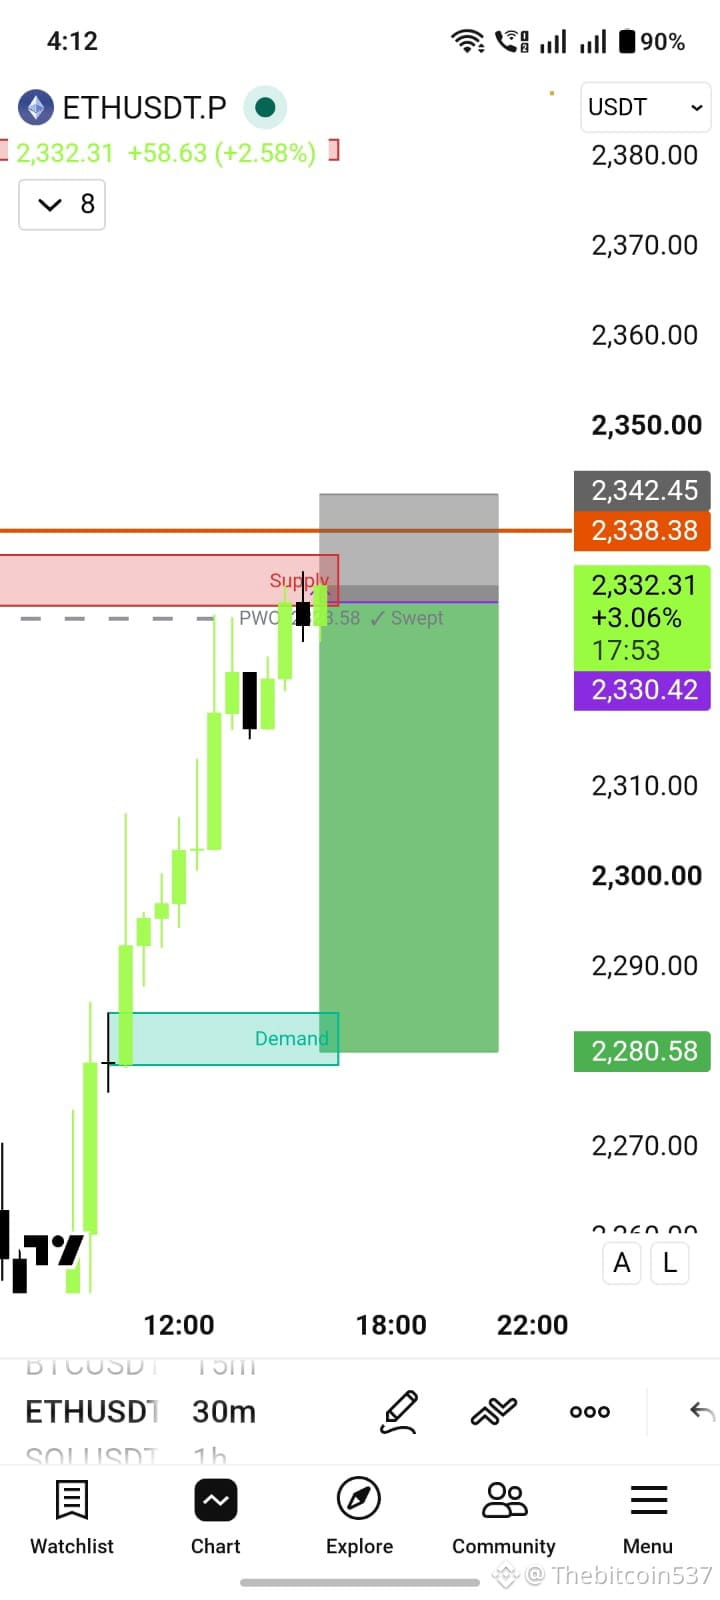
Short from supply zone to target demand zone of 5R.
#USMidterms-WhatAreMarketsExpecting? #HongKongToLicenseVirtualAssetCustodyAndAdvisory #Ethereum
$ETH
Short from supply zone to target demand zone of 5R.
#USMidterms-WhatAreMarketsExpecting? #HongKongToLicenseVirtualAssetCustodyAndAdvisory #Ethereum
Short from supply zone to target demand zone of 5R.
#USMidterms-WhatAreMarketsExpecting? #HongKongToLicenseVirtualAssetCustodyAndAdvisory #Ethereum
1
123
·
--
Bullish
#ExclusiveTradingTournament Compete in the Trading Volume & PnL leaderboards and win your share of a dynamic prize pool of up to $3,850 USDC. Join now! https://www.binance.com/activity/trading-competition/ExclusiveTradingTournamentAutumn202620777?ref=THEBITCOIN37
#
#ExclusiveTradingTournament Compete in the Trading Volume & PnL leaderboards and win your share of a dynamic prize pool of up to $3,850 USDC. Join now! https://www.binance.com/activity/trading-competition/ExclusiveTradingTournamentAutumn202620777?ref=THEBITCOIN37
#
#
161
·
--
Bullish
$BTC
{future}(BTCUSDT)
🟠 BTC/USDT — Monthly Close Update
📍 October closed bearish at 77,582, a full bearish engulfing of September's candle.
📍 Currently watching the Daily FVG / supply zone (78.8K – 80.4K)
📈 Bias: Bearish (pending confirmation)
Liquidity on the radar:
→ Above: 81.9K | 87.2K (double top)
→ Below: 76K equal lows | 75K (September low)
What we need to see:
→ Price taps the zone
→ Bearish reversal candle forms
→ Confirmation = SHORT entry
A daily close above 80.4K would cancel the bearish view
#BitcoinClosesAbove50WeekMAFor7thStraightWeek
$BTC
🟠 BTC/USDT — Monthly Close Update
📍 October closed bearish at 77,582, a full bearish engulfing of September's candle.
📍 Currently watching the Daily FVG / supply zone (78.8K – 80.4K)
📈 Bias: Bearish (pending confirmation)
Liquidity on the radar:
→ Above: 81.9K | 87.2K (double top)
→ Below: 76K equal lows | 75K (September low)
What we need to see:
→ Price taps the zone
→ Bearish reversal candle forms
→ Confirmation = SHORT entry
A daily close above 80.4K would cancel the bearish view
#BitcoinClosesAbove50WeekMAFor7thStraightWeek
🟠 BTC/USDT — Monthly Close Update
📍 October closed bearish at 77,582, a full bearish engulfing of September's candle.
📍 Currently watching the Daily FVG / supply zone (78.8K – 80.4K)
📈 Bias: Bearish (pending confirmation)
Liquidity on the radar:
→ Above: 81.9K | 87.2K (double top)
→ Below: 76K equal lows | 75K (September low)
What we need to see:
→ Price taps the zone
→ Bearish reversal candle forms
→ Confirmation = SHORT entry
A daily close above 80.4K would cancel the bearish view
#BitcoinClosesAbove50WeekMAFor7thStraightWeek
155
·
--
Bullish
$BTC
{future}(BTCUSDT)
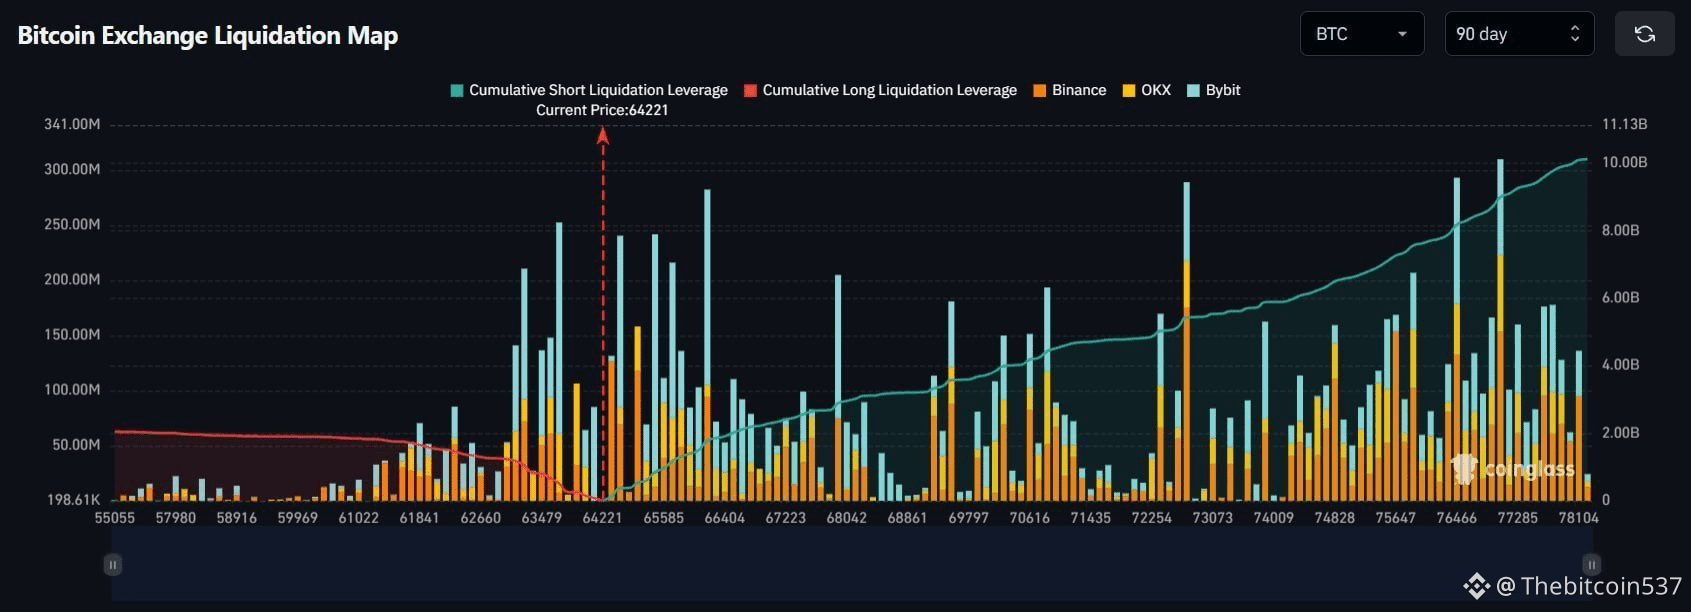
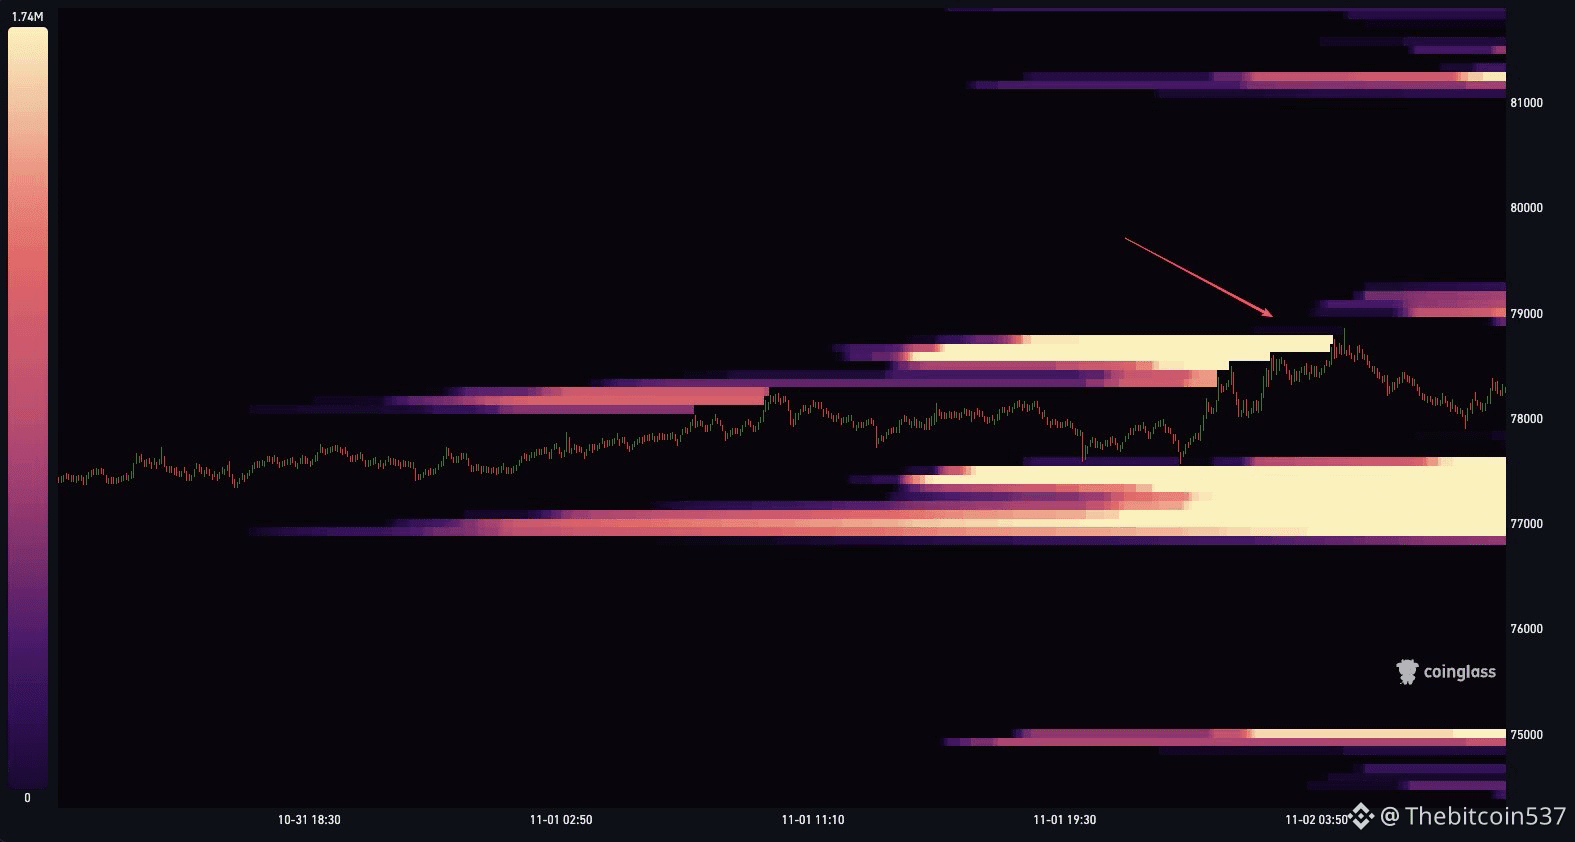
$BTC Liquidation Heatmap (48 hour)
High leverage liquidity.
$BTC
$BTC Liquidation Heatmap (48 hour)
High leverage liquidity.
$BTC Liquidation Heatmap (48 hour)
High leverage liquidity.
84
·
--
Bullish
$INJ
{future}(INJUSDT)
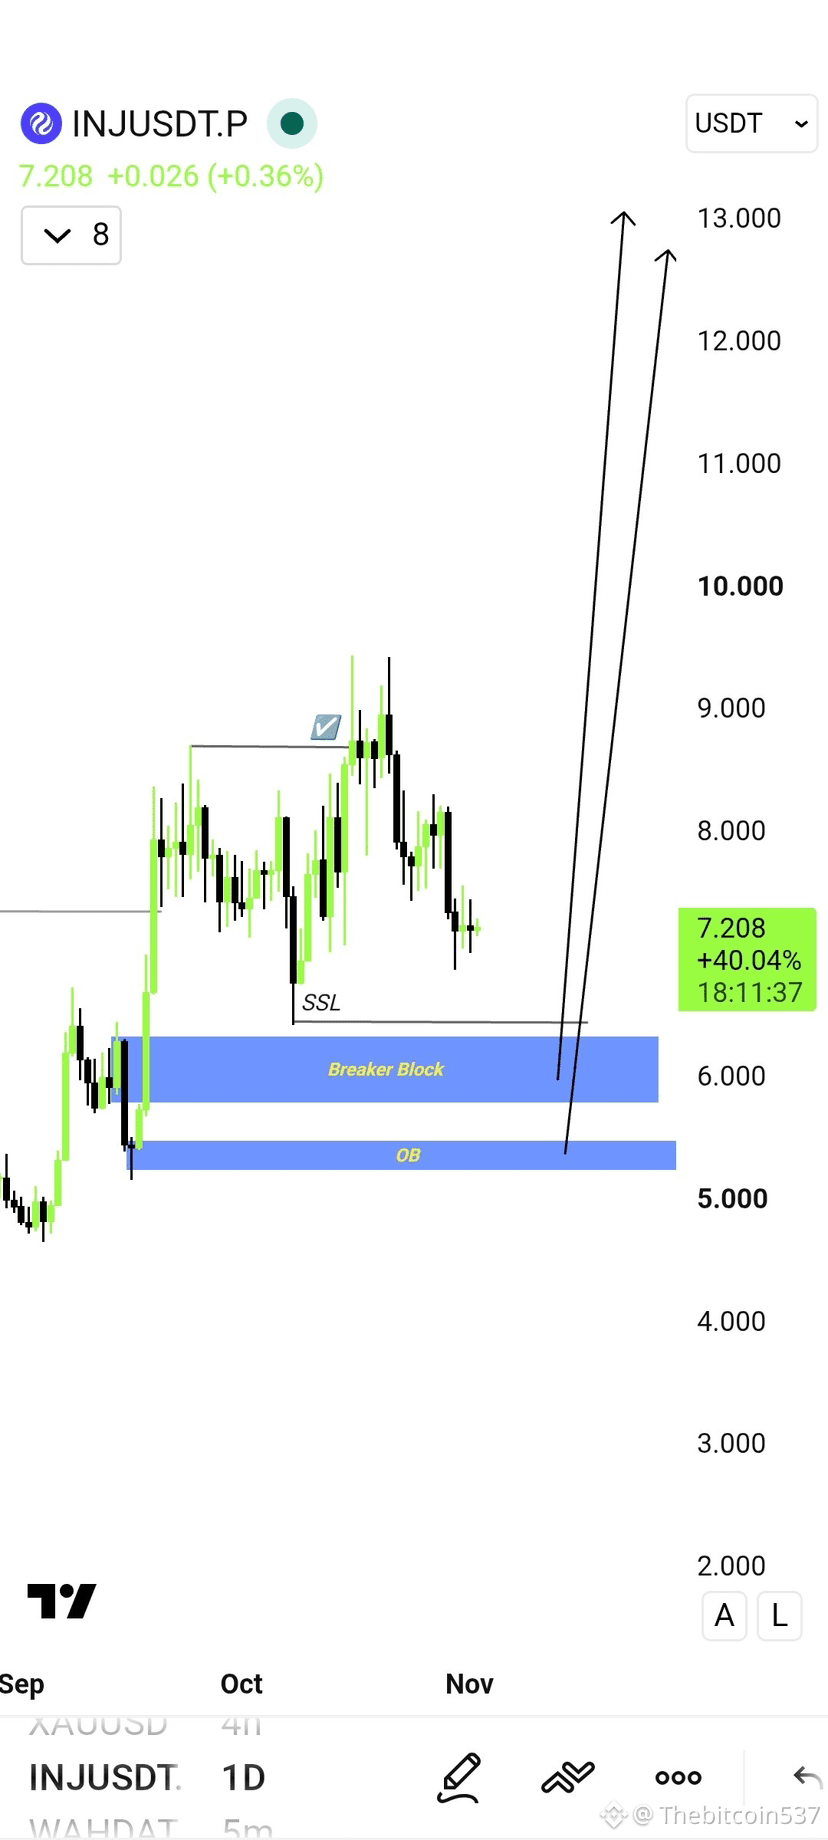
1D Timeframe Analysis 📊
It's in a bullish trend structure but couldn't break above 8.50$ and did a sweep instead of a BOS 📉. Now in the current zone we can see 4&5%+-, but our major buy zone should be lower below Sell side Liquidity, in the zone of breaker Block and order Block 🧱.
Keep an eye on this coin for major buyings in Spot 👀.
#BinanceProcesses$4.65BWithdrawals #WithdrawalsBack: 15 networks live #BitcoinSpotETFsPost$203MWeeklyOutflow #inj
$INJ
1D Timeframe Analysis 📊
It's in a bullish trend structure but couldn't break above 8.50$ and did a sweep instead of a BOS 📉. Now in the current zone we can see 4&5%+-, but our major buy zone should be lower below Sell side Liquidity, in the zone of breaker Block and order Block 🧱.
Keep an eye on this coin for major buyings in Spot 👀.
#BinanceProcesses$4.65BWithdrawals #WithdrawalsBack: 15 networks live #BitcoinSpotETFsPost$203MWeeklyOutflow #inj
1D Timeframe Analysis 📊
It's in a bullish trend structure but couldn't break above 8.50$ and did a sweep instead of a BOS 📉. Now in the current zone we can see 4&5%+-, but our major buy zone should be lower below Sell side Liquidity, in the zone of breaker Block and order Block 🧱.
Keep an eye on this coin for major buyings in Spot 👀.
#BinanceProcesses$4.65BWithdrawals #WithdrawalsBack: 15 networks live #BitcoinSpotETFsPost$203MWeeklyOutflow #inj
2
671
$BTC
{future}(BTCUSDT)
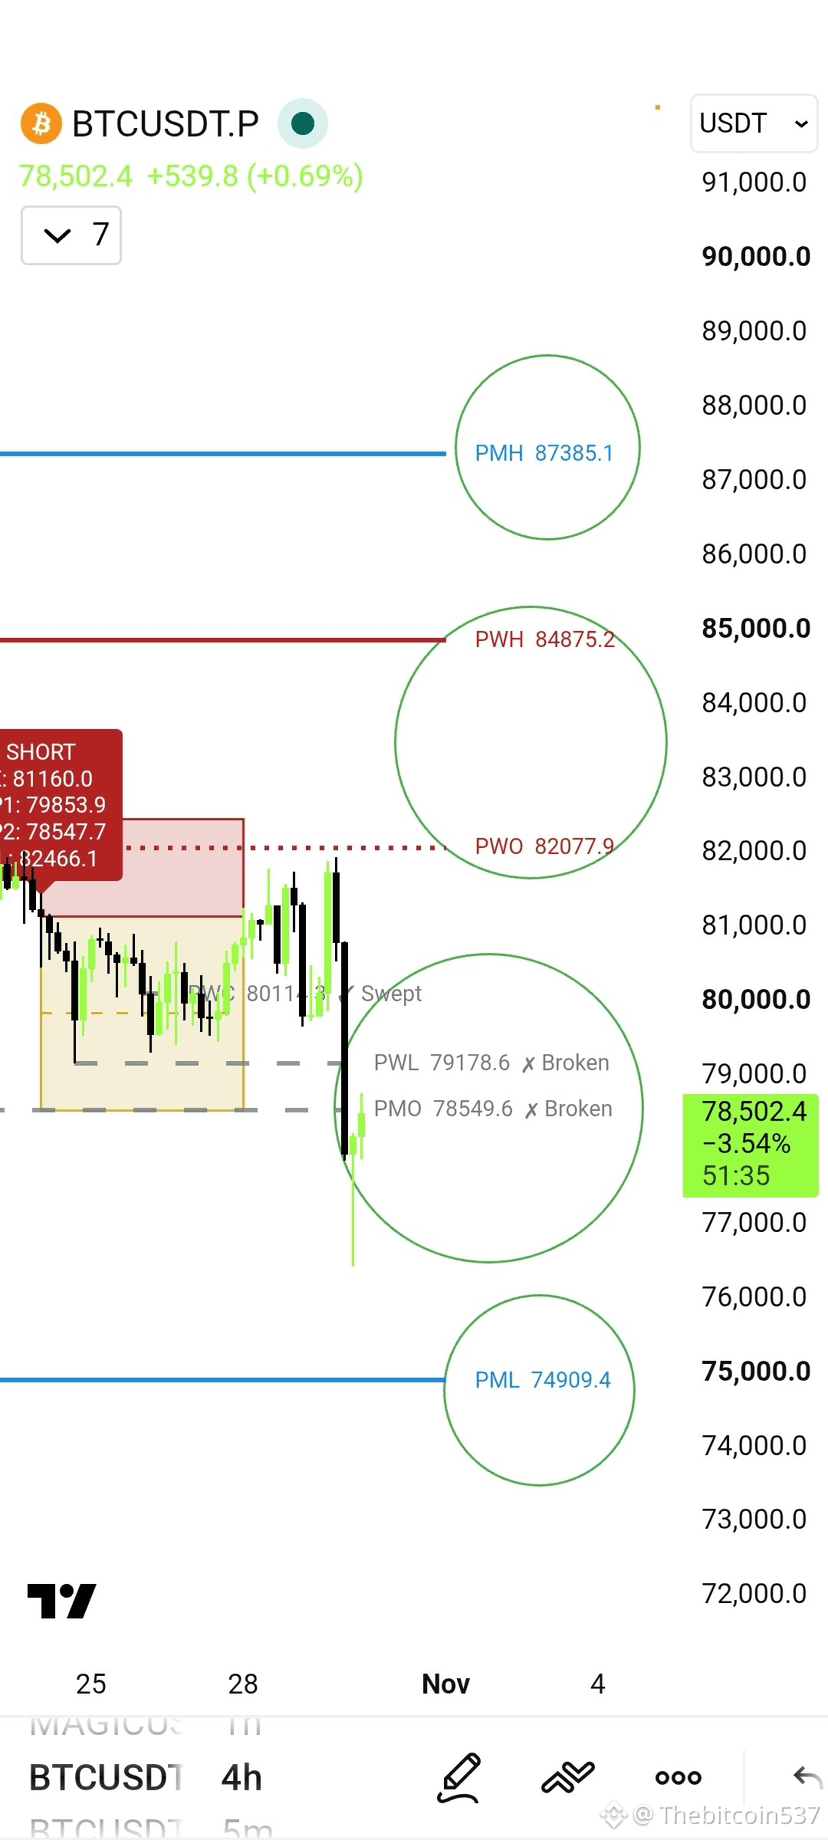
$BTC HTF liquidity levels 📊
Previous Week Open ✅
Previous week low ✅
Previous month open ✅
Pending liquidity 🤔
Previous month low = 74909
Previous month high = 84875
Previous month high = 87385
Remember: We always needed a protected low/high for price stay above/high mean Pump/Dump 🚀📉
Note:- Using personal HTF liquidity indicator.
$BTC
$BTC HTF liquidity levels 📊
Previous Week Open ✅
Previous week low ✅
Previous month open ✅
Pending liquidity 🤔
Previous month low = 74909
Previous month high = 84875
Previous month high = 87385
Remember: We always needed a protected low/high for price stay above/high mean Pump/Dump 🚀📉
Note:- Using personal HTF liquidity indicator.
$BTC HTF liquidity levels 📊
Previous Week Open ✅
Previous week low ✅
Previous month open ✅
Pending liquidity 🤔
Previous month low = 74909
Previous month high = 84875
Previous month high = 87385
Remember: We always needed a protected low/high for price stay above/high mean Pump/Dump 🚀📉
Note:- Using personal HTF liquidity indicator.
272
$PHA
{future}(PHAUSDT)
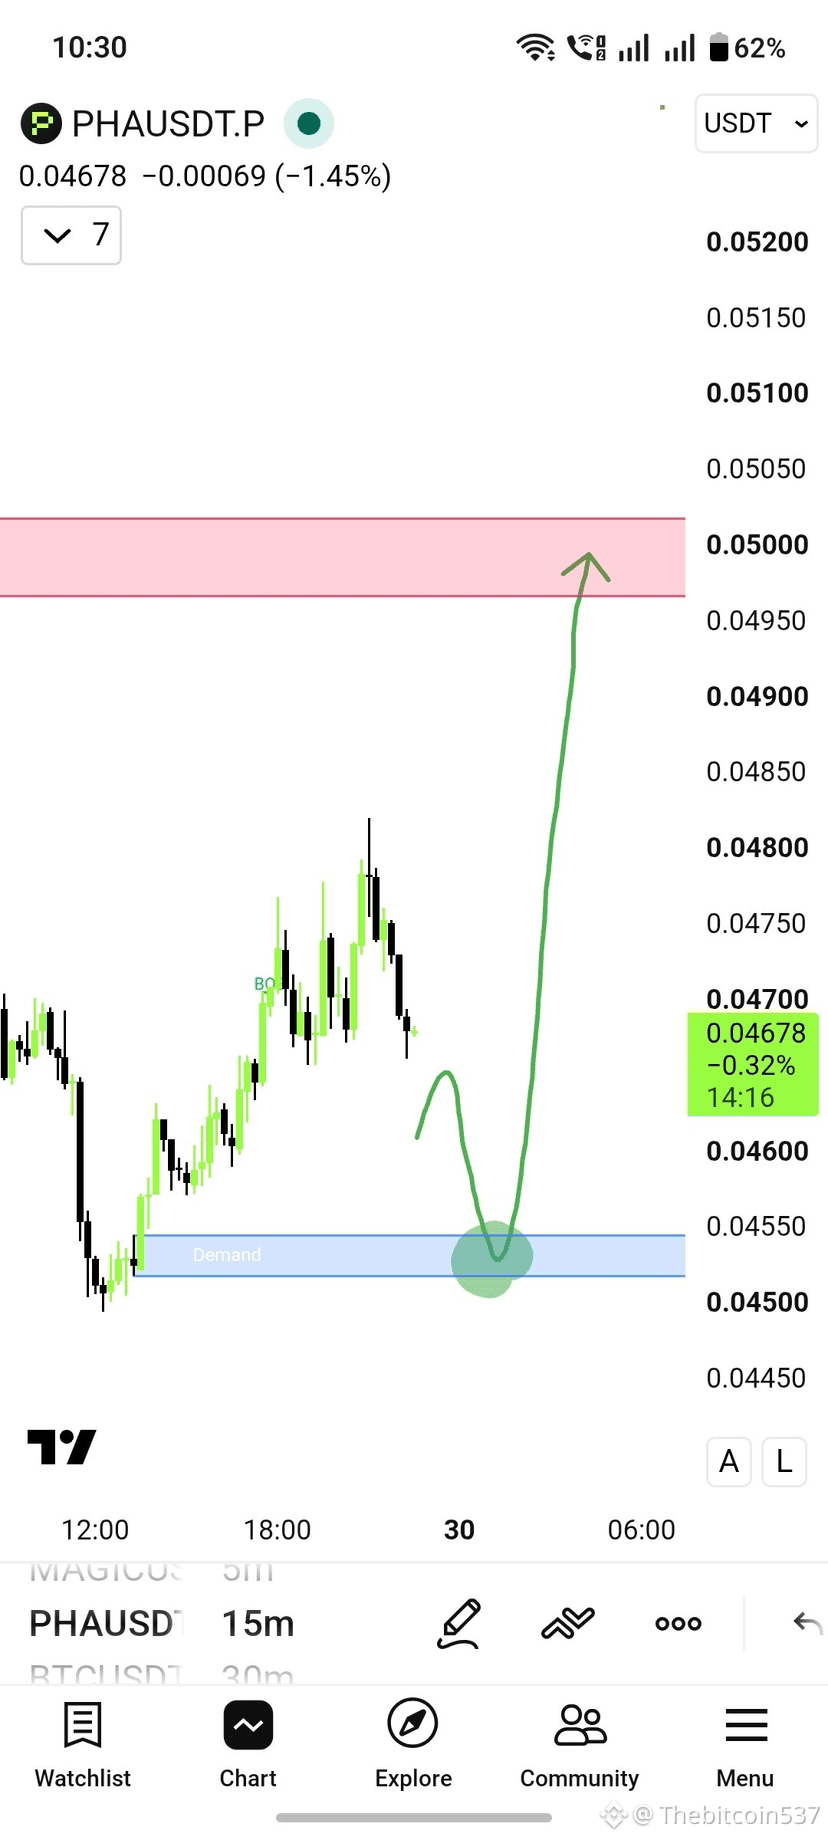
$PHA coin is in my radar for scalping.
If price comes in this demand zone then watch confirmation candle (bullish engulfing, Bullish hammer) then Long it with your risk management.
$PHA
$PHA coin is in my radar for scalping.
If price comes in this demand zone then watch confirmation candle (bullish engulfing, Bullish hammer) then Long it with your risk management.
$PHA coin is in my radar for scalping.
If price comes in this demand zone then watch confirmation candle (bullish engulfing, Bullish hammer) then Long it with your risk management.
825
·
--
Bullish
$MAGIC
{future}(MAGICUSDT)
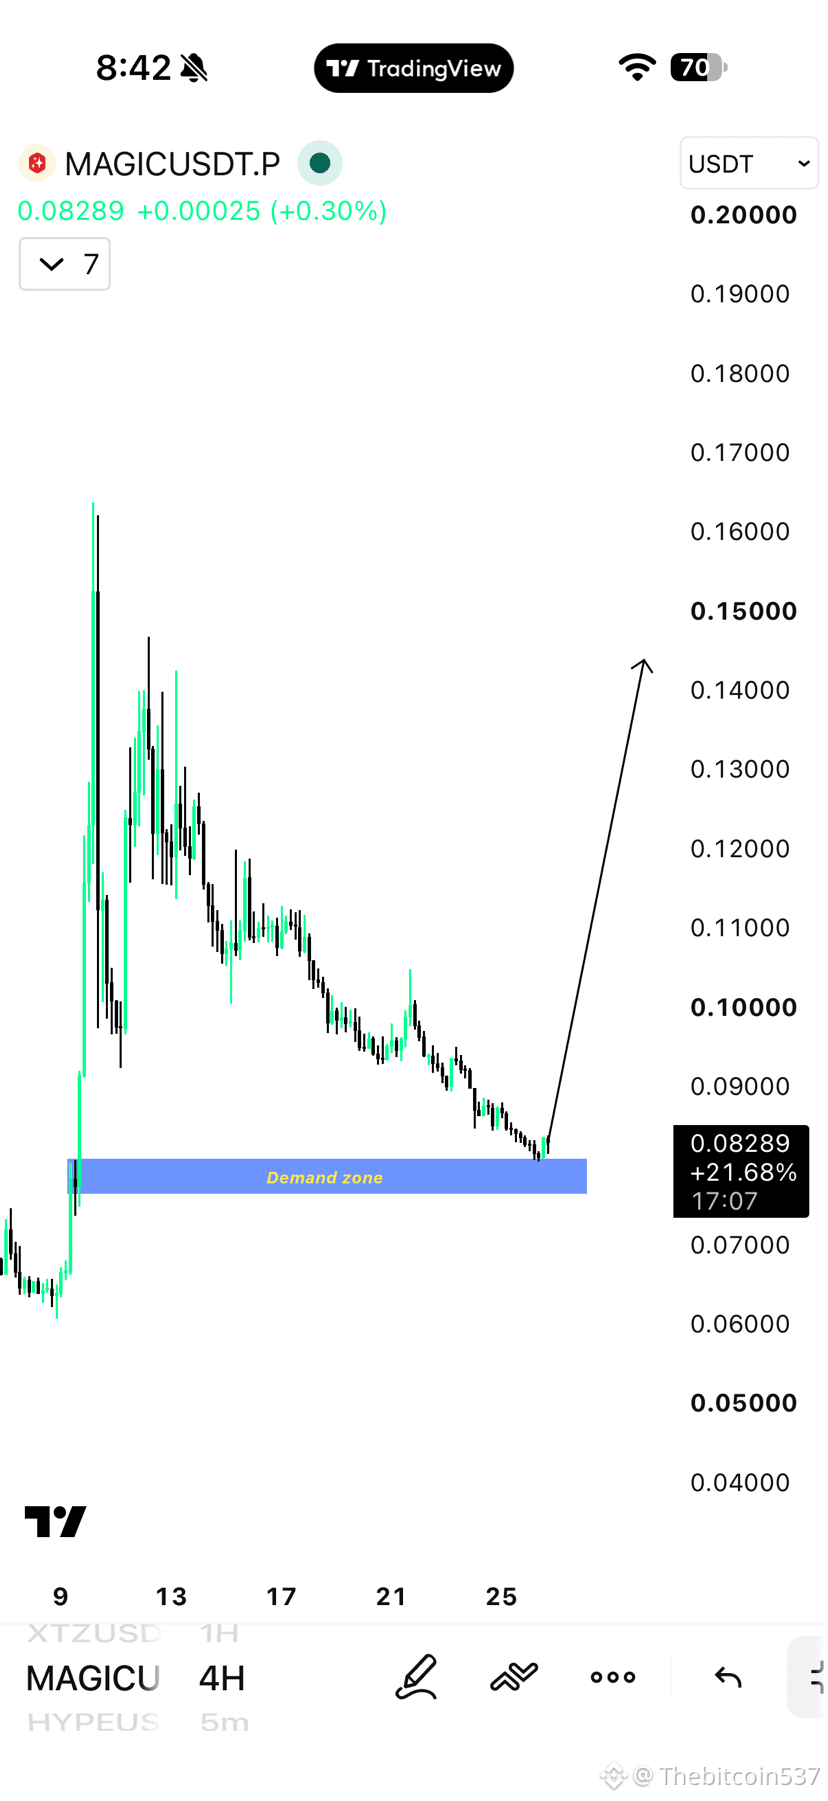
$MAGIC coin in 4H Demand Zone 📈. Confirmation candle can pump it hard 🚀.
Keep in your list 📝.
$MAGIC
$MAGIC coin in 4H Demand Zone 📈. Confirmation candle can pump it hard 🚀.
Keep in your list 📝.
$MAGIC coin in 4H Demand Zone 📈. Confirmation candle can pump it hard 🚀.
Keep in your list 📝.
789
·
--
Bullish
$ETH
{future}(ETHUSDT)
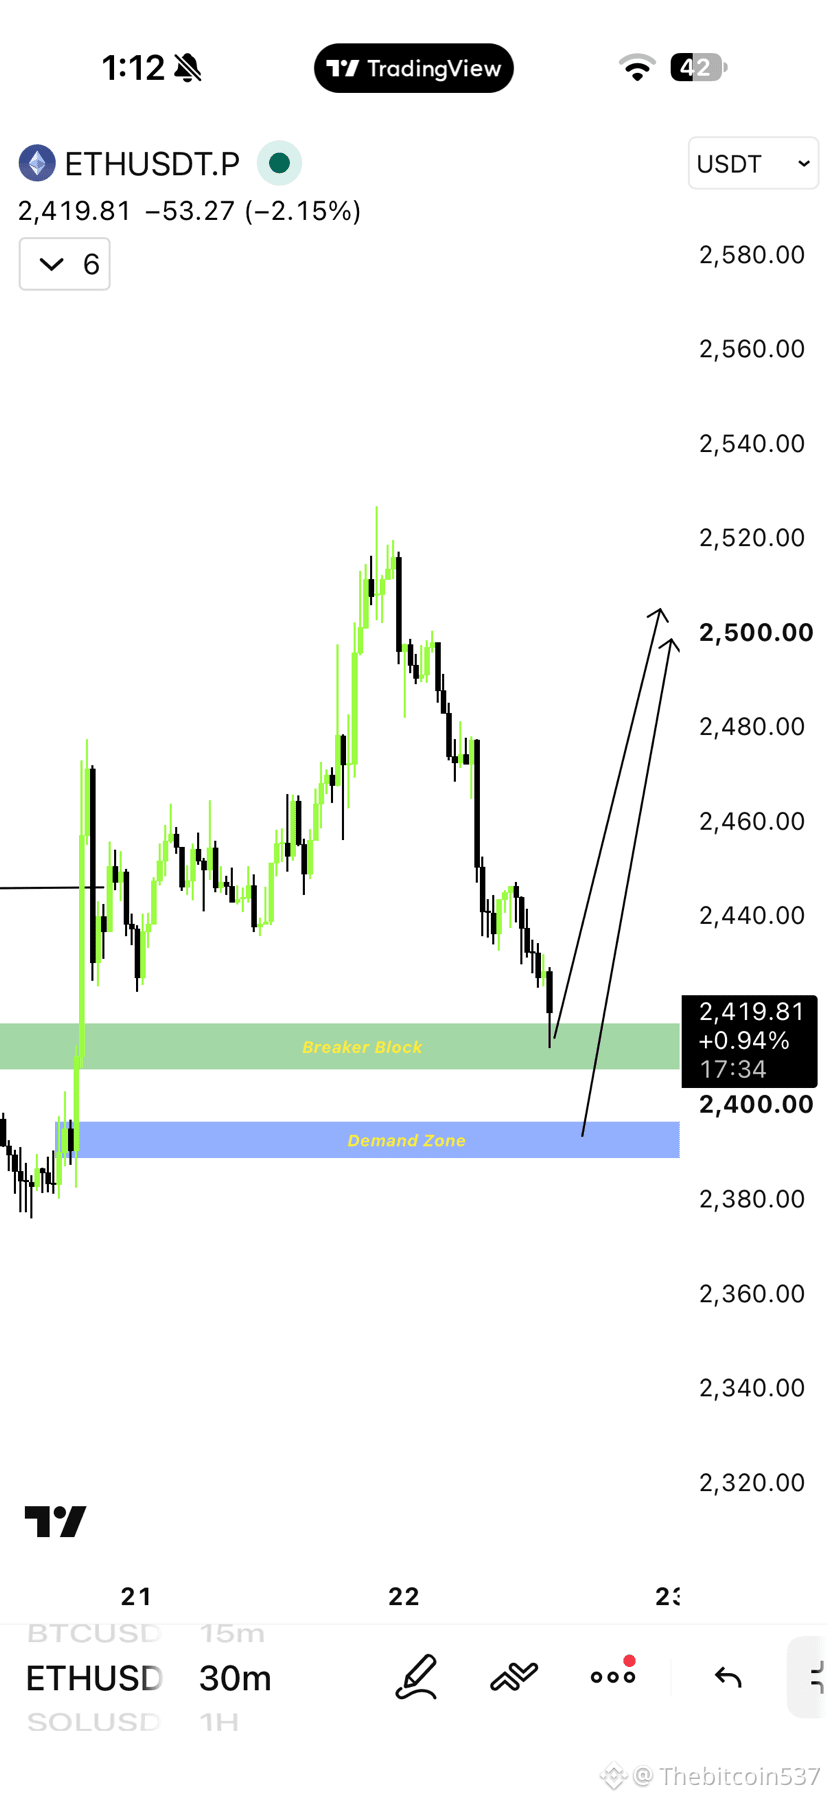
$ETH up from either marked BREAKER BLOCK area 📈 or if it goes down then there is Bullush Demand Zone where we can plan for LONGs.
#EthereumSurpasses$2500 #EarningsSeason
$ETH
$ETH up from either marked BREAKER BLOCK area 📈 or if it goes down then there is Bullush Demand Zone where we can plan for LONGs.
#EthereumSurpasses$2500 #EarningsSeason
$ETH up from either marked BREAKER BLOCK area 📈 or if it goes down then there is Bullush Demand Zone where we can plan for LONGs.
#EthereumSurpasses$2500 #EarningsSeason
198
·
--
Bullish
$TAO
{future}(TAOUSDT)
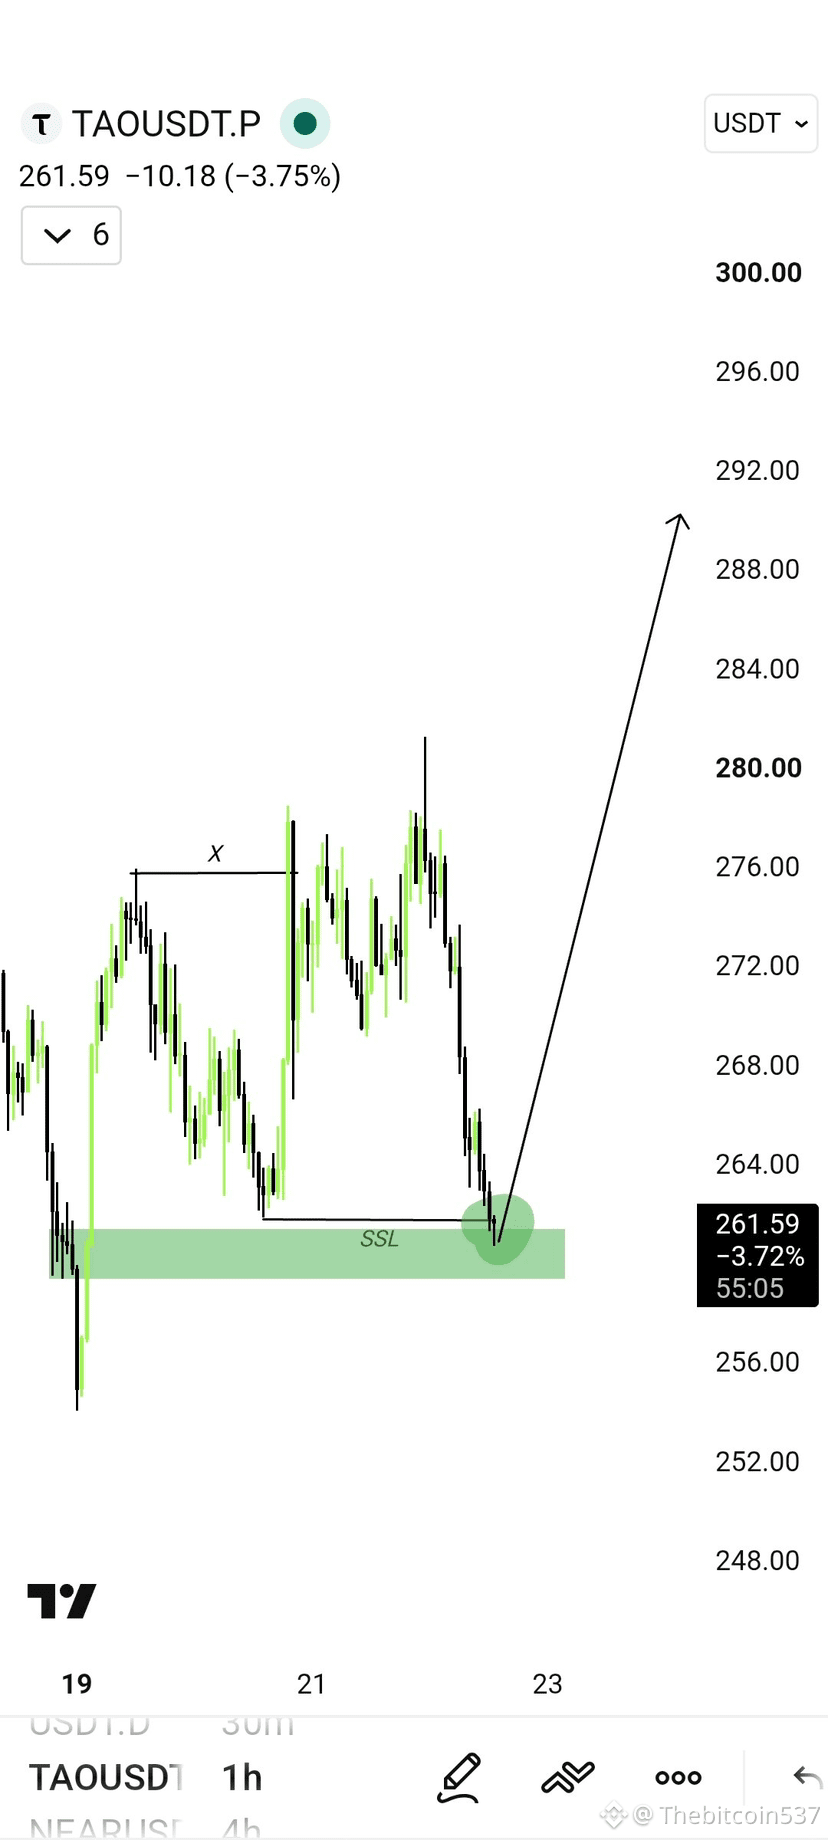
$TAO SSL Sweep Sweep Setup.
If BTC and Usdt dominance behaves then it can pump hard. Manage your risk.
$TAO
$TAO SSL Sweep Sweep Setup.
If BTC and Usdt dominance behaves then it can pump hard. Manage your risk.
$TAO SSL Sweep Sweep Setup.
If BTC and Usdt dominance behaves then it can pump hard. Manage your risk.
2
1.5k
Log in to explore more content
Join global crypto users on Binance Square
⚡️ Get latest and useful information about crypto.
💬 Trusted by the world’s largest crypto exchange.
👍 Discover real insights from verified creators.
Email / Phone number
Trending Topics
BTCRemainsUnderPressureAfterHawkishFOMCMinutes
49,918 views
654 Discussing
FOMC Minutes | Fed Minutes Show Almost All Officials Expect More Rate Hikes, With Some Open to a Larger December Move
Binance News
·47 Likes
·56.8k views
AnthropicToDebutAfter$83IPOPricing
13,054 views
68 Discussing
NvidiaBoardReportedlySplitOverHuang’sReturn
16,403 views
276 Discussing