
World Of Crypto
387 Posts

World Of Crypto
Report
Block User
Open Trade
Frequent Trader
2.3 Years
5 Following
19 Followers
103 Liked
Posts
Portfolio
All
Quotes
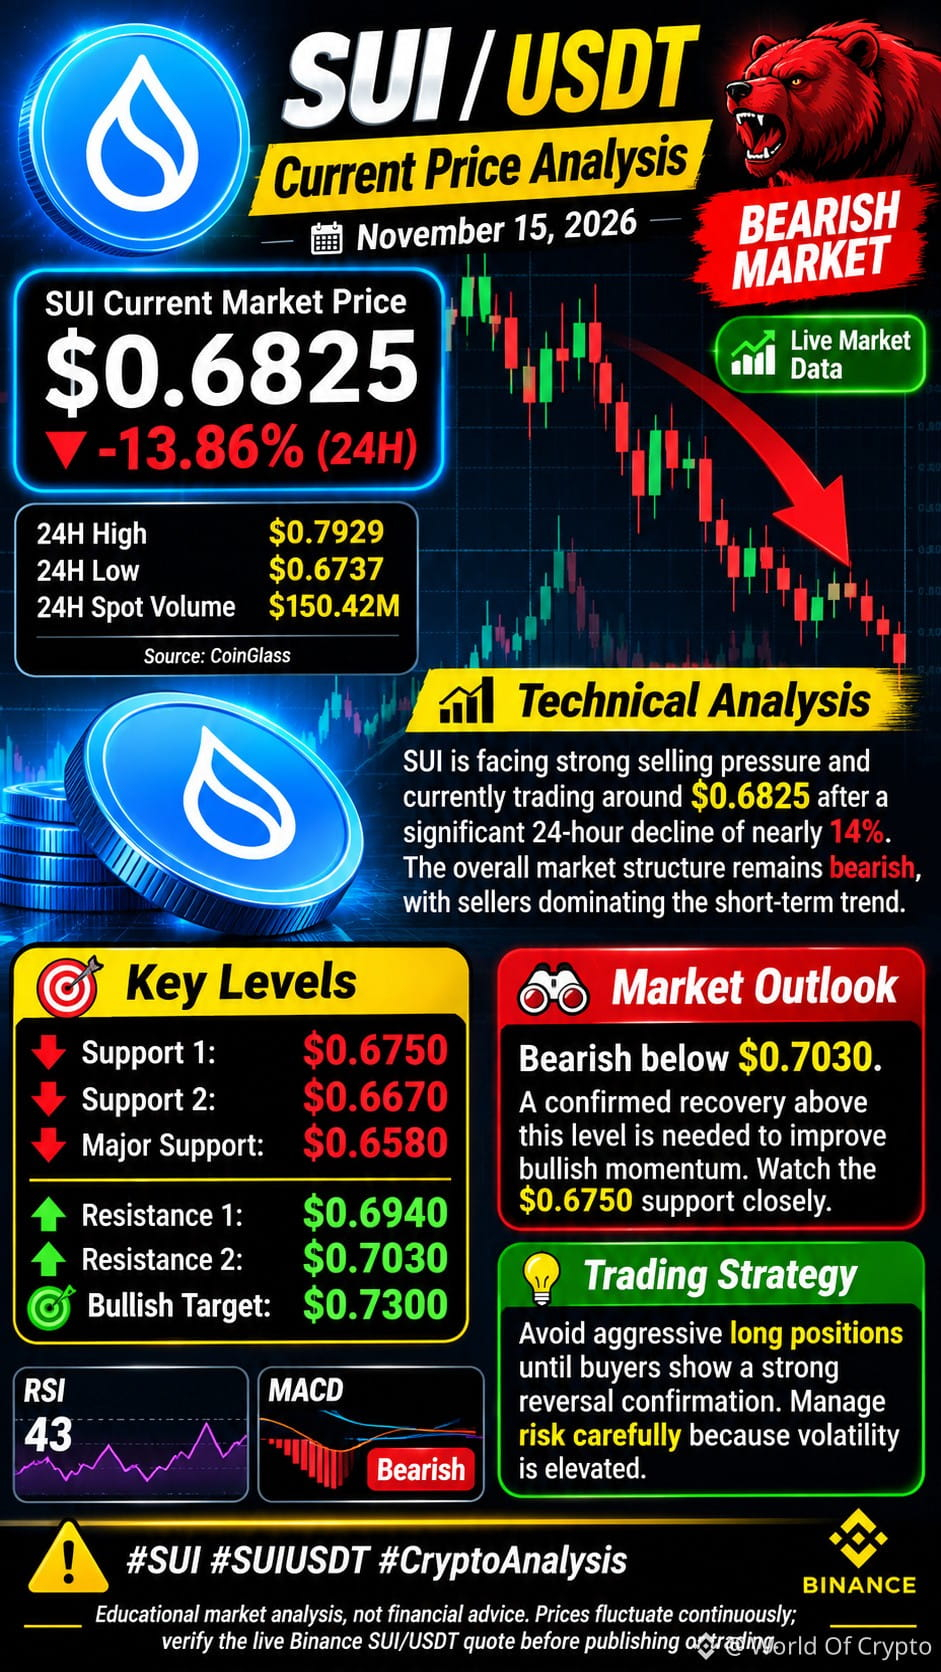
$SUI is facing strong selling pressure and currently trading around $0.6825 after a significant 24-hour decline of nearly 14%. The overall market structure remains bearish, with sellers dominating the short-term trend. The immediate support zone is around $0.6750–$0.6670. If this zone breaks, further downside toward $0.6580 could become possible. On the upside, $0.6940 and $0.7030 are immediate resistance levels. A strong breakout above $0.7030 could open the door for a recovery toward $0.7300. RSI is around 43, while MACD remains bearish, confirming weak momentum.
{spot}(SUIUSDT)
#USSpotXRPETFsSeeLargestWeeklyOutflowIn8Months
$SUI is facing strong selling pressure and currently trading around $0.6825 after a significant 24-hour decline of nearly 14%. The overall market structure remains bearish, with sellers dominating the short-term trend. The immediate support zone is around $0.6750–$0.6670. If this zone breaks, further downside toward $0.6580 could become possible. On the upside, $0.6940 and $0.7030 are immediate resistance levels. A strong breakout above $0.7030 could open the door for a recovery toward $0.7300. RSI is around 43, while MACD remains bearish, confirming weak momentum.
#USSpotXRPETFsSeeLargestWeeklyOutflowIn8Months
#USSpotXRPETFsSeeLargestWeeklyOutflowIn8Months
1
129
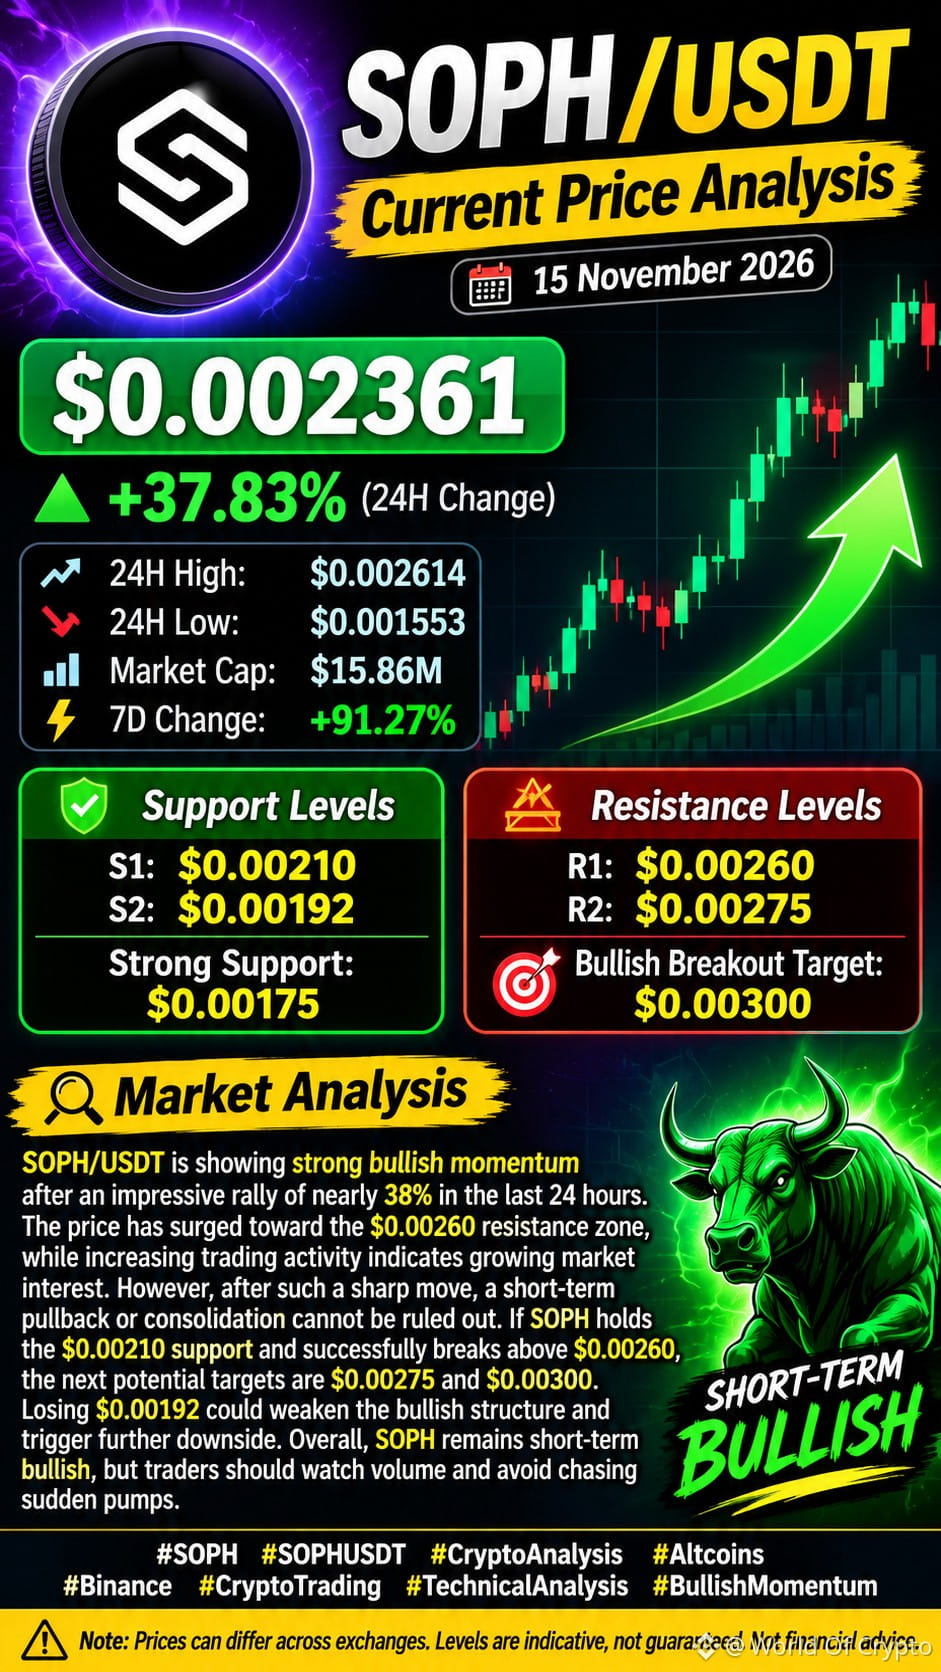
$SOPH /USDT is showing strong bullish momentum after an impressive rally of nearly 38% in the last 24 hours. The price has surged toward the $0.00260 resistance zone, while increasing trading activity indicates growing market interest. However, after such a sharp move, a short-term pullback or consolidation cannot be ruled out. If SOPH holds the $0.00210 support and successfully breaks above $0.00260, the next potential targets are $0.00275 and $0.00300. Losing $0.00192 could weaken the bullish structure and trigger further downside. Overall, SOPH remains short-term bullish, but traders should watch volume and avoid chasing sudden pumps.
{spot}(SOPHUSDT)
#USPPIMissMayEaseBTCPressure
$SOPH /USDT is showing strong bullish momentum after an impressive rally of nearly 38% in the last 24 hours. The price has surged toward the $0.00260 resistance zone, while increasing trading activity indicates growing market interest. However, after such a sharp move, a short-term pullback or consolidation cannot be ruled out. If SOPH holds the $0.00210 support and successfully breaks above $0.00260, the next potential targets are $0.00275 and $0.00300. Losing $0.00192 could weaken the bullish structure and trigger further downside. Overall, SOPH remains short-term bullish, but traders should watch volume and avoid chasing sudden pumps.
#USPPIMissMayEaseBTCPressure
#USPPIMissMayEaseBTCPressure
176
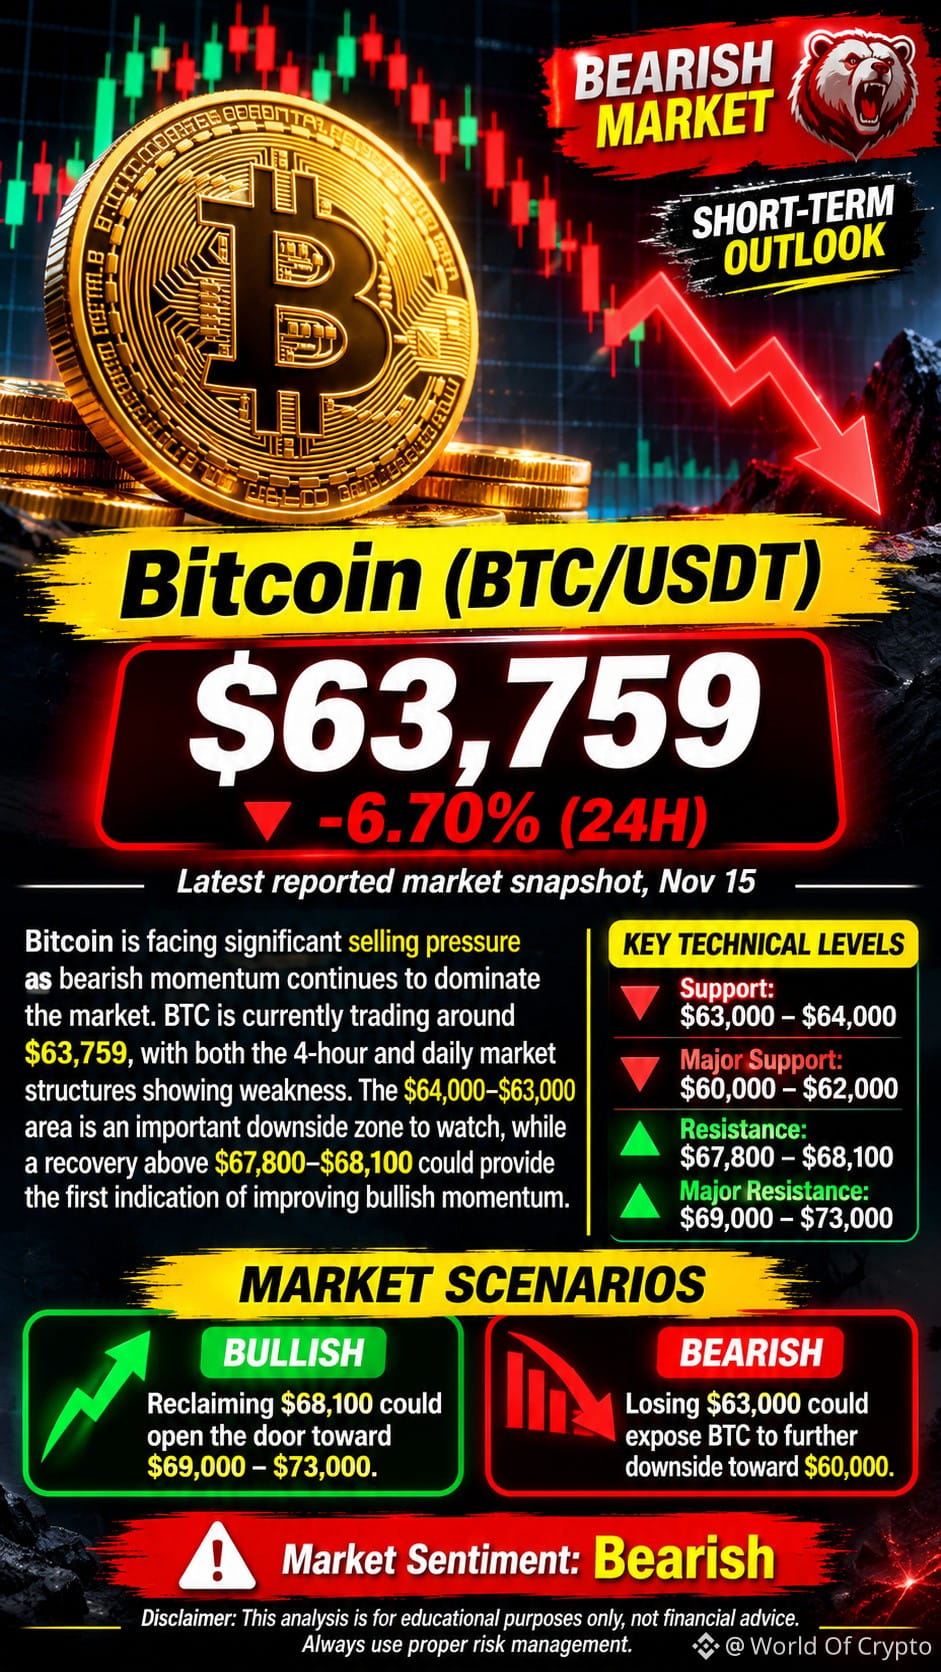
$BTC Bitcoin is facing significant selling pressure as bearish momentum continues to dominate the market. BTC is currently trading around $63,759, with both the 4-hour and daily market structures showing weakness. The $64,000–$63,000 area is an important downside zone to watch, while a recovery above $67,800–$68,100 could provide the first indication of improving bullish momentum. Extreme fear, ETF outflows and weak market liquidity are adding pressure to Bitcoin. Although oversold conditions could trigger a temporary relief bounce, buyers need to reclaim major resistance levels before a trend reversal can be confirmed.
{spot}(BTCUSDT)
$BTC Bitcoin is facing significant selling pressure as bearish momentum continues to dominate the market. BTC is currently trading around $63,759, with both the 4-hour and daily market structures showing weakness. The $64,000–$63,000 area is an important downside zone to watch, while a recovery above $67,800–$68,100 could provide the first indication of improving bullish momentum. Extreme fear, ETF outflows and weak market liquidity are adding pressure to Bitcoin. Although oversold conditions could trigger a temporary relief bounce, buyers need to reclaim major resistance levels before a trend reversal can be confirmed.
82
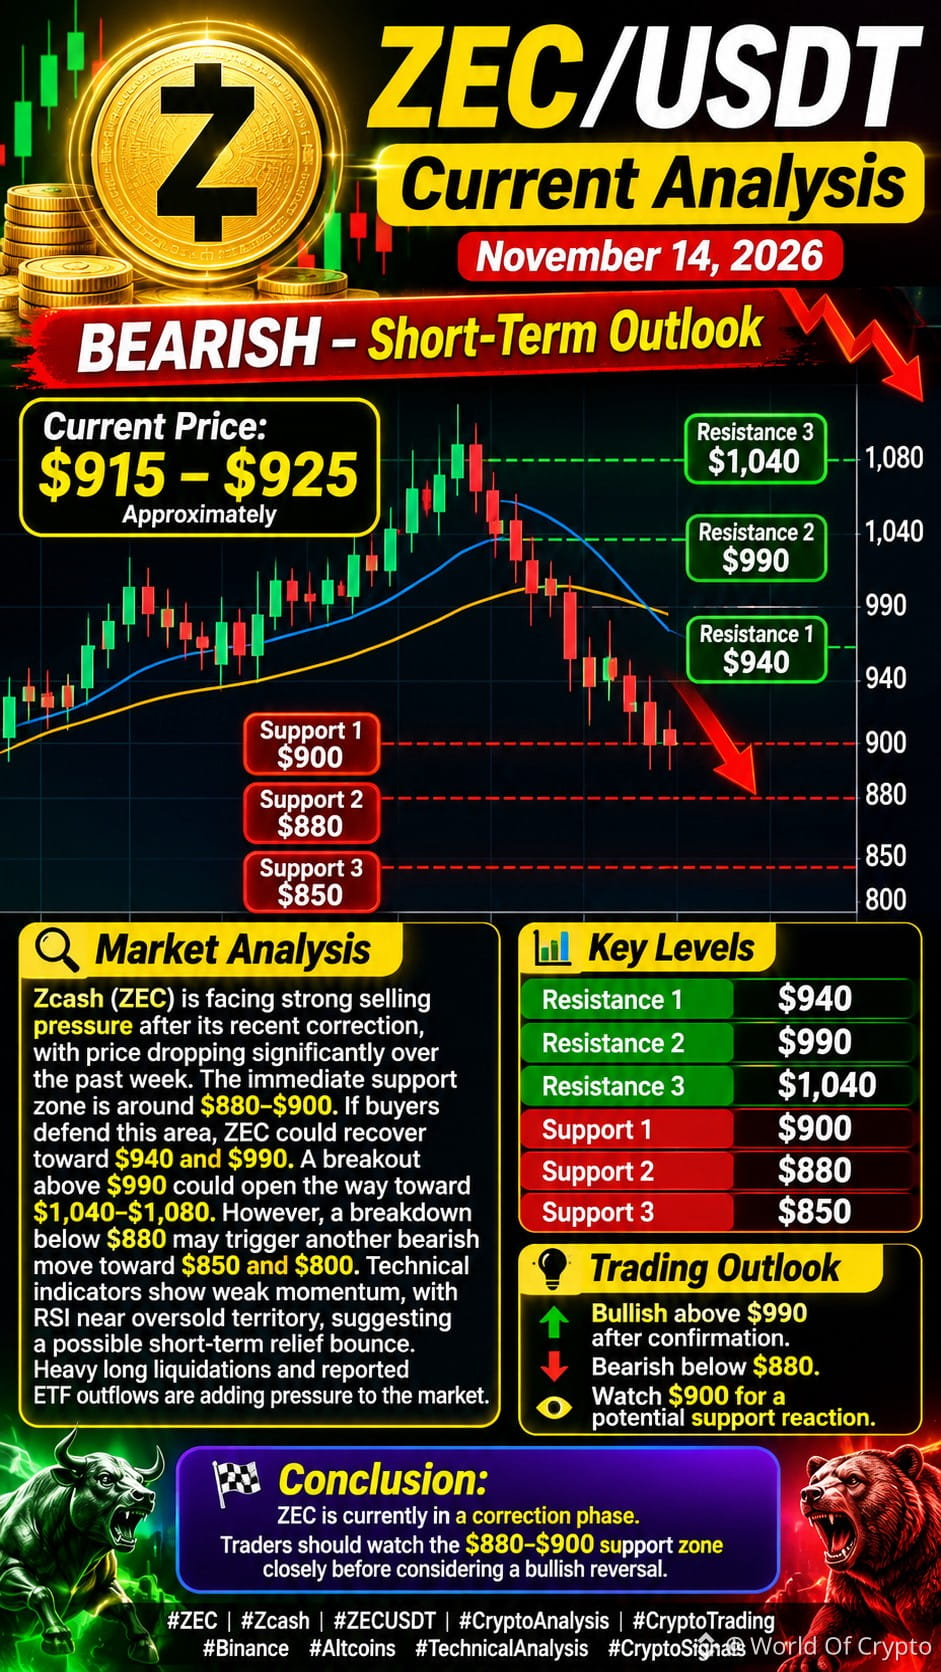
Zcash ($ZEC ) is facing strong selling pressure after its recent correction, with price dropping significantly over the past week. The immediate support zone is around $880–$900. If buyers defend this area, ZEC could recover toward $940 and $990. A breakout above $990 could open the way toward $1,040–$1,080. However, a breakdown below $880 may trigger another bearish move toward $850 and $800. Technical indicators show weak momentum, with RSI near oversold territory, suggesting a possible short-term relief bounce. Heavy long liquidations and reported ETF outflows are adding pressure to the market.
{spot}(ZECUSDT)
#WhatWillDriveCryptoandStocks’NextRebound?
Zcash ($ZEC ) is facing strong selling pressure after its recent correction, with price dropping significantly over the past week. The immediate support zone is around $880–$900. If buyers defend this area, ZEC could recover toward $940 and $990. A breakout above $990 could open the way toward $1,040–$1,080. However, a breakdown below $880 may trigger another bearish move toward $850 and $800. Technical indicators show weak momentum, with RSI near oversold territory, suggesting a possible short-term relief bounce. Heavy long liquidations and reported ETF outflows are adding pressure to the market.
#WhatWillDriveCryptoandStocks’NextRebound?
#WhatWillDriveCryptoandStocks’NextRebound?
59
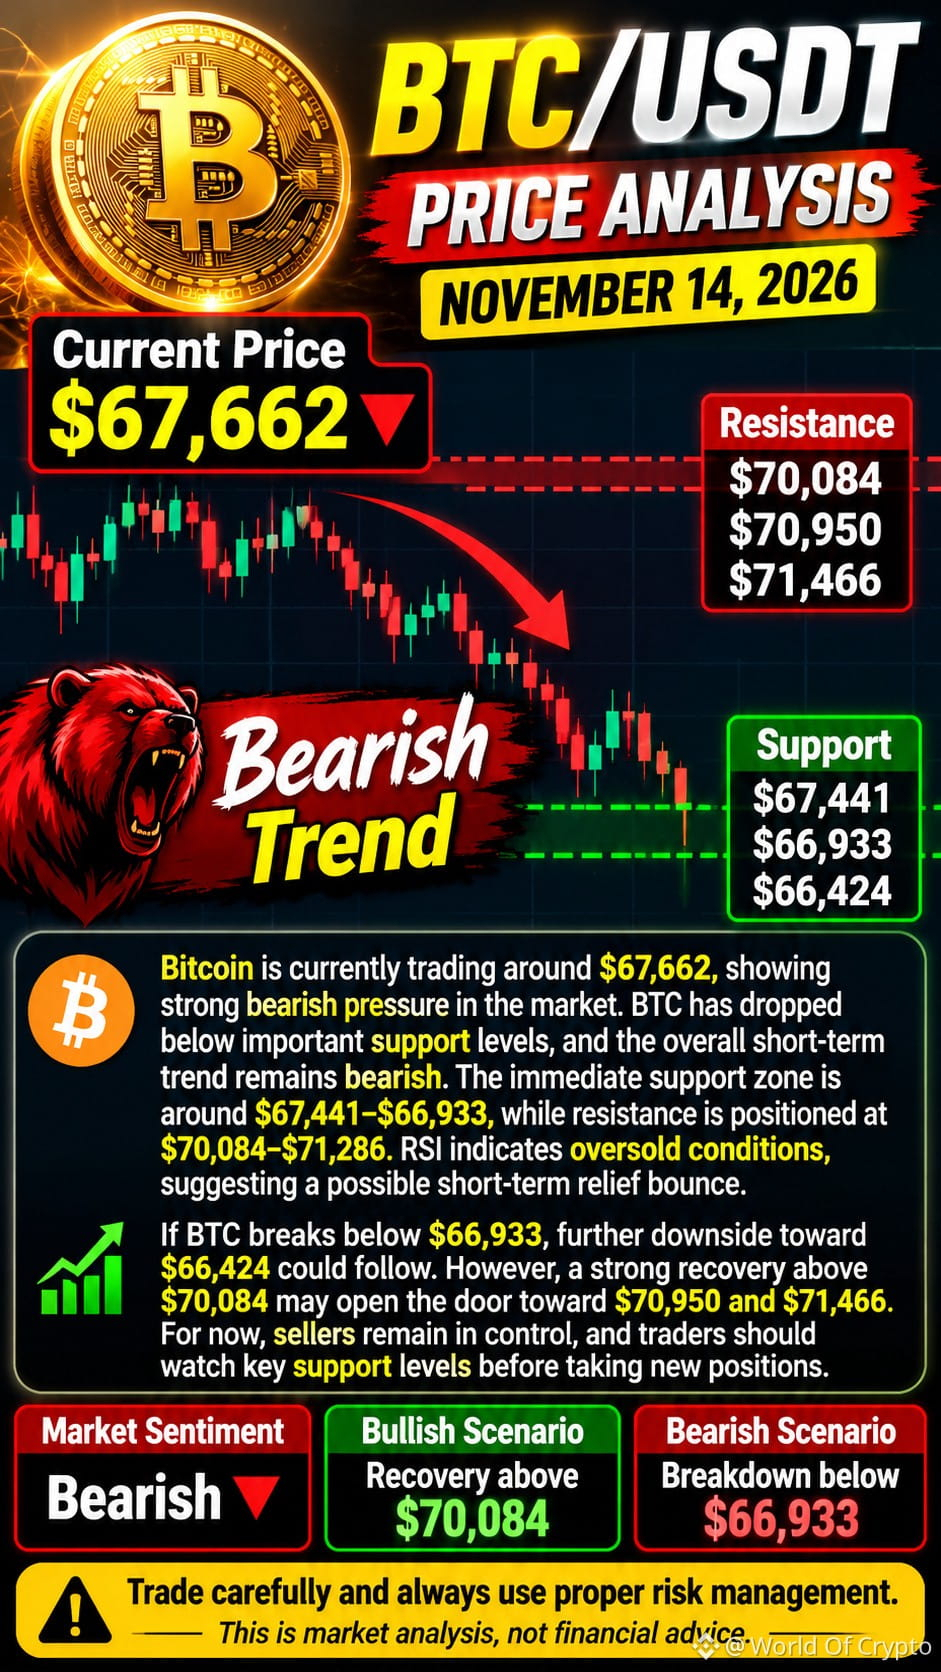
$BTC Bitcoin is currently trading around $67,662, showing strong bearish pressure in the market. BTC has dropped below important support levels, and the overall short-term trend remains bearish. The immediate support zone is around $67,441–$66,933, while resistance is positioned at $70,084–$71,286. RSI indicates oversold conditions, suggesting a possible short-term relief bounce. If BTC breaks below $66,933, further downside toward $66,424 could follow. However, a strong recovery above $70,084 may open the door toward $70,950 and $71,466. For now, sellers remain in control, and traders should watch key support levels before taking new positions.
{spot}(BTCUSDT)
#WhatWillDriveCryptoandStocks’NextRebound?
$BTC Bitcoin is currently trading around $67,662, showing strong bearish pressure in the market. BTC has dropped below important support levels, and the overall short-term trend remains bearish. The immediate support zone is around $67,441–$66,933, while resistance is positioned at $70,084–$71,286. RSI indicates oversold conditions, suggesting a possible short-term relief bounce. If BTC breaks below $66,933, further downside toward $66,424 could follow. However, a strong recovery above $70,084 may open the door toward $70,950 and $71,466. For now, sellers remain in control, and traders should watch key support levels before taking new positions.
#WhatWillDriveCryptoandStocks’NextRebound?
#WhatWillDriveCryptoandStocks’NextRebound?
48
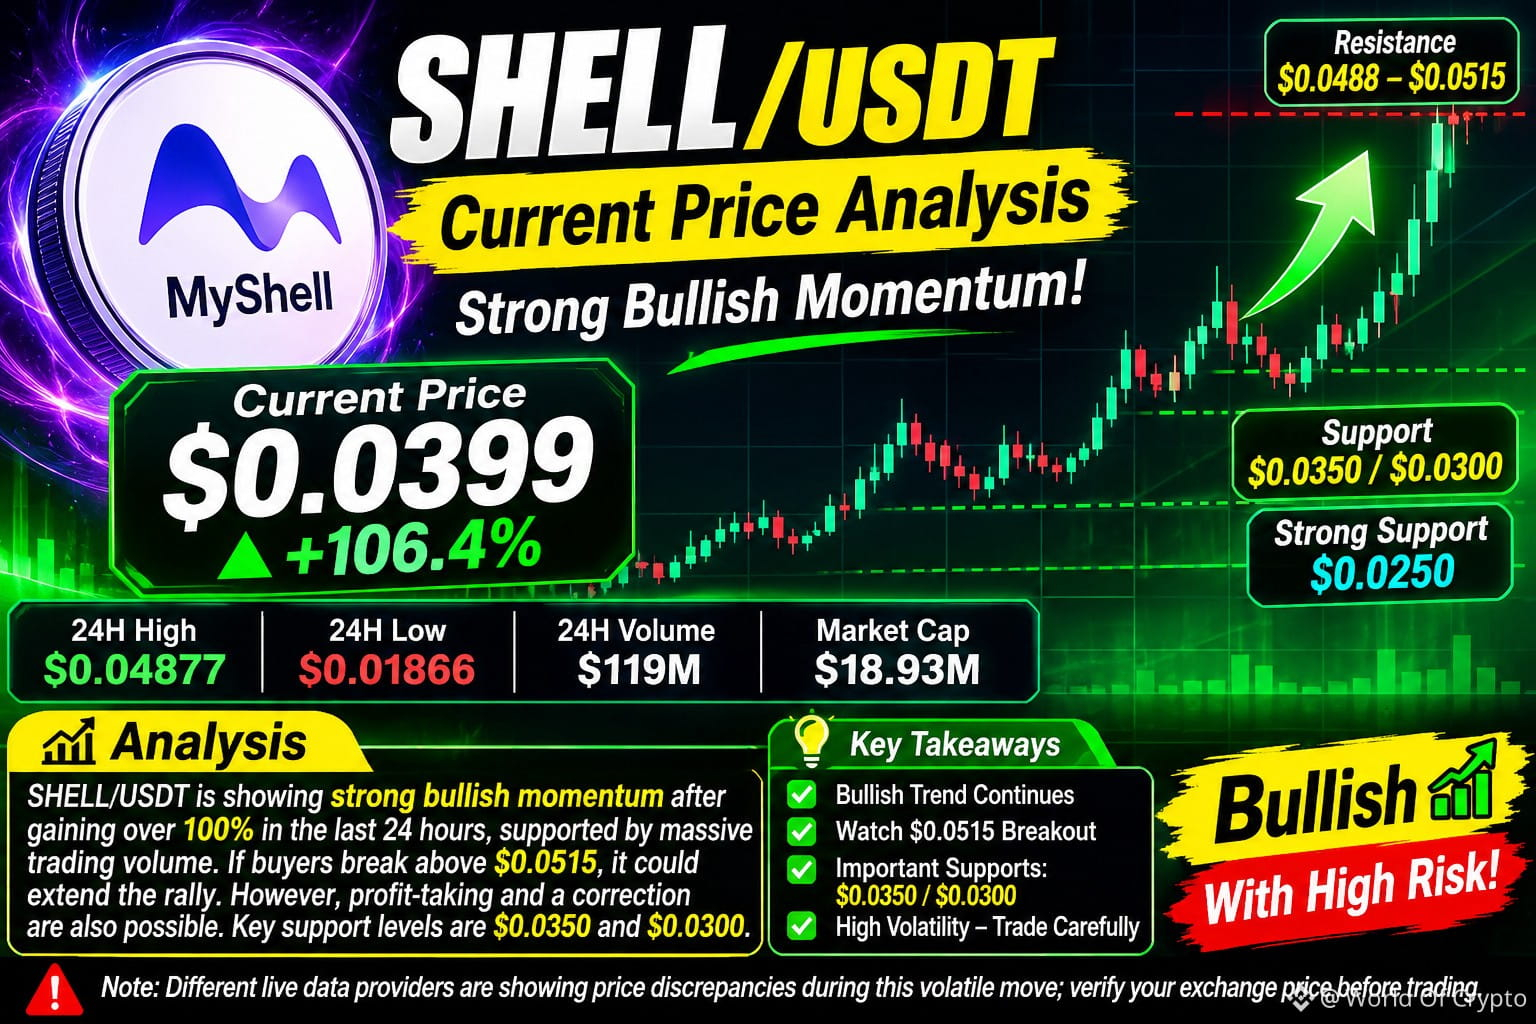
$SHELL /USDT is showing strong bullish momentum after gaining over 100% in the last 24 hours, supported by a massive increase in trading volume. The price is currently trading around $0.0399, with immediate resistance near $0.0488–$0.0515. If buyers successfully break above this resistance zone with strong volume, SHELL could extend its rally toward higher levels. However, after such a sharp pump, profit-taking and a short-term correction remain possible. Key support levels are $0.0350 and $0.0300. Traders should watch volume confirmation and avoid chasing green candles. Overall, SHELL remains bullish but carries high volatility and significant correction risk.
{spot}(SHELLUSDT)
#USPPIMissMayEaseBTCPressure
$SHELL /USDT is showing strong bullish momentum after gaining over 100% in the last 24 hours, supported by a massive increase in trading volume. The price is currently trading around $0.0399, with immediate resistance near $0.0488–$0.0515. If buyers successfully break above this resistance zone with strong volume, SHELL could extend its rally toward higher levels. However, after such a sharp pump, profit-taking and a short-term correction remain possible. Key support levels are $0.0350 and $0.0300. Traders should watch volume confirmation and avoid chasing green candles. Overall, SHELL remains bullish but carries high volatility and significant correction risk.
#USPPIMissMayEaseBTCPressure
#USPPIMissMayEaseBTCPressure
122
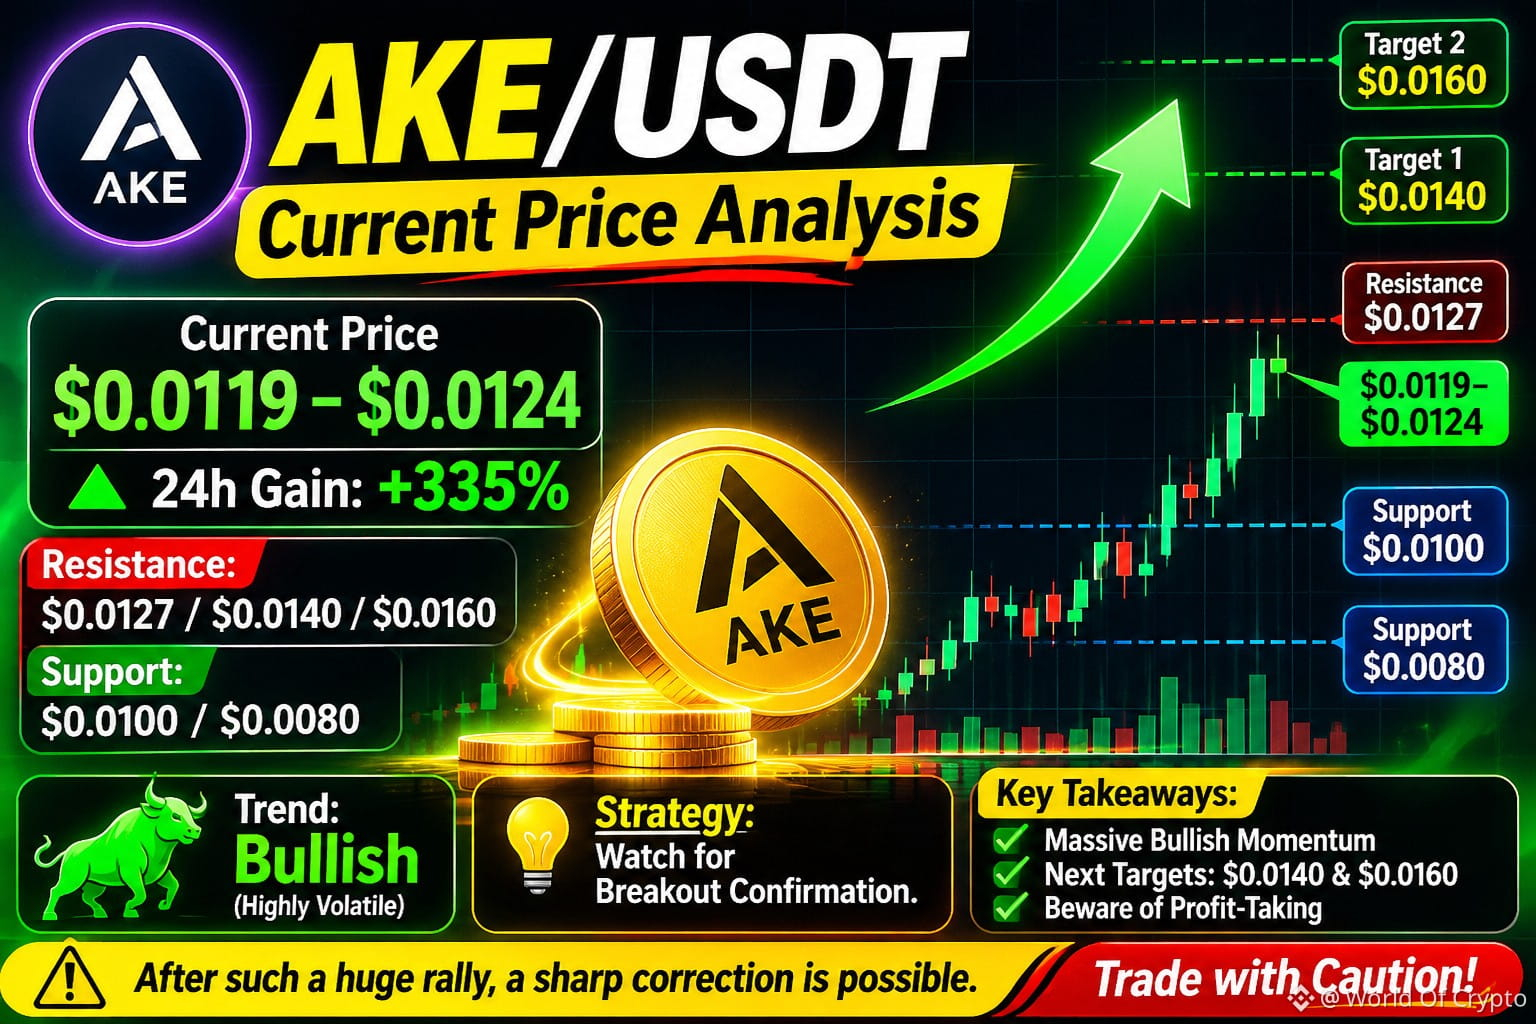
$AKE /USDT is showing massive bullish momentum, trading around $0.0119–$0.0124, with an impressive 24-hour gain of approximately 335%. The price has surged from a recent low near $0.00258 and is approaching resistance around $0.0127. If buyers maintain strong volume and break above $0.0127, the next potential targets are $0.0140 and $0.0160. On the downside, $0.0100 and $0.0080 are important support zones. However, after such a massive rally, profit-taking and a sharp correction are possible. Traders should wait for confirmation before entering new positions. Overall, AKE remains bullish in momentum, but short-term volatility is extremely high.
{future}(AKEUSDT)
#USPPIMissMayEaseBTCPressure
$AKE /USDT is showing massive bullish momentum, trading around $0.0119–$0.0124, with an impressive 24-hour gain of approximately 335%. The price has surged from a recent low near $0.00258 and is approaching resistance around $0.0127. If buyers maintain strong volume and break above $0.0127, the next potential targets are $0.0140 and $0.0160. On the downside, $0.0100 and $0.0080 are important support zones. However, after such a massive rally, profit-taking and a sharp correction are possible. Traders should wait for confirmation before entering new positions. Overall, AKE remains bullish in momentum, but short-term volatility is extremely high.
#USPPIMissMayEaseBTCPressure
#USPPIMissMayEaseBTCPressure
82
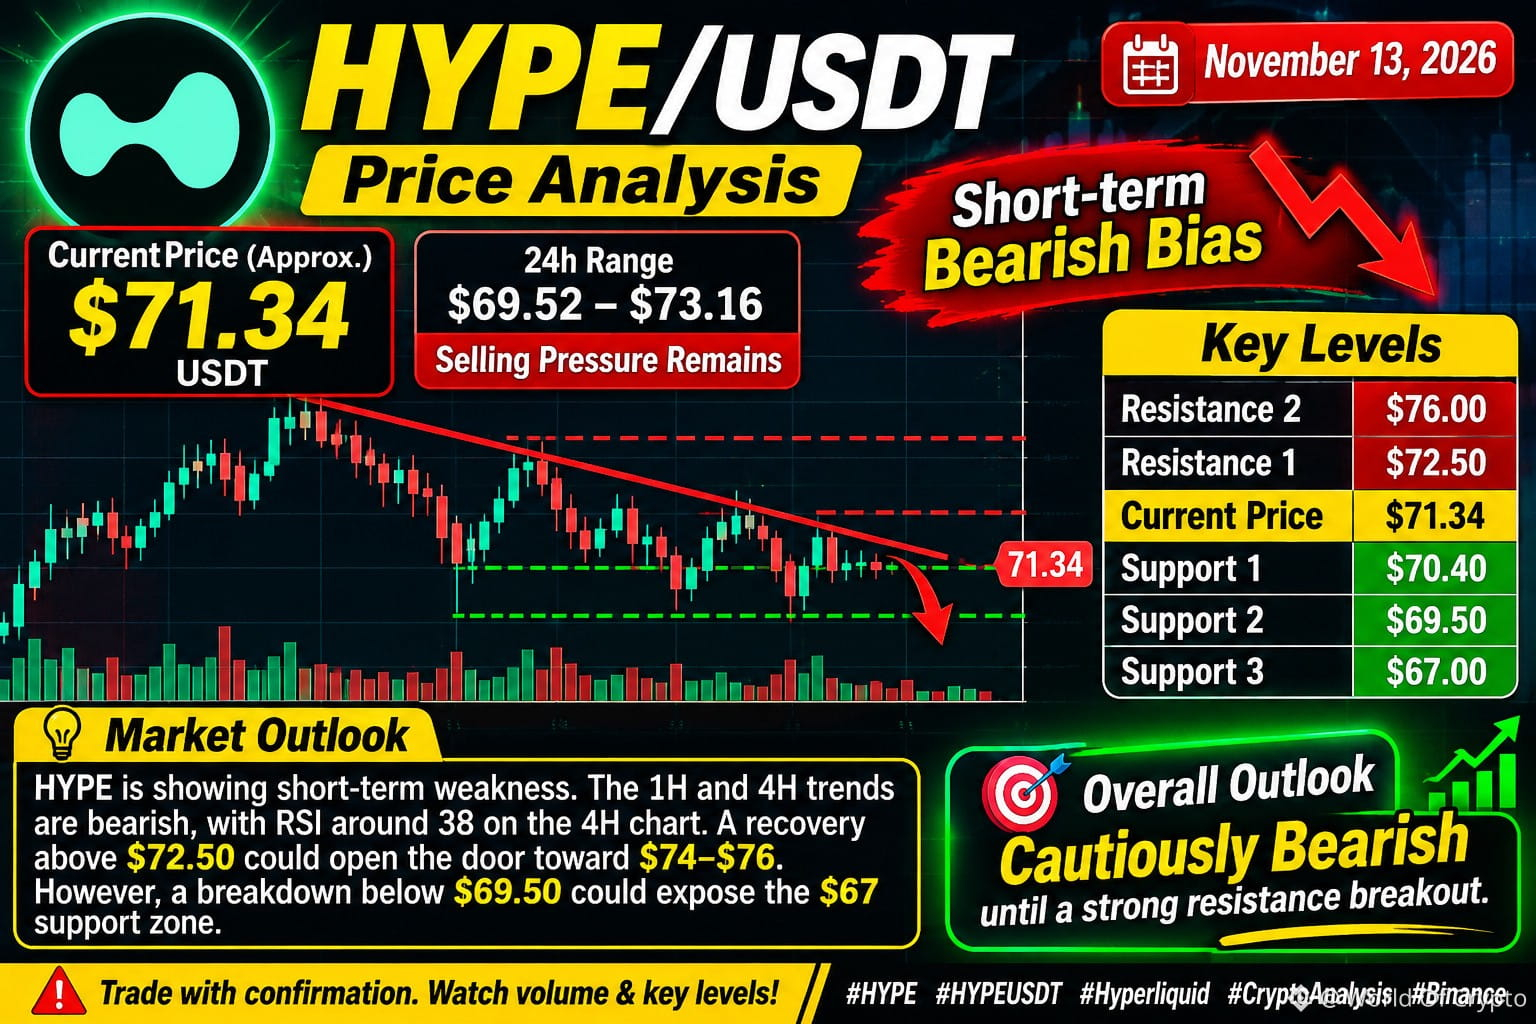
$HYPE /USDT Price Analysis | November 13, 2026
HYPE is currently trading around $71.34, showing short-term bearish momentum after facing selling pressure near the $73 resistance zone. The immediate support is around $70.40–$69.50, while resistance stands at $72.50, followed by $74–$76. If buyers regain control and break above $72.50, HYPE could see a bullish recovery toward $74–$76. However, a breakdown below $69.50 may trigger further downside toward $67. Traders should watch volume and confirmation before entering positions. Overall outlook: Cautiously bearish until a strong resistance breakout.
{spot}(HYPEUSDT)
#hype
$HYPE /USDT Price Analysis | November 13, 2026
HYPE is currently trading around $71.34, showing short-term bearish momentum after facing selling pressure near the $73 resistance zone. The immediate support is around $70.40–$69.50, while resistance stands at $72.50, followed by $74–$76. If buyers regain control and break above $72.50, HYPE could see a bullish recovery toward $74–$76. However, a breakdown below $69.50 may trigger further downside toward $67. Traders should watch volume and confirmation before entering positions. Overall outlook: Cautiously bearish until a strong resistance breakout.
#hype
HYPE is currently trading around $71.34, showing short-term bearish momentum after facing selling pressure near the $73 resistance zone. The immediate support is around $70.40–$69.50, while resistance stands at $72.50, followed by $74–$76. If buyers regain control and break above $72.50, HYPE could see a bullish recovery toward $74–$76. However, a breakdown below $69.50 may trigger further downside toward $67. Traders should watch volume and confirmation before entering positions. Overall outlook: Cautiously bearish until a strong resistance breakout.
#hype
1
170
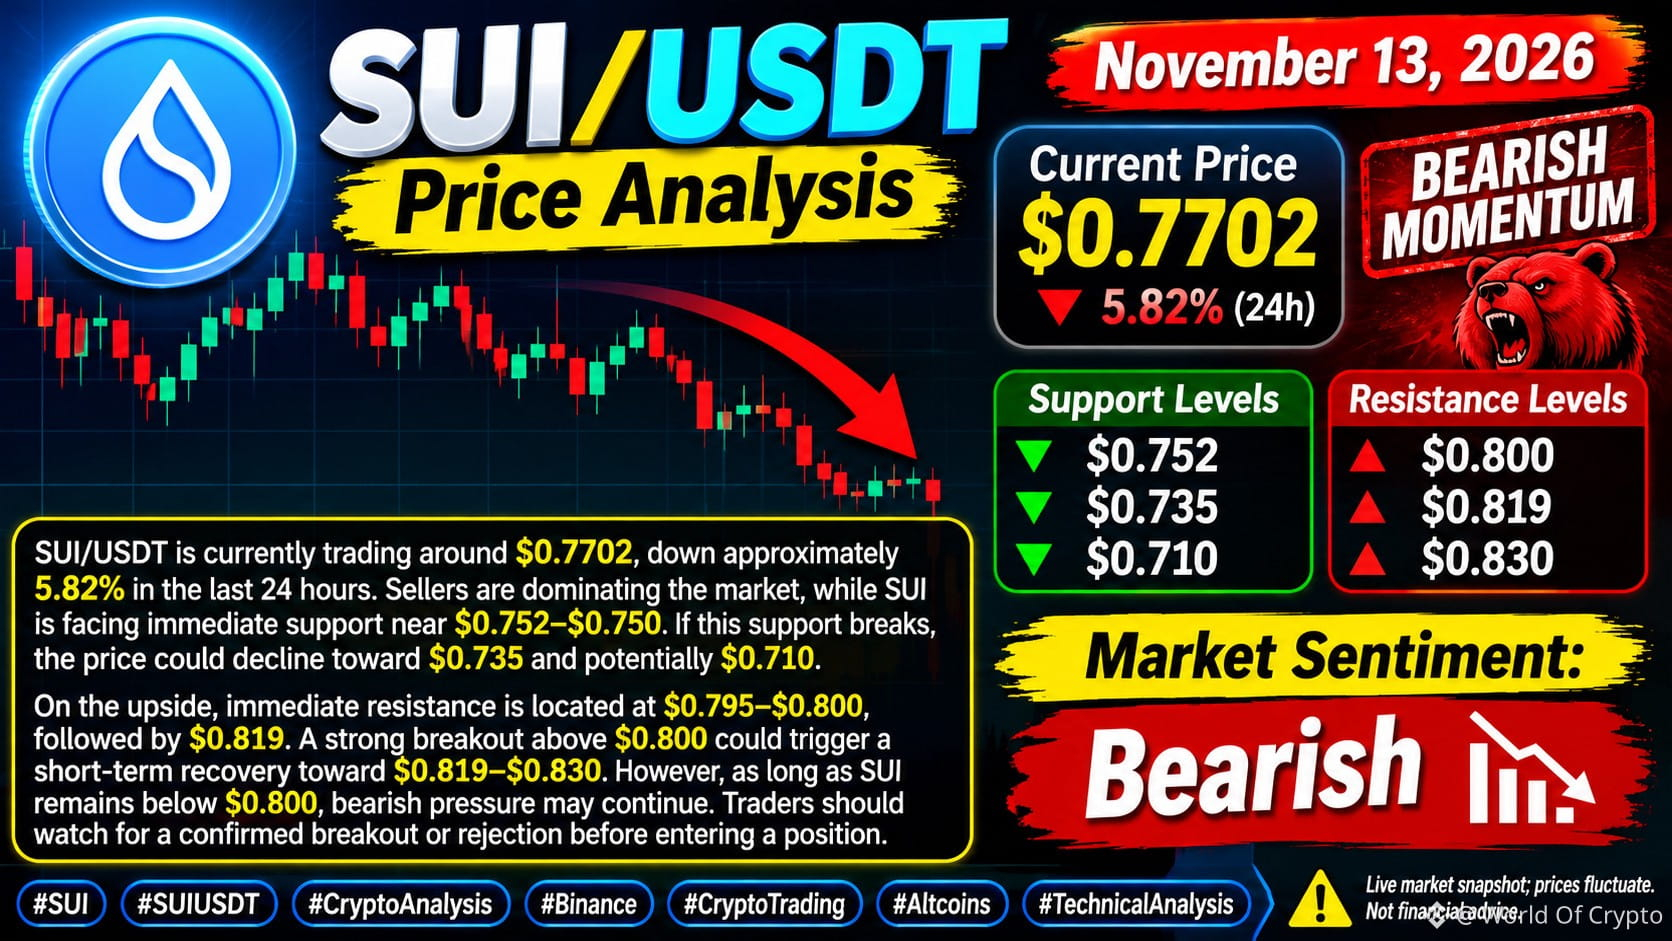
$SUI /USDT is currently trading around $0.7702, down approximately 5.82% in the last 24 hours. Sellers are dominating the market, while SUI is facing immediate support near $0.752–$0.750. If this support breaks, the price could decline toward $0.735 and potentially $0.710. On the upside, immediate resistance is located at $0.795–$0.800, followed by $0.819. A strong breakout above $0.800 could trigger a short-term recovery toward $0.819–$0.830. However, as long as SUI remains below $0.800, bearish pressure may continue. Traders should watch for a confirmed breakout or rejection before entering a position.
{spot}(SUIUSDT)
#SUİ
$SUI /USDT is currently trading around $0.7702, down approximately 5.82% in the last 24 hours. Sellers are dominating the market, while SUI is facing immediate support near $0.752–$0.750. If this support breaks, the price could decline toward $0.735 and potentially $0.710. On the upside, immediate resistance is located at $0.795–$0.800, followed by $0.819. A strong breakout above $0.800 could trigger a short-term recovery toward $0.819–$0.830. However, as long as SUI remains below $0.800, bearish pressure may continue. Traders should watch for a confirmed breakout or rejection before entering a position.
#SUİ
#SUİ
180
$BTC
{future}(BTCUSDT)
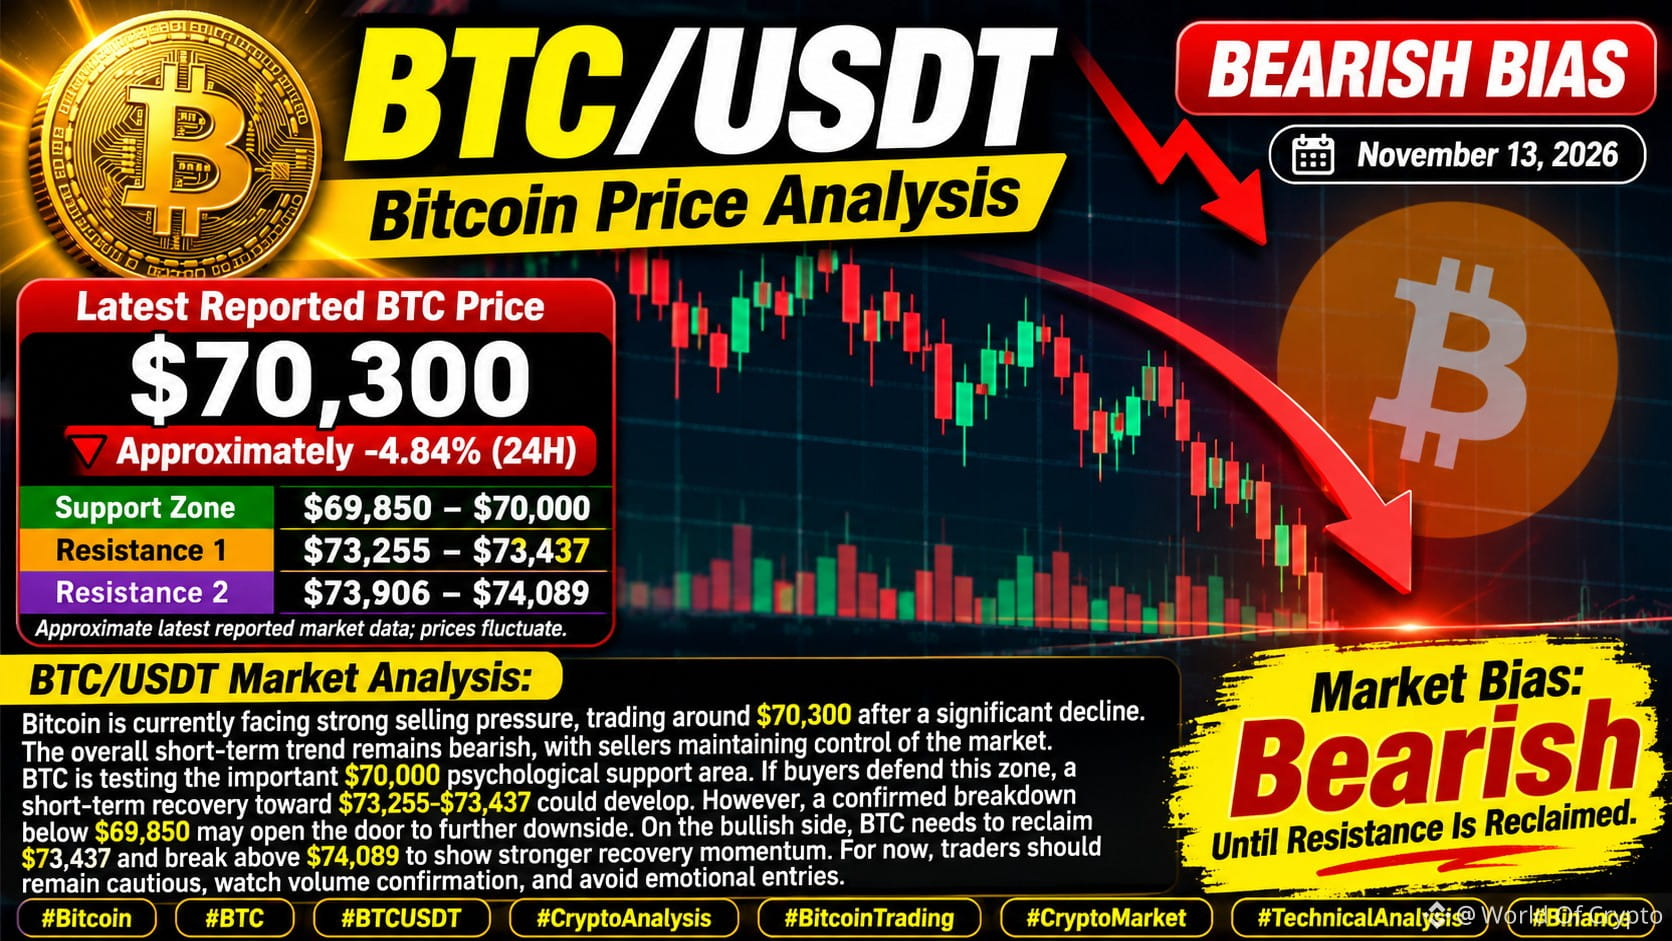
Bitcoin is currently facing strong selling pressure, trading around $70,300 after a significant decline. The overall short-term trend remains bearish, with sellers maintaining control of the market. BTC is testing the important $70,000 psychological support area. If buyers defend this zone, a short-term recovery toward $73,255–$73,437 could develop. However, a confirmed breakdown below $69,850 may open the door to further downside. On the bullish side, BTC needs to reclaim $73,437 and break above $74,089 to show stronger recovery momentum. For now, traders should remain cautious, watch volume confirmation, and avoid emotional entries. Market Bias: Bearish Until Resistance Is Reclaimed.#HuangExitNvidiaStrategyInFocus
$BTC
Bitcoin is currently facing strong selling pressure, trading around $70,300 after a significant decline. The overall short-term trend remains bearish, with sellers maintaining control of the market. BTC is testing the important $70,000 psychological support area. If buyers defend this zone, a short-term recovery toward $73,255–$73,437 could develop. However, a confirmed breakdown below $69,850 may open the door to further downside. On the bullish side, BTC needs to reclaim $73,437 and break above $74,089 to show stronger recovery momentum. For now, traders should remain cautious, watch volume confirmation, and avoid emotional entries. Market Bias: Bearish Until Resistance Is Reclaimed.#HuangExitNvidiaStrategyInFocus
Bitcoin is currently facing strong selling pressure, trading around $70,300 after a significant decline. The overall short-term trend remains bearish, with sellers maintaining control of the market. BTC is testing the important $70,000 psychological support area. If buyers defend this zone, a short-term recovery toward $73,255–$73,437 could develop. However, a confirmed breakdown below $69,850 may open the door to further downside. On the bullish side, BTC needs to reclaim $73,437 and break above $74,089 to show stronger recovery momentum. For now, traders should remain cautious, watch volume confirmation, and avoid emotional entries. Market Bias: Bearish Until Resistance Is Reclaimed.#HuangExitNvidiaStrategyInFocus
62
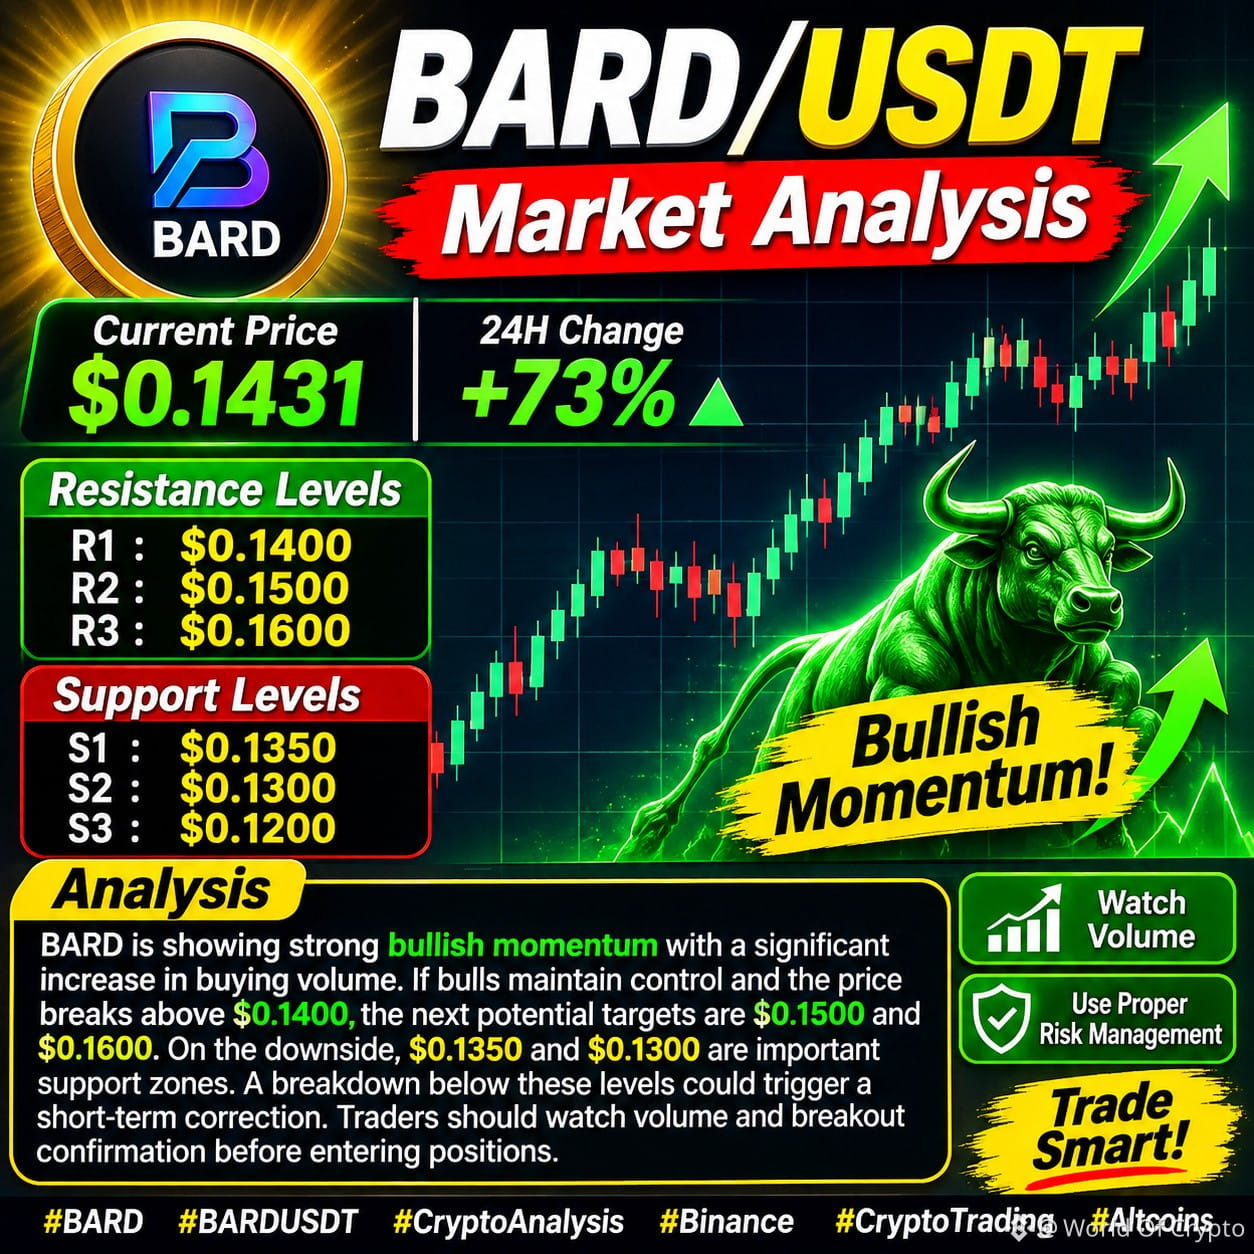
$BARD /USDT Market Analysis: BARD is showing strong bullish momentum with a significant increase in buying volume. The price is experiencing a powerful upward move, indicating growing market interest. If bulls maintain control and the price breaks above $0.1400, the next potential targets are $0.1500 and $0.1600. On the downside, $0.1350 and $0.1300 are important support zones. A breakdown below these levels could trigger a short-term correction. Traders should watch volume and breakout confirmation before entering positions. 📈 Always use proper risk management and stop-loss protection. #BARD #BARDUSDT #CryptoAnalysis
{spot}(BARDUSDT)
$BARD /USDT Market Analysis: BARD is showing strong bullish momentum with a significant increase in buying volume. The price is experiencing a powerful upward move, indicating growing market interest. If bulls maintain control and the price breaks above $0.1400, the next potential targets are $0.1500 and $0.1600. On the downside, $0.1350 and $0.1300 are important support zones. A breakdown below these levels could trigger a short-term correction. Traders should watch volume and breakout confirmation before entering positions. 📈 Always use proper risk management and stop-loss protection. #BARD #BARDUSDT #CryptoAnalysis
154
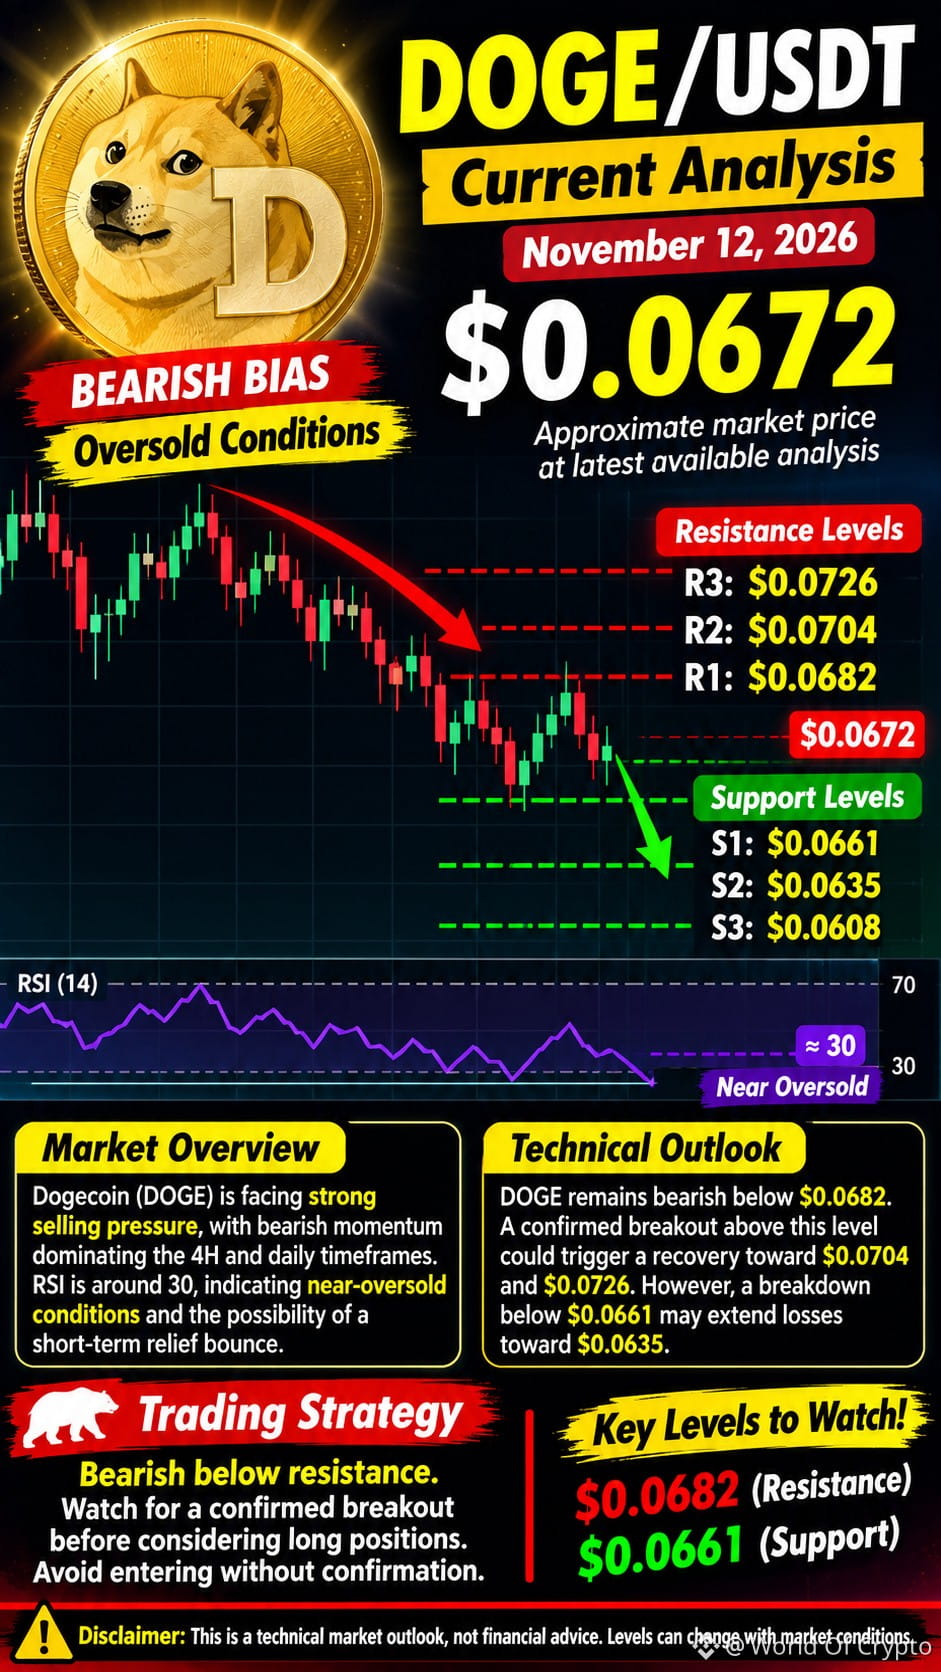
$DOGE remains bearish below $0.0682. A confirmed breakout above this level could trigger a recovery toward $0.0704 and $0.0726. However, a breakdown below $0.0661 may extend losses toward $0.0635.
Trading Strategy: Bearish below resistance. Watch for a confirmed breakout before considering long positions. Avoid entering without confirmation.
{spot}(DOGEUSDT)
#AnthropicRejectsIPODelayValuationinQuestion
$DOGE remains bearish below $0.0682. A confirmed breakout above this level could trigger a recovery toward $0.0704 and $0.0726. However, a breakdown below $0.0661 may extend losses toward $0.0635.
Trading Strategy: Bearish below resistance. Watch for a confirmed breakout before considering long positions. Avoid entering without confirmation.
#AnthropicRejectsIPODelayValuationinQuestion
Trading Strategy: Bearish below resistance. Watch for a confirmed breakout before considering long positions. Avoid entering without confirmation.
#AnthropicRejectsIPODelayValuationinQuestion
82
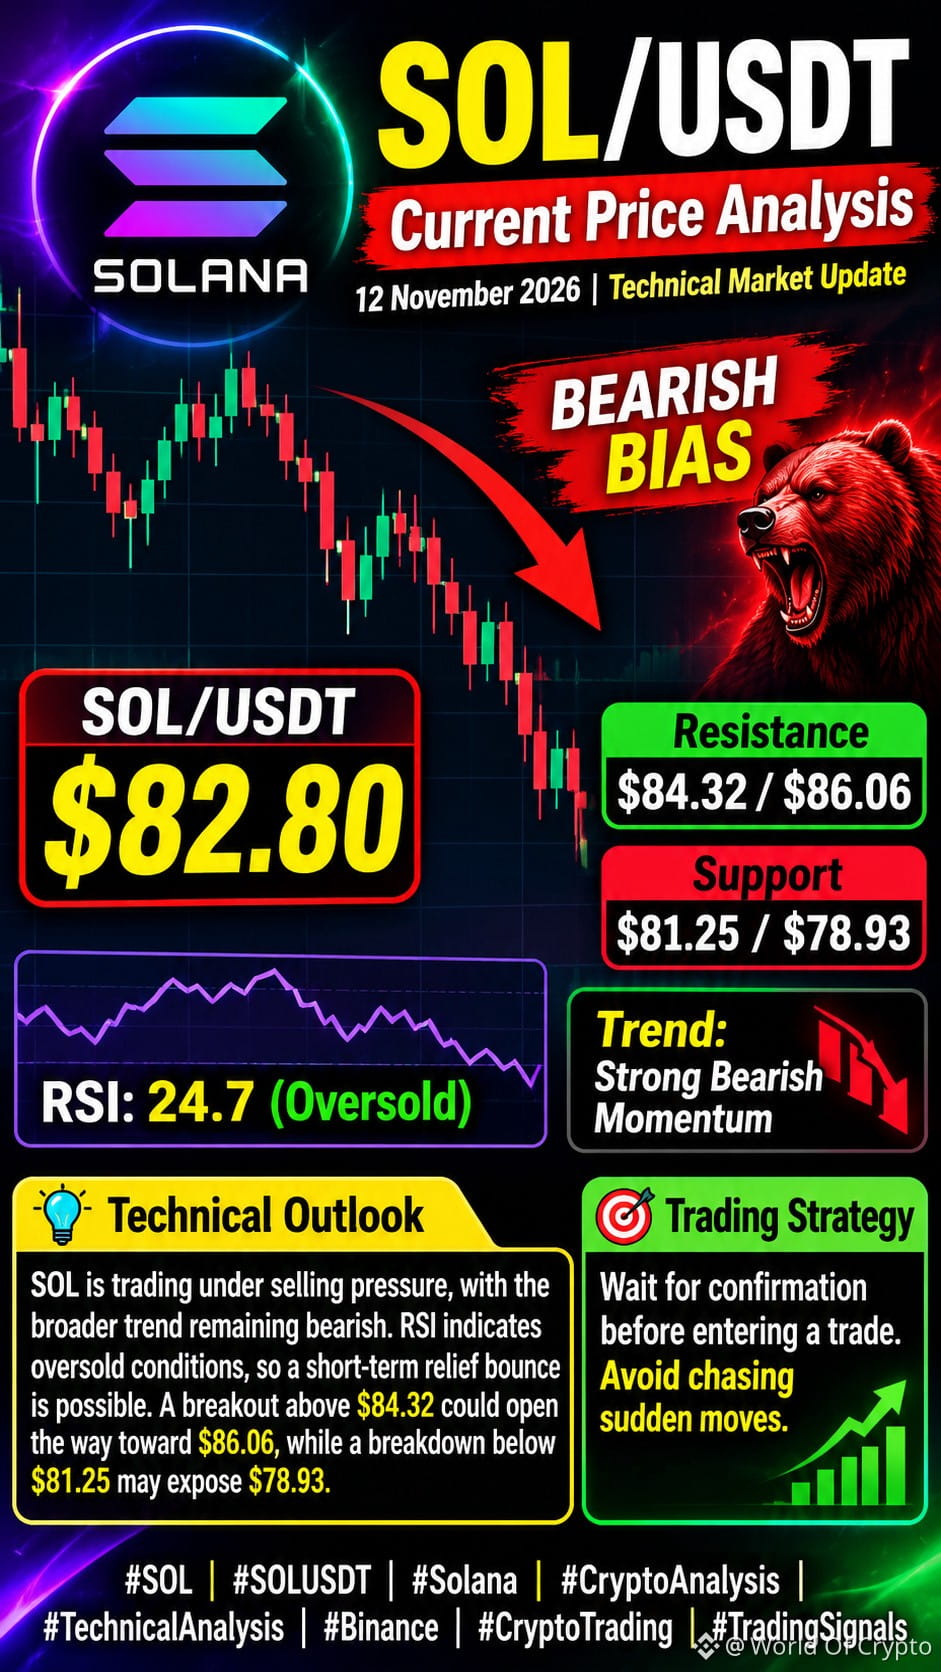
$SOL is trading under selling pressure, with the broader trend remaining bearish. RSI indicates oversold conditions, so a short-term relief bounce is possible. A breakout above $84.32 could open the way toward $86.06, while a breakdown below $81.25 may expose $78.93.
Trading Strategy: Wait for confirmation before entering a trade. Avoid chasing sudden moves.
{spot}(SOLUSDT)
#AnthropicRejectsIPODelayValuationinQuestion
$SOL is trading under selling pressure, with the broader trend remaining bearish. RSI indicates oversold conditions, so a short-term relief bounce is possible. A breakout above $84.32 could open the way toward $86.06, while a breakdown below $81.25 may expose $78.93.
Trading Strategy: Wait for confirmation before entering a trade. Avoid chasing sudden moves.
#AnthropicRejectsIPODelayValuationinQuestion
Trading Strategy: Wait for confirmation before entering a trade. Avoid chasing sudden moves.
#AnthropicRejectsIPODelayValuationinQuestion
65
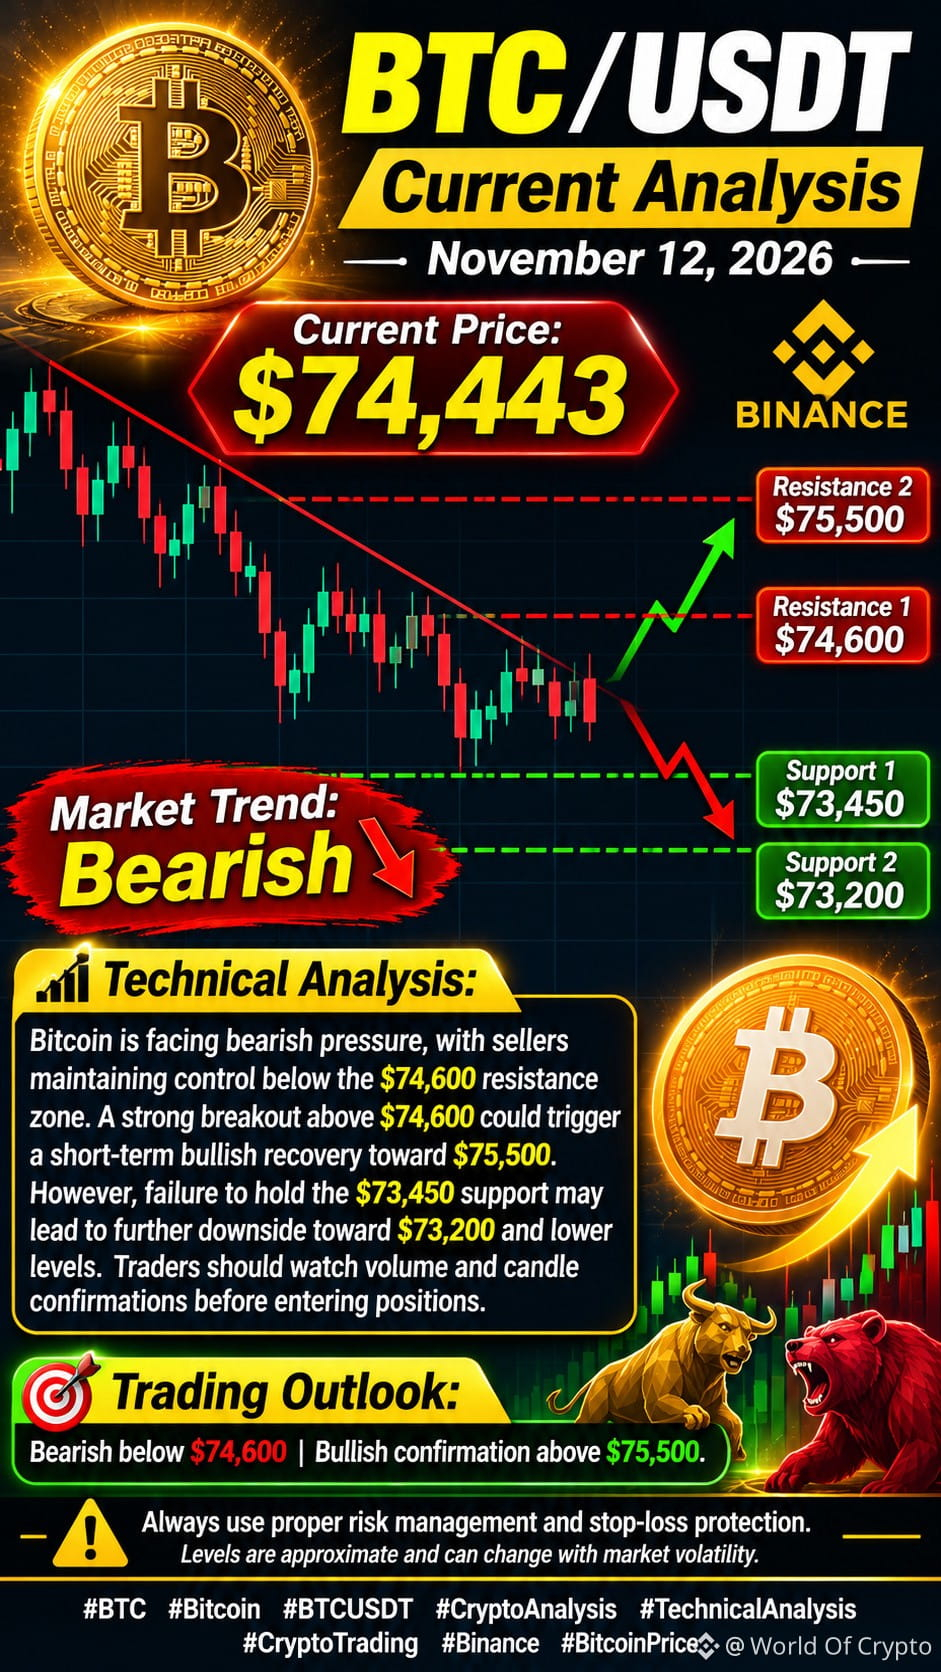
$BTC Bitcoin is facing bearish pressure, with sellers maintaining control below the $74,600 resistance zone. A strong breakout above $74,600 could trigger a short-term bullish recovery toward $75,500. However, failure to hold the $73,450 support may lead to further downside toward $73,200 and lower levels. Traders should watch volume and candle confirmations before entering positions.
Trading Outlook: Bearish below $74,600 | Bullish confirmation above $75,500.
{spot}(BTCUSDT)
#AnthropicRejectsIPODelayValuationinQuestion
$BTC Bitcoin is facing bearish pressure, with sellers maintaining control below the $74,600 resistance zone. A strong breakout above $74,600 could trigger a short-term bullish recovery toward $75,500. However, failure to hold the $73,450 support may lead to further downside toward $73,200 and lower levels. Traders should watch volume and candle confirmations before entering positions.
Trading Outlook: Bearish below $74,600 | Bullish confirmation above $75,500.
#AnthropicRejectsIPODelayValuationinQuestion
Trading Outlook: Bearish below $74,600 | Bullish confirmation above $75,500.
#AnthropicRejectsIPODelayValuationinQuestion
62
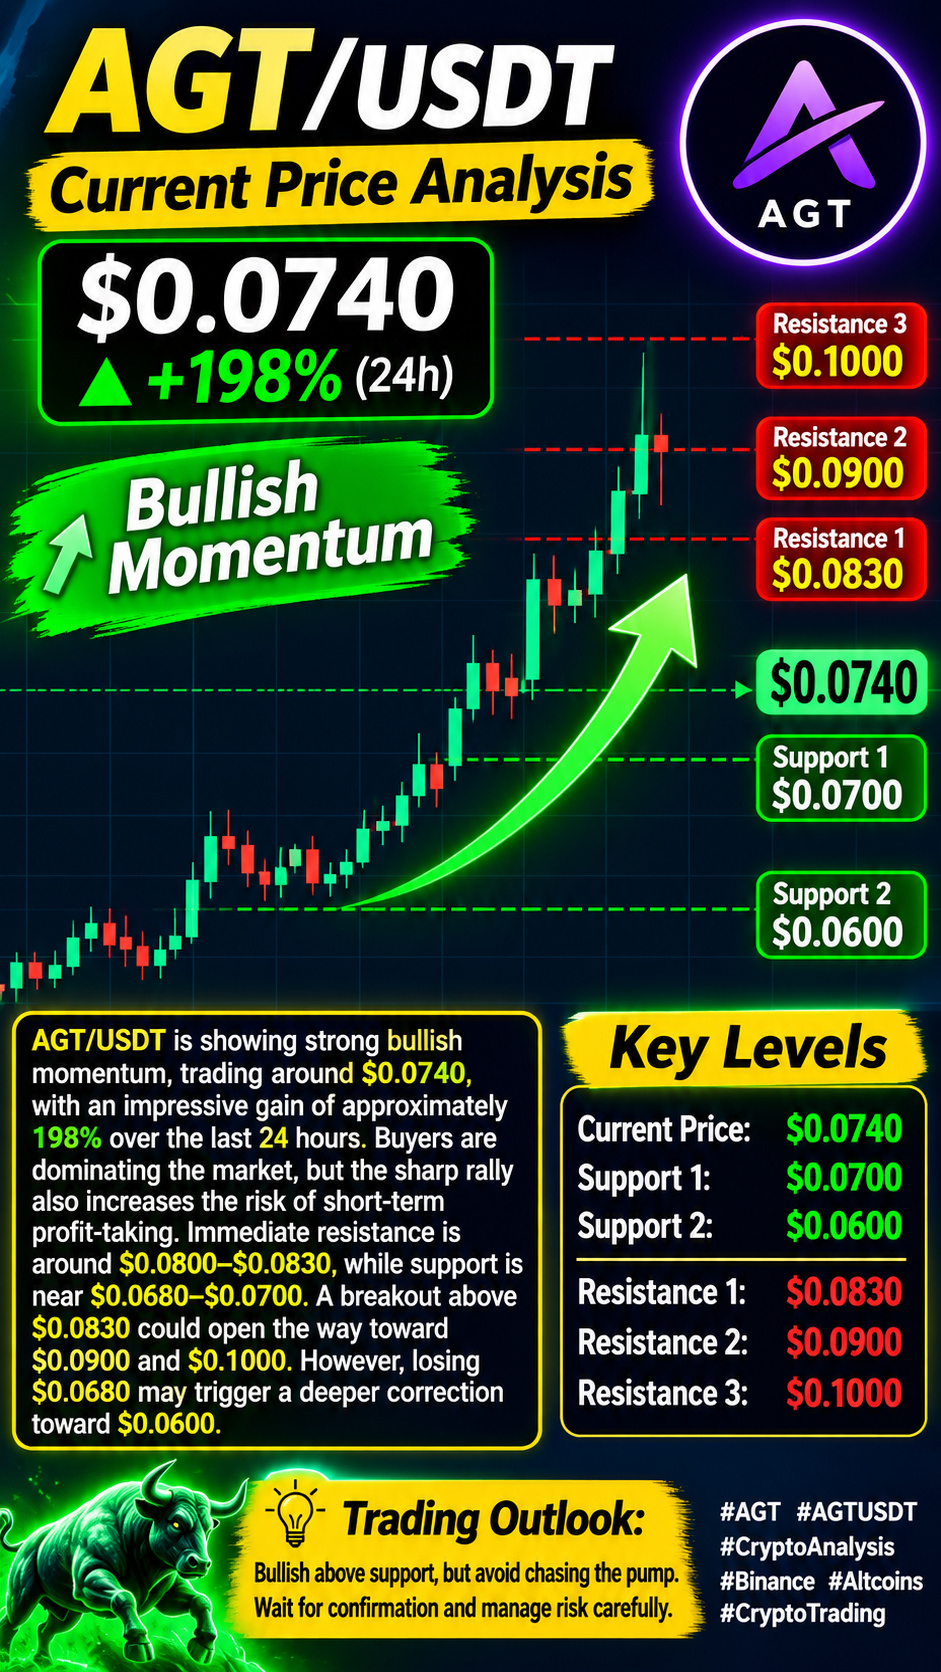
$AGT /USDT is showing strong bullish momentum, trading around $0.0740, with an impressive gain of approximately 198% over the last 24 hours. Buyers are dominating the market, but the sharp rally also increases the risk of short-term profit-taking. Immediate resistance is around $0.0800–$0.0830, while support is near $0.0680–$0.0700. A breakout above $0.0830 could open the way toward $0.0900 and $0.1000. However, losing $0.0680 may trigger a deeper correction toward $0.0600. Trading Outlook: Bullish above support, but avoid chasing the pump. Wait for confirmation and manage risk carefully.
{future}(AGTUSDT)
#AGTtothemoon
$AGT /USDT is showing strong bullish momentum, trading around $0.0740, with an impressive gain of approximately 198% over the last 24 hours. Buyers are dominating the market, but the sharp rally also increases the risk of short-term profit-taking. Immediate resistance is around $0.0800–$0.0830, while support is near $0.0680–$0.0700. A breakout above $0.0830 could open the way toward $0.0900 and $0.1000. However, losing $0.0680 may trigger a deeper correction toward $0.0600. Trading Outlook: Bullish above support, but avoid chasing the pump. Wait for confirmation and manage risk carefully.
#AGTtothemoon
#AGTtothemoon
209
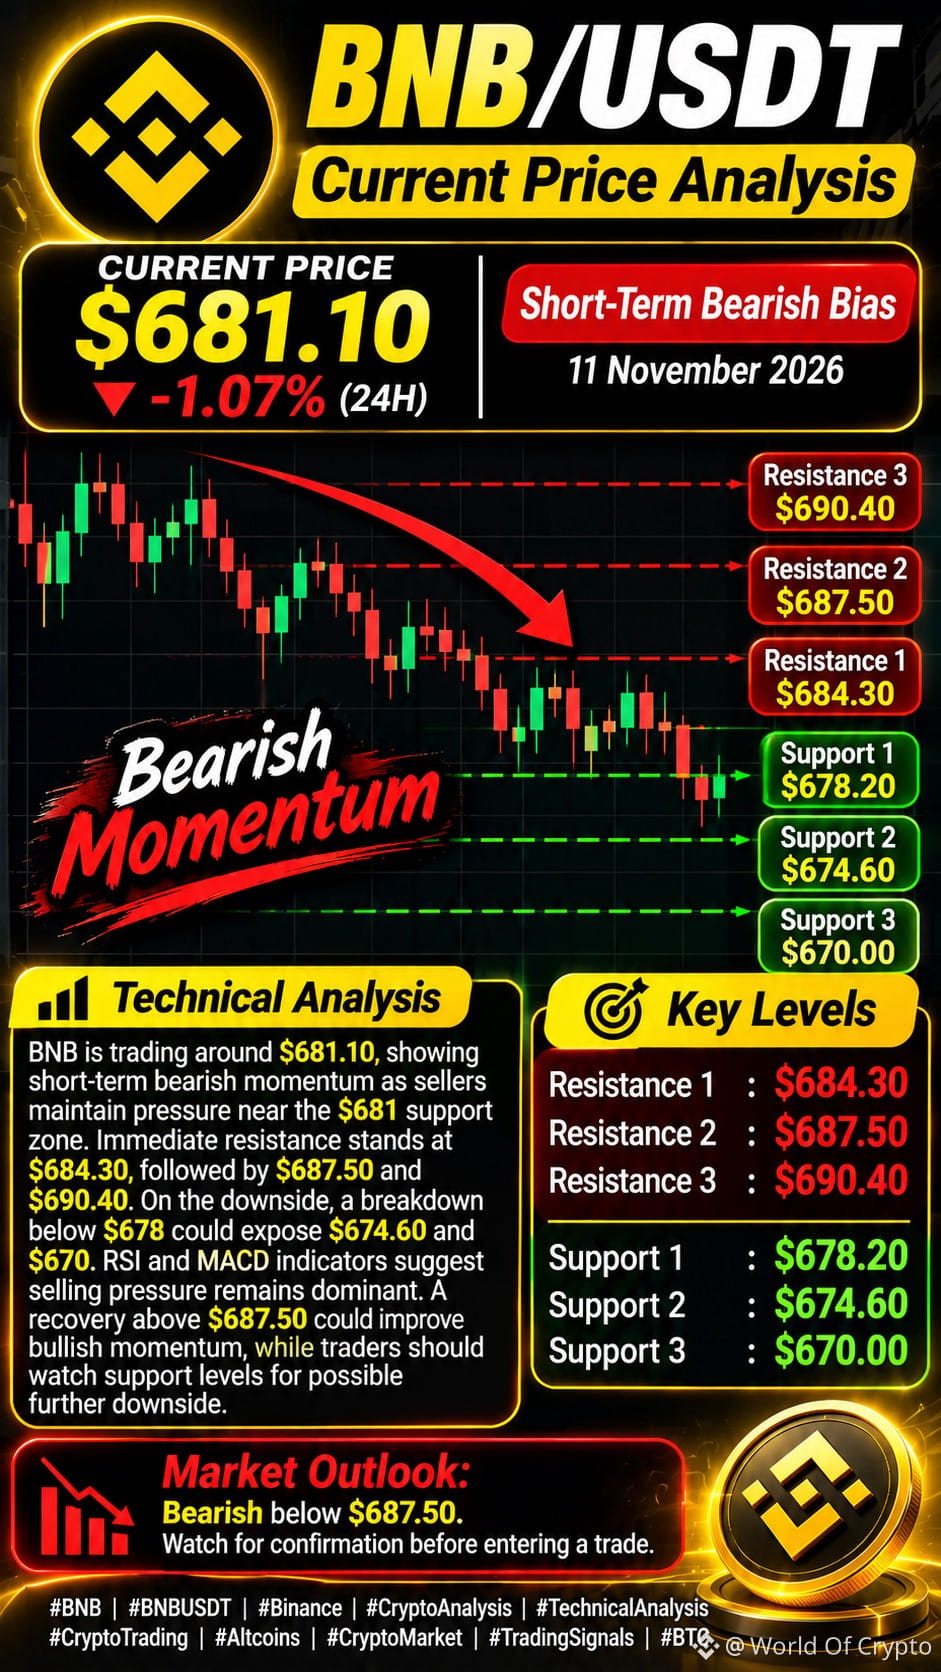
$BNB /USDT — Technical Analysis
BNB is trading around $681.10, showing short-term bearish momentum as sellers maintain pressure near the $681 support zone. Immediate resistance stands at $684.30, followed by $687.50 and $690.40. On the downside, a breakdown below $678 could expose $674.60 and $670. RSI and MACD indicators suggest selling pressure remains dominant. A recovery above $687.50 could improve bullish momentum, while traders should watch support levels for possible further downside.
Market Outlook: Bearish below $687.50. Watch for confirmation before entering a trade.
#HotCPIDecemberHikePriced
{spot}(BNBUSDT)
$BNB /USDT — Technical Analysis
BNB is trading around $681.10, showing short-term bearish momentum as sellers maintain pressure near the $681 support zone. Immediate resistance stands at $684.30, followed by $687.50 and $690.40. On the downside, a breakdown below $678 could expose $674.60 and $670. RSI and MACD indicators suggest selling pressure remains dominant. A recovery above $687.50 could improve bullish momentum, while traders should watch support levels for possible further downside.
Market Outlook: Bearish below $687.50. Watch for confirmation before entering a trade.
#HotCPIDecemberHikePriced
BNB is trading around $681.10, showing short-term bearish momentum as sellers maintain pressure near the $681 support zone. Immediate resistance stands at $684.30, followed by $687.50 and $690.40. On the downside, a breakdown below $678 could expose $674.60 and $670. RSI and MACD indicators suggest selling pressure remains dominant. A recovery above $687.50 could improve bullish momentum, while traders should watch support levels for possible further downside.
Market Outlook: Bearish below $687.50. Watch for confirmation before entering a trade.
#HotCPIDecemberHikePriced
27
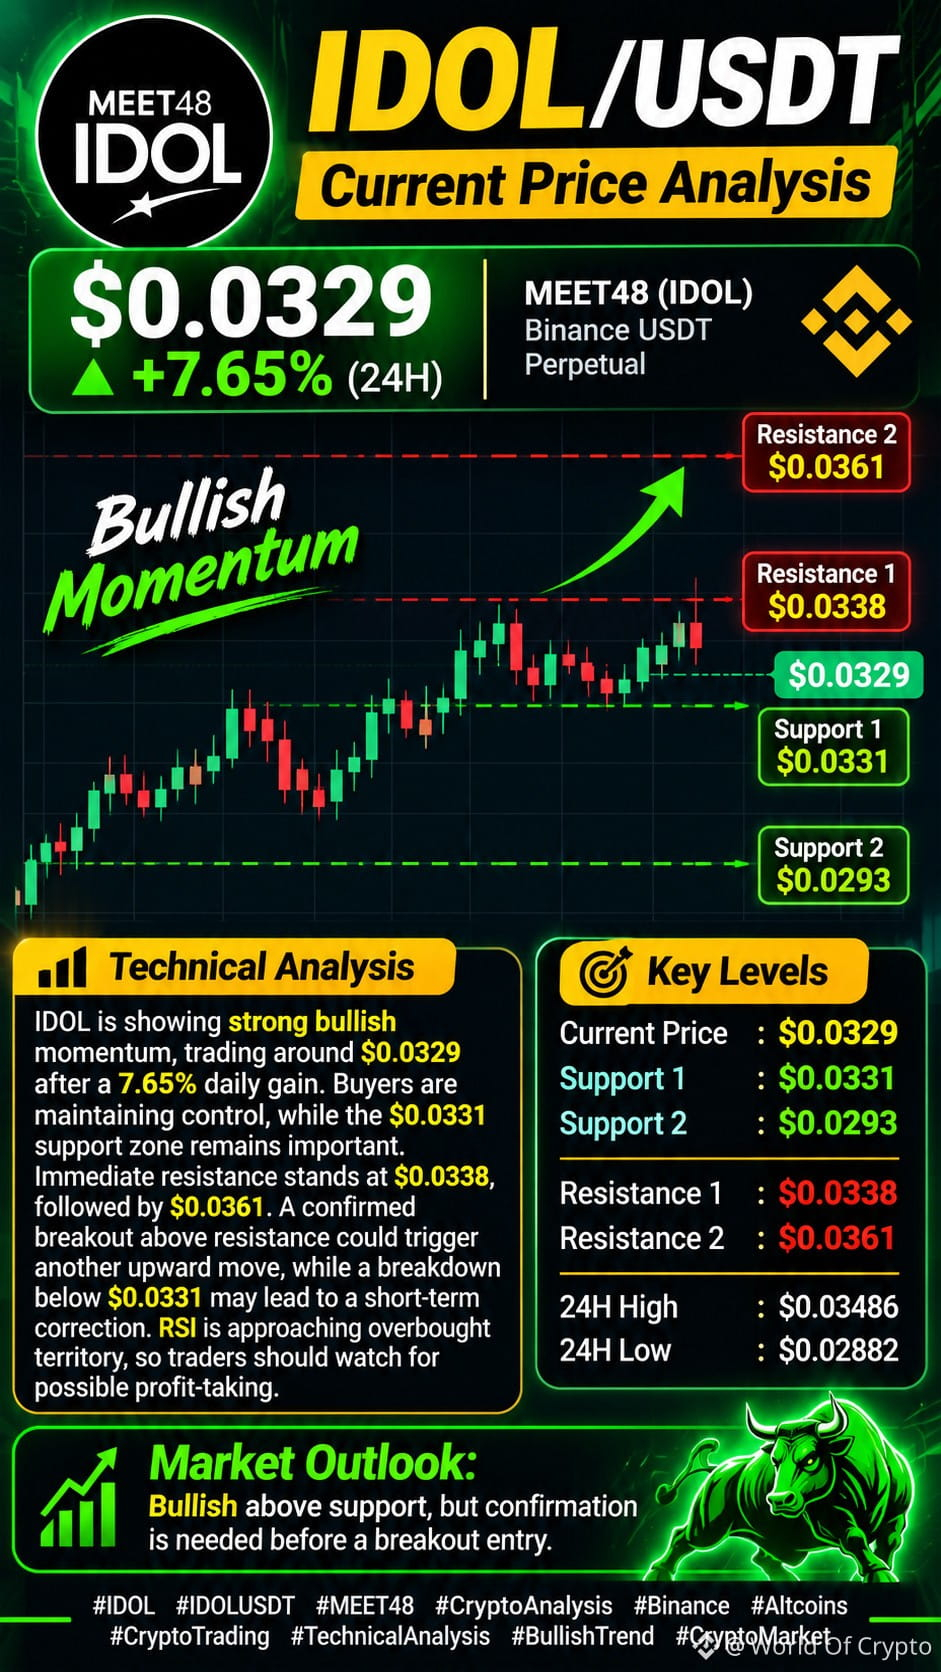
$IDOL is showing strong bullish momentum, trading around $0.0329 after a 7.65% daily gain. Buyers are maintaining control, while the $0.0331 support zone remains important. Immediate resistance stands at $0.0338, followed by $0.0361. A confirmed breakout above resistance could trigger another upward move, while a breakdown below $0.0331 may lead to a short-term correction. RSI is approaching overbought territory, so traders should watch for possible profit-taking.#AnthropicRejectsIPODelayValuationinQuestion
{future}(IDOLUSDT)
$IDOL is showing strong bullish momentum, trading around $0.0329 after a 7.65% daily gain. Buyers are maintaining control, while the $0.0331 support zone remains important. Immediate resistance stands at $0.0338, followed by $0.0361. A confirmed breakout above resistance could trigger another upward move, while a breakdown below $0.0331 may lead to a short-term correction. RSI is approaching overbought territory, so traders should watch for possible profit-taking.#AnthropicRejectsIPODelayValuationinQuestion
346
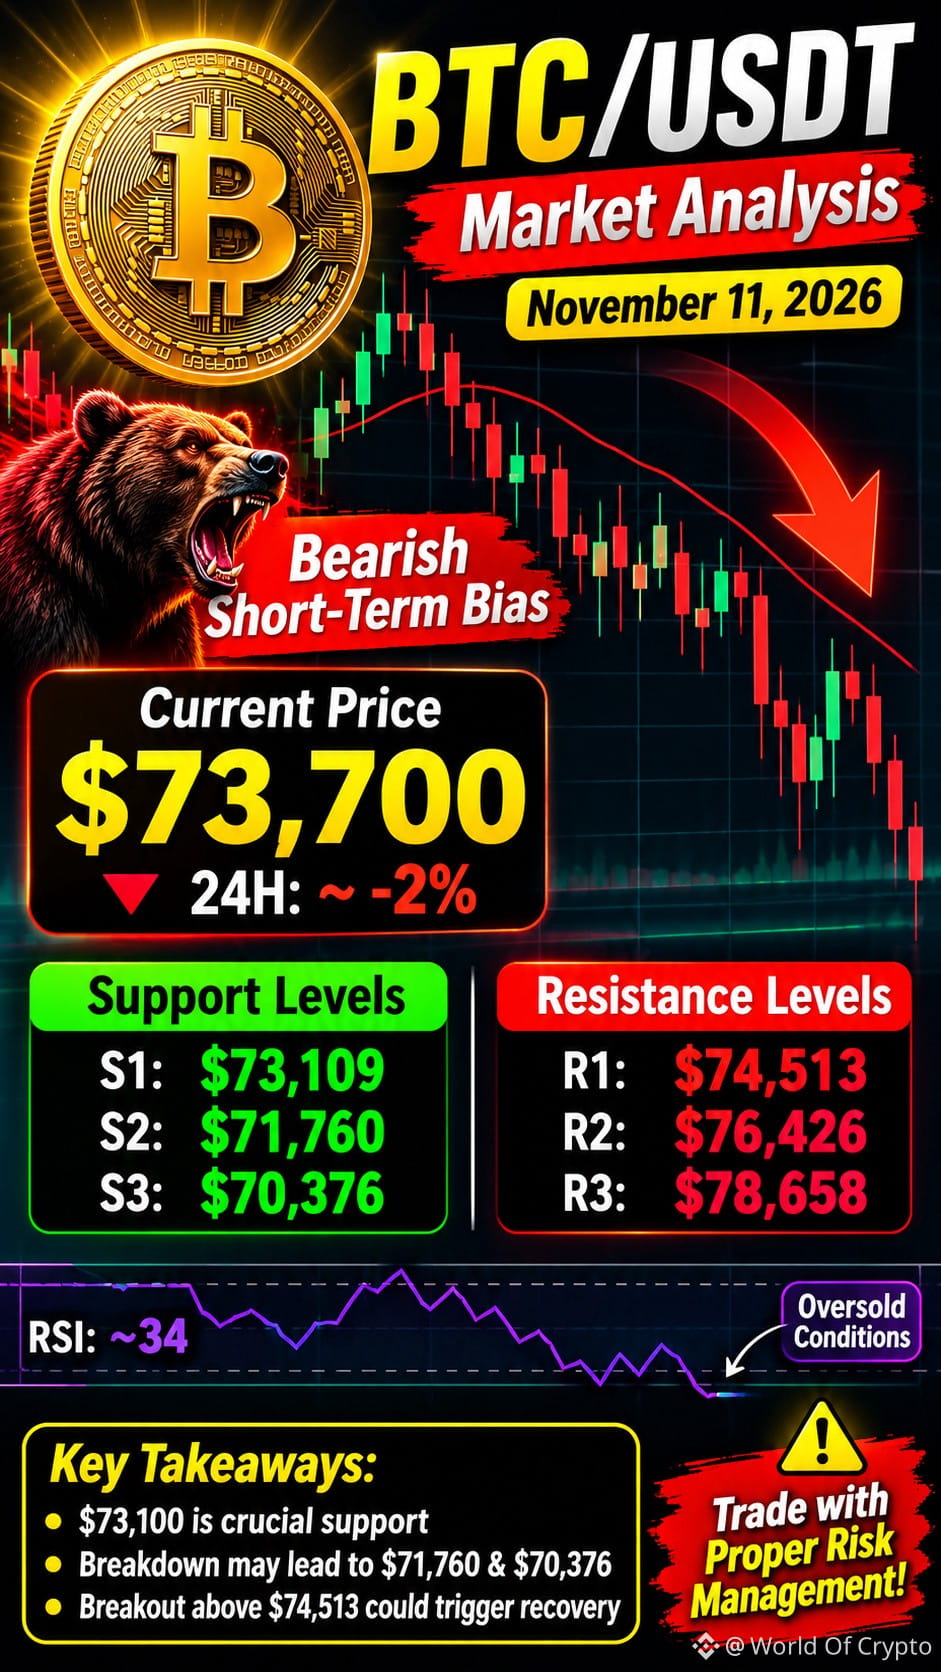
$BTC Bitcoin is facing strong selling pressure, trading around $73,700 with a bearish short-term market structure. The $73,100 support zone is crucial; a breakdown could expose $71,760 and $70,376. On the upside, $74,513 and $76,426 are important resistance levels. RSI near 34 indicates weak momentum and possible oversold conditions. A breakout above $74,513 could trigger a short-term recovery, while a confirmed breakdown below $73,100 may extend the bearish trend.
Market Bias: Bearish 📉
Support: $73,100 | $71,760 | $70,376
Resistance: $74,513 | $76,426 | $78,658
#HotCPIDecemberHikePriced
{spot}(BTCUSDT)
$BTC Bitcoin is facing strong selling pressure, trading around $73,700 with a bearish short-term market structure. The $73,100 support zone is crucial; a breakdown could expose $71,760 and $70,376. On the upside, $74,513 and $76,426 are important resistance levels. RSI near 34 indicates weak momentum and possible oversold conditions. A breakout above $74,513 could trigger a short-term recovery, while a confirmed breakdown below $73,100 may extend the bearish trend.
Market Bias: Bearish 📉
Support: $73,100 | $71,760 | $70,376
Resistance: $74,513 | $76,426 | $78,658
#HotCPIDecemberHikePriced
Market Bias: Bearish 📉
Support: $73,100 | $71,760 | $70,376
Resistance: $74,513 | $76,426 | $78,658
#HotCPIDecemberHikePriced
60
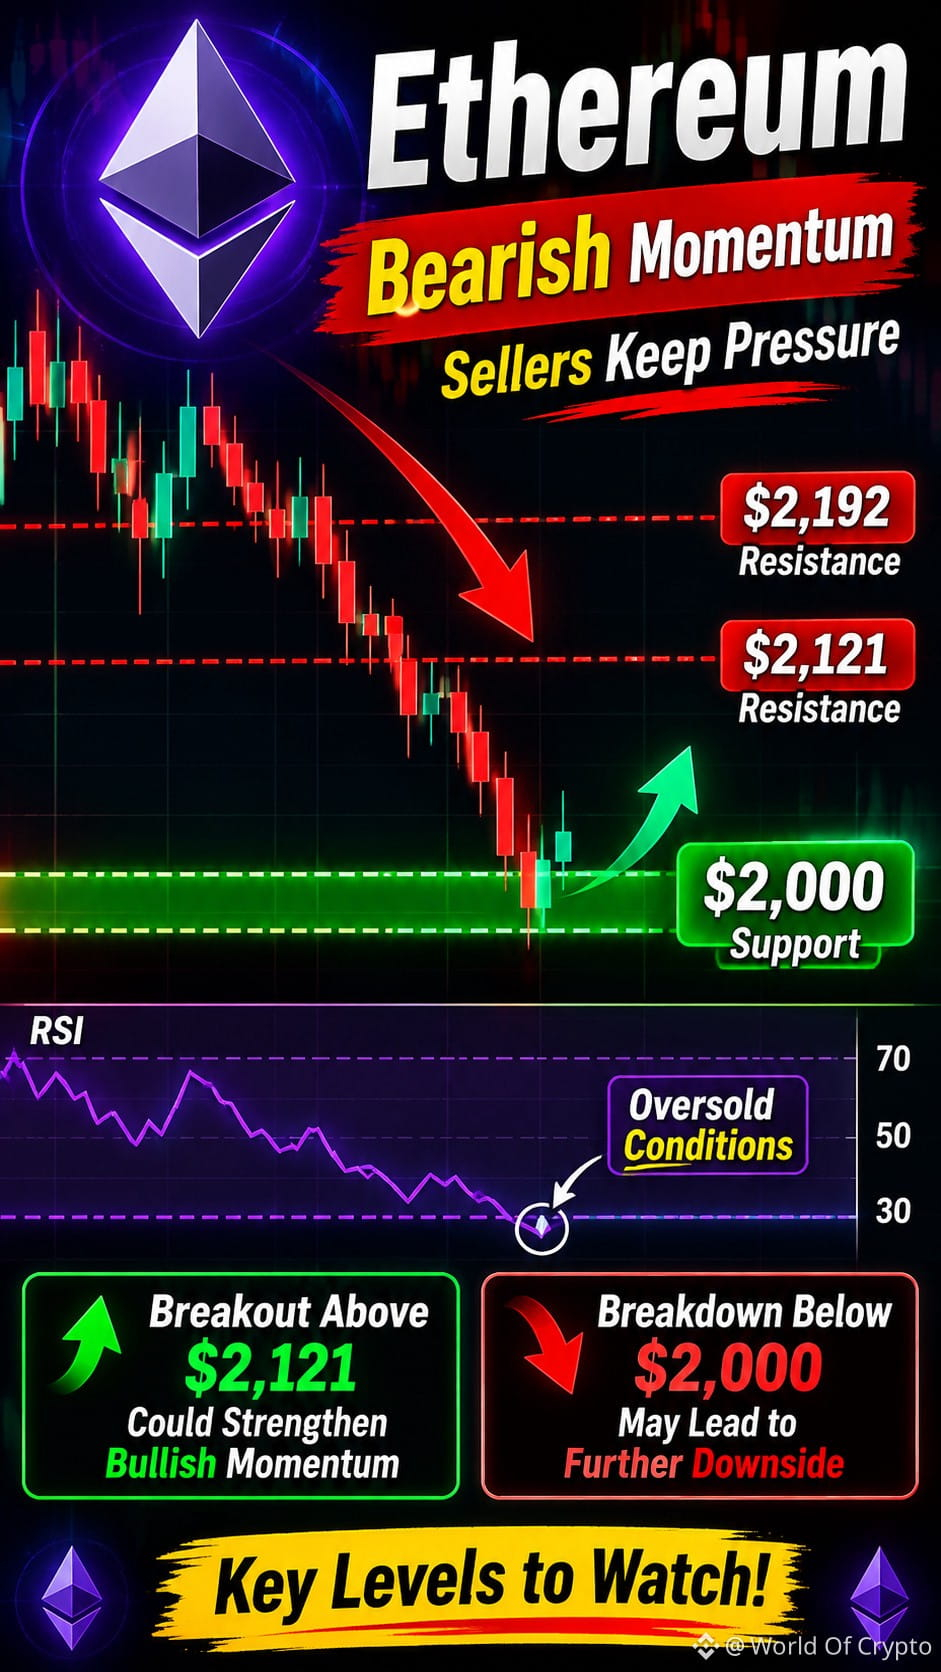
$ETH Ethereum is showing bearish momentum, with sellers maintaining pressure below key resistance levels. The $2,000 support zone is crucial, while $2,121 and $2,192 remain important resistance levels. RSI indicates oversold conditions, suggesting a possible short-term recovery. A breakout above $2,121 could strengthen bullish momentum, while a breakdown below $2,000 may lead to further downside.
{spot}(ETHUSDT)
#BitcoinFiveWeeklyLosses
$ETH Ethereum is showing bearish momentum, with sellers maintaining pressure below key resistance levels. The $2,000 support zone is crucial, while $2,121 and $2,192 remain important resistance levels. RSI indicates oversold conditions, suggesting a possible short-term recovery. A breakout above $2,121 could strengthen bullish momentum, while a breakdown below $2,000 may lead to further downside.
#BitcoinFiveWeeklyLosses
#BitcoinFiveWeeklyLosses
96
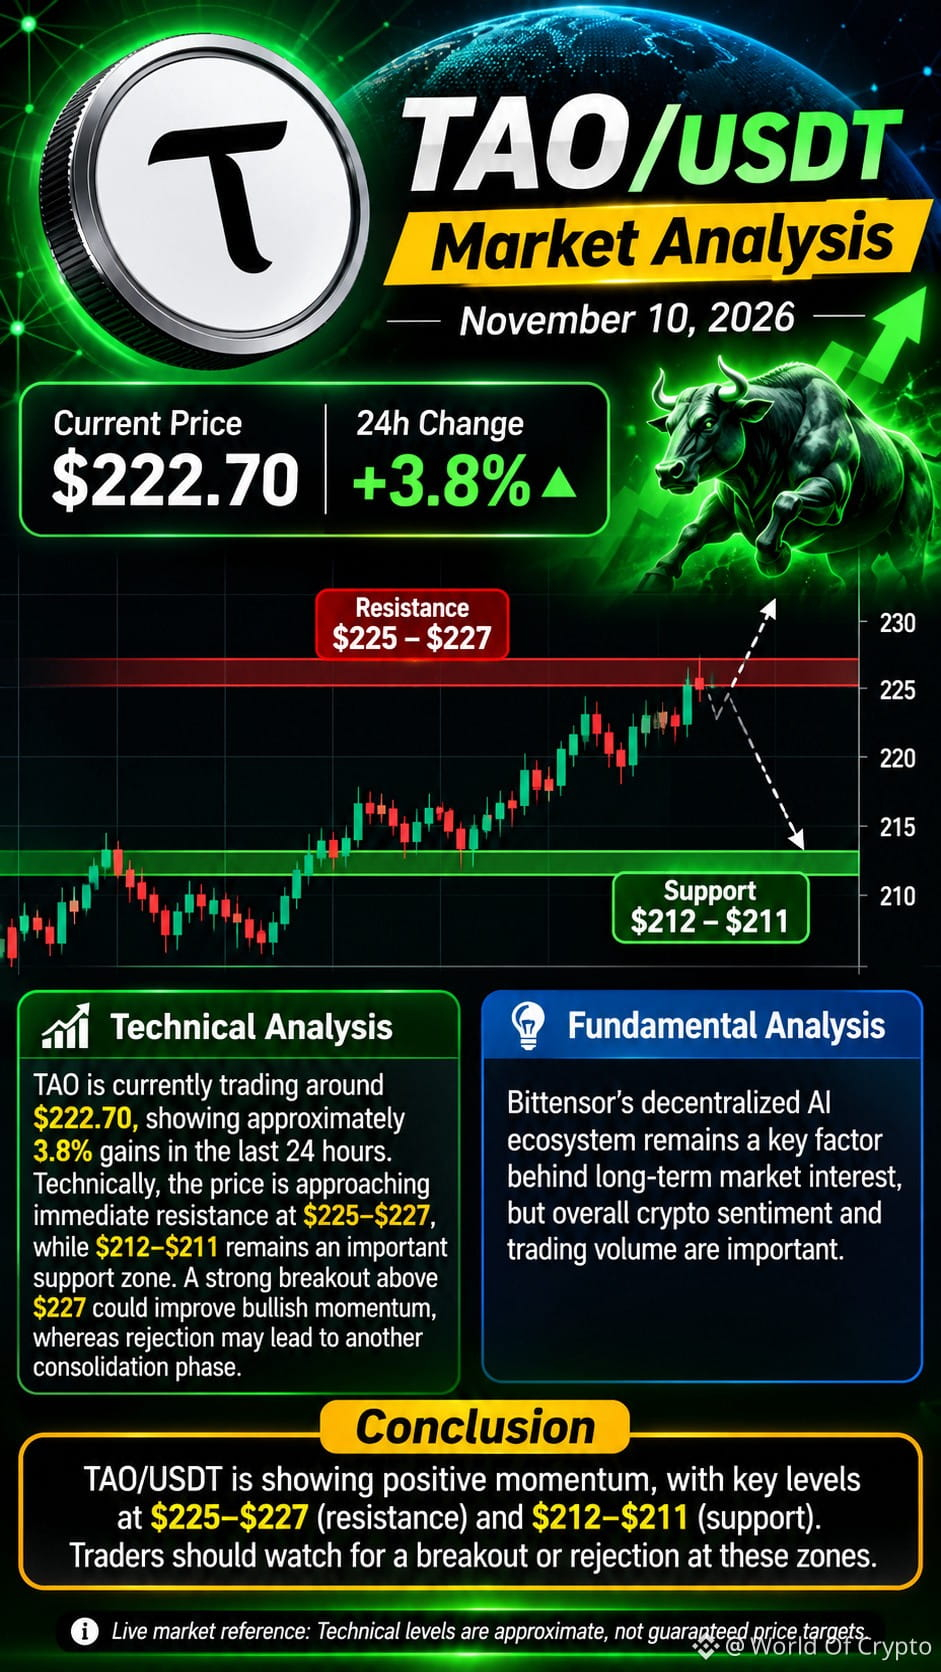
$TAO is currently trading around $222.70, showing approximately 3.8% gains in the last 24 hours. Technically, the price is approaching immediate resistance at $225–$227, while $212–$211 remains an important support zone. A strong breakout above $227 could improve bullish momentum, whereas rejection may lead to another consolidation phase. Fundamentally, Bittensor's decentralized AI ecosystem remains a key factor behind long-term market interest, but overall crypto sentiment and trading volume remain important.
{spot}(TAOUSDT)
#CPITestsDecemberRateOutlook
$TAO is currently trading around $222.70, showing approximately 3.8% gains in the last 24 hours. Technically, the price is approaching immediate resistance at $225–$227, while $212–$211 remains an important support zone. A strong breakout above $227 could improve bullish momentum, whereas rejection may lead to another consolidation phase. Fundamentally, Bittensor's decentralized AI ecosystem remains a key factor behind long-term market interest, but overall crypto sentiment and trading volume remain important.
#CPITestsDecemberRateOutlook
#CPITestsDecemberRateOutlook
160
Log in to explore more content
Join global crypto users on Binance Square
⚡️ Get latest and useful information about crypto.
💬 Trusted by the world’s largest crypto exchange.
👍 Discover real insights from verified creators.
Email / Phone number
Trending Topics
CryptoSelloffTriggersMultipleWhaleLiquidations
21,450 views
411 Discussing
Crypto Liquidations Top $2B in 24 Hours as 329,000 Traders Are Wiped Out
Binance News
·19 Likes
·12.5k views
USSpotXRPETFsSeeLargestWeeklyOutflowIn8Months
58,063 views
731 Discussing
WillFOMCMinutesReinforceRateHikeExpectations?
5,298 views
152 Discussing