
芳子 FangZi888
3.5k Posts

芳子 FangZi888
Report
Block User
從小白到大白的路上, 讓我們一起學習成長, 分享的文章都是在幣圈的經驗
BP-363BD654D236
Open Trade

BTC Holder
Frequent Trader
5 Years
3.6K+ Following
2.8K+ Followers
1.3K+ Liked
Posts
Portfolio
All
Quotes
Live
·
--
Keep an eye on USDT inflows and outflows—it knows best whether funds from outside the exchange are coming in.
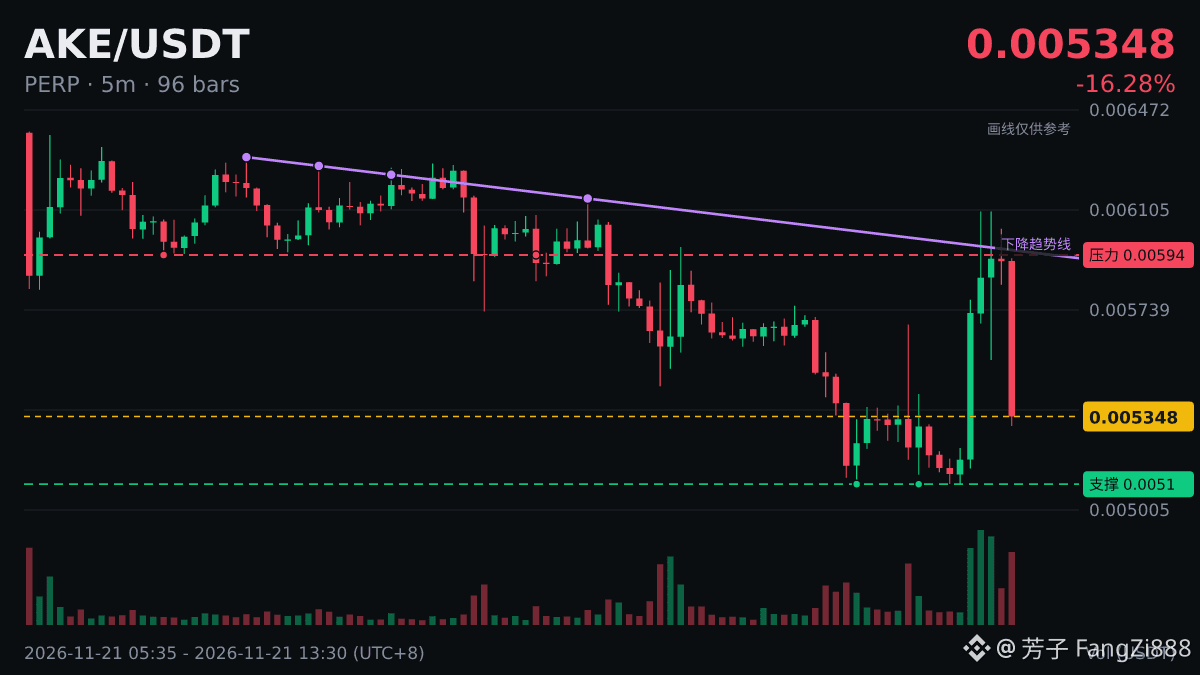
$AKE is down 9.23% in 5 minutes and 49.57% in 24 hours. Do you have any friends who are trading it?
Keep an eye on USDT inflows and outflows—it knows best whether funds from outside the exchange are coming in.
$AKE is down 9.23% in 5 minutes and 49.57% in 24 hours. Do you have any friends who are trading it?
$AKE is down 9.23% in 5 minutes and 49.57% in 24 hours. Do you have any friends who are trading it?
130
·
--
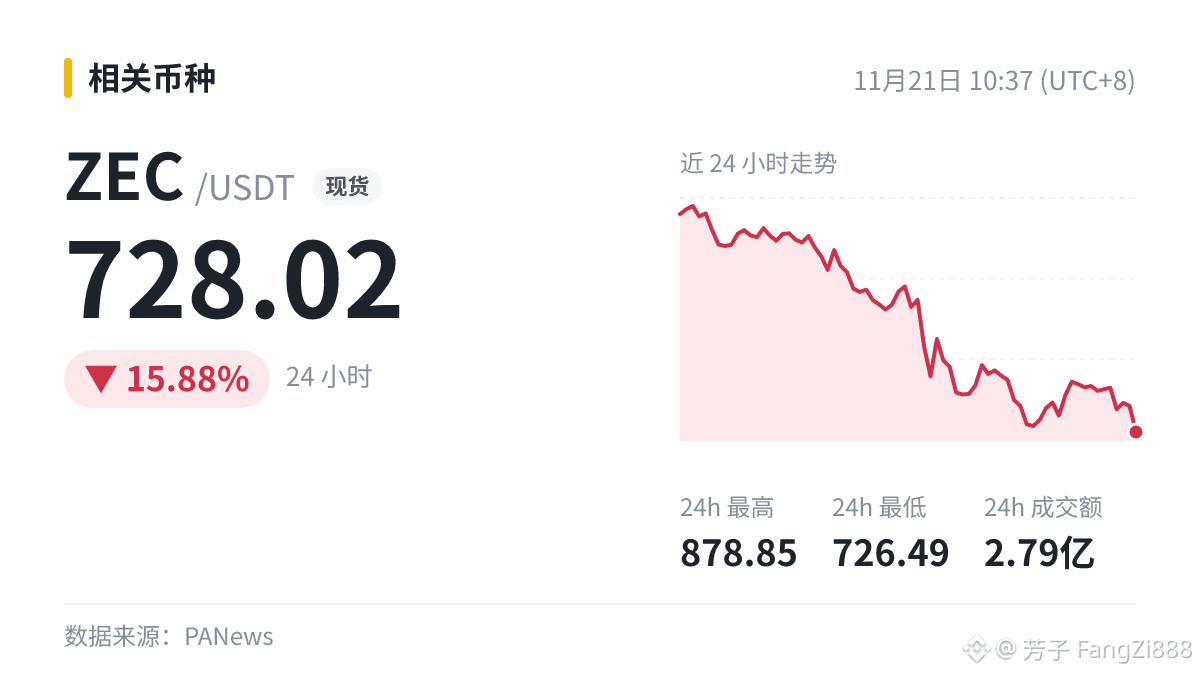
10:37 A report: U.S. spot ETFs for ZEC and NEAR saw combined net outflows of $6.5774 million in a single day.
My first impression is that this doesn’t look good, but the impact will depend on how heavy the selling pressure is next. I’ll compare trading volume with normal levels to see whether anything has really changed.
$ZEC , 24h -15.88%.
10:37 A report: U.S. spot ETFs for ZEC and NEAR saw combined net outflows of $6.5774 million in a single day.
My first impression is that this doesn’t look good, but the impact will depend on how heavy the selling pressure is next. I’ll compare trading volume with normal levels to see whether anything has really changed.
$ZEC , 24h -15.88%.
My first impression is that this doesn’t look good, but the impact will depend on how heavy the selling pressure is next. I’ll compare trading volume with normal levels to see whether anything has really changed.
$ZEC , 24h -15.88%.
ZEC-17.79%
NEARETF+0.51%
67
·
--
The US 10-year Treasury yield remains elevated at 5.07%, with high interest rates continuing to weigh on US equity valuations and the S&P 500 weakening to around 6,961 points. Meanwhile, Brent crude fluctuates at $91.61 per barrel, with energy prices shaping market inflation expectations. The 20-day moving averages of major indices are turning downward, while daily RSI has slipped into weak territory, reflecting a cautious mood amid macroeconomic pressures.
The US 10-year Treasury yield remains elevated at 5.07%, with high interest rates continuing to weigh on US equity valuations and the S&P 500 weakening to around 6,961 points. Meanwhile, Brent crude fluctuates at $91.61 per barrel, with energy prices shaping market inflation expectations. The 20-day moving averages of major indices are turning downward, while daily RSI has slipped into weak territory, reflecting a cautious mood amid macroeconomic pressures.
66
·
--
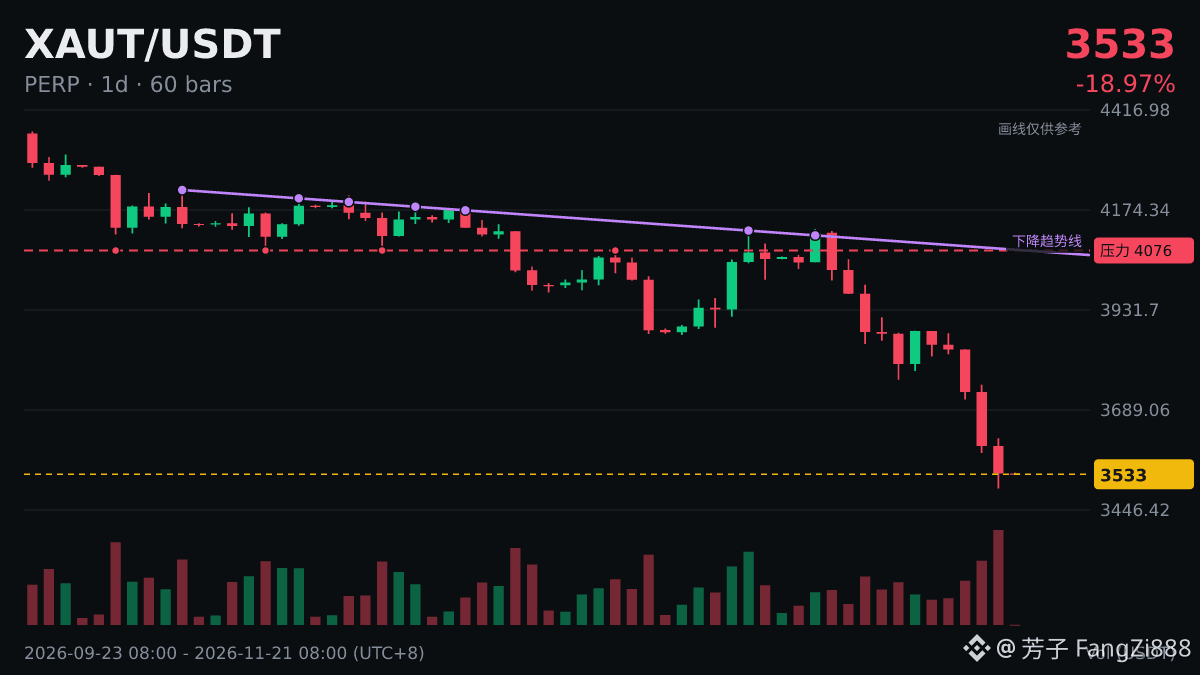
$XAUT The daily chart has now posted five consecutive down days. I’d look at three things:
1) How big is the drop? -8.92% isn’t that steep; it looks more like a gradual decline, with no clear signs of a bottom yet.
2) Will the losing streak break today? We’ll have to wait for today’s close.
3) Volume on the day it breaks: a bullish candle on higher volume is more convincing than one on lower volume.
Do you trust the data or the news more?
$XAUT The daily chart has now posted five consecutive down days. I’d look at three things:
1) How big is the drop? -8.92% isn’t that steep; it looks more like a gradual decline, with no clear signs of a bottom yet.
2) Will the losing streak break today? We’ll have to wait for today’s close.
3) Volume on the day it breaks: a bullish candle on higher volume is more convincing than one on lower volume.
Do you trust the data or the news more?
1) How big is the drop? -8.92% isn’t that steep; it looks more like a gradual decline, with no clear signs of a bottom yet.
2) Will the losing streak break today? We’ll have to wait for today’s close.
3) Volume on the day it breaks: a bullish candle on higher volume is more convincing than one on lower volume.
Do you trust the data or the news more?
169
·
--
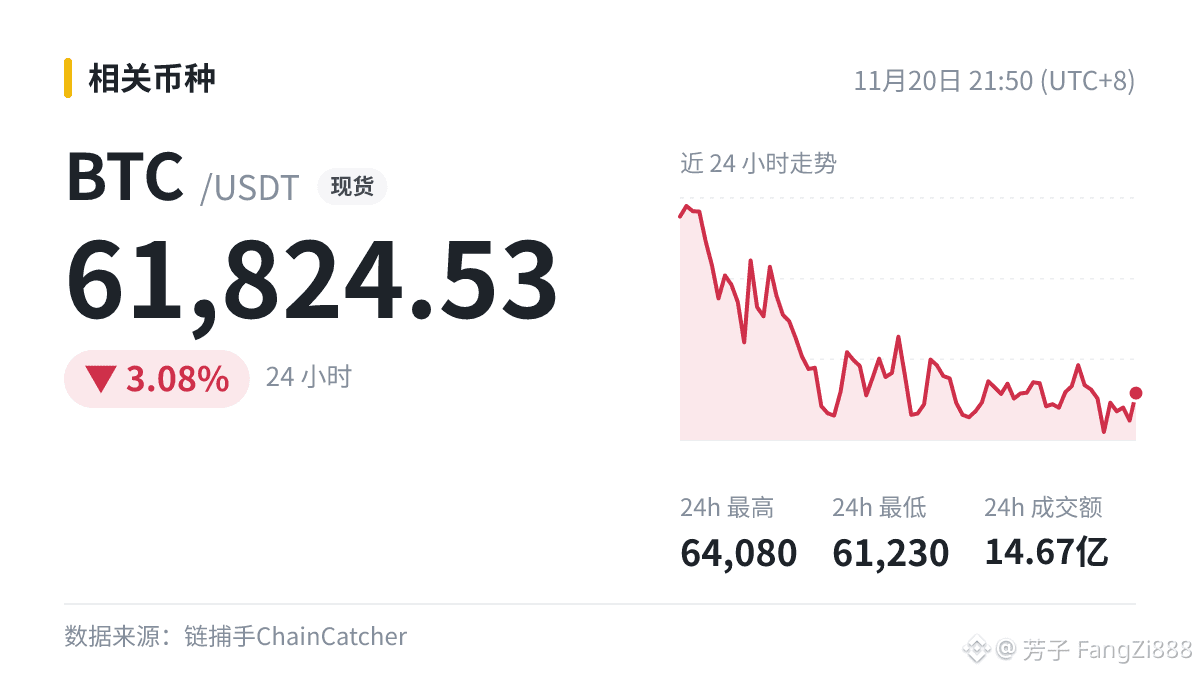
【November 20, 21:50】Data: $797 million in liquidations across the network over the past 24 hours, including $695 million in long liquidations and $102 million in short liquidations
▸ $BTC 61824.53(-3.08%)
The price action after the news breaks is more worth watching than the news itself. More updates to come.
【November 20, 21:50】Data: $797 million in liquidations across the network over the past 24 hours, including $695 million in long liquidations and $102 million in short liquidations
▸ $BTC 61824.53(-3.08%)
The price action after the news breaks is more worth watching than the news itself. More updates to come.
▸ $BTC 61824.53(-3.08%)
The price action after the news breaks is more worth watching than the news itself. More updates to come.
34
·
--
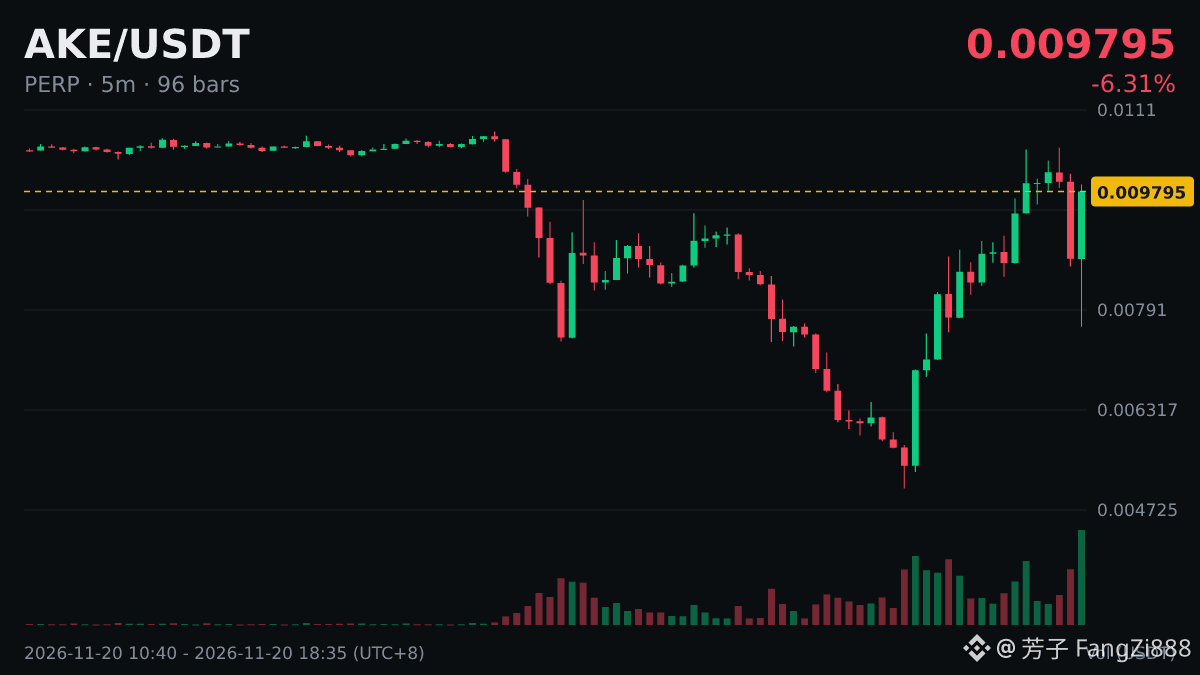
Let's talk about $AKE just now: 15 minutes, -13.16%.
The decline hasn't stopped yet. If you want to buy in, do it in batches—don't go all in at once. I have a little habit: when I see this kind of unusual movement, I jot it down first and check back later to see how it played out.
#AKE
Let's talk about $AKE just now: 15 minutes, -13.16%.
The decline hasn't stopped yet. If you want to buy in, do it in batches—don't go all in at once. I have a little habit: when I see this kind of unusual movement, I jot it down first and check back later to see how it played out.
#AKE
The decline hasn't stopped yet. If you want to buy in, do it in batches—don't go all in at once. I have a little habit: when I see this kind of unusual movement, I jot it down first and check back later to see how it played out.
#AKE
353
·
--
One security, multiple chains: Anthropic’s listing exposes the “fragmentation” dilemma facing tokenized assets
A look at both sides:
Bullish case: The event offers a fresh narrative and could draw more attention;
Bearish case: Expectations may already be priced in, making the event a chance to exit once it materializes;
My take: Both sides have a point. The real decision depends on how $BTC ’s price and volume behave.
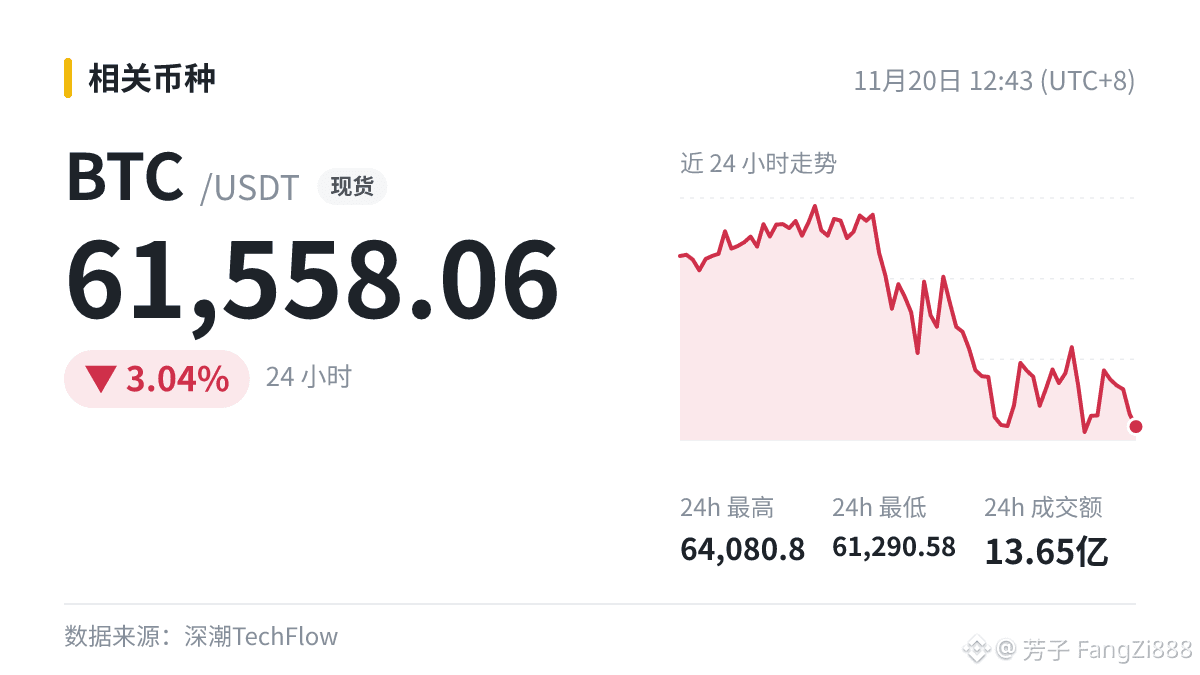
$BTC is currently at 61558.06, down 3.04% in 24h, with a 24h range of 61290.58 ~ 64080.8.
One security, multiple chains: Anthropic’s listing exposes the “fragmentation” dilemma facing tokenized assets
A look at both sides:
Bullish case: The event offers a fresh narrative and could draw more attention;
Bearish case: Expectations may already be priced in, making the event a chance to exit once it materializes;
My take: Both sides have a point. The real decision depends on how $BTC ’s price and volume behave.
$BTC is currently at 61558.06, down 3.04% in 24h, with a 24h range of 61290.58 ~ 64080.8.
A look at both sides:
Bullish case: The event offers a fresh narrative and could draw more attention;
Bearish case: Expectations may already be priced in, making the event a chance to exit once it materializes;
My take: Both sides have a point. The real decision depends on how $BTC ’s price and volume behave.
$BTC is currently at 61558.06, down 3.04% in 24h, with a 24h range of 61290.58 ~ 64080.8.
167
·
--
Watch the money, not the news.
Behind USDe’s rebound: a whale on the brink of liquidation drove three-quarters of the gains; ENA buybacks may be delayed until 2027.
When good news breaks, watch out for early holders selling into the hype. If the price surges on the chart but trading volume doesn’t keep up, be cautious.
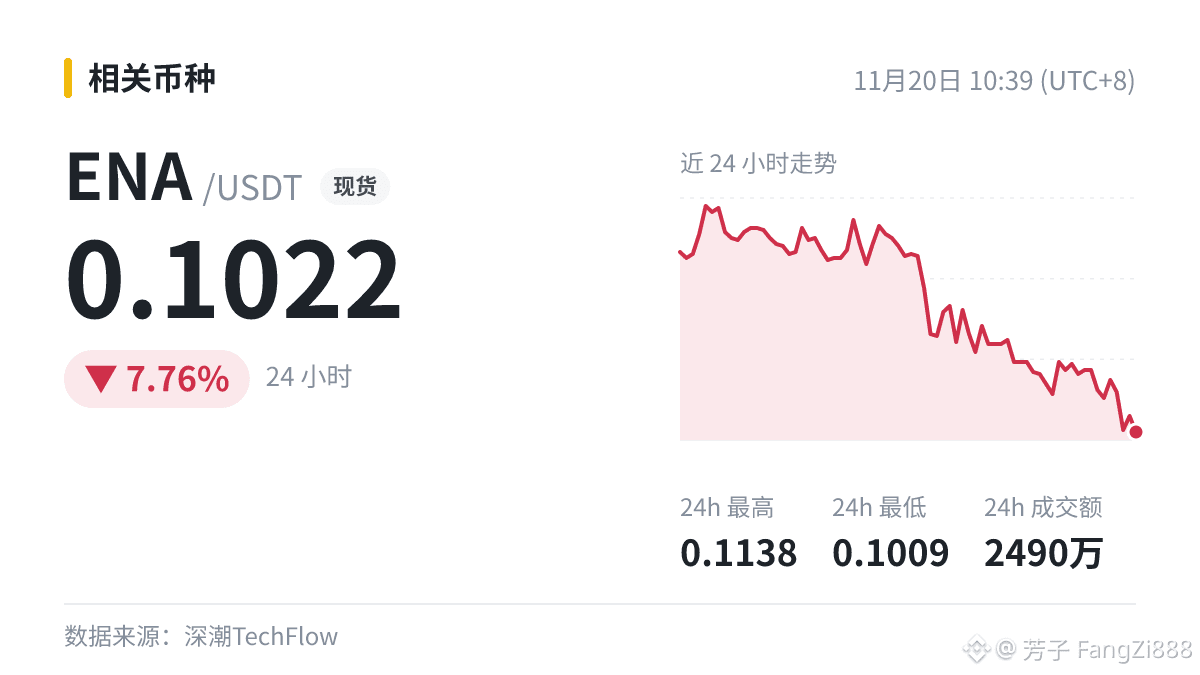
$ENA 24-hour trading volume: $24.9 million; 24-hour change: -7.76%. Like if you think this makes sense, or share your disagreement in the comments.
Watch the money, not the news.
Behind USDe’s rebound: a whale on the brink of liquidation drove three-quarters of the gains; ENA buybacks may be delayed until 2027.
When good news breaks, watch out for early holders selling into the hype. If the price surges on the chart but trading volume doesn’t keep up, be cautious.
$ENA 24-hour trading volume: $24.9 million; 24-hour change: -7.76%. Like if you think this makes sense, or share your disagreement in the comments.
Behind USDe’s rebound: a whale on the brink of liquidation drove three-quarters of the gains; ENA buybacks may be delayed until 2027.
When good news breaks, watch out for early holders selling into the hype. If the price surges on the chart but trading volume doesn’t keep up, be cautious.
$ENA 24-hour trading volume: $24.9 million; 24-hour change: -7.76%. Like if you think this makes sense, or share your disagreement in the comments.
53
·
--
The US 10-year Treasury yield remains steady in the elevated range around 5.06%, with the high-interest-rate environment continuing to weigh on valuations of major US equity indices. The S&P 500 has recently fluctuated around 7,400, while technology and growth stocks face pressure from discount rates. Meanwhile, Brent crude has been trading around $92.07 per barrel, with energy costs shaping the market’s expectations for actual inflation. From a technical perspective, the upward momentum of the 20-day moving averages (MA) of major indices has eased, while the daily relative strength index (RSI) has slipped into a neutral-to-weak range, reflecting a cautious wait-and-see mood amid mixed macroeconomic signals.
The US 10-year Treasury yield remains steady in the elevated range around 5.06%, with the high-interest-rate environment continuing to weigh on valuations of major US equity indices. The S&P 500 has recently fluctuated around 7,400, while technology and growth stocks face pressure from discount rates. Meanwhile, Brent crude has been trading around $92.07 per barrel, with energy costs shaping the market’s expectations for actual inflation. From a technical perspective, the upward momentum of the 20-day moving averages (MA) of major indices has eased, while the daily relative strength index (RSI) has slipped into a neutral-to-weak range, reflecting a cautious wait-and-see mood amid mixed macroeconomic signals.
64
·
--
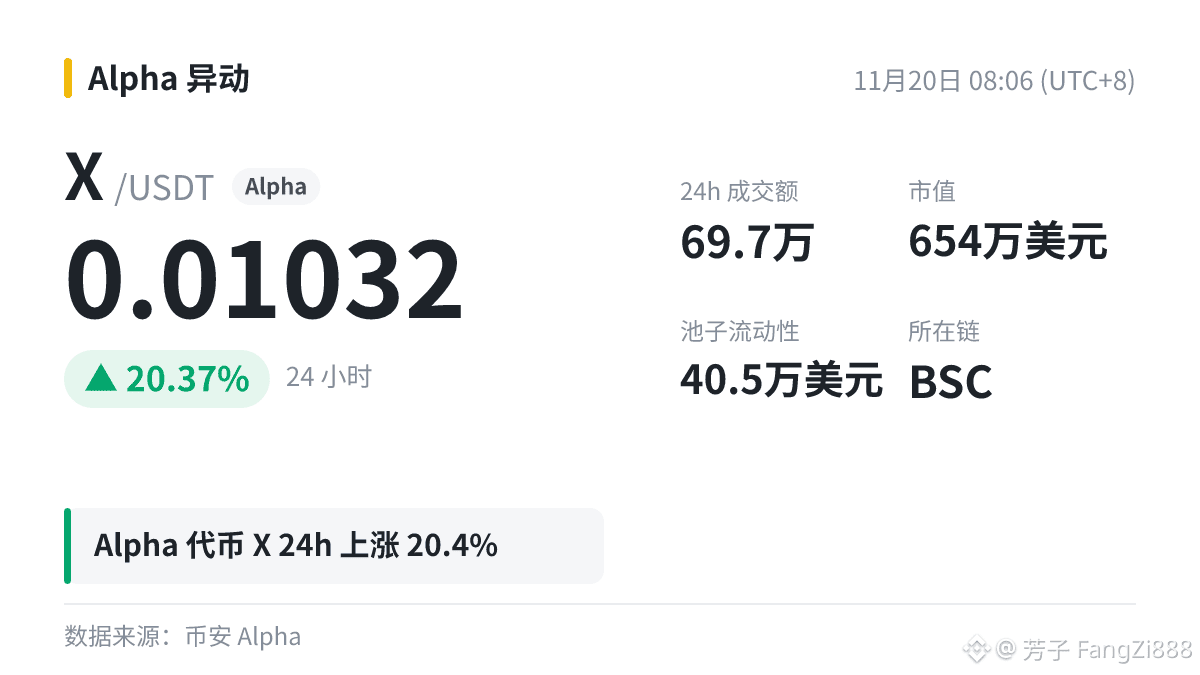
🌕 Alpha leads the gains: $X 24h +20.37%, current price 0.01032, market cap $6.54 million.
Momentum can fade as quickly as it arrives, so don't get too attached. Do you think this move was driven by big players or by sentiment?
#X
🌕 Alpha leads the gains: $X 24h +20.37%, current price 0.01032, market cap $6.54 million.
Momentum can fade as quickly as it arrives, so don't get too attached. Do you think this move was driven by big players or by sentiment?
#X
Momentum can fade as quickly as it arrives, so don't get too attached. Do you think this move was driven by big players or by sentiment?
#X
399
·
--
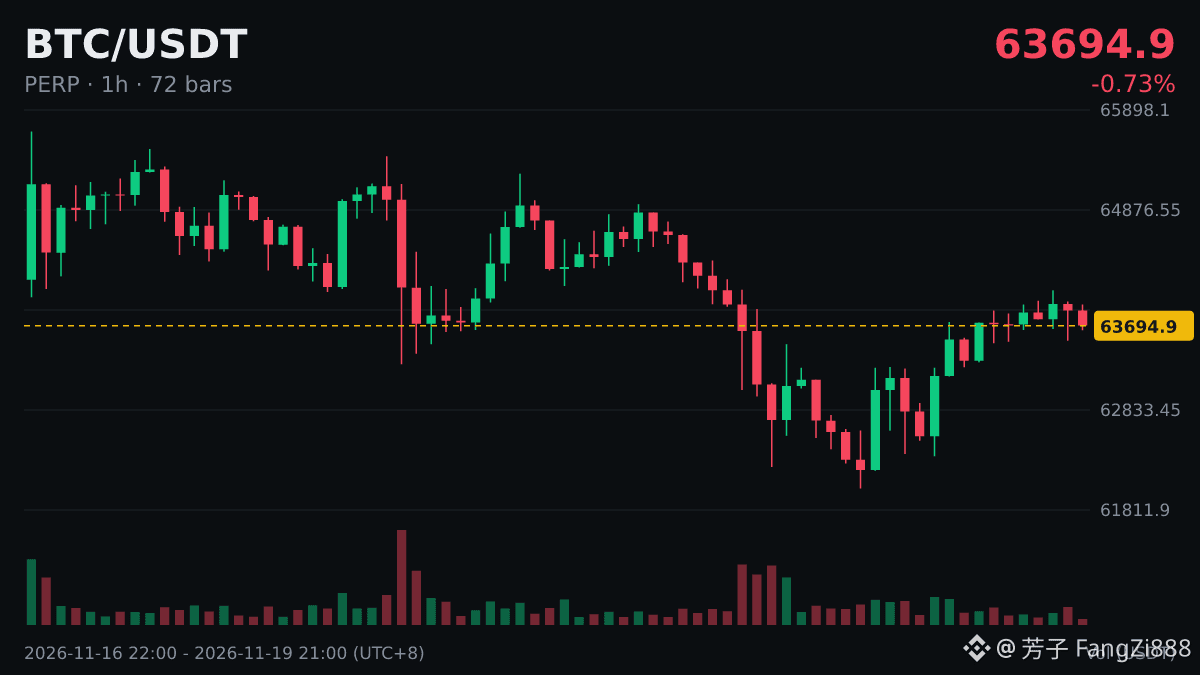
🆕 Trending searches: CATL: repurchased 850,500 A-shares
Affected by the stock market: $BTC 63722 (24h -0.57%)
Topics come and go quickly. Treat them as a barometer, not a basis for buying or selling.
🆕 Trending searches: CATL: repurchased 850,500 A-shares
Affected by the stock market: $BTC 63722 (24h -0.57%)
Topics come and go quickly. Treat them as a barometer, not a basis for buying or selling.
Affected by the stock market: $BTC 63722 (24h -0.57%)
Topics come and go quickly. Treat them as a barometer, not a basis for buying or selling.
73
·
--
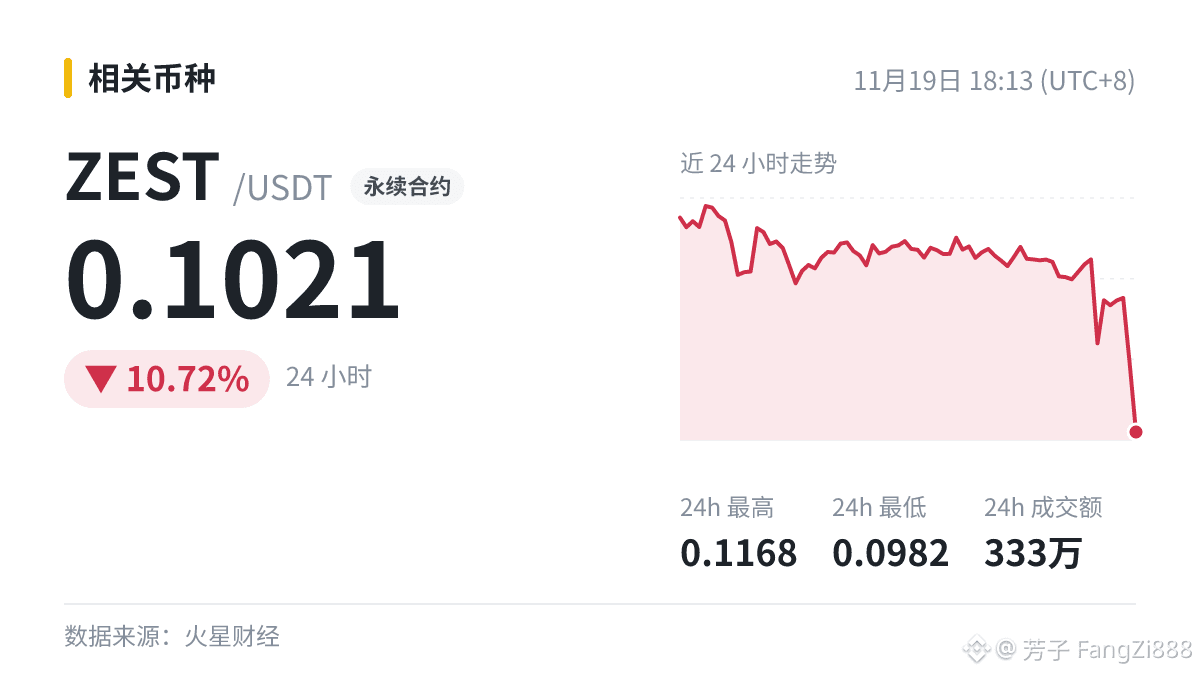
📡 Binance Alpha opens the second round of the Zest Protocol (ZEST) airdrop
Analysts after reading: bullish—the logic checks out.
Whales after reading: quietly did some calculations.
Me after reading: hit save, then kept scrolling.
$ZEST Worth keeping an eye on. Send this to that friend who says every day they’re going to buy the dip.
#ZEST
📡 Binance Alpha opens the second round of the Zest Protocol (ZEST) airdrop
Analysts after reading: bullish—the logic checks out.
Whales after reading: quietly did some calculations.
Me after reading: hit save, then kept scrolling.
$ZEST Worth keeping an eye on. Send this to that friend who says every day they’re going to buy the dip.
#ZEST
Analysts after reading: bullish—the logic checks out.
Whales after reading: quietly did some calculations.
Me after reading: hit save, then kept scrolling.
$ZEST Worth keeping an eye on. Send this to that friend who says every day they’re going to buy the dip.
#ZEST
210
·
--
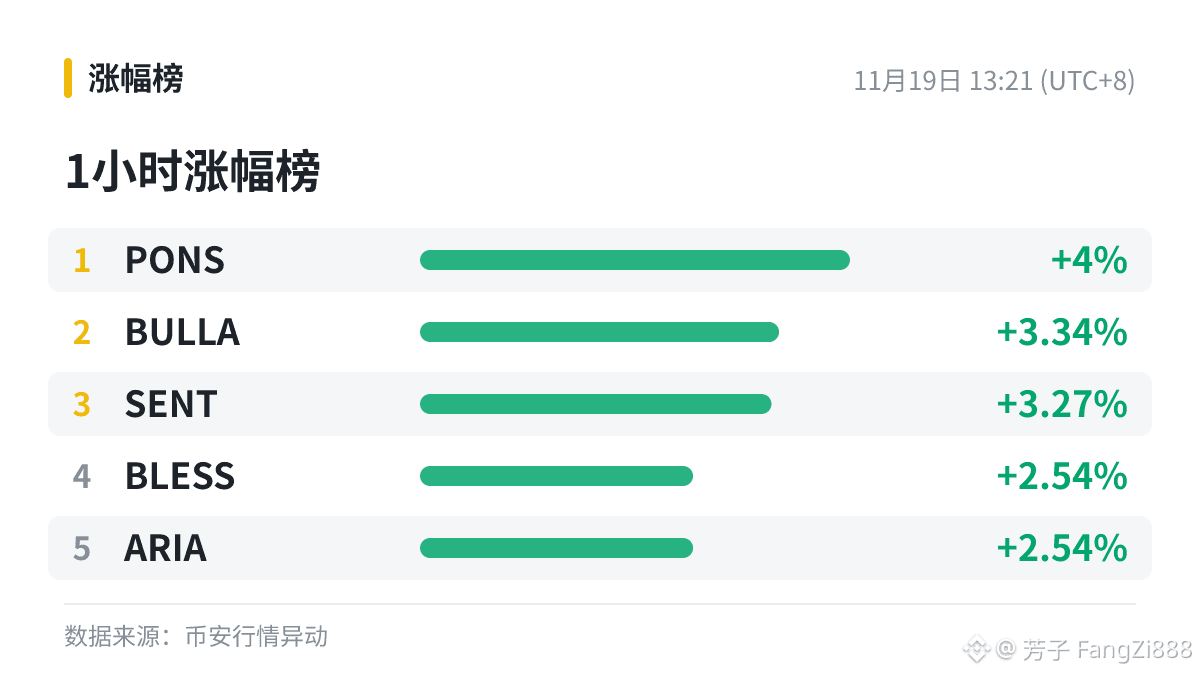
🐳 Top 5 gainers in 1 hour:
$PONS +4.00%; $BULLA +3.34%; $SENT +3.27%; BLESS +2.54%; ARIA +2.54%
Capital is focused on $PONS (+4%). Keep an eye on whether trading volume at the top can be sustained; when the money pulls out, prices often give back their gains just as quickly. Do you think the market has fully priced in the capital flows?
🐳 Top 5 gainers in 1 hour:
$PONS +4.00%; $BULLA +3.34%; $SENT +3.27%; BLESS +2.54%; ARIA +2.54%
Capital is focused on $PONS (+4%). Keep an eye on whether trading volume at the top can be sustained; when the money pulls out, prices often give back their gains just as quickly. Do you think the market has fully priced in the capital flows?
$PONS +4.00%; $BULLA +3.34%; $SENT +3.27%; BLESS +2.54%; ARIA +2.54%
Capital is focused on $PONS (+4%). Keep an eye on whether trading volume at the top can be sustained; when the money pulls out, prices often give back their gains just as quickly. Do you think the market has fully priced in the capital flows?
1
1.2k
·
--
How will real money respond?
BTC has heavier near-term selling pressure: Binance perpetual sell orders total $38.9089 million, $3.9759 million more than buy orders.
When news breaks, the funds that react quickly are usually the first to move; institutions tend to lag behind. The impact is limited, but if similar news keeps piling up, it’s worth giving it some serious thought.
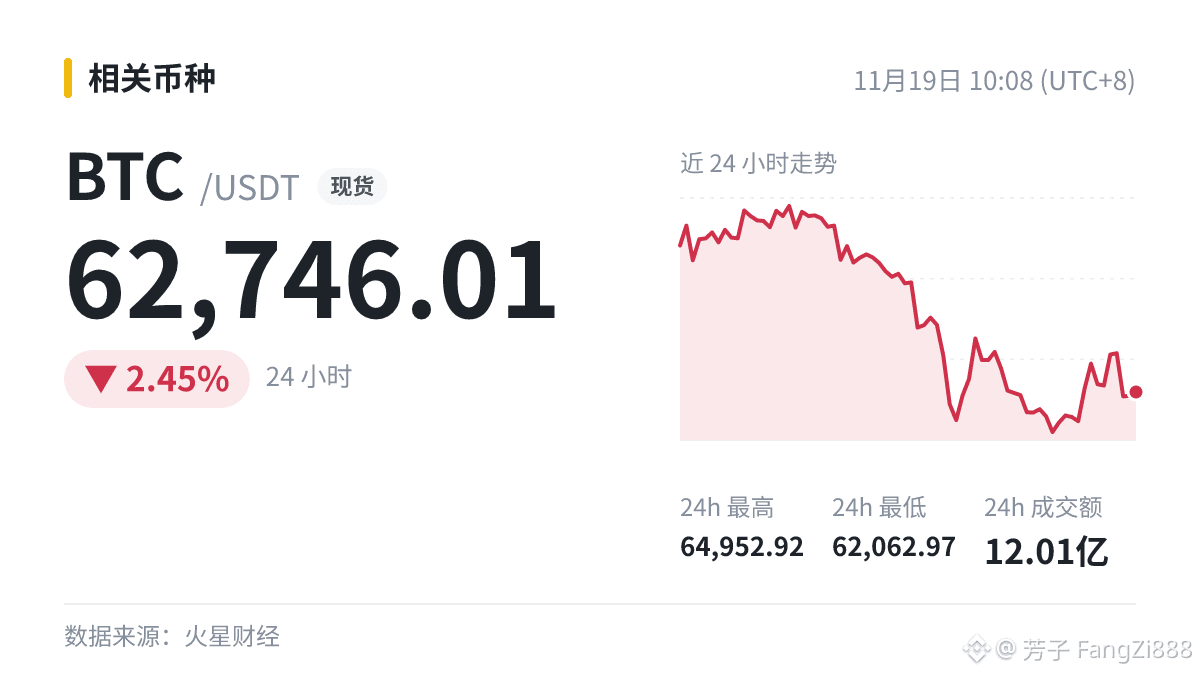
$BTC , down 2.45% intraday.
#BTC
How will real money respond?
BTC has heavier near-term selling pressure: Binance perpetual sell orders total $38.9089 million, $3.9759 million more than buy orders.
When news breaks, the funds that react quickly are usually the first to move; institutions tend to lag behind. The impact is limited, but if similar news keeps piling up, it’s worth giving it some serious thought.
$BTC , down 2.45% intraday.
#BTC
BTC has heavier near-term selling pressure: Binance perpetual sell orders total $38.9089 million, $3.9759 million more than buy orders.
When news breaks, the funds that react quickly are usually the first to move; institutions tend to lag behind. The impact is limited, but if similar news keeps piling up, it’s worth giving it some serious thought.
$BTC , down 2.45% intraday.
#BTC
103
·
--
The U.S. 10-year Treasury yield remains elevated near 5.09%, with high yields continuing to weigh on valuations of major U.S. stock indexes. The S&P 500 recently pulled back to 7,467 points, as technology growth stocks face pressure from discount rates. Meanwhile, Brent crude fluctuates around $92.77 per barrel, with persistently high energy costs shaping market expectations for imported inflation. Technically, the upward momentum of the major indexes’ 20-day moving averages (MA) is slowing, while the daily relative strength index (RSI) has slipped into a neutral-to-weak range, reflecting a cautious wait-and-see mood amid mixed macroeconomic forces.
The U.S. 10-year Treasury yield remains elevated near 5.09%, with high yields continuing to weigh on valuations of major U.S. stock indexes. The S&P 500 recently pulled back to 7,467 points, as technology growth stocks face pressure from discount rates. Meanwhile, Brent crude fluctuates around $92.77 per barrel, with persistently high energy costs shaping market expectations for imported inflation. Technically, the upward momentum of the major indexes’ 20-day moving averages (MA) is slowing, while the daily relative strength index (RSI) has slipped into a neutral-to-weak range, reflecting a cautious wait-and-see mood amid mixed macroeconomic forces.
64
·
--
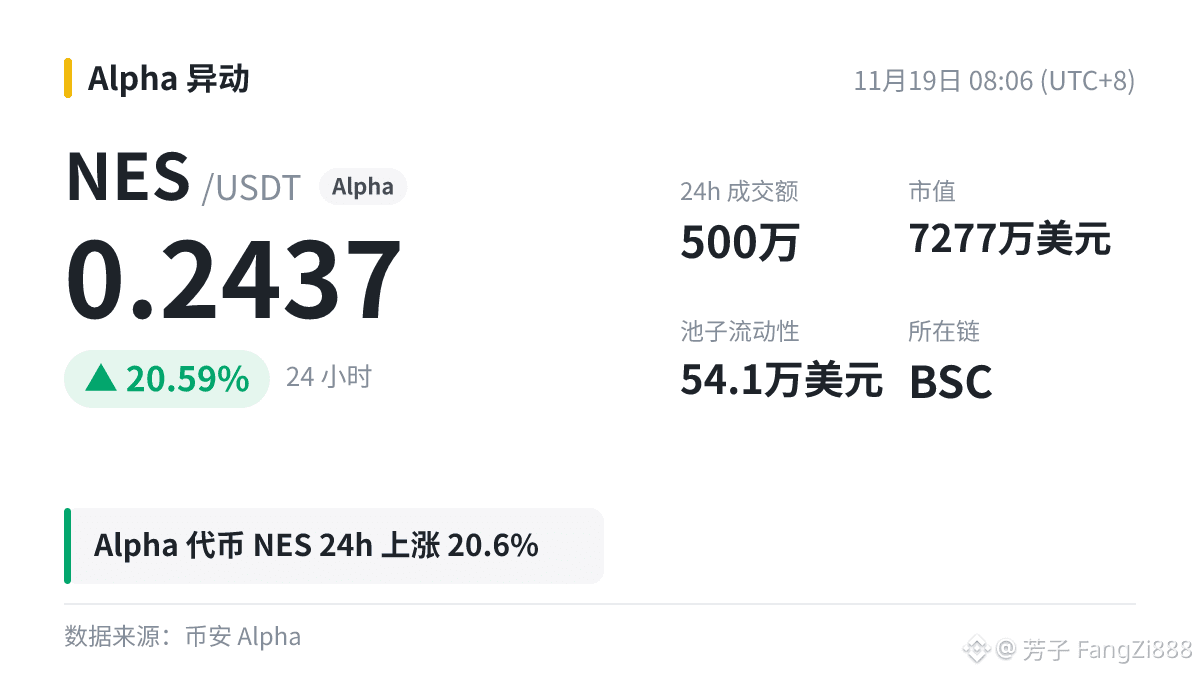
🔢 $NES (Alpha·BSC)24h +20.59%
Market cap: $72.77 million | 24h trading volume: $5 million | On-chain liquidity: $541,000
With liquidity below $1 million, slippage when entering or exiting won't be small.
Describe your current view in one sentence?
#NES
🔢 $NES (Alpha·BSC)24h +20.59%
Market cap: $72.77 million | 24h trading volume: $5 million | On-chain liquidity: $541,000
With liquidity below $1 million, slippage when entering or exiting won't be small.
Describe your current view in one sentence?
#NES
Market cap: $72.77 million | 24h trading volume: $5 million | On-chain liquidity: $541,000
With liquidity below $1 million, slippage when entering or exiting won't be small.
Describe your current view in one sentence?
#NES
94
·
--
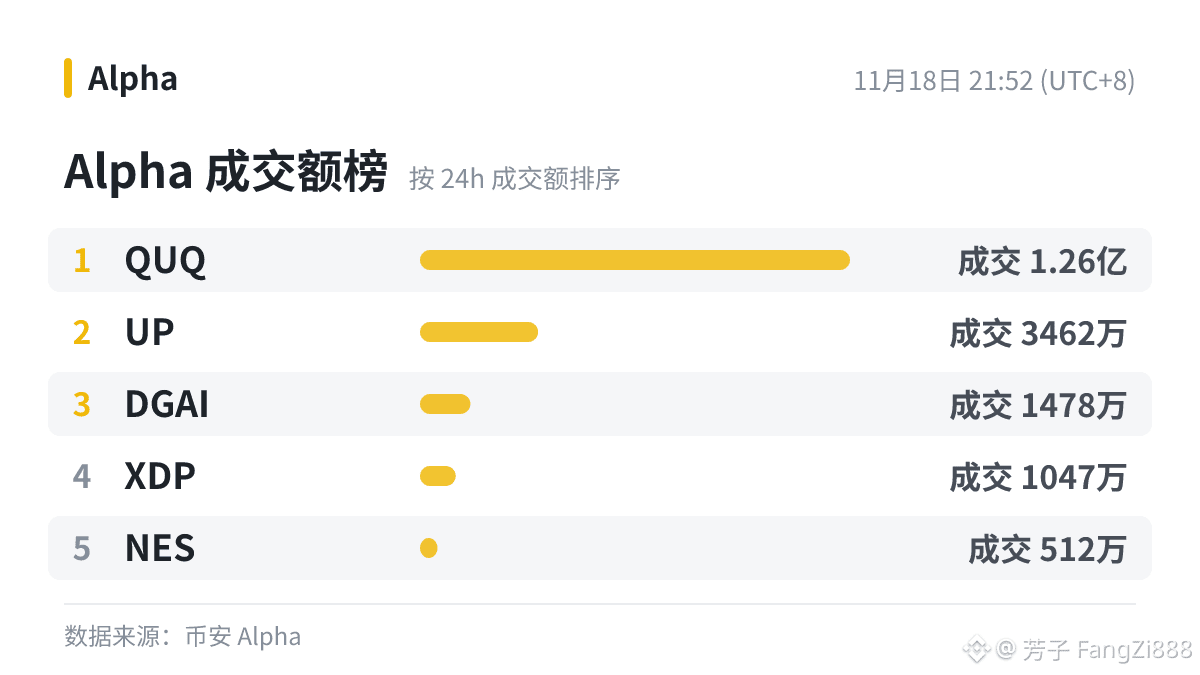
Honestly, I take a quick look at the Alpha trading leaderboard every day to see what everyone’s trading:
No. 1 $QUQ — trading volume: 126 million
No. 2 $UP — trading volume: 34.62 million
No. 3 $DGAI — trading volume: 14.78 million
No. 4 XDP — trading volume: 10.47 million
No. 5 NES — trading volume: 5.12 million
$QUQ was the busiest this time. High trading activity doesn’t mean the price will go up, but at least it shows that a lot of money is in play.
Which one are you keeping an eye on?
Honestly, I take a quick look at the Alpha trading leaderboard every day to see what everyone’s trading:
No. 1 $QUQ — trading volume: 126 million
No. 2 $UP — trading volume: 34.62 million
No. 3 $DGAI — trading volume: 14.78 million
No. 4 XDP — trading volume: 10.47 million
No. 5 NES — trading volume: 5.12 million
$QUQ was the busiest this time. High trading activity doesn’t mean the price will go up, but at least it shows that a lot of money is in play.
Which one are you keeping an eye on?
No. 1 $QUQ — trading volume: 126 million
No. 2 $UP — trading volume: 34.62 million
No. 3 $DGAI — trading volume: 14.78 million
No. 4 XDP — trading volume: 10.47 million
No. 5 NES — trading volume: 5.12 million
$QUQ was the busiest this time. High trading activity doesn’t mean the price will go up, but at least it shows that a lot of money is in play.
Which one are you keeping an eye on?
22
·
--
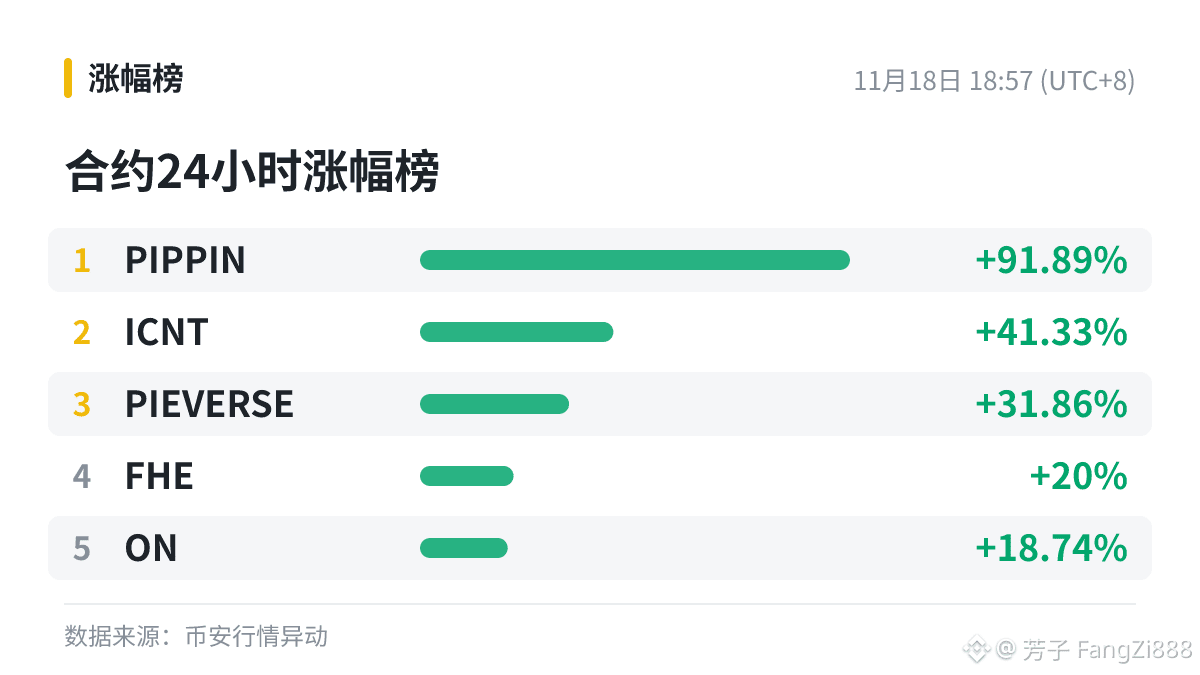
🐳 Top 5 contracts by 24-hour gains:
1. $PIPPIN +91.89%
2. $ICNT +41.33%
3. $PIEVERSE +31.86%
4. FHE +20.00%
5. ON +18.74%
Funds are concentrated in $PIPPIN (+91.89%). Keep an eye on whether its trading volume can hold up. If the volume dries up, the price could give back its gains just as quickly. Which side are you on? Share your thoughts.
🐳 Top 5 contracts by 24-hour gains:
1. $PIPPIN +91.89%
2. $ICNT +41.33%
3. $PIEVERSE +31.86%
4. FHE +20.00%
5. ON +18.74%
Funds are concentrated in $PIPPIN (+91.89%). Keep an eye on whether its trading volume can hold up. If the volume dries up, the price could give back its gains just as quickly. Which side are you on? Share your thoughts.
1. $PIPPIN +91.89%
2. $ICNT +41.33%
3. $PIEVERSE +31.86%
4. FHE +20.00%
5. ON +18.74%
Funds are concentrated in $PIPPIN (+91.89%). Keep an eye on whether its trading volume can hold up. If the volume dries up, the price could give back its gains just as quickly. Which side are you on? Share your thoughts.
491
·
--
ANT & NVDA Contract Carnival
Trade designated TradFi perpetual contracts and share a prize pool of up to 200,000 USDC!
Event period: 2026/11/17 18:00 – 2026/12/01 07:59
How to Participate
1. Sign up for the event: [傳送門](https://www.binance.com/activity/trading-competition/futures-antnvda-carnival?ref=PQV0WZTQ)
2. Trade > 500 USDT $NVDA
{future}(NVDAUSDT)
ANT & NVDA Contract Carnival
Trade designated TradFi perpetual contracts and share a prize pool of up to 200,000 USDC!
Event period: 2026/11/17 18:00 – 2026/12/01 07:59
How to Participate
1. Sign up for the event: 傳送門
2. Trade > 500 USDT $NVDA
Trade designated TradFi perpetual contracts and share a prize pool of up to 200,000 USDC!
Event period: 2026/11/17 18:00 – 2026/12/01 07:59
How to Participate
1. Sign up for the event: 傳送門
2. Trade > 500 USDT $NVDA

331
·
--
The U.S. 10-year Treasury yield has held steady in an elevated range near 5.14%, with the high-interest-rate environment continuing to put meaningful pressure on the valuations of major U.S. stock indexes. The S&P 500 recently pulled back to 7,485 points, putting technology growth stocks to the test as discount rates rise. Meanwhile, Brent crude has fluctuated around $93.46 per barrel, and elevated energy costs are fueling market expectations of imported inflation. From a technical perspective, the upward momentum of the major indexes’ 20-day moving averages (MA) has eased, while the daily relative strength index (RSI) has slipped into a neutral-to-weak range, reflecting a cautious, wait-and-see mood amid mixed macroeconomic signals.
The U.S. 10-year Treasury yield has held steady in an elevated range near 5.14%, with the high-interest-rate environment continuing to put meaningful pressure on the valuations of major U.S. stock indexes. The S&P 500 recently pulled back to 7,485 points, putting technology growth stocks to the test as discount rates rise. Meanwhile, Brent crude has fluctuated around $93.46 per barrel, and elevated energy costs are fueling market expectations of imported inflation. From a technical perspective, the upward momentum of the major indexes’ 20-day moving averages (MA) has eased, while the daily relative strength index (RSI) has slipped into a neutral-to-weak range, reflecting a cautious, wait-and-see mood amid mixed macroeconomic signals.
29
Log in to explore more content
Join global crypto users on Binance Square
⚡️ Get latest and useful information about crypto.
💬 Trusted by the world’s largest crypto exchange.
👍 Discover real insights from verified creators.
Email / Phone number
Trending Topics
CanBTCReboundAfterFallingBelow60K?
227,920 views
1,009 Discussing
Bitcoin News | Bitcoin Falls Below $60,000 for the First Time Since July as IBIT Posts Record $541 Million Outflow
Binance News
·46 Likes
·86.3k views
GlobalStocksFaceLongestLosingStreakSince2023
81,747 views
784 Discussing
AnthropicPlungesTowardIPOPriceonDay2
38,410 views
392 Discussing