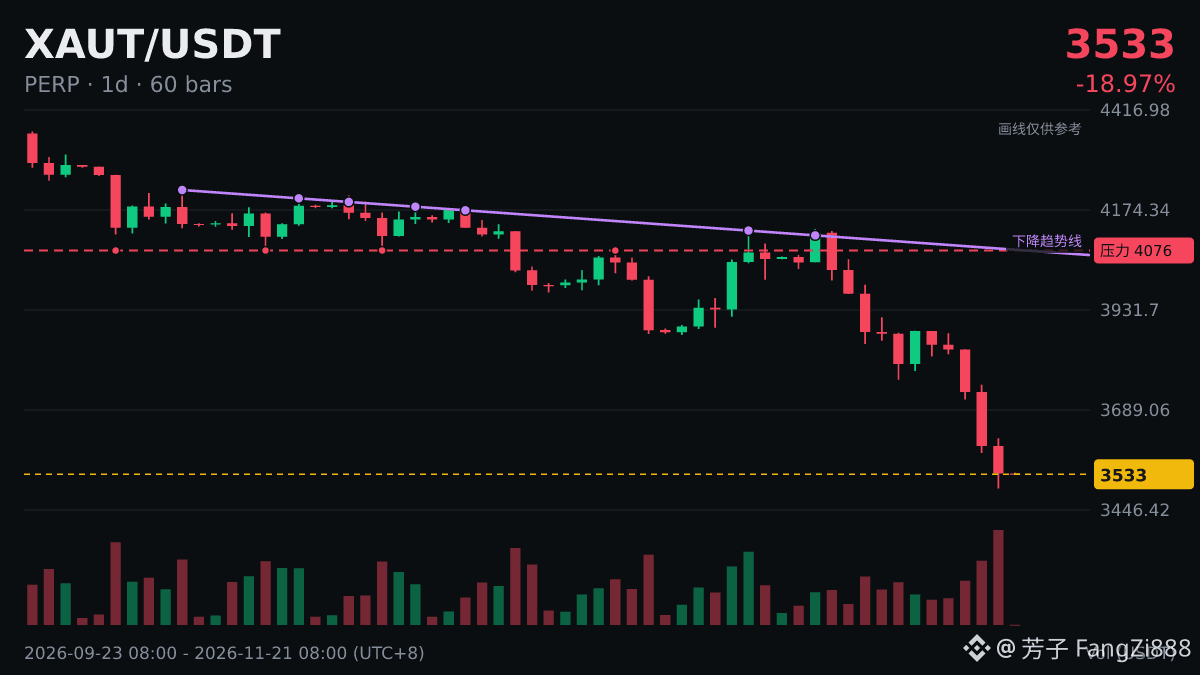
$XAUT The daily chart has now posted five consecutive down days. I’d look at three things:
1) How big is the drop? -8.92% isn’t that steep; it looks more like a gradual decline, with no clear signs of a bottom yet.
2) Will the losing streak break today? We’ll have to wait for today’s close.
3) Volume on the day it breaks: a bullish candle on higher volume is more convincing than one on lower volume.
Do you trust the data or the news more?
1) How big is the drop? -8.92% isn’t that steep; it looks more like a gradual decline, with no clear signs of a bottom yet.
2) Will the losing streak break today? We’ll have to wait for today’s close.
3) Volume on the day it breaks: a bullish candle on higher volume is more convincing than one on lower volume.
Do you trust the data or the news more?