
SnEmroz
1.9k Posts

SnEmroz
Report
Block User
Crypto Trader | Scalper | Challenge Master Sharing smart setups & Trade Psychology | Quality - Quantity I DYOR I (X- Marks_BTC )
33 Following
8.8K+ Followers
9.5K+ Liked
Posts
All
Quotes
Videos
PINNED
·
--
Bullish
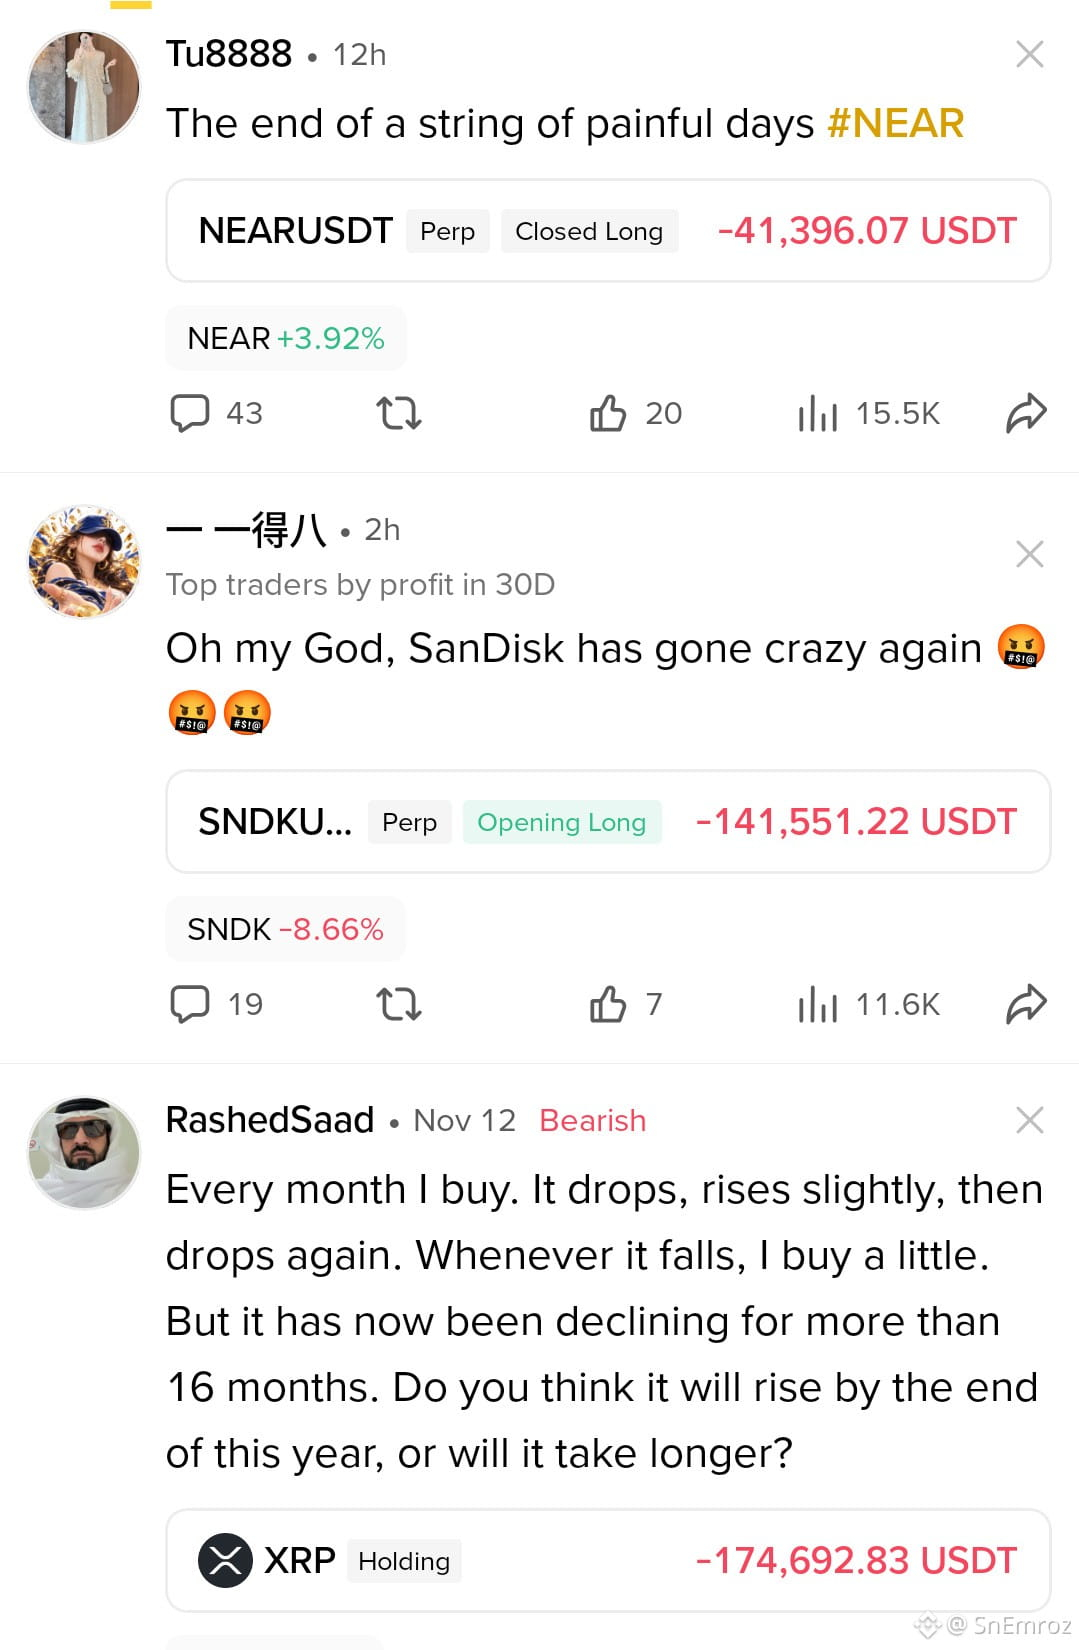
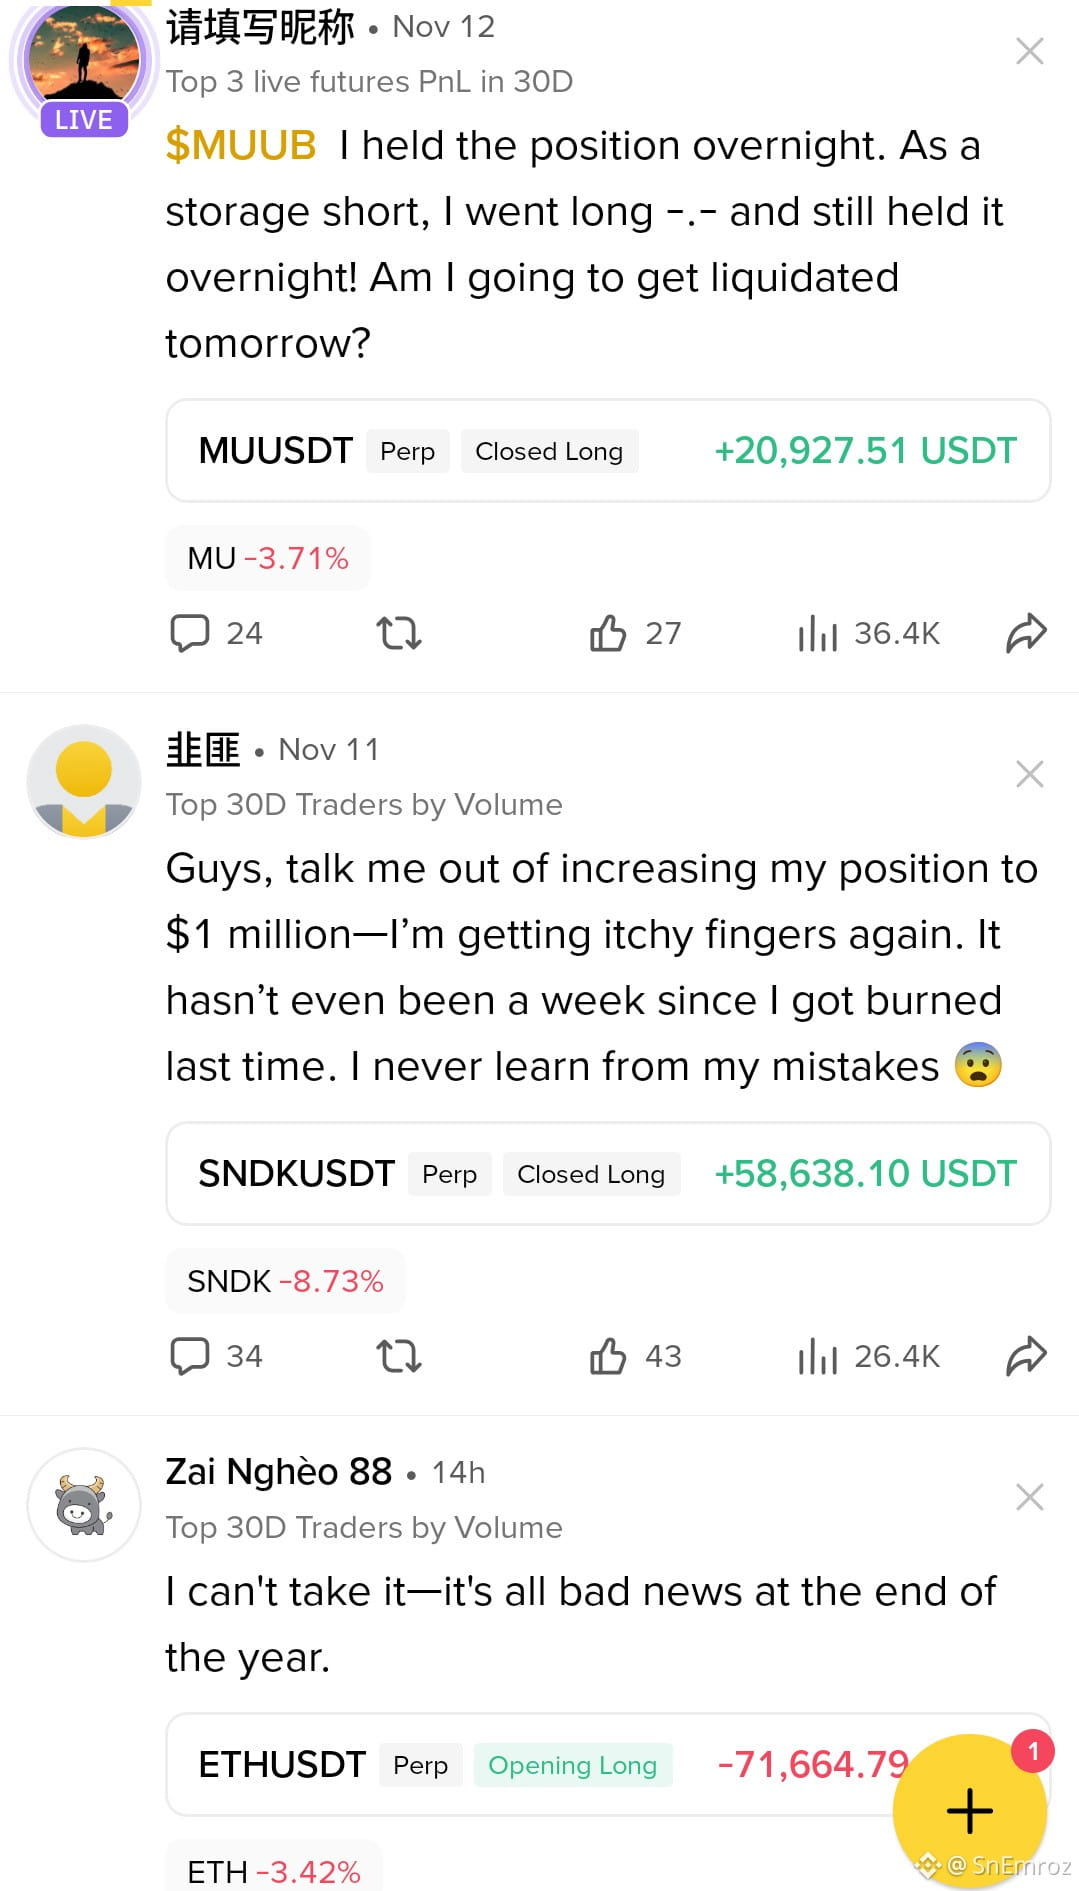
Look at these screenshots.
some big players are also taking massive losses. One trader lost over $41K on a NEAR long. Another showed a loss of more than $141K on SNDK. And others are struggling with the same emotional battle.
The question is why does this happen even when they have trading experience and market knowledge?
One major reason is poor trading psychology.
Many traders want profit on every trade. They don't want to accept a loss. They hold losing positions. wait for the market to recover. and sometimes increase their exposure. Instead of protecting their capital. they let their emotions control their decisions.
That's why I have decided to train 20 lucky people in trading completely free of cost.
What will they learn?
✅ How to read charts and understand market behaviour.
✅ How to identify trading setups and wait for confirmation.
✅ How to plan entries, take profits, and manage stop losses.
✅ How to control emotions and accept losses.
✅ How to manage risk and protect trading capital.
✅ How to analyse their trades and learn from mistakes.
The goal is not to promise anyone misleading. It's to help them build real trading knowledge. practise with discipline and understand how to manage risk. They will learn through practical market examples and guided exercises.
No course fees❌. No payment❌. Just learning✅.
So are you interested in becoming one of these 20 people?
Comment I'M IN below. 👇
Look at these screenshots.
some big players are also taking massive losses. One trader lost over $41K on a NEAR long. Another showed a loss of more than $141K on SNDK. And others are struggling with the same emotional battle.
The question is why does this happen even when they have trading experience and market knowledge?
One major reason is poor trading psychology.
Many traders want profit on every trade. They don't want to accept a loss. They hold losing positions. wait for the market to recover. and sometimes increase their exposure. Instead of protecting their capital. they let their emotions control their decisions.
That's why I have decided to train 20 lucky people in trading completely free of cost.
What will they learn?
✅ How to read charts and understand market behaviour.
✅ How to identify trading setups and wait for confirmation.
✅ How to plan entries, take profits, and manage stop losses.
✅ How to control emotions and accept losses.
✅ How to manage risk and protect trading capital.
✅ How to analyse their trades and learn from mistakes.
The goal is not to promise anyone misleading. It's to help them build real trading knowledge. practise with discipline and understand how to manage risk. They will learn through practical market examples and guided exercises.
No course fees❌. No payment❌. Just learning✅.
So are you interested in becoming one of these 20 people?
Comment I'M IN below. 👇
some big players are also taking massive losses. One trader lost over $41K on a NEAR long. Another showed a loss of more than $141K on SNDK. And others are struggling with the same emotional battle.
The question is why does this happen even when they have trading experience and market knowledge?
One major reason is poor trading psychology.
Many traders want profit on every trade. They don't want to accept a loss. They hold losing positions. wait for the market to recover. and sometimes increase their exposure. Instead of protecting their capital. they let their emotions control their decisions.
That's why I have decided to train 20 lucky people in trading completely free of cost.
What will they learn?
✅ How to read charts and understand market behaviour.
✅ How to identify trading setups and wait for confirmation.
✅ How to plan entries, take profits, and manage stop losses.
✅ How to control emotions and accept losses.
✅ How to manage risk and protect trading capital.
✅ How to analyse their trades and learn from mistakes.
The goal is not to promise anyone misleading. It's to help them build real trading knowledge. practise with discipline and understand how to manage risk. They will learn through practical market examples and guided exercises.
No course fees❌. No payment❌. Just learning✅.
So are you interested in becoming one of these 20 people?
Comment I'M IN below. 👇
2
1
1k
·
--
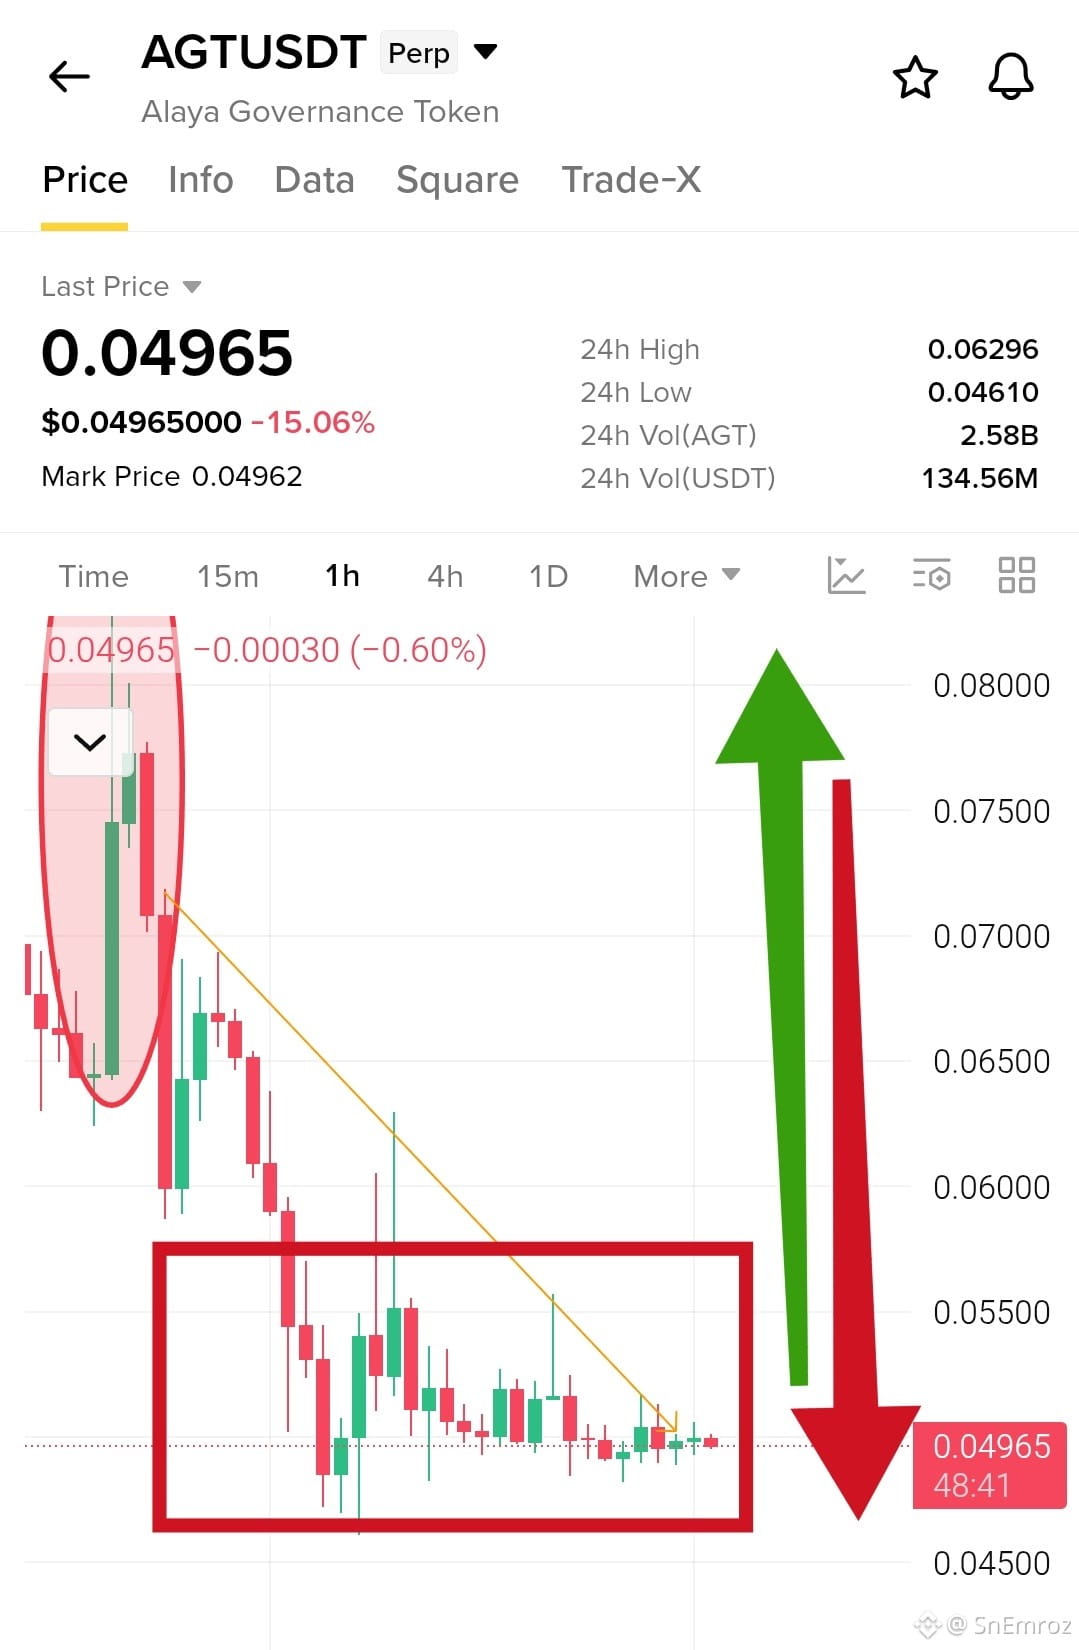
$AGT is stuck in the same range for a long time and the next big move can come anytime.
Price now is $0.04965 and down around 15% on the day. After the spike to $0.063 the bloodbath started and since then price is just moving sideways inside a box. The box is roughly $0.0465 to $0.0555. Price is sitting in the lower half and still under the falling trendline.
I see 2 scenarios here. 60% upside and 40% downside.
$AGT
{future}(AGTUSDT)
Upside scenario 60%. Sellers are getting tired and every small dip is bought around $0.0465 to $0.0480. If we get a 1h close above the trendline near $0.0505 then the next area is $0.0555. A clean 1h close above $0.0555 opens the way to $0.0576 and then $0.063.
Downside scenario 40%. Buyers fail to hold and we lose $0.0480. A 1h close below $0.0465 breaks the whole range. Then price can slide to $0.0450 and lower.
For now price is in the middle of a range so there is no edge in guessing. I wait for the 1h close above $0.0505 or below $0.0465 and then I move. Small traders do not need to catch every candle.
Not financial advice. Always use your stop loss.
$AGT is stuck in the same range for a long time and the next big move can come anytime.
Price now is $0.04965 and down around 15% on the day. After the spike to $0.063 the bloodbath started and since then price is just moving sideways inside a box. The box is roughly $0.0465 to $0.0555. Price is sitting in the lower half and still under the falling trendline.
I see 2 scenarios here. 60% upside and 40% downside.
$AGT
Upside scenario 60%. Sellers are getting tired and every small dip is bought around $0.0465 to $0.0480. If we get a 1h close above the trendline near $0.0505 then the next area is $0.0555. A clean 1h close above $0.0555 opens the way to $0.0576 and then $0.063.
Downside scenario 40%. Buyers fail to hold and we lose $0.0480. A 1h close below $0.0465 breaks the whole range. Then price can slide to $0.0450 and lower.
For now price is in the middle of a range so there is no edge in guessing. I wait for the 1h close above $0.0505 or below $0.0465 and then I move. Small traders do not need to catch every candle.
Not financial advice. Always use your stop loss.
Price now is $0.04965 and down around 15% on the day. After the spike to $0.063 the bloodbath started and since then price is just moving sideways inside a box. The box is roughly $0.0465 to $0.0555. Price is sitting in the lower half and still under the falling trendline.
I see 2 scenarios here. 60% upside and 40% downside.
$AGT
Upside scenario 60%. Sellers are getting tired and every small dip is bought around $0.0465 to $0.0480. If we get a 1h close above the trendline near $0.0505 then the next area is $0.0555. A clean 1h close above $0.0555 opens the way to $0.0576 and then $0.063.
Downside scenario 40%. Buyers fail to hold and we lose $0.0480. A 1h close below $0.0465 breaks the whole range. Then price can slide to $0.0450 and lower.
For now price is in the middle of a range so there is no edge in guessing. I wait for the 1h close above $0.0505 or below $0.0465 and then I move. Small traders do not need to catch every candle.
Not financial advice. Always use your stop loss.
1
2
672
·
--
Bearish
$NVDA Another blood bath 🔴
{future}(NVDAUSDT)
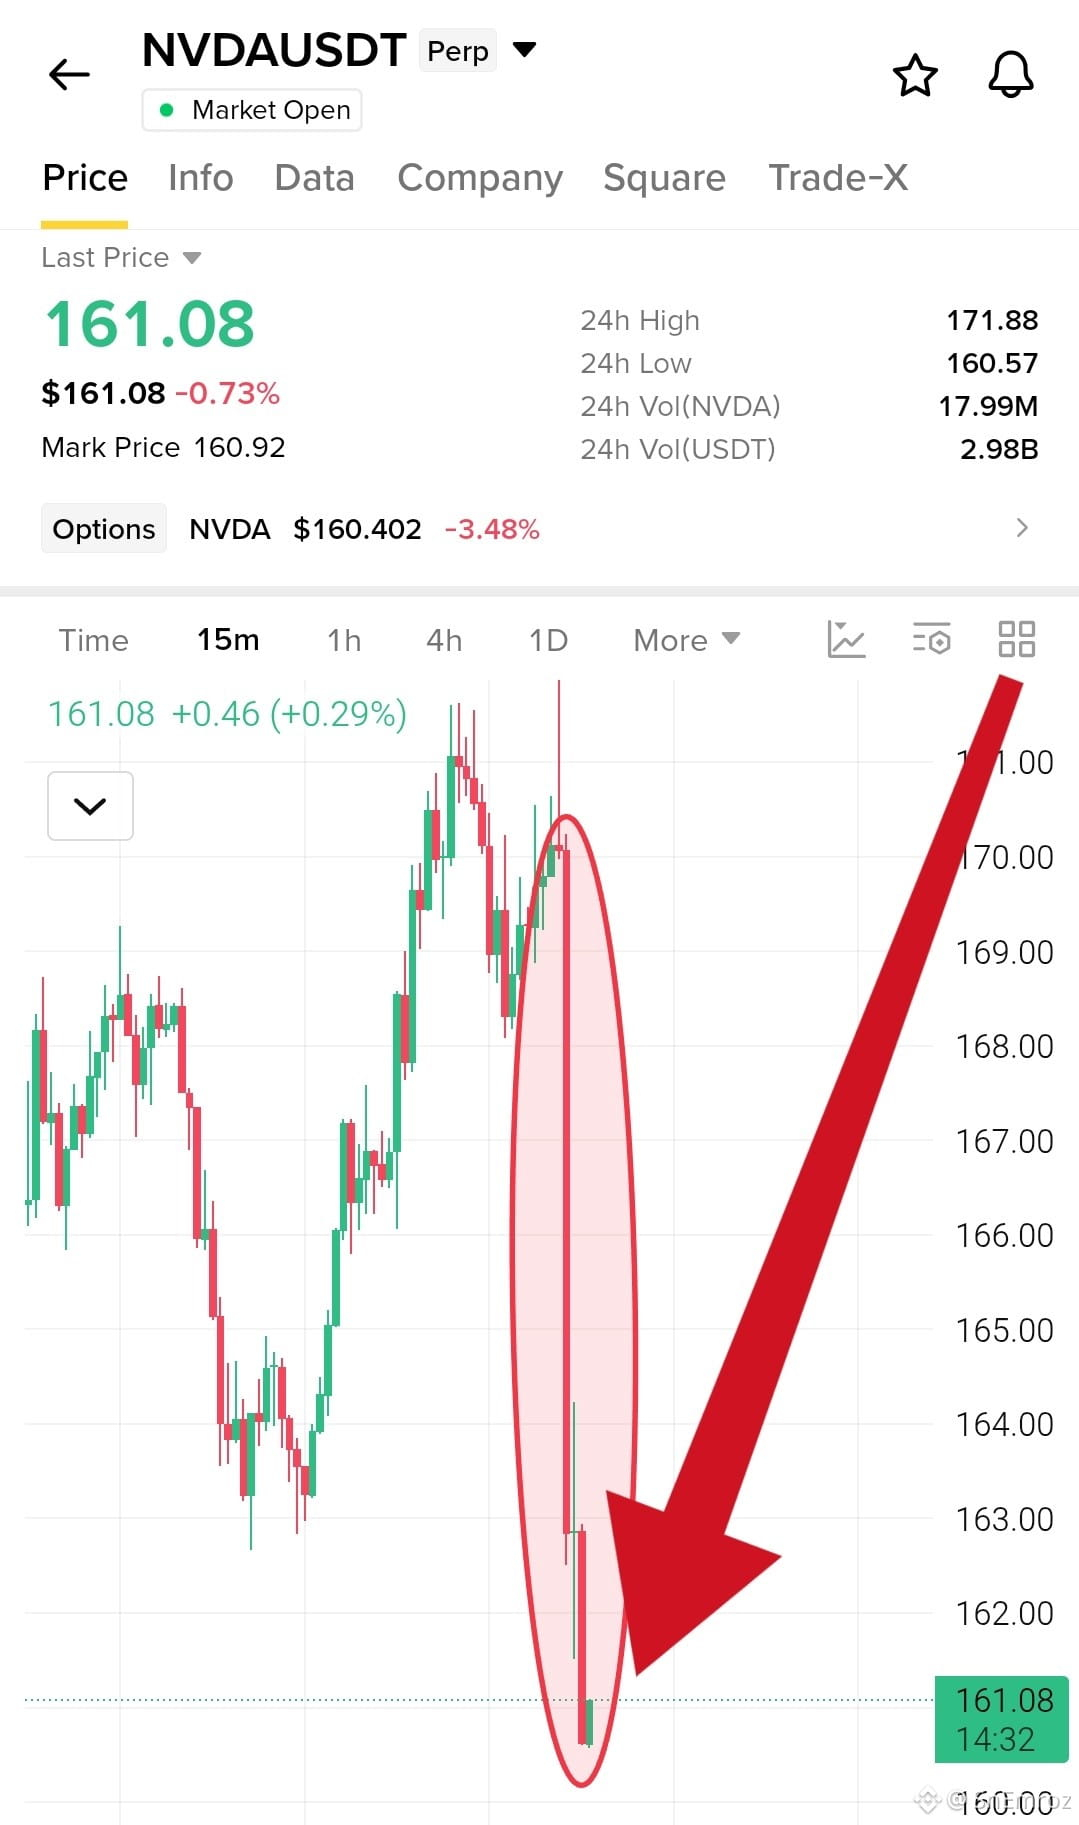
Look at this selloff. After struggling around $170 to $171 sellers stepped in aggressively and pushed price down toward $160.57
The latest candle shows a small recovery around $161 but I am not calling this a reversal yet. Buyers need to step in with stronger momentum and reclaim the lost levels.
For now the pressure is still on the downside. I will wait for confirmation before taking a position.
#CanNVDAReigniteAIRally #EarningsSeason
$NVDA Another blood bath 🔴
Look at this selloff. After struggling around $170 to $171 sellers stepped in aggressively and pushed price down toward $160.57
The latest candle shows a small recovery around $161 but I am not calling this a reversal yet. Buyers need to step in with stronger momentum and reclaim the lost levels.
For now the pressure is still on the downside. I will wait for confirmation before taking a position.
#CanNVDAReigniteAIRally #EarningsSeason
Look at this selloff. After struggling around $170 to $171 sellers stepped in aggressively and pushed price down toward $160.57
The latest candle shows a small recovery around $161 but I am not calling this a reversal yet. Buyers need to step in with stronger momentum and reclaim the lost levels.
For now the pressure is still on the downside. I will wait for confirmation before taking a position.
#CanNVDAReigniteAIRally #EarningsSeason
1
484
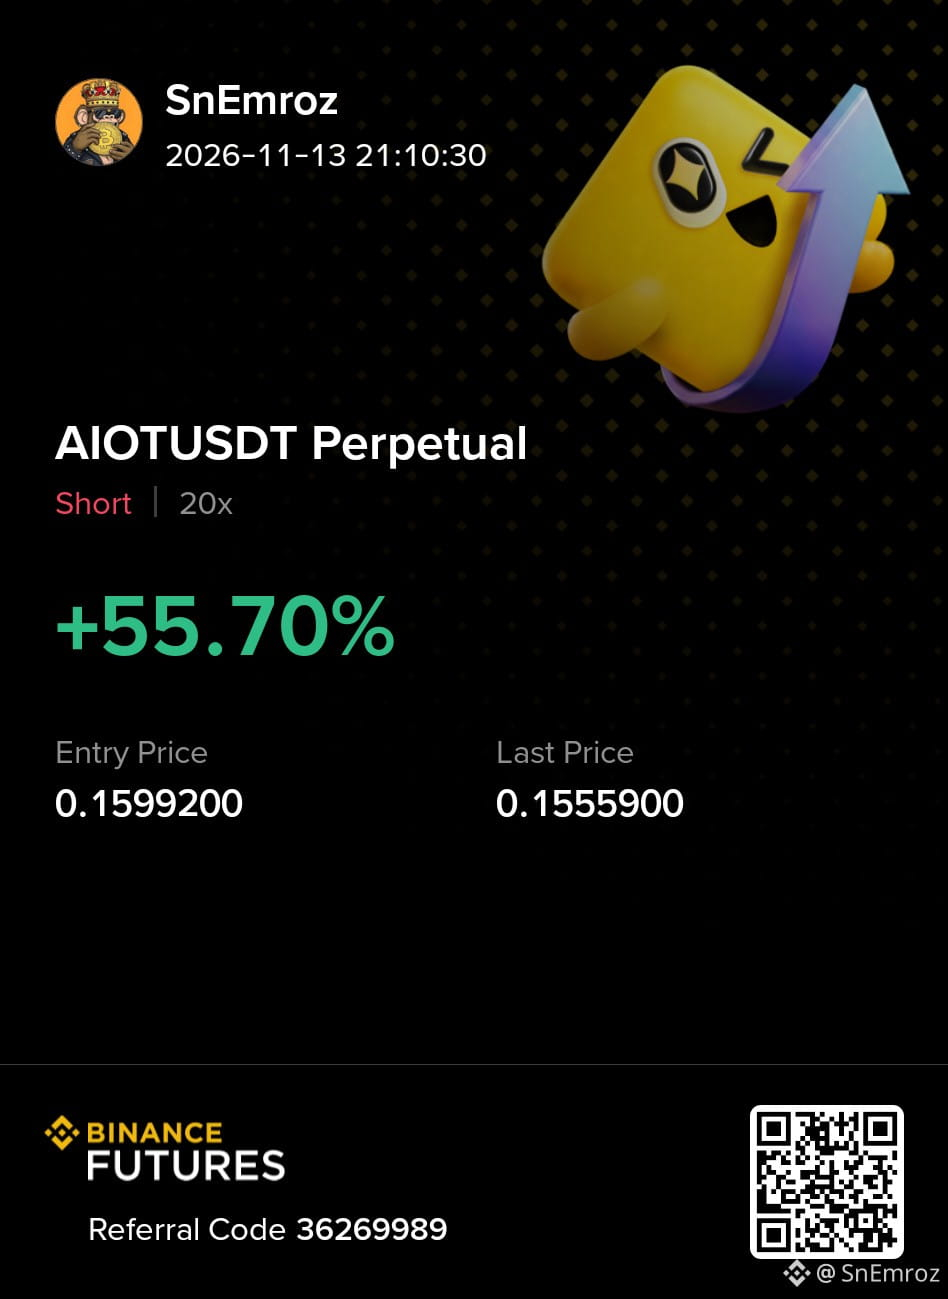
·
--
Bullish
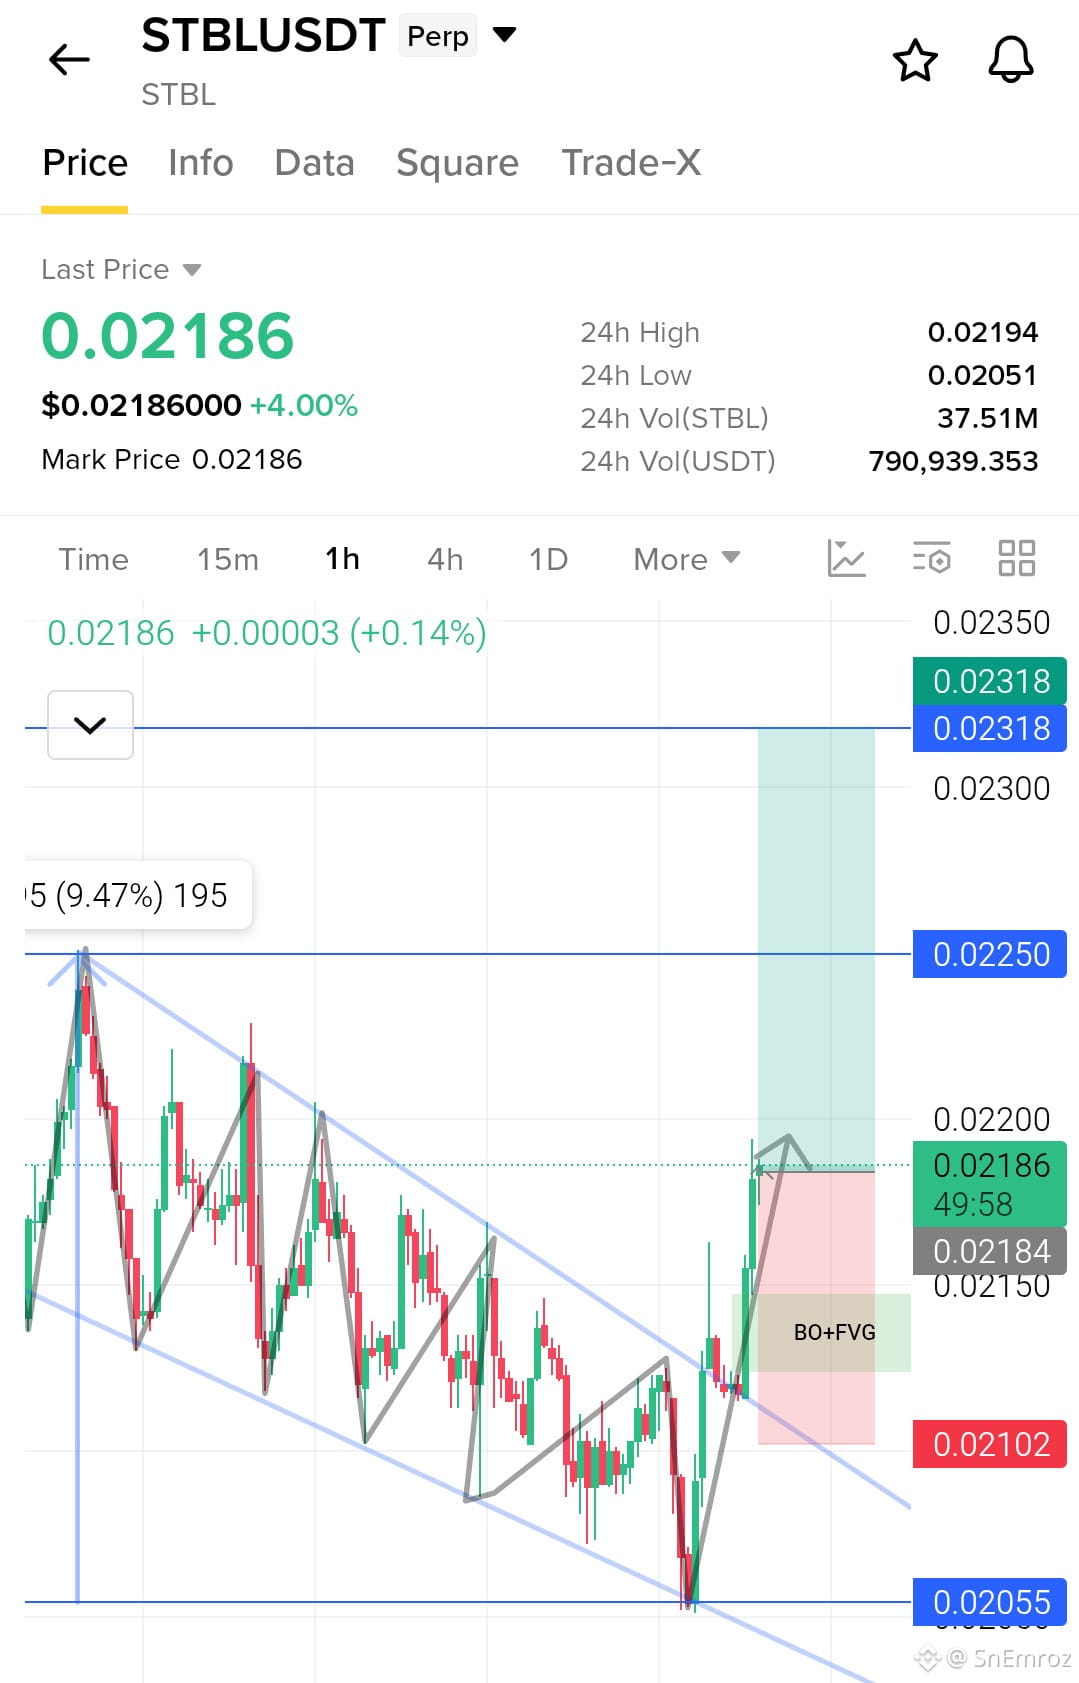
$STBL Long Setup 🟢
🔶 Falling channel breakout with FVG
Price spent a long time sliding inside a falling channel with lower highs and lower lows. After the sweep to the 0.02055 low buyers took control and a strong green push broke above the top of the channel. That move left a fair value gap near 0.02120 to 0.02160 under price. If this zone holds on any pullback the way opens to the 0.02250 high and then 0.02318. A close back under 0.02102 breaks the setup.
🟢Long Entry 0.02184
👇👇Click Here To Open Trade👇👇
{future}(STBLUSDT)
✅ Take Profits
TP1 0.02220
TP2 0.02250
TP3 0.02318
Be careful It's low cap crypto.
❌ Stop Loss 0.02102
#stbl
$STBL Long Setup 🟢
🔶 Falling channel breakout with FVG
Price spent a long time sliding inside a falling channel with lower highs and lower lows. After the sweep to the 0.02055 low buyers took control and a strong green push broke above the top of the channel. That move left a fair value gap near 0.02120 to 0.02160 under price. If this zone holds on any pullback the way opens to the 0.02250 high and then 0.02318. A close back under 0.02102 breaks the setup.
🟢Long Entry 0.02184
👇👇Click Here To Open Trade👇👇
✅ Take Profits
TP1 0.02220
TP2 0.02250
TP3 0.02318
Be careful It's low cap crypto.
❌ Stop Loss 0.02102
#stbl
🔶 Falling channel breakout with FVG
Price spent a long time sliding inside a falling channel with lower highs and lower lows. After the sweep to the 0.02055 low buyers took control and a strong green push broke above the top of the channel. That move left a fair value gap near 0.02120 to 0.02160 under price. If this zone holds on any pullback the way opens to the 0.02250 high and then 0.02318. A close back under 0.02102 breaks the setup.
🟢Long Entry 0.02184
👇👇Click Here To Open Trade👇👇
✅ Take Profits
TP1 0.02220
TP2 0.02250
TP3 0.02318
Be careful It's low cap crypto.
❌ Stop Loss 0.02102
#stbl
385
·
--
Bearish
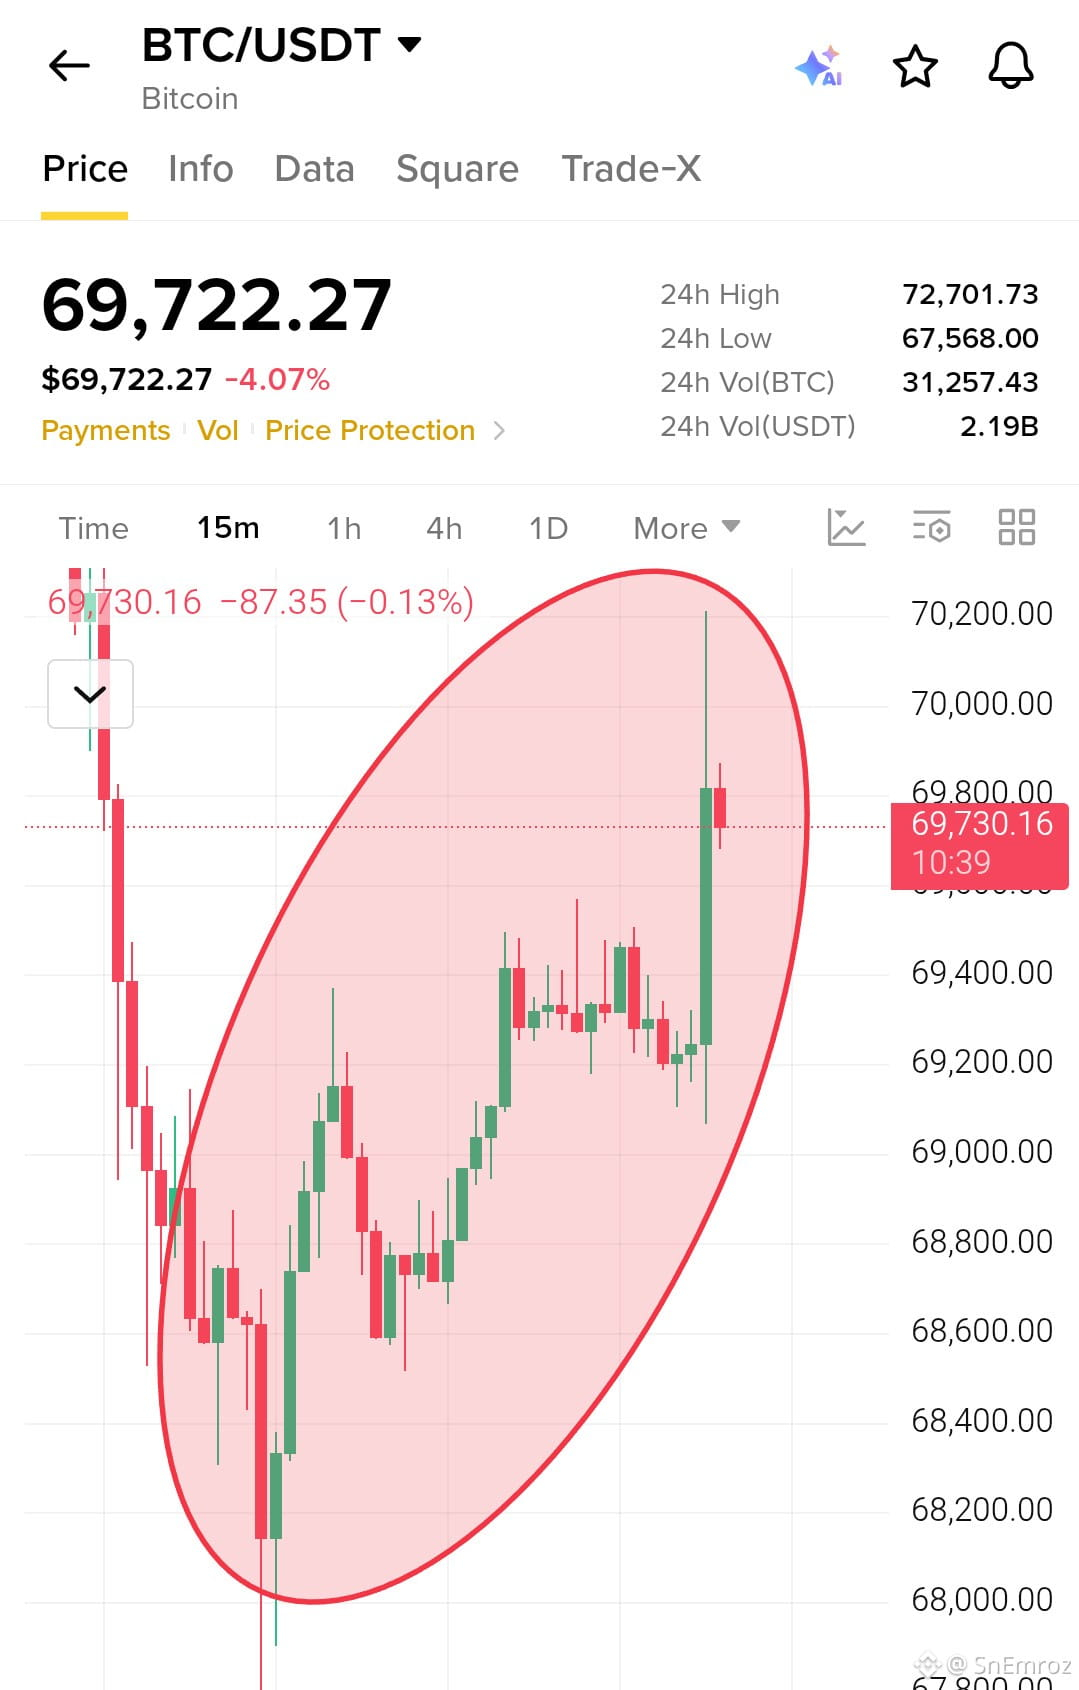
BTC is making higher highs and higher lows. But this is not bullish sentiment. It could be a trap.
In our last update $BTC was at 68881 and we said a bounce can reach 70000 to 71000 first. We also said BTC stays bearish under 73506 and not to catch the falling knife.
$BTC
{future}(BTCUSDT)
That bounce is now here. Price climbed from 68000 and wicked up to 70200. It is now at 69722. It is still down 4.07% today and far below 73506. The 24h high at 72701 is where sellers took control. This is a bounce inside a bearish structure and not a trend change.
The last push also left a long upper wick at 70200. That shows sellers rejecting the high. Late buyers who chase these small higher highs can get trapped right under that wick.
If a 1H candle closes below 69000 the higher low breaks and price can fall back toward 68000 and the 24h low at 67568.
If buyers close a 1H candle above 70200 the bounce can extend toward 71000. But nothing is bullish until BTC closes back above 73506.
For now BTC is bouncing but the bearish structure is still intact.
#BTC #EarningsSeason
BTC is making higher highs and higher lows. But this is not bullish sentiment. It could be a trap.
In our last update $BTC was at 68881 and we said a bounce can reach 70000 to 71000 first. We also said BTC stays bearish under 73506 and not to catch the falling knife.
$BTC
That bounce is now here. Price climbed from 68000 and wicked up to 70200. It is now at 69722. It is still down 4.07% today and far below 73506. The 24h high at 72701 is where sellers took control. This is a bounce inside a bearish structure and not a trend change.
The last push also left a long upper wick at 70200. That shows sellers rejecting the high. Late buyers who chase these small higher highs can get trapped right under that wick.
If a 1H candle closes below 69000 the higher low breaks and price can fall back toward 68000 and the 24h low at 67568.
If buyers close a 1H candle above 70200 the bounce can extend toward 71000. But nothing is bullish until BTC closes back above 73506.
For now BTC is bouncing but the bearish structure is still intact.
#BTC #EarningsSeason
In our last update $BTC was at 68881 and we said a bounce can reach 70000 to 71000 first. We also said BTC stays bearish under 73506 and not to catch the falling knife.
$BTC
That bounce is now here. Price climbed from 68000 and wicked up to 70200. It is now at 69722. It is still down 4.07% today and far below 73506. The 24h high at 72701 is where sellers took control. This is a bounce inside a bearish structure and not a trend change.
The last push also left a long upper wick at 70200. That shows sellers rejecting the high. Late buyers who chase these small higher highs can get trapped right under that wick.
If a 1H candle closes below 69000 the higher low breaks and price can fall back toward 68000 and the 24h low at 67568.
If buyers close a 1H candle above 70200 the bounce can extend toward 71000. But nothing is bullish until BTC closes back above 73506.
For now BTC is bouncing but the bearish structure is still intact.
#BTC #EarningsSeason
2
2
630
·
--
Bearish
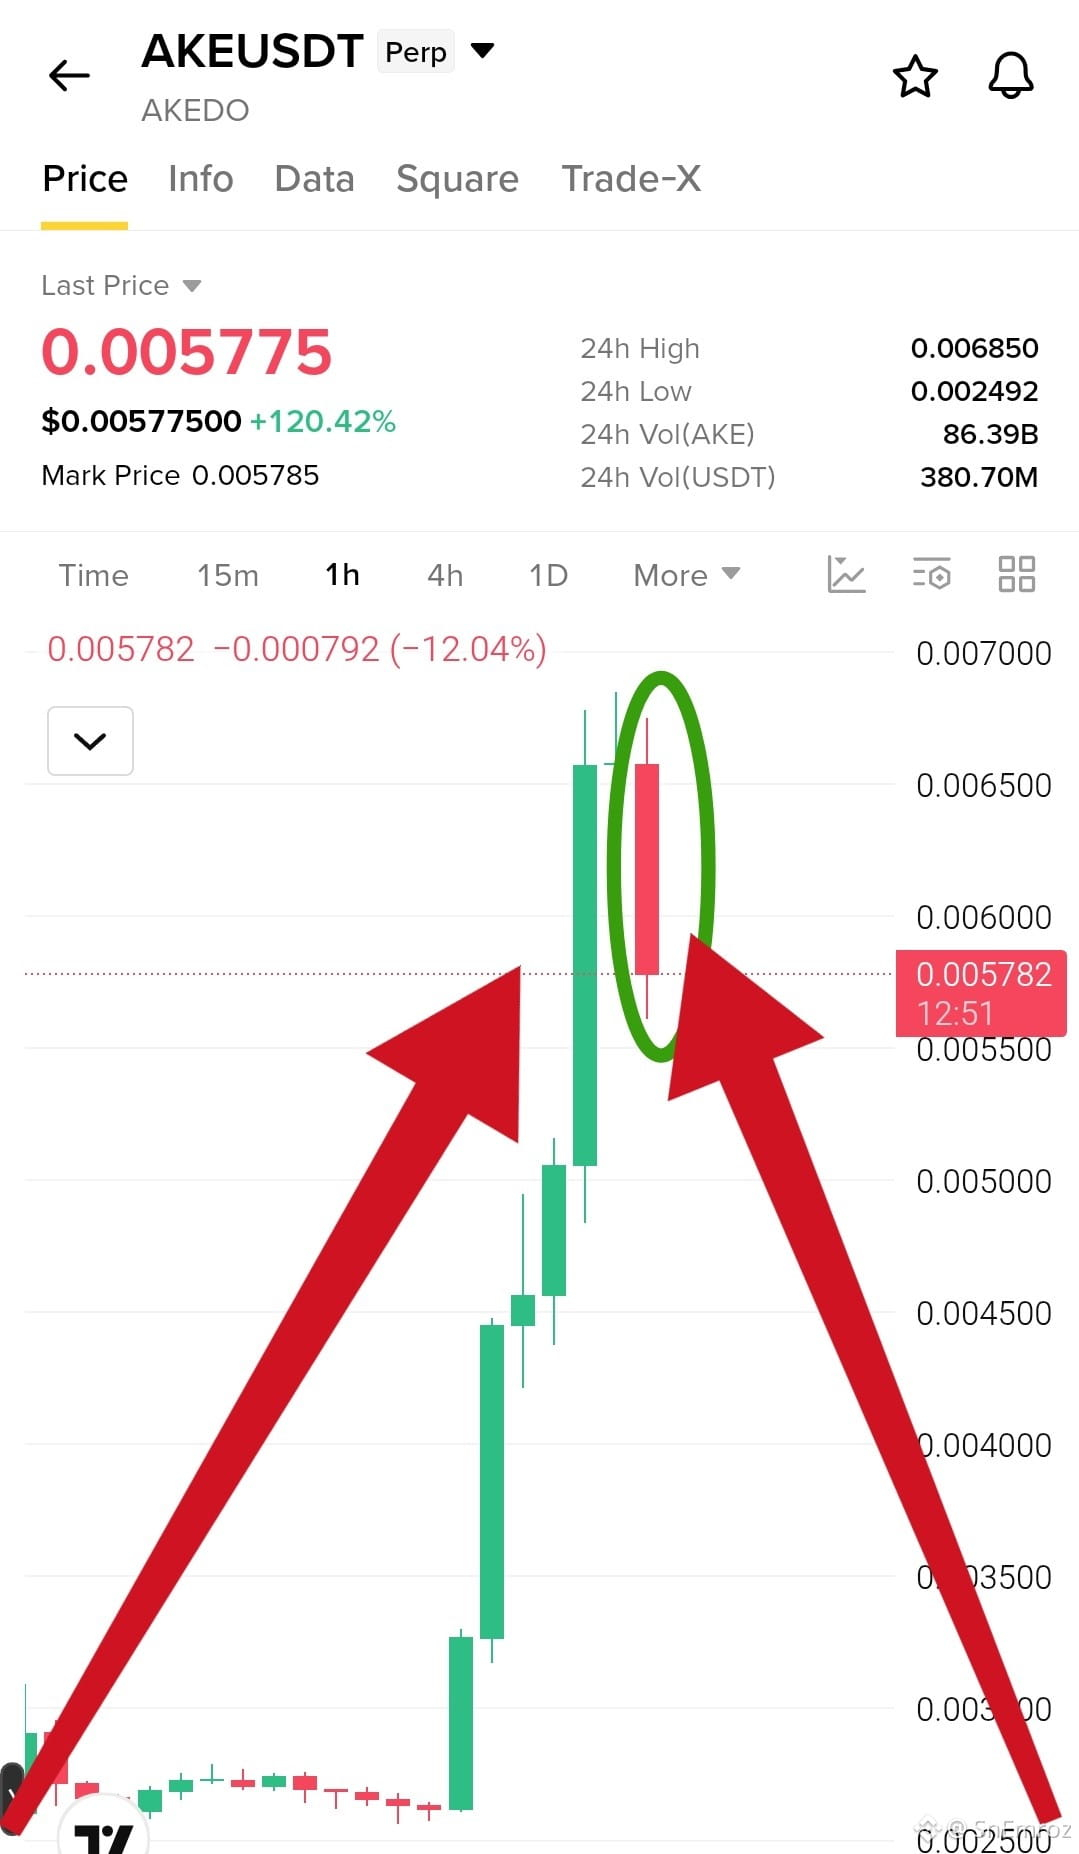
Someone just created big sell pressure on $AKE. What should we do now. As small traders we need to wait.
$AKE is at 0.005775 and still up 120% today. It ran from the 24h low of 0.002492 to the high of 0.006850 in a very short time. Then one big red 1H candle appeared at the top and dropped about 12% in one hour. It came after a long run of green candles and the 24h volume is 380M USDT.
{future}(AKEUSDT)
This does not confirm a top yet. But it shows sellers are active at the highs. Late buyers are now trapped and a big seller can push price down fast.
The run up also printed huge green candles with almost no pullback. That means there is little real support under price. If 0.00525 breaks a slide toward 0.00450 and then 0.00330 is possible.
If buyers recover and close above 0.00657 the sellers lose and the pump can continue.
What small traders should do. Do not chase the green. Do not short blindly. Do not use high leverage on a coin that moves 12% in one hour. Wait for a 1H close below 0.00525 or a clean rejection from 0.00600 to 0.00657. Take a trade only after that.
For now AKE has strong sell pressure at the highs and the next 1H closes will decide. Patience is also a position.
Someone just created big sell pressure on $AKE . What should we do now. As small traders we need to wait.
$AKE is at 0.005775 and still up 120% today. It ran from the 24h low of 0.002492 to the high of 0.006850 in a very short time. Then one big red 1H candle appeared at the top and dropped about 12% in one hour. It came after a long run of green candles and the 24h volume is 380M USDT.
This does not confirm a top yet. But it shows sellers are active at the highs. Late buyers are now trapped and a big seller can push price down fast.
The run up also printed huge green candles with almost no pullback. That means there is little real support under price. If 0.00525 breaks a slide toward 0.00450 and then 0.00330 is possible.
If buyers recover and close above 0.00657 the sellers lose and the pump can continue.
What small traders should do. Do not chase the green. Do not short blindly. Do not use high leverage on a coin that moves 12% in one hour. Wait for a 1H close below 0.00525 or a clean rejection from 0.00600 to 0.00657. Take a trade only after that.
For now AKE has strong sell pressure at the highs and the next 1H closes will decide. Patience is also a position.
$AKE is at 0.005775 and still up 120% today. It ran from the 24h low of 0.002492 to the high of 0.006850 in a very short time. Then one big red 1H candle appeared at the top and dropped about 12% in one hour. It came after a long run of green candles and the 24h volume is 380M USDT.
This does not confirm a top yet. But it shows sellers are active at the highs. Late buyers are now trapped and a big seller can push price down fast.
The run up also printed huge green candles with almost no pullback. That means there is little real support under price. If 0.00525 breaks a slide toward 0.00450 and then 0.00330 is possible.
If buyers recover and close above 0.00657 the sellers lose and the pump can continue.
What small traders should do. Do not chase the green. Do not short blindly. Do not use high leverage on a coin that moves 12% in one hour. Wait for a 1H close below 0.00525 or a clean rejection from 0.00600 to 0.00657. Take a trade only after that.
For now AKE has strong sell pressure at the highs and the next 1H closes will decide. Patience is also a position.
2
1
1.7k
·
--
Bearish
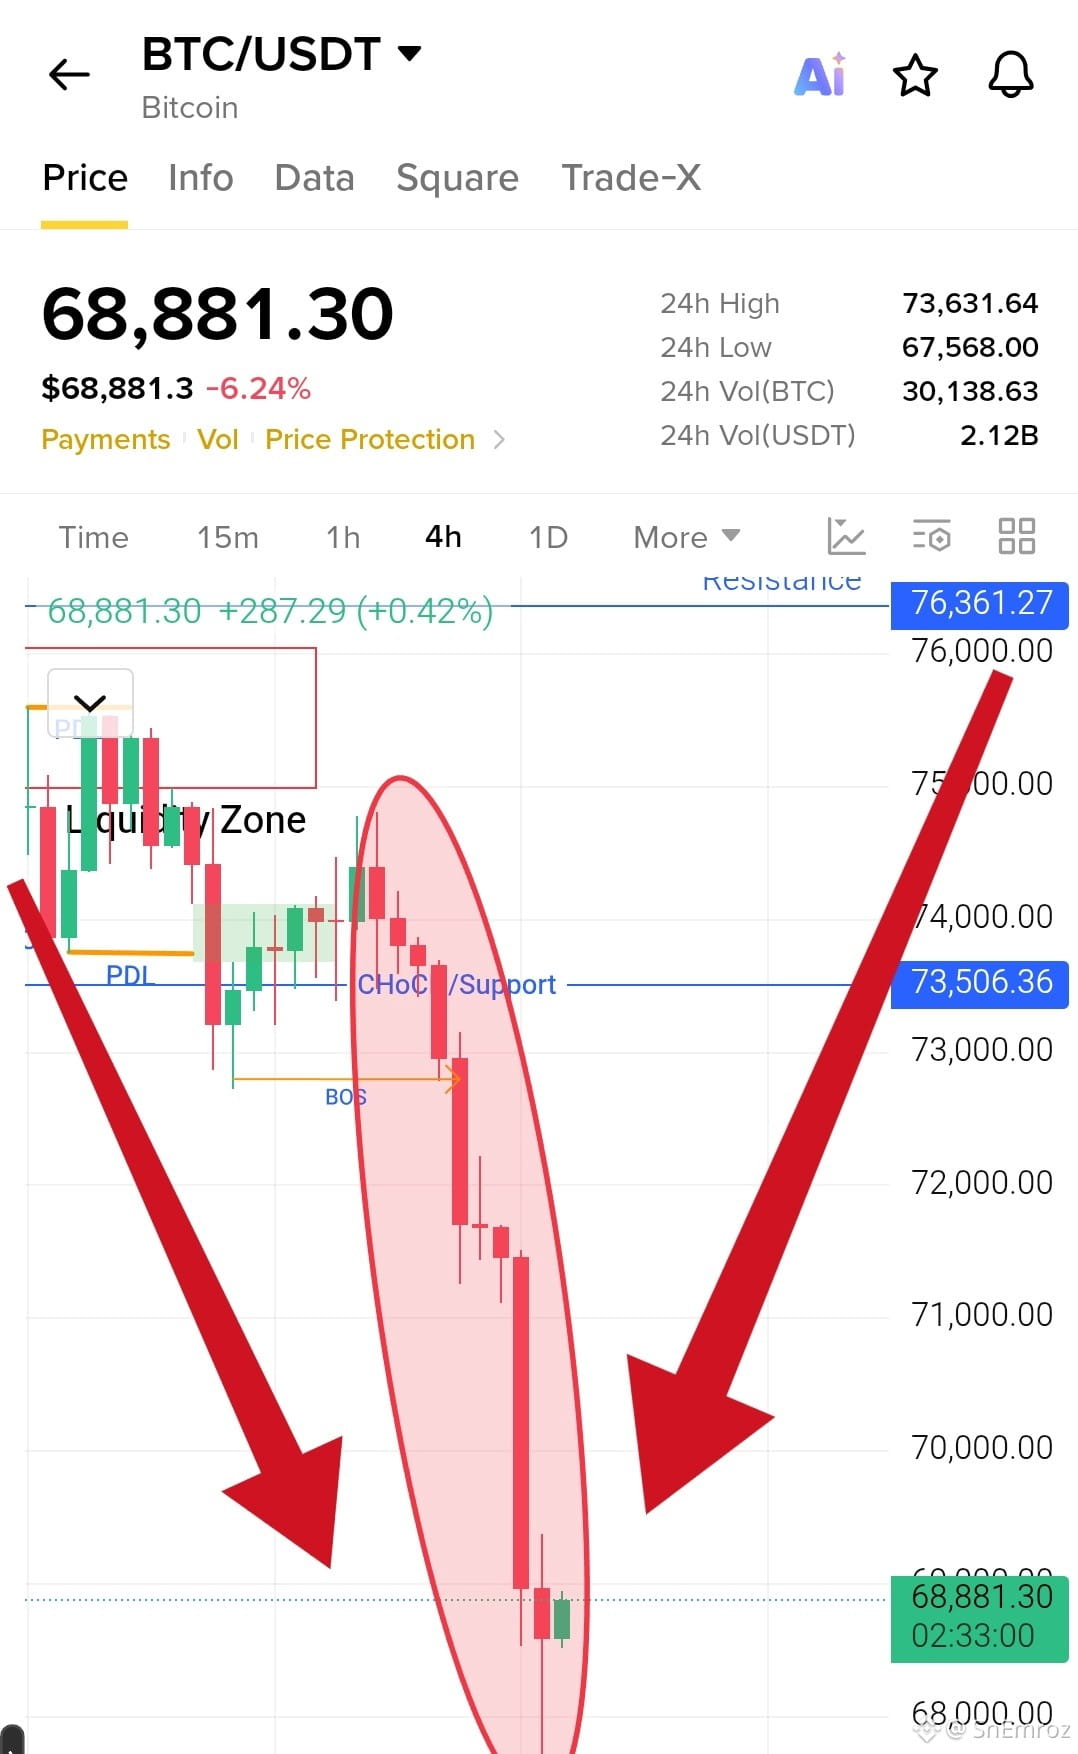
It is not called a crash. It is called a bloodbath.
$BTC is now at 68881 and down 6.24% today. When BTC was at 74025 we told you 73470 was the key support. We said a close below it can send price toward 73000 and lower. Sellers broke it and price never looked back. It wicked down to 67568. That is about 7% lower than our last update.
Look at the candles. Huge red bodies and almost no pullbacks. CHoCH then BOS then straight down. This is not a normal dip.
Support now is the 24h low at 67568. A 4H close below it can slide toward 66000 and then 65000. If buyers hold it a bounce can reach 70000 to 71000 first.
The big resistance is the old support at 73506 and above it 76361. We also said any bounce under 76300 is only a bounce. That still stands.
For now BTC stays bearish under 73506. Do not try to catch the falling knife. Wait for a 4H close before taking a side.
$BTC #earningsession
{future}(BTCUSDT)
It is not called a crash. It is called a bloodbath.
$BTC is now at 68881 and down 6.24% today. When BTC was at 74025 we told you 73470 was the key support. We said a close below it can send price toward 73000 and lower. Sellers broke it and price never looked back. It wicked down to 67568. That is about 7% lower than our last update.
Look at the candles. Huge red bodies and almost no pullbacks. CHoCH then BOS then straight down. This is not a normal dip.
Support now is the 24h low at 67568. A 4H close below it can slide toward 66000 and then 65000. If buyers hold it a bounce can reach 70000 to 71000 first.
The big resistance is the old support at 73506 and above it 76361. We also said any bounce under 76300 is only a bounce. That still stands.
For now BTC stays bearish under 73506. Do not try to catch the falling knife. Wait for a 4H close before taking a side.
$BTC #earningsession
$BTC is now at 68881 and down 6.24% today. When BTC was at 74025 we told you 73470 was the key support. We said a close below it can send price toward 73000 and lower. Sellers broke it and price never looked back. It wicked down to 67568. That is about 7% lower than our last update.
Look at the candles. Huge red bodies and almost no pullbacks. CHoCH then BOS then straight down. This is not a normal dip.
Support now is the 24h low at 67568. A 4H close below it can slide toward 66000 and then 65000. If buyers hold it a bounce can reach 70000 to 71000 first.
The big resistance is the old support at 73506 and above it 76361. We also said any bounce under 76300 is only a bounce. That still stands.
For now BTC stays bearish under 73506. Do not try to catch the falling knife. Wait for a 4H close before taking a side.
$BTC #earningsession
1
1.4k
·
--
Bearish
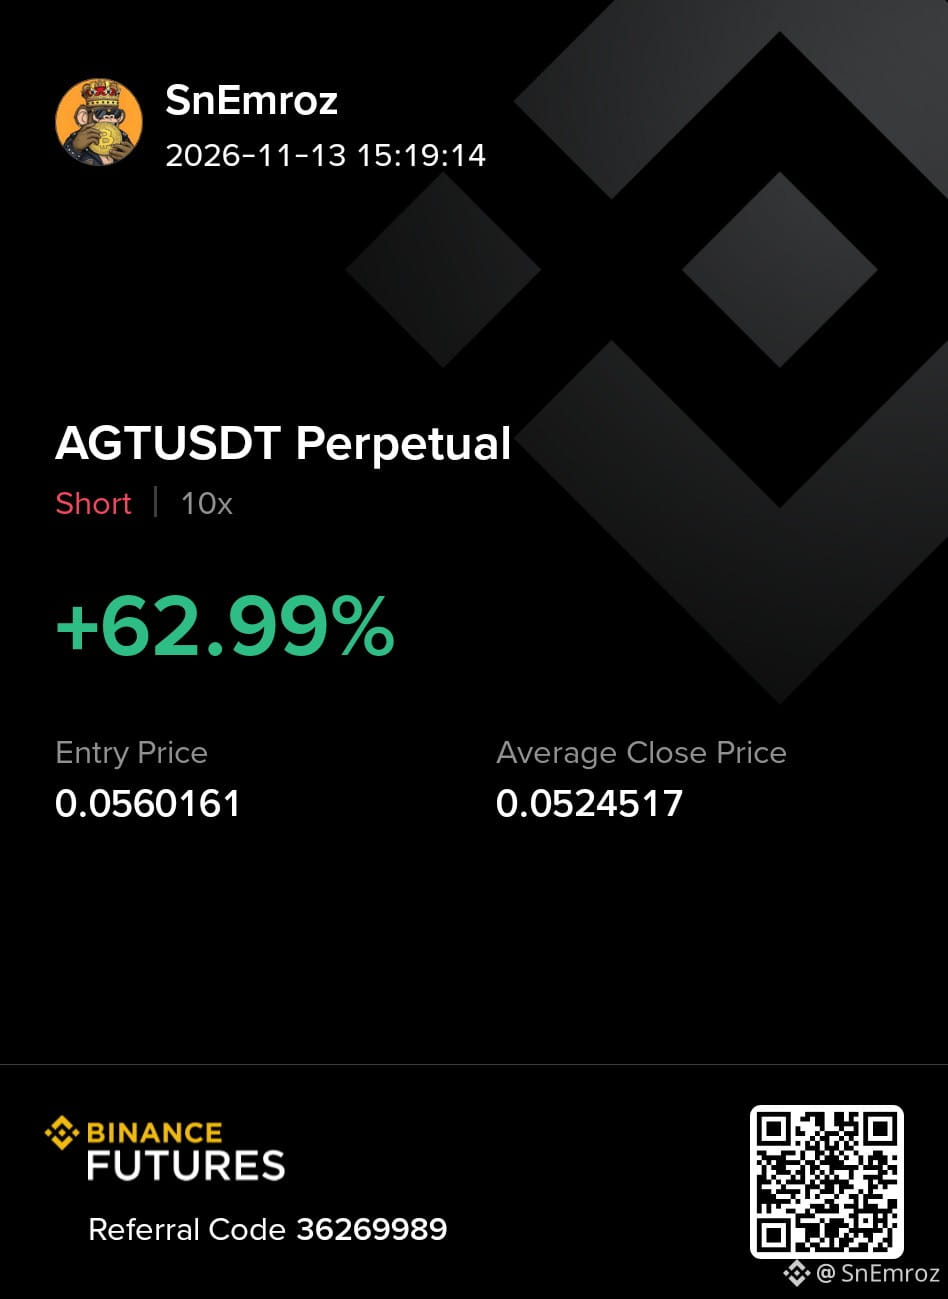
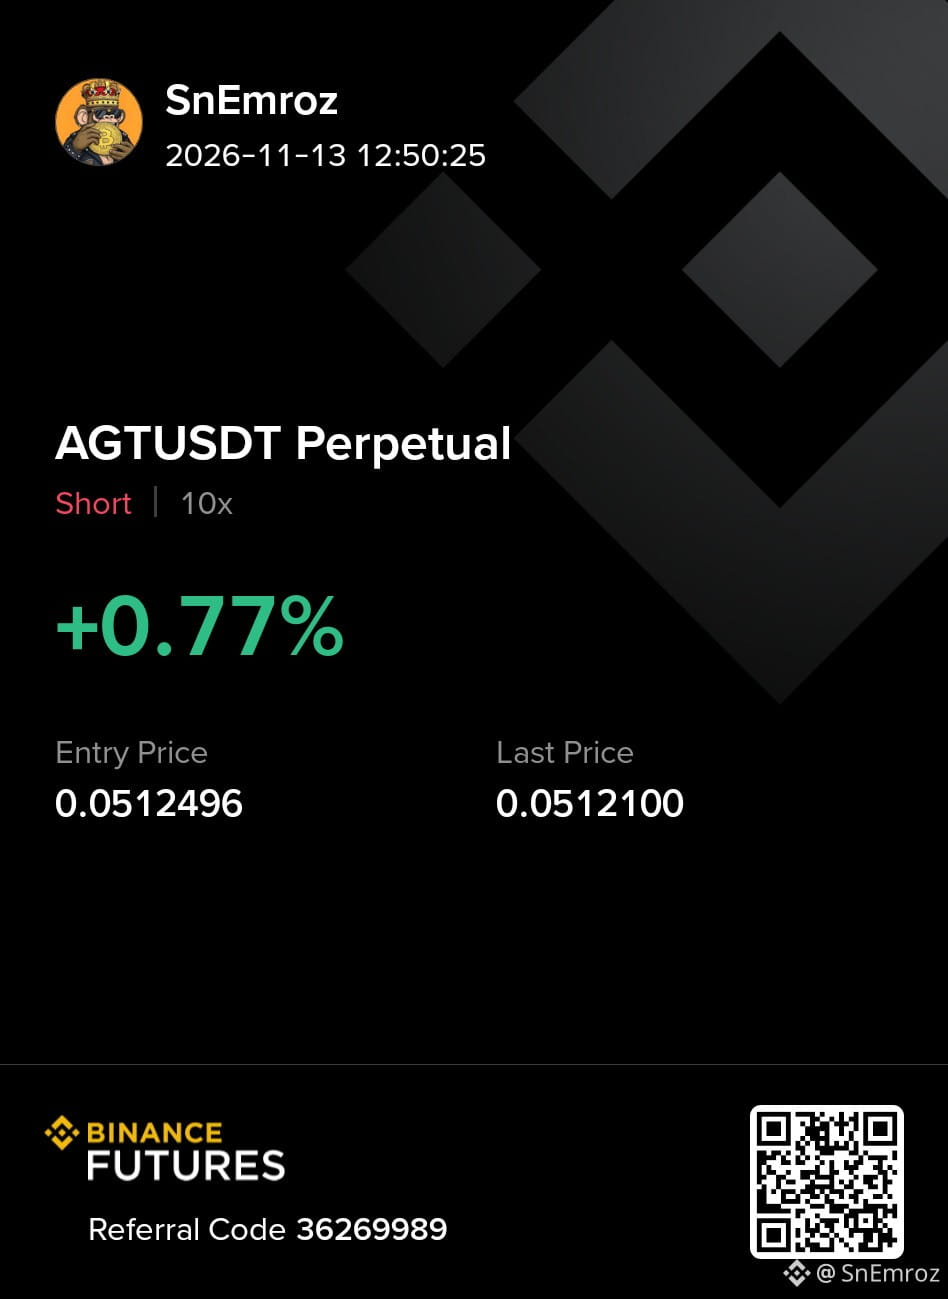
$AGT running.....
i told you yet to join.
{future}(AGTUSDT)
$AGT running.....
i told you yet to join.
i told you yet to join.
2
545
·
--
Bearish
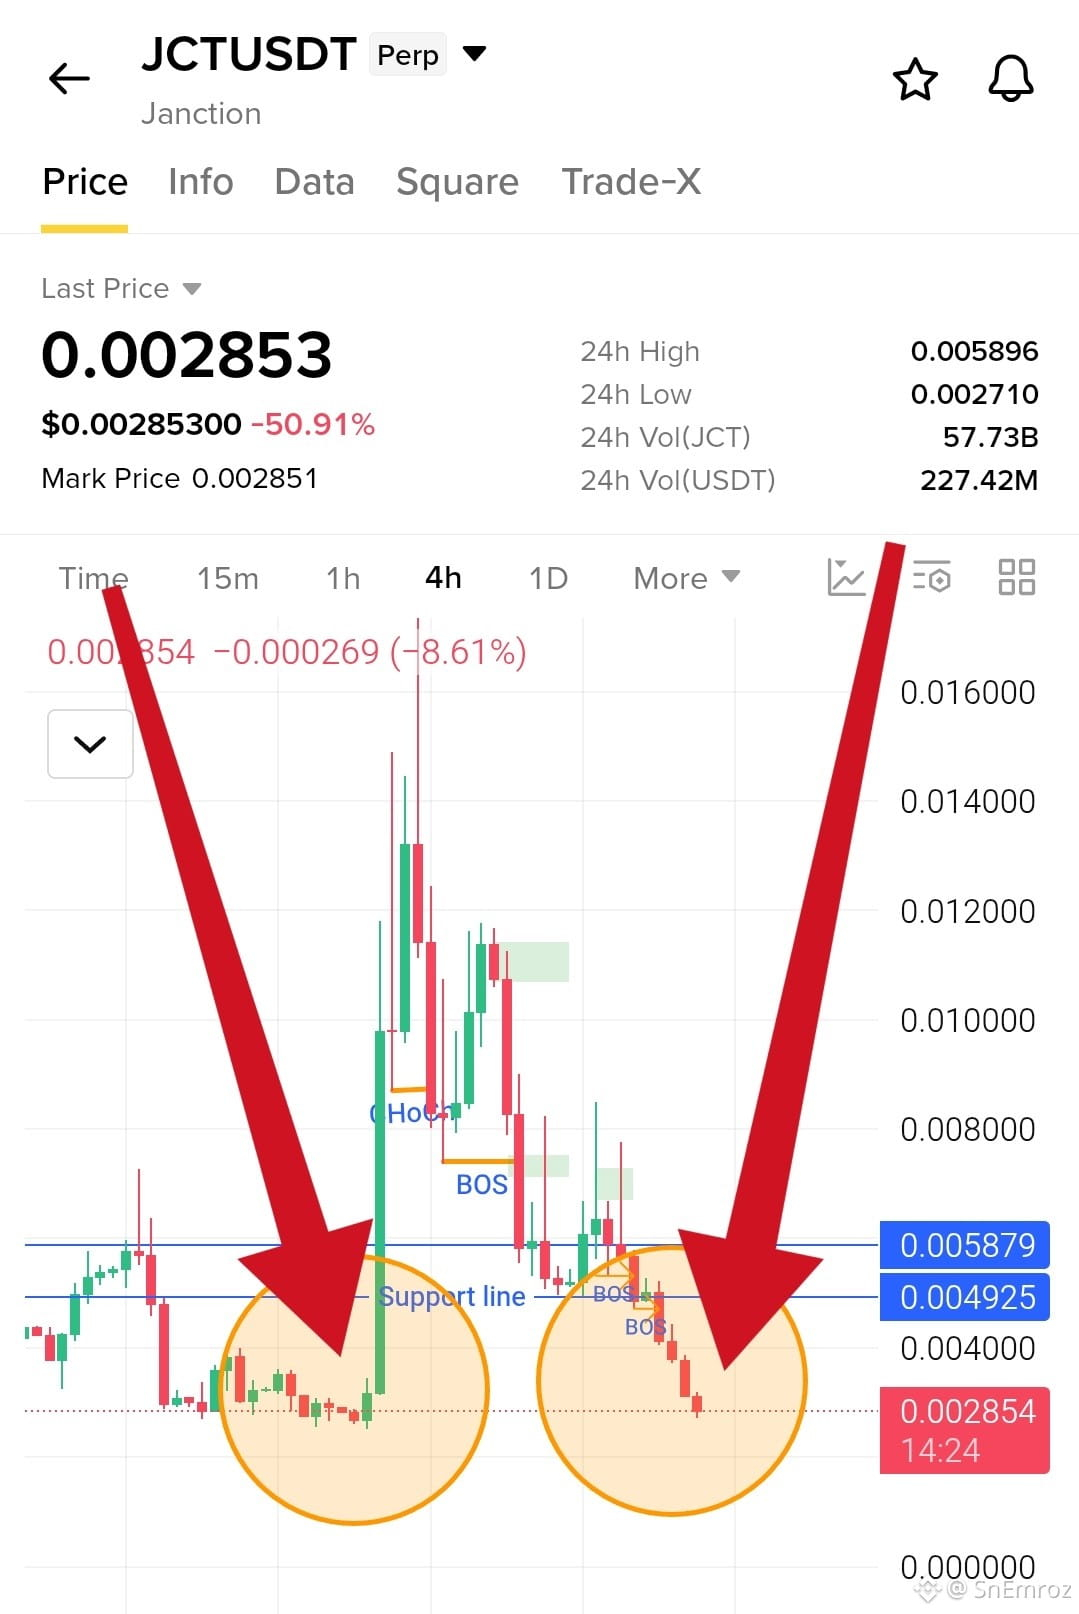
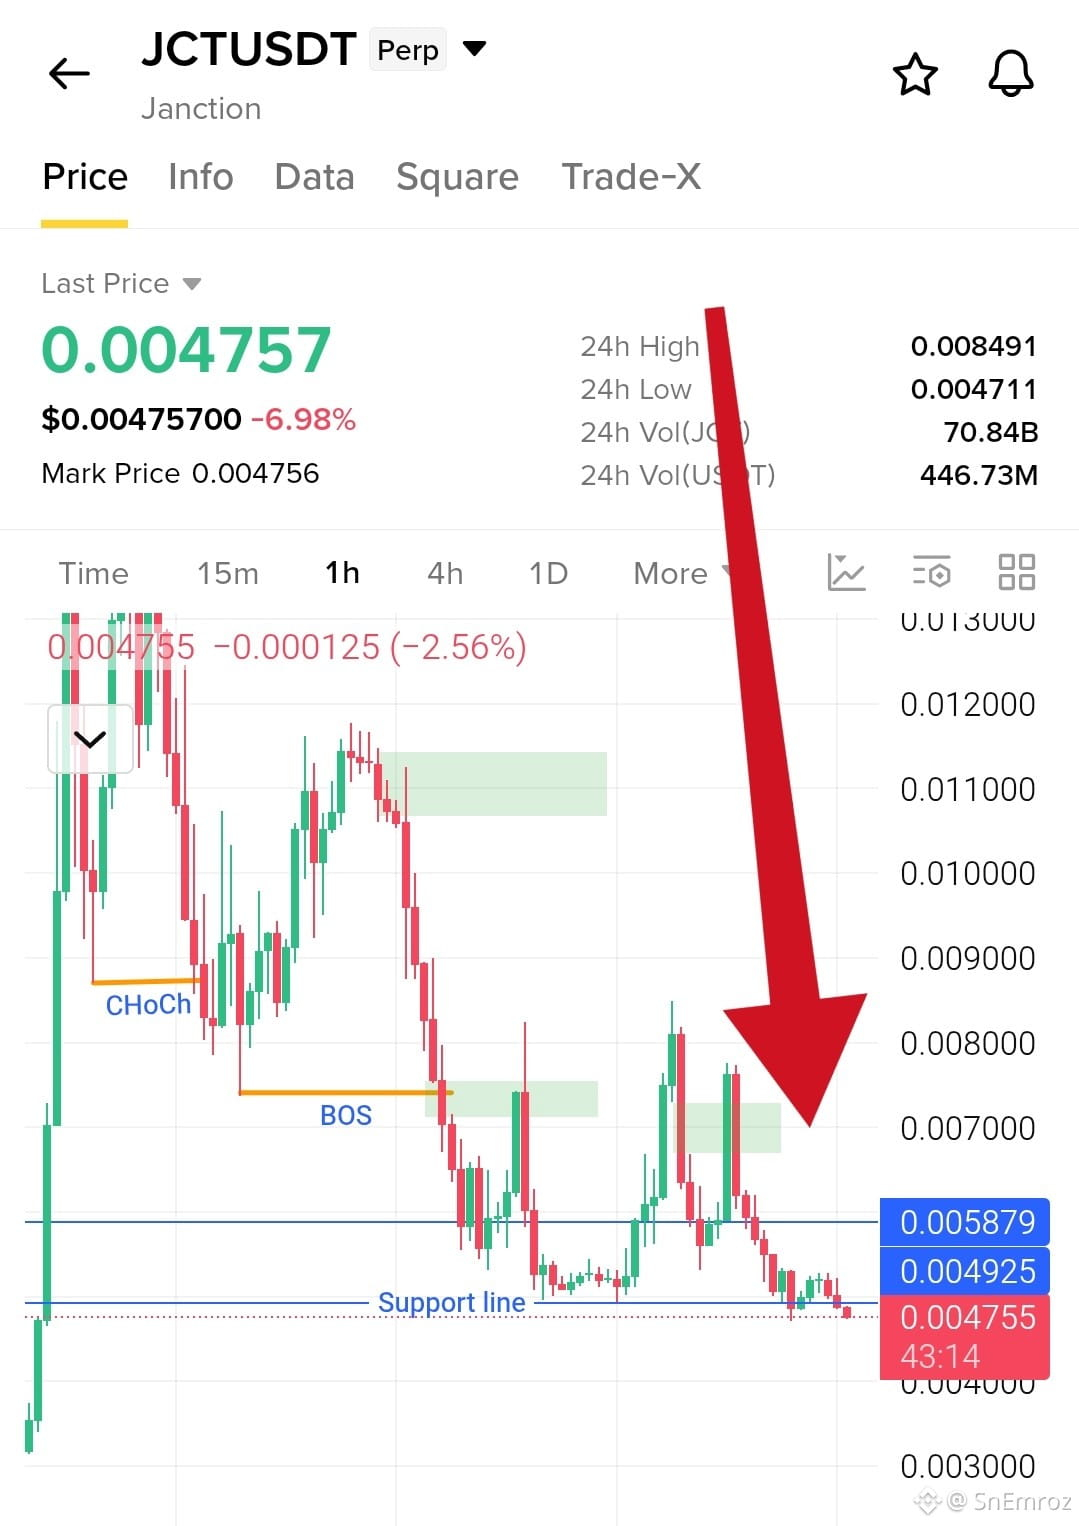
Look.. $JCT My Word is Word...
{future}(JCTUSDT)
Check my Last Post about JCT... What i told you.. Here is result.....
Look.. $JCT My Word is Word...
Check my Last Post about JCT... What i told you.. Here is result.....
Check my Last Post about JCT... What i told you.. Here is result.....
4
2
1.8k
·
--
Personally I see this pullback as a potential buying opportunity, but I don't want to rush in before earnings confirmation.
A 25 to 30% drop from the October high is significant. However the broader AI selloff raises questions about whether this is just a correction or the beginning of a deeper pullback.
I'm watching earnings forward guidance and AI demand closely. If the results restore confidence I could turn bullish. If guidance disappoints I would stay cautious.
For now I'm waiting for confirmation rather than trying to catch the bottom.
#CanNVDAReigniteAIRally #EarningsSeason
Personally I see this pullback as a potential buying opportunity, but I don't want to rush in before earnings confirmation.
A 25 to 30% drop from the October high is significant. However the broader AI selloff raises questions about whether this is just a correction or the beginning of a deeper pullback.
I'm watching earnings forward guidance and AI demand closely. If the results restore confidence I could turn bullish. If guidance disappoints I would stay cautious.
For now I'm waiting for confirmation rather than trying to catch the bottom.
#CanNVDAReigniteAIRally #EarningsSeason
A 25 to 30% drop from the October high is significant. However the broader AI selloff raises questions about whether this is just a correction or the beginning of a deeper pullback.
I'm watching earnings forward guidance and AI demand closely. If the results restore confidence I could turn bullish. If guidance disappoints I would stay cautious.
For now I'm waiting for confirmation rather than trying to catch the bottom.
#CanNVDAReigniteAIRally #EarningsSeason

3
574
·
--
Bearish
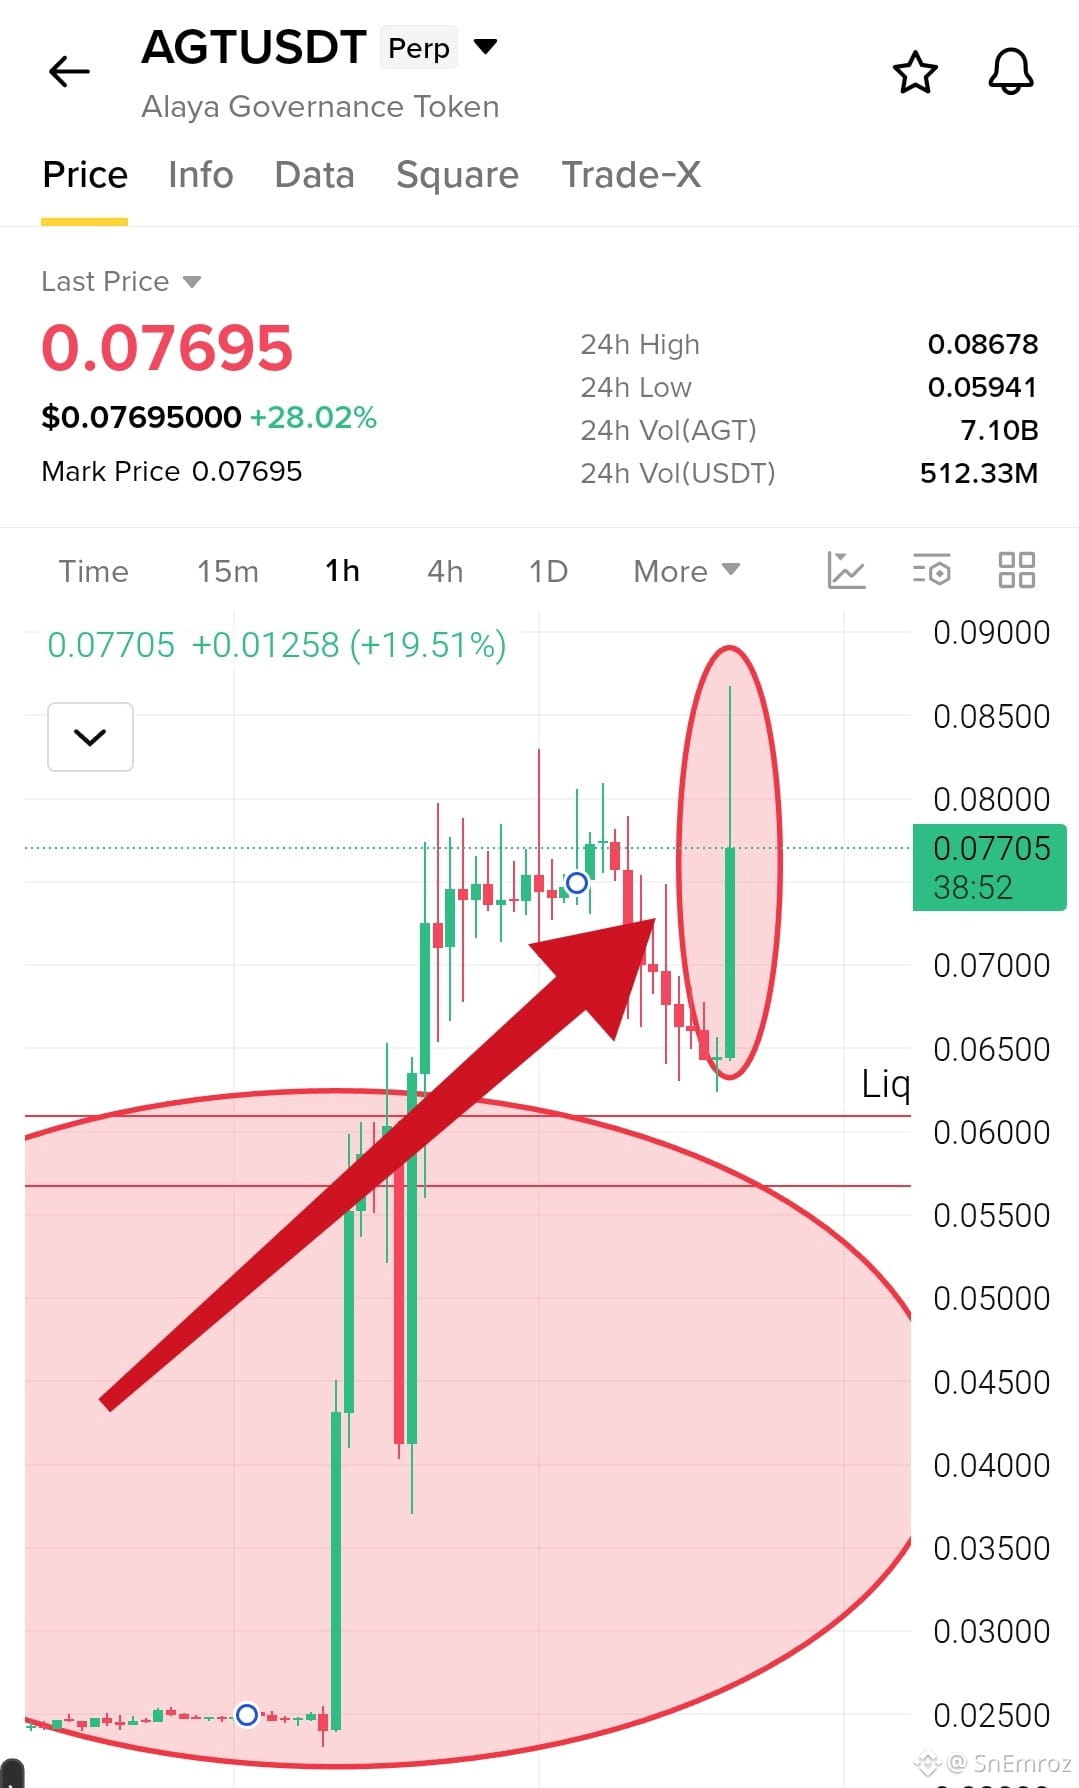
Look the $AGT behaviour, why I told you I will wait until confirmation..
After a massive breakout from around $0.024, price pushed toward $0.077 and started consolidating.
Then sellers stepped in, pushing price back around toward $0.064 to $0.065. But look at the latest candle. Buyers came back strongly and pushed price toward $0.077 again.
Now I want to see whether price can close above the recent resistance around $0.077 to $0.078. I won't rush. Let the market confirm its next move first.
{future}(AGTUSDT)
Patience over FOMO. 👀
Look the $AGT behaviour, why I told you I will wait until confirmation..
After a massive breakout from around $0.024, price pushed toward $0.077 and started consolidating.
Then sellers stepped in, pushing price back around toward $0.064 to $0.065. But look at the latest candle. Buyers came back strongly and pushed price toward $0.077 again.
Now I want to see whether price can close above the recent resistance around $0.077 to $0.078. I won't rush. Let the market confirm its next move first.
Patience over FOMO. 👀
After a massive breakout from around $0.024, price pushed toward $0.077 and started consolidating.
Then sellers stepped in, pushing price back around toward $0.064 to $0.065. But look at the latest candle. Buyers came back strongly and pushed price toward $0.077 again.
Now I want to see whether price can close above the recent resistance around $0.077 to $0.078. I won't rush. Let the market confirm its next move first.
Patience over FOMO. 👀
1
867
·
--
Bearish
$SXT and why verifiable data matters.
AI and DeFi both run on data. But most of that data comes from a middle layer that you simply have to trust. That is the weak point.
@SpaceandTimeDB is a Microsoft backed blockchain for ZK proven data. A ZK proof lets anyone check that a data result is correct without trusting who produced it. That is the core idea behind $SXT.
Three places where this matters.
AI. An agent can act on data that is proven and not guessed.
Tokenization. Real world assets need data that is accurate and can be checked on chain.
DeFi. Protocols can rely on verified data and not on a single source that can fail or be manipulated.
The trade card below shows my $SXT position. I am following this project for the narrative and not for hype. Verifiable data for AI tokenization and DeFi is a real problem and the product has to be used for the story to matter.
Not financial advice. Always manage your risk.
#SXT
$SXT and why verifiable data matters.
AI and DeFi both run on data. But most of that data comes from a middle layer that you simply have to trust. That is the weak point.
@SpaceandTime is a Microsoft backed blockchain for ZK proven data. A ZK proof lets anyone check that a data result is correct without trusting who produced it. That is the core idea behind $SXT .
Three places where this matters.
AI. An agent can act on data that is proven and not guessed.
Tokenization. Real world assets need data that is accurate and can be checked on chain.
DeFi. Protocols can rely on verified data and not on a single source that can fail or be manipulated.
The trade card below shows my $SXT position. I am following this project for the narrative and not for hype. Verifiable data for AI tokenization and DeFi is a real problem and the product has to be used for the story to matter.
Not financial advice. Always manage your risk.
#SXT
AI and DeFi both run on data. But most of that data comes from a middle layer that you simply have to trust. That is the weak point.
@SpaceandTime is a Microsoft backed blockchain for ZK proven data. A ZK proof lets anyone check that a data result is correct without trusting who produced it. That is the core idea behind $SXT .
Three places where this matters.
AI. An agent can act on data that is proven and not guessed.
Tokenization. Real world assets need data that is accurate and can be checked on chain.
DeFi. Protocols can rely on verified data and not on a single source that can fail or be manipulated.
The trade card below shows my $SXT position. I am following this project for the narrative and not for hype. Verifiable data for AI tokenization and DeFi is a real problem and the product has to be used for the story to matter.
Not financial advice. Always manage your risk.
#SXT
157
·
--
Bullish
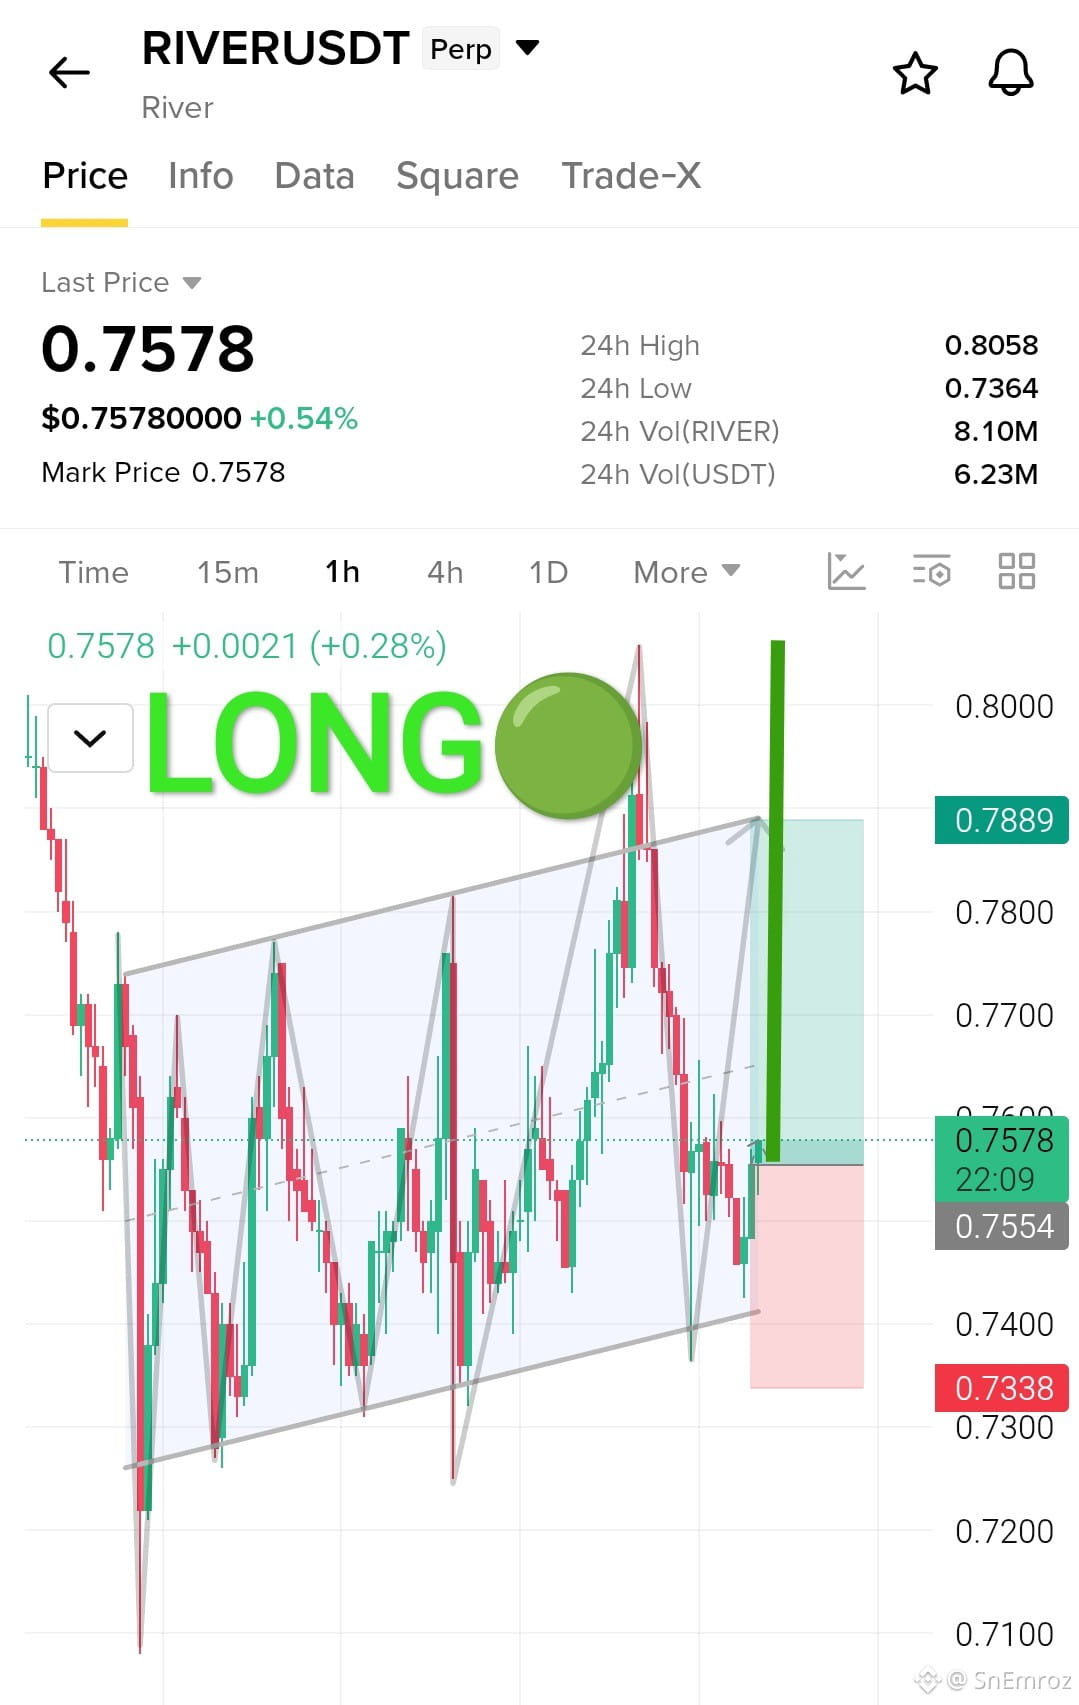
$RIVER Long Setup 1h Chart🟢
🔶 Rising channel bounce
Price has been moving inside a rising channel with higher lows. The last drop tapped the channel bottom near 0.7365 and buyers pushed it back up with green candles. Price is now holding above 0.7554 and heading for the channel middle line near 0.7650. The channel top near 0.7889 is the final target. A close under 0.7338 breaks the setup.
🟢Long Entry 0.7578
👇👇Click Here Direct Open Chart👇👇
{future}(RIVERUSDT)
✅ Take Profits
TP1 0.7650
TP2 0.7770
TP3 0.7889
❌ Stop Loss 0.7338
#river
$RIVER Long Setup 1h Chart🟢
🔶 Rising channel bounce
Price has been moving inside a rising channel with higher lows. The last drop tapped the channel bottom near 0.7365 and buyers pushed it back up with green candles. Price is now holding above 0.7554 and heading for the channel middle line near 0.7650. The channel top near 0.7889 is the final target. A close under 0.7338 breaks the setup.
🟢Long Entry 0.7578
👇👇Click Here Direct Open Chart👇👇
✅ Take Profits
TP1 0.7650
TP2 0.7770
TP3 0.7889
❌ Stop Loss 0.7338
#river
🔶 Rising channel bounce
Price has been moving inside a rising channel with higher lows. The last drop tapped the channel bottom near 0.7365 and buyers pushed it back up with green candles. Price is now holding above 0.7554 and heading for the channel middle line near 0.7650. The channel top near 0.7889 is the final target. A close under 0.7338 breaks the setup.
🟢Long Entry 0.7578
👇👇Click Here Direct Open Chart👇👇
✅ Take Profits
TP1 0.7650
TP2 0.7770
TP3 0.7889
❌ Stop Loss 0.7338
#river
1
835
·
--
How about this Profit?
Can it change Someone Life?
This is $INIT
How about this Profit?
Can it change Someone Life?
This is $INIT
Can it change Someone Life?
This is $INIT
2
215
·
--
Bullish
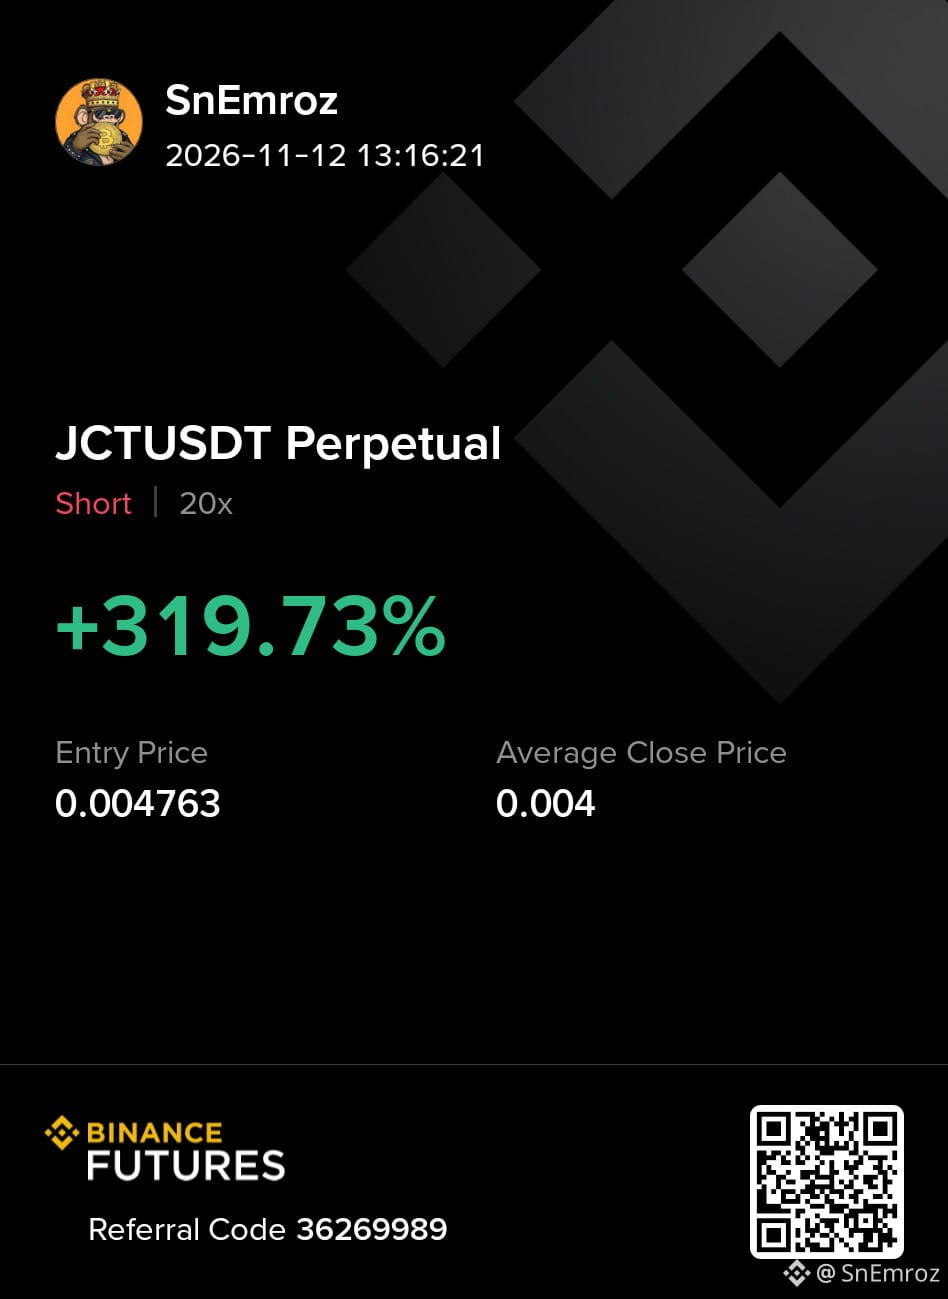
$JCT Although going lower.
$2 to 100$
Challenge Trade Complete.
Current Balance $48 ✅
{future}(JCTUSDT)
$JCT Although going lower.
$2 to 100$
Challenge Trade Complete.
Current Balance $48 ✅
$2 to 100$
Challenge Trade Complete.
Current Balance $48 ✅
SnEmroz
·
--
BearishStill not open...?
Challenge Trade ongoing $JCT
Challenge Trade ongoing $JCT
322
·
--
Bearish
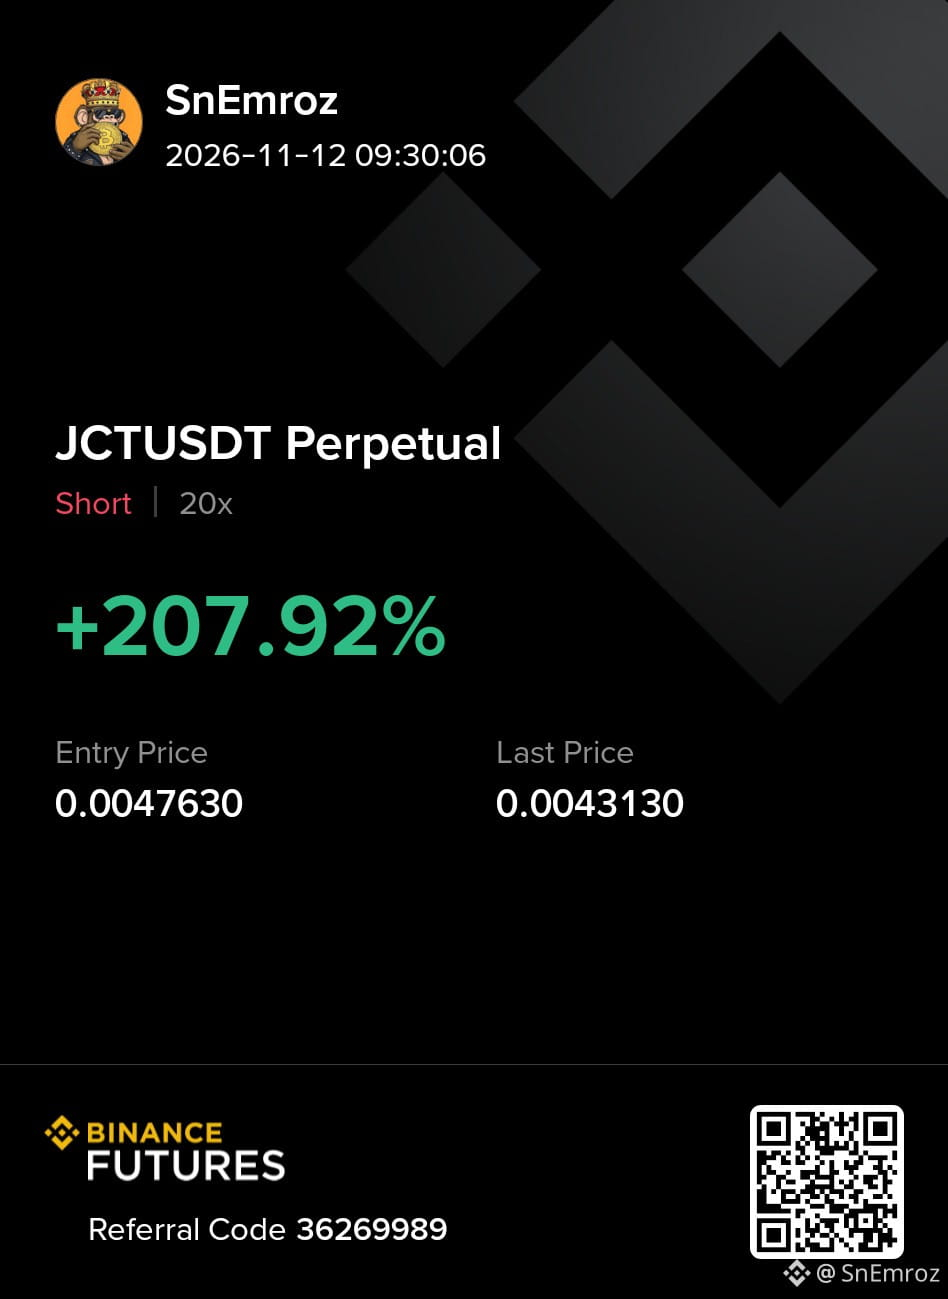
Still not open...?
Challenge Trade ongoing $JCT
Still not open...?
Challenge Trade ongoing $JCT
Challenge Trade ongoing $JCT
SnEmroz
·
--
BearishYou can add Some short 🔴
on $JCT
on $JCT
1
469
·
--
Bearish
1
274
·
--
Bearish
$NIL short just cleaned up 🔥
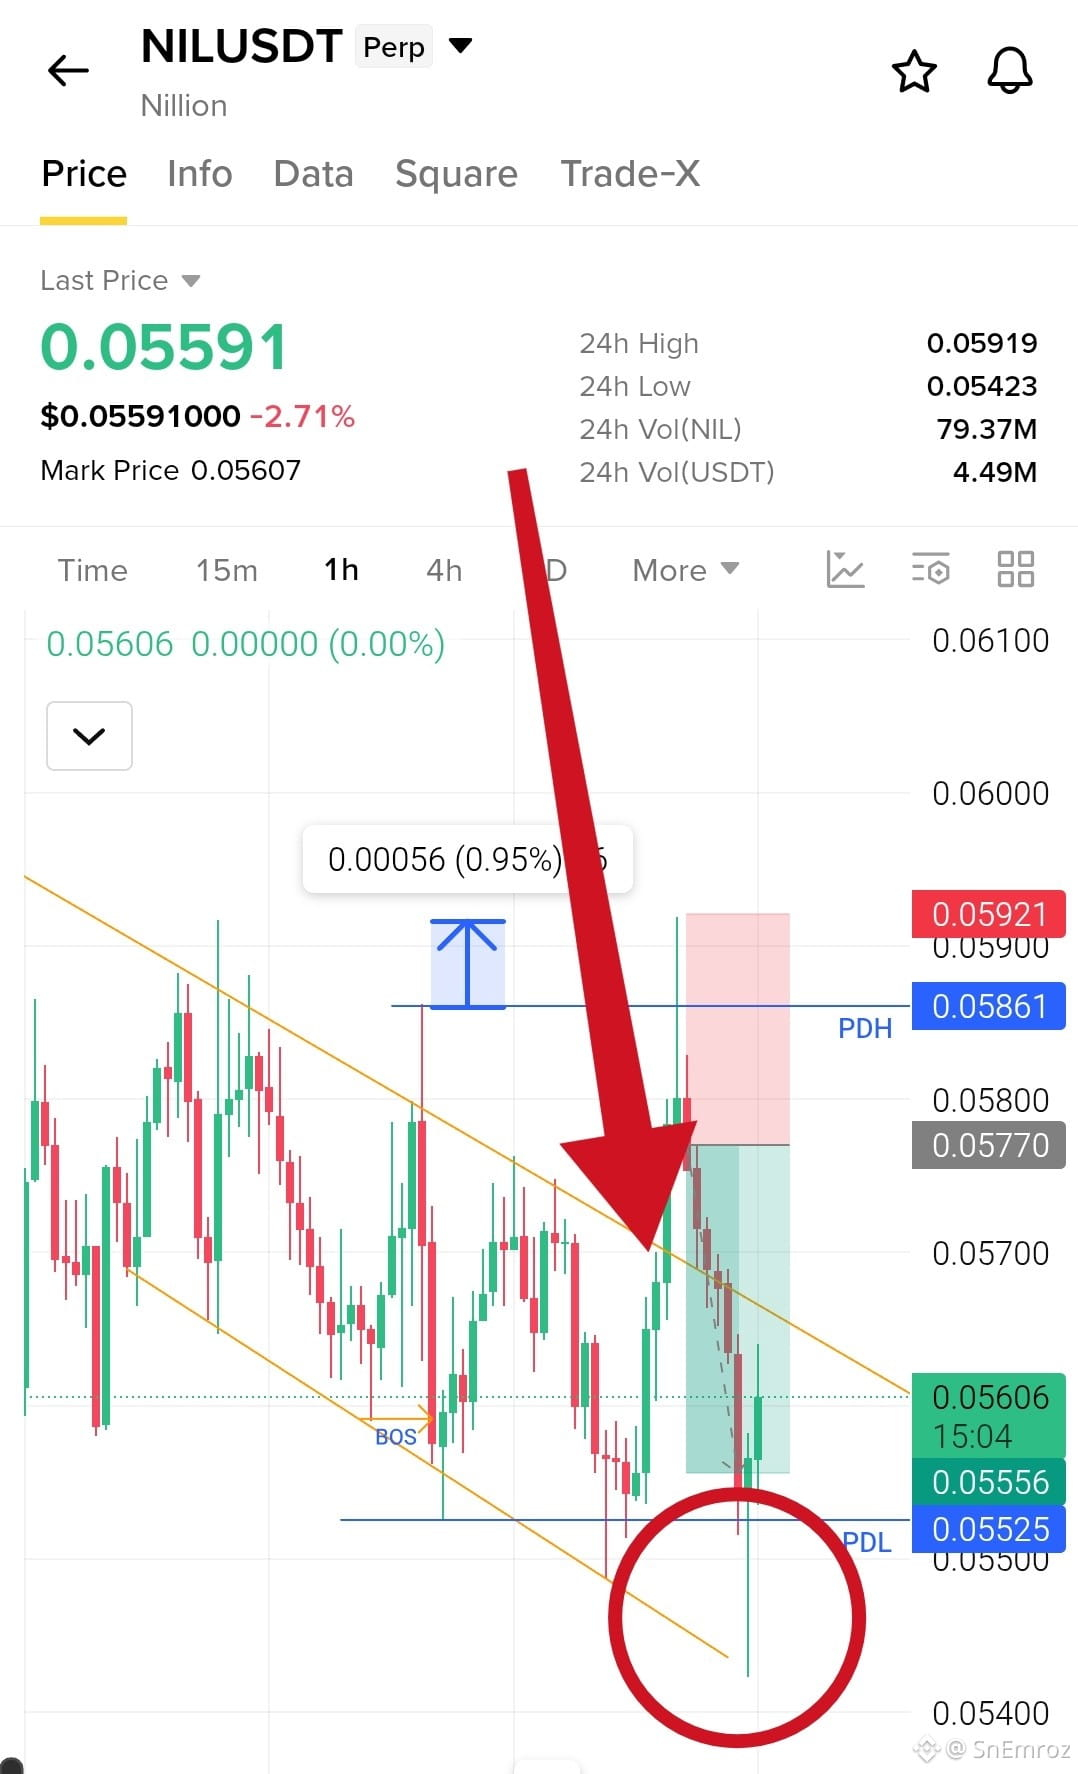
Remember the fake push above the previous day high? That was the trap. Late buyers jumped in, price snapped back under the level, and the market walked straight down to the previous day low.
Entry was $0.05771
and the final target at $0.05525 got touched. All three TPs are done, about 4.3% from entry.
The lesson is simple. When price sweeps a high and cannot hold above it, the reversal is often fast.
Thanks to everyone who took this trade with discipline. On to the next chart.
$NIL Challenge Trade Ruining... 2$ to 100$
$NIL short just cleaned up 🔥
Remember the fake push above the previous day high? That was the trap. Late buyers jumped in, price snapped back under the level, and the market walked straight down to the previous day low.
Entry was $0.05771
and the final target at $0.05525 got touched. All three TPs are done, about 4.3% from entry.
The lesson is simple. When price sweeps a high and cannot hold above it, the reversal is often fast.
Thanks to everyone who took this trade with discipline. On to the next chart.
$NIL Challenge Trade Ruining... 2$ to 100$
Remember the fake push above the previous day high? That was the trap. Late buyers jumped in, price snapped back under the level, and the market walked straight down to the previous day low.
Entry was $0.05771
and the final target at $0.05525 got touched. All three TPs are done, about 4.3% from entry.
The lesson is simple. When price sweeps a high and cannot hold above it, the reversal is often fast.
Thanks to everyone who took this trade with discipline. On to the next chart.
$NIL Challenge Trade Ruining... 2$ to 100$
SnEmroz
·
--
Bearish$NIL Short Setup 1h Chart🔴
🔶 Falling channel fakeout and rejection
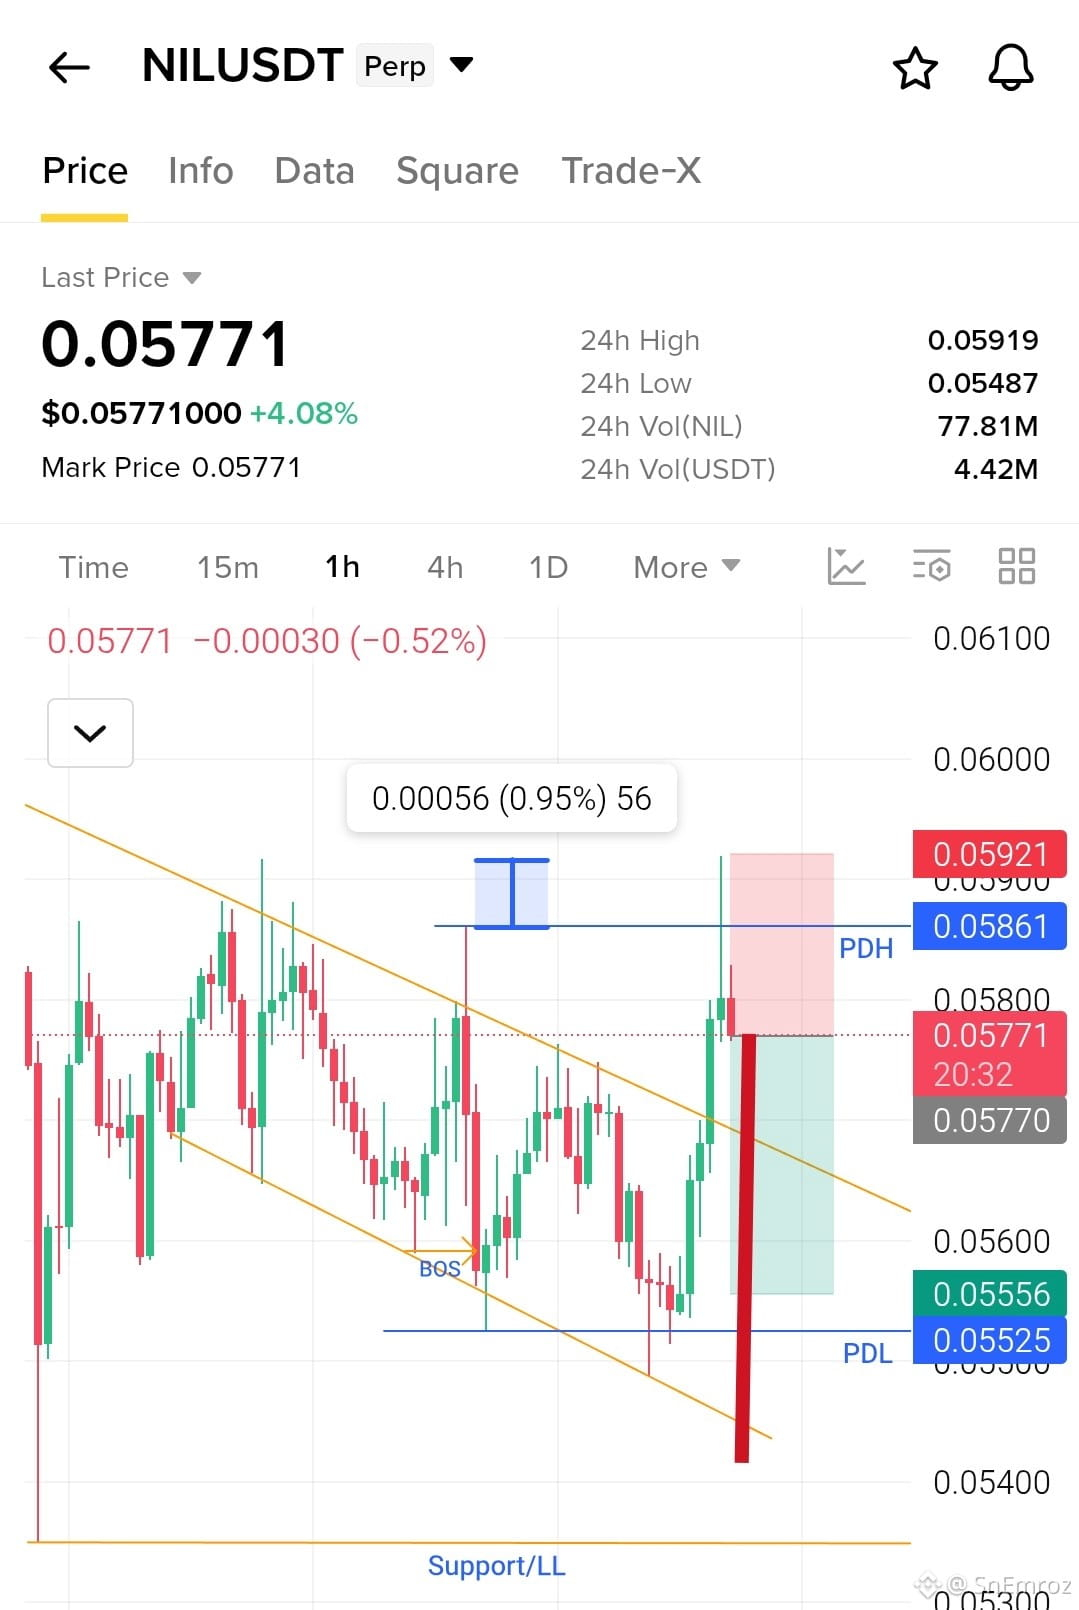
Price moved inside a falling channel with lower highs. It swept above the PDH near 0.0586 to 0.0592 and got rejected right away with a long upper wick. The next red candle pulled price back under the channel top and sellers took control. Price now sits at 0.0577 under the swept high. If it stays under the channel top a drop toward the PDL at 0.0553 is likely. A close under that level opens the way to 0.0540.
🔴Short Entry 0.05771
👇👇 Click To Open Chart 👇👇
✅ Take Profits
TP1 0.05680
TP2 0.05600
TP3 0.05525
❌ Stop Loss 0.05921
#nil
🔶 Falling channel fakeout and rejection
Price moved inside a falling channel with lower highs. It swept above the PDH near 0.0586 to 0.0592 and got rejected right away with a long upper wick. The next red candle pulled price back under the channel top and sellers took control. Price now sits at 0.0577 under the swept high. If it stays under the channel top a drop toward the PDL at 0.0553 is likely. A close under that level opens the way to 0.0540.
🔴Short Entry 0.05771
👇👇 Click To Open Chart 👇👇
✅ Take Profits
TP1 0.05680
TP2 0.05600
TP3 0.05525
❌ Stop Loss 0.05921
#nil
249
·
--
Bearish
$NIL Short Setup 1h Chart🔴
🔶 Falling channel fakeout and rejection
Price moved inside a falling channel with lower highs. It swept above the PDH near 0.0586 to 0.0592 and got rejected right away with a long upper wick. The next red candle pulled price back under the channel top and sellers took control. Price now sits at 0.0577 under the swept high. If it stays under the channel top a drop toward the PDL at 0.0553 is likely. A close under that level opens the way to 0.0540.
🔴Short Entry 0.05771
👇👇 Click To Open Chart 👇👇
{future}(NILUSDT)
✅ Take Profits
TP1 0.05680
TP2 0.05600
TP3 0.05525
❌ Stop Loss 0.05921
#nil
$NIL Short Setup 1h Chart🔴
🔶 Falling channel fakeout and rejection
Price moved inside a falling channel with lower highs. It swept above the PDH near 0.0586 to 0.0592 and got rejected right away with a long upper wick. The next red candle pulled price back under the channel top and sellers took control. Price now sits at 0.0577 under the swept high. If it stays under the channel top a drop toward the PDL at 0.0553 is likely. A close under that level opens the way to 0.0540.
🔴Short Entry 0.05771
👇👇 Click To Open Chart 👇👇
✅ Take Profits
TP1 0.05680
TP2 0.05600
TP3 0.05525
❌ Stop Loss 0.05921
#nil
🔶 Falling channel fakeout and rejection
Price moved inside a falling channel with lower highs. It swept above the PDH near 0.0586 to 0.0592 and got rejected right away with a long upper wick. The next red candle pulled price back under the channel top and sellers took control. Price now sits at 0.0577 under the swept high. If it stays under the channel top a drop toward the PDL at 0.0553 is likely. A close under that level opens the way to 0.0540.
🔴Short Entry 0.05771
👇👇 Click To Open Chart 👇👇
✅ Take Profits
TP1 0.05680
TP2 0.05600
TP3 0.05525
❌ Stop Loss 0.05921
#nil
1
2
320
Log in to explore more content
Join global crypto users on Binance Square
⚡️ Get latest and useful information about crypto.
💬 Trusted by the world’s largest crypto exchange.
👍 Discover real insights from verified creators.
Email / Phone number