
Luis Costa77
5k Posts

Luis Costa77
Report
Block User
SNR
12 Following
497 Followers
5.0K+ Liked
Posts
All
Quotes
Videos
·
--
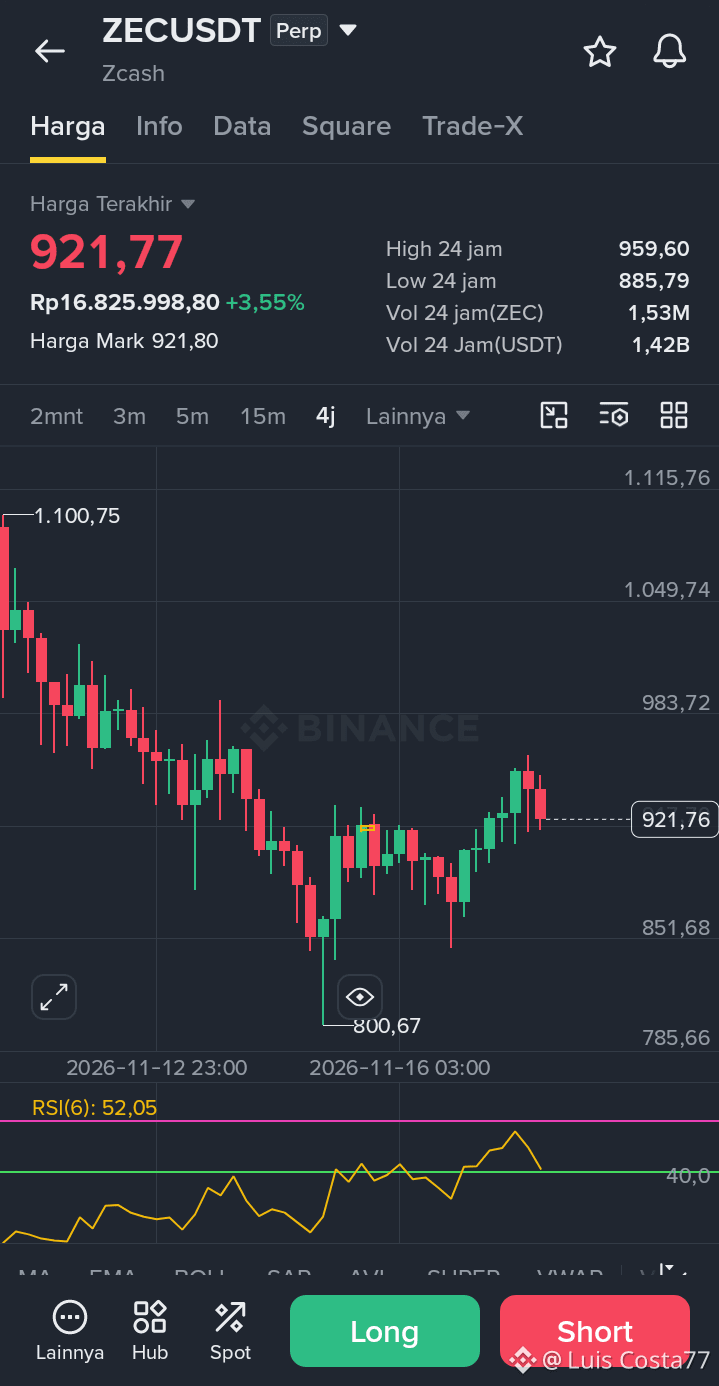
$ZEC ZECUSDT perp - 921.77, plus 3.55 percent
24-hour high 959.60, low 885.79, volume 1.42B USDT. Volume is still high, which means lots of people are still trading here.
4-hour chart: The price was at 1,100.75, then was gradually pushed down to a low of 800.67. From there, buyers started coming in and the price slowly rose to 885, then moved sideways, then surged again to 959. Now it’s correcting to 921.77.
This is a healthy rebound pattern, not a one-shot pump. It rose gradually, corrected, then rose again. But it’s too early to say the trend has reversed, because the price is still far from 1,100.
RSI is 52.05, just back above 50 after staying below it for a long time. This means buying momentum is starting to return, but it’s not overheated yet. There’s still room to rise if buyers keep pushing.
Levels:
Resistance 959.60 - 983.72
Support 885.79 - 851.68
If you want to go Long, don’t chase the price at 921. There are two better options:
1. Wait for it to break above 959.60 and for a 4-hour candle to close above that level, then enter
2. Wait for a pullback to 885.79 and a bounce, then enter
If 851.68 breaks, cancel the Long plan, because that means the rebound has failed and the price could fall back to 800 again.
{future}(ZECUSDT)
$ZEC ZECUSDT perp - 921.77, plus 3.55 percent
24-hour high 959.60, low 885.79, volume 1.42B USDT. Volume is still high, which means lots of people are still trading here.
4-hour chart: The price was at 1,100.75, then was gradually pushed down to a low of 800.67. From there, buyers started coming in and the price slowly rose to 885, then moved sideways, then surged again to 959. Now it’s correcting to 921.77.
This is a healthy rebound pattern, not a one-shot pump. It rose gradually, corrected, then rose again. But it’s too early to say the trend has reversed, because the price is still far from 1,100.
RSI is 52.05, just back above 50 after staying below it for a long time. This means buying momentum is starting to return, but it’s not overheated yet. There’s still room to rise if buyers keep pushing.
Levels:
Resistance 959.60 - 983.72
Support 885.79 - 851.68
If you want to go Long, don’t chase the price at 921. There are two better options:
1. Wait for it to break above 959.60 and for a 4-hour candle to close above that level, then enter
2. Wait for a pullback to 885.79 and a bounce, then enter
If 851.68 breaks, cancel the Long plan, because that means the rebound has failed and the price could fall back to 800 again.
24-hour high 959.60, low 885.79, volume 1.42B USDT. Volume is still high, which means lots of people are still trading here.
4-hour chart: The price was at 1,100.75, then was gradually pushed down to a low of 800.67. From there, buyers started coming in and the price slowly rose to 885, then moved sideways, then surged again to 959. Now it’s correcting to 921.77.
This is a healthy rebound pattern, not a one-shot pump. It rose gradually, corrected, then rose again. But it’s too early to say the trend has reversed, because the price is still far from 1,100.
RSI is 52.05, just back above 50 after staying below it for a long time. This means buying momentum is starting to return, but it’s not overheated yet. There’s still room to rise if buyers keep pushing.
Levels:
Resistance 959.60 - 983.72
Support 885.79 - 851.68
If you want to go Long, don’t chase the price at 921. There are two better options:
1. Wait for it to break above 959.60 and for a 4-hour candle to close above that level, then enter
2. Wait for a pullback to 885.79 and a bounce, then enter
If 851.68 breaks, cancel the Long plan, because that means the rebound has failed and the price could fall back to 800 again.
1
31
·
--
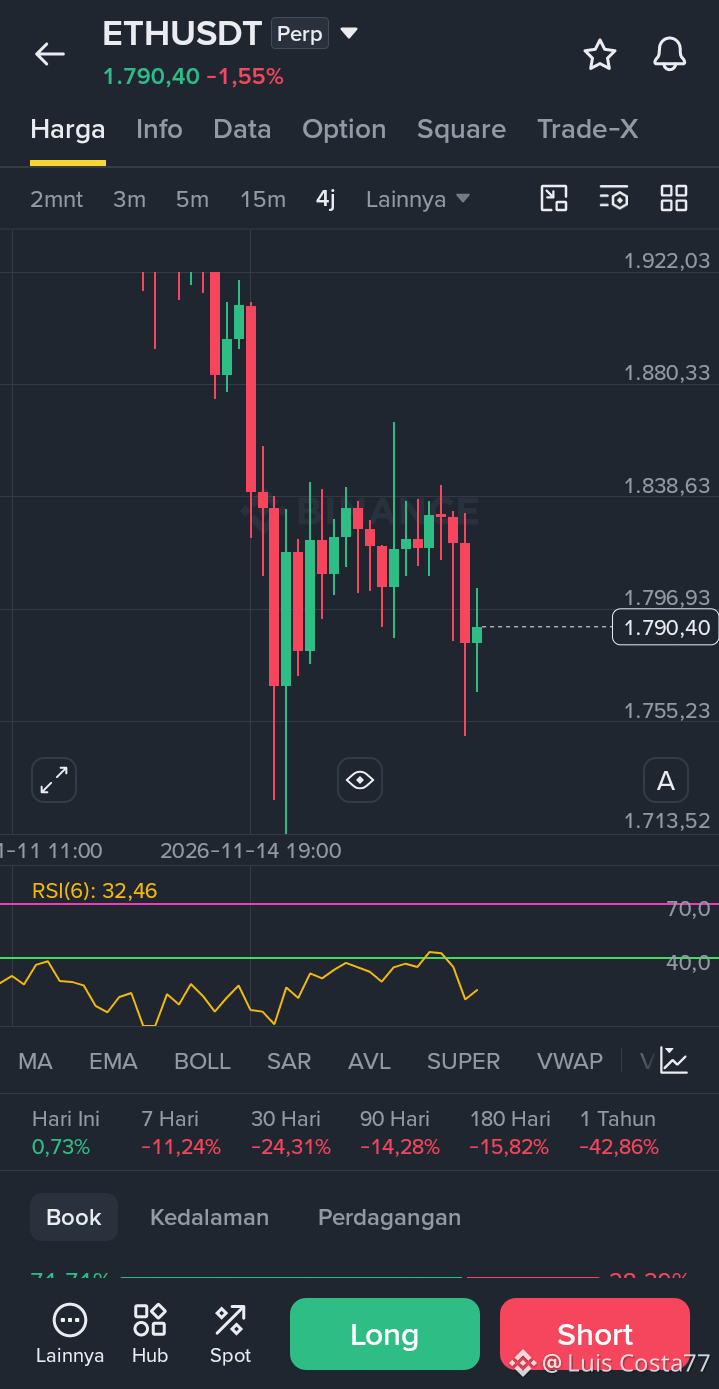
$ETH ETHUSDT perp - 1,790.40, down 1.55 percent
From 1,922, it was slammed down to around 1,755, then moved sideways at 1,790. No strong rebound yet.
RSI is 32.46, already close to oversold but hasn't turned back up yet. This means sellers are still in control, and buyers aren't confident enough to enter in size.
Performance: down 11.24 percent in 7 days, down 24.31 percent in 30 days, down 42.86 percent in 1 year. The trend is still down.
Resistance: 1,838 - 1,880. Support: 1,755 - 1,713.
Don't go Long at 1,790. Wait for a break above 1,838 and for it to hold above that level, or for 1,755 to break and bounce before joining in.
{future}(ETHUSDT)
$ETH ETHUSDT perp - 1,790.40, down 1.55 percent
From 1,922, it was slammed down to around 1,755, then moved sideways at 1,790. No strong rebound yet.
RSI is 32.46, already close to oversold but hasn't turned back up yet. This means sellers are still in control, and buyers aren't confident enough to enter in size.
Performance: down 11.24 percent in 7 days, down 24.31 percent in 30 days, down 42.86 percent in 1 year. The trend is still down.
Resistance: 1,838 - 1,880. Support: 1,755 - 1,713.
Don't go Long at 1,790. Wait for a break above 1,838 and for it to hold above that level, or for 1,755 to break and bounce before joining in.
From 1,922, it was slammed down to around 1,755, then moved sideways at 1,790. No strong rebound yet.
RSI is 32.46, already close to oversold but hasn't turned back up yet. This means sellers are still in control, and buyers aren't confident enough to enter in size.
Performance: down 11.24 percent in 7 days, down 24.31 percent in 30 days, down 42.86 percent in 1 year. The trend is still down.
Resistance: 1,838 - 1,880. Support: 1,755 - 1,713.
Don't go Long at 1,790. Wait for a break above 1,838 and for it to hold above that level, or for 1,755 to break and bounce before joining in.
1
27
·
--
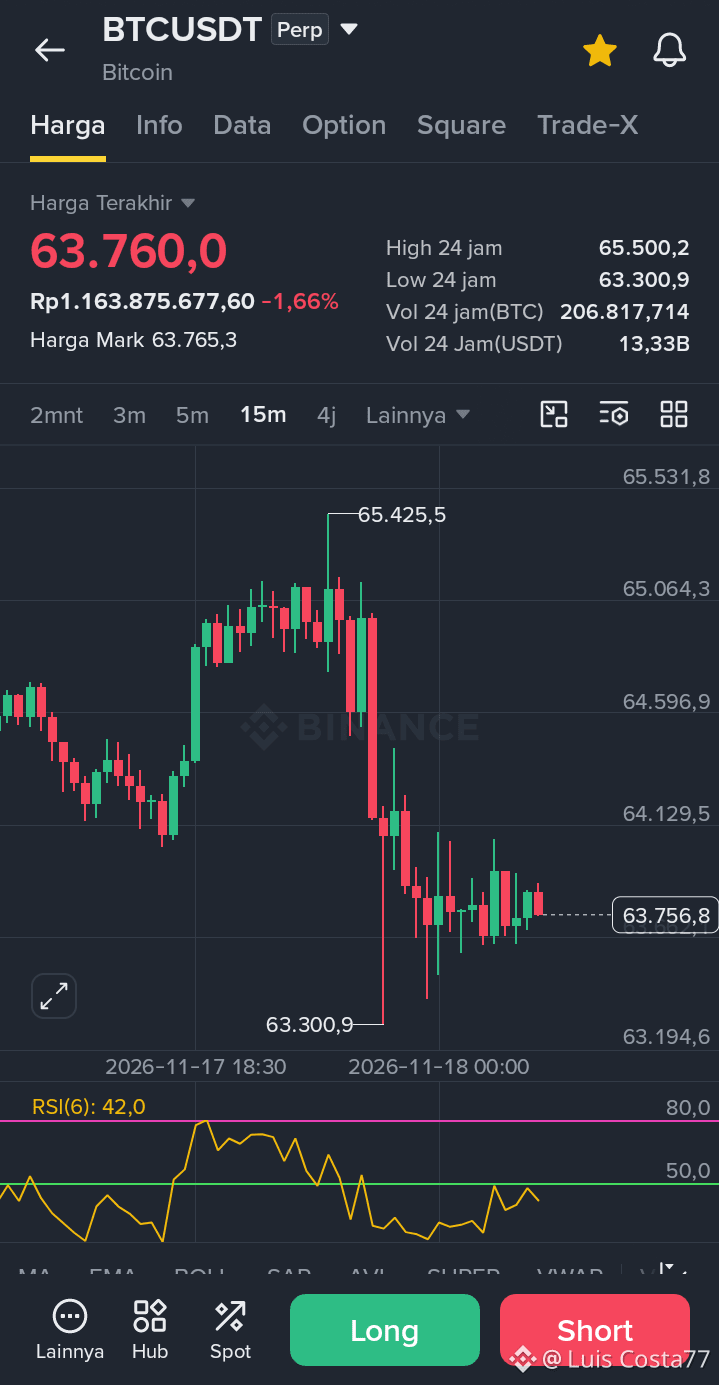
$BTC BTCUSDT perp - 63.760, down 1.66 percent
It briefly shot up to 65.425, then got slammed down to 63.300, and is now moving sideways at 63.756. The rebound is small; it hasn't moved back up yet.
RSI is 42, still below 50. That means buying strength hasn't returned, and sellers are still in control.
Resistance: 64.596 - 65.425. Support: 63.300 - 63.194.
Don't go long at 63.760. Wait for it to break above 64.596 and hold there, or for it to break below 63.300 and bounce before joining in.
{future}(BTCUSDT)
$BTC BTCUSDT perp - 63.760, down 1.66 percent
It briefly shot up to 65.425, then got slammed down to 63.300, and is now moving sideways at 63.756. The rebound is small; it hasn't moved back up yet.
RSI is 42, still below 50. That means buying strength hasn't returned, and sellers are still in control.
Resistance: 64.596 - 65.425. Support: 63.300 - 63.194.
Don't go long at 63.760. Wait for it to break above 64.596 and hold there, or for it to break below 63.300 and bounce before joining in.
It briefly shot up to 65.425, then got slammed down to 63.300, and is now moving sideways at 63.756. The rebound is small; it hasn't moved back up yet.
RSI is 42, still below 50. That means buying strength hasn't returned, and sellers are still in control.
Resistance: 64.596 - 65.425. Support: 63.300 - 63.194.
Don't go long at 63.760. Wait for it to break above 64.596 and hold there, or for it to break below 63.300 and bounce before joining in.
1
22
·
--
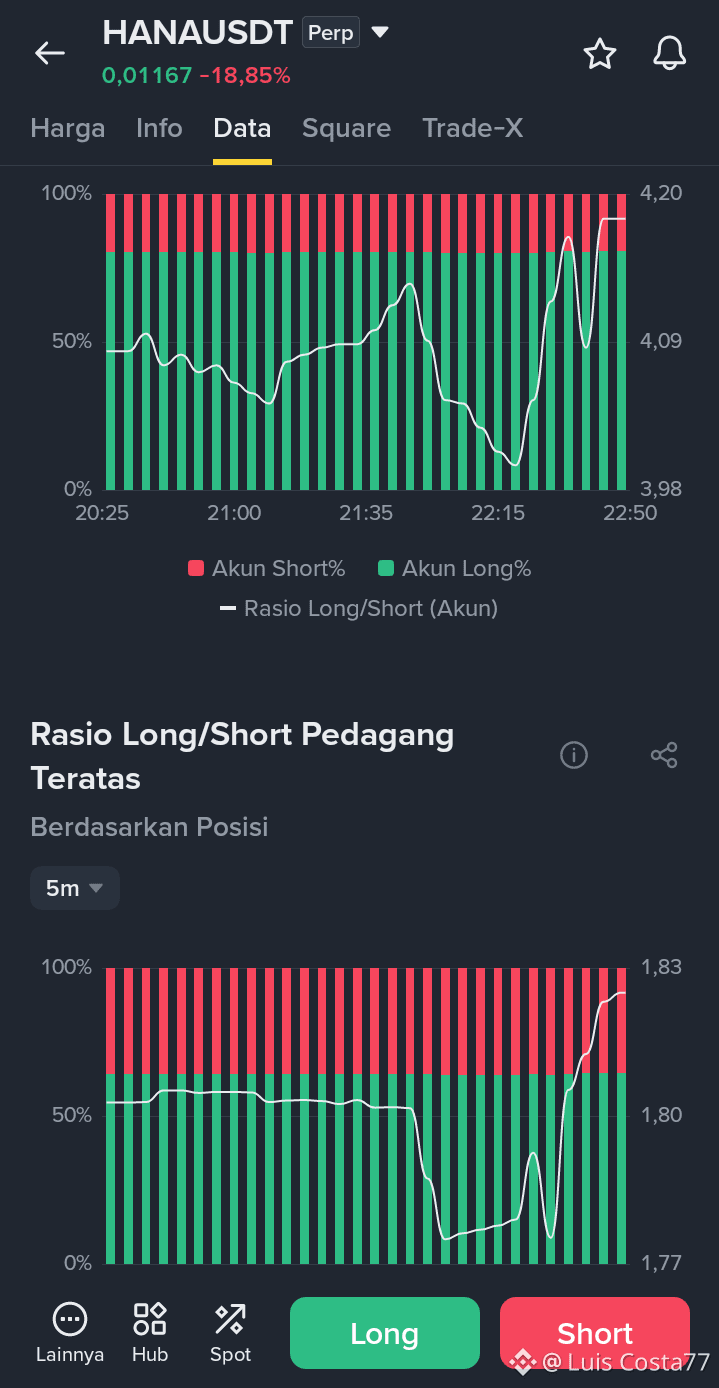
$HANA HANAUSDT perp
Top Chart - Account Ratio: Long around 80%, Short around 20%. The ratio spiked to 4.20 at the end.
This means retail traders piled heavily into Longs as the price broke down. They didn’t run; they added to their Long positions on the way down.
Bottom Chart - Top Trader Long/Short Ratio by Position: Long around 62%, Short around 38%. The ratio briefly broke down to 1.77, then spiked to 1.83.
This means big players reduced their Long positions for a while, then added to them again at the end.
They’re moving in the same direction. Both retail traders and big players are adding to Longs as the price crashes.
Don’t Short here. Longs are already crowded, so even a slight price bounce could trap those who are Short.
{future}(HANAUSDT)
$HANA HANAUSDT perp
Top Chart - Account Ratio: Long around 80%, Short around 20%. The ratio spiked to 4.20 at the end.
This means retail traders piled heavily into Longs as the price broke down. They didn’t run; they added to their Long positions on the way down.
Bottom Chart - Top Trader Long/Short Ratio by Position: Long around 62%, Short around 38%. The ratio briefly broke down to 1.77, then spiked to 1.83.
This means big players reduced their Long positions for a while, then added to them again at the end.
They’re moving in the same direction. Both retail traders and big players are adding to Longs as the price crashes.
Don’t Short here. Longs are already crowded, so even a slight price bounce could trap those who are Short.
Top Chart - Account Ratio: Long around 80%, Short around 20%. The ratio spiked to 4.20 at the end.
This means retail traders piled heavily into Longs as the price broke down. They didn’t run; they added to their Long positions on the way down.
Bottom Chart - Top Trader Long/Short Ratio by Position: Long around 62%, Short around 38%. The ratio briefly broke down to 1.77, then spiked to 1.83.
This means big players reduced their Long positions for a while, then added to them again at the end.
They’re moving in the same direction. Both retail traders and big players are adding to Longs as the price crashes.
Don’t Short here. Longs are already crowded, so even a slight price bounce could trap those who are Short.
1
21
·
--
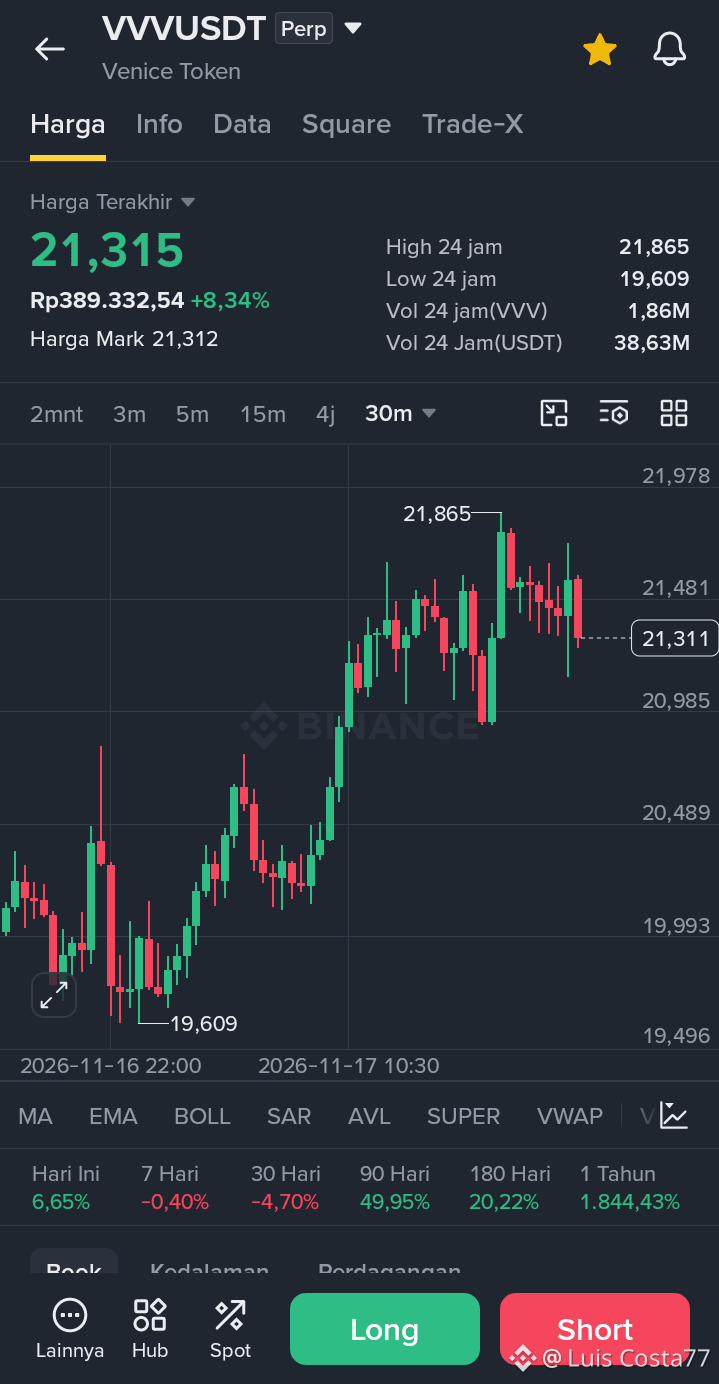
$VVV VVVUSDT perp - #VVVUSDTAnalysis
From 19,609, it shot up to 21,865, and is now correcting to 21,311. The rise is still gradual; it hasn’t broken out vertically yet.
Up 6.65% today, down 0.40% over 7 days, down 4.70% over 30 days, and up 49.95% over 90 days. That means today’s pump has only just made up for the weakness of the past month.
Resistance: 21,865. Support: 20,985 - 20,489.
Don’t chase a Long at 21,315. Wait for it to break above 21,865 and hold there, or for a correction to 20,985 and a bounce before entering.
{future}(VVVUSDT)
$VVV VVVUSDT perp - #VVVUSDTAnalysis
From 19,609, it shot up to 21,865, and is now correcting to 21,311. The rise is still gradual; it hasn’t broken out vertically yet.
Up 6.65% today, down 0.40% over 7 days, down 4.70% over 30 days, and up 49.95% over 90 days. That means today’s pump has only just made up for the weakness of the past month.
Resistance: 21,865. Support: 20,985 - 20,489.
Don’t chase a Long at 21,315. Wait for it to break above 21,865 and hold there, or for a correction to 20,985 and a bounce before entering.
From 19,609, it shot up to 21,865, and is now correcting to 21,311. The rise is still gradual; it hasn’t broken out vertically yet.
Up 6.65% today, down 0.40% over 7 days, down 4.70% over 30 days, and up 49.95% over 90 days. That means today’s pump has only just made up for the weakness of the past month.
Resistance: 21,865. Support: 20,985 - 20,489.
Don’t chase a Long at 21,315. Wait for it to break above 21,865 and hold there, or for a correction to 20,985 and a bounce before entering.
1
18
·
--
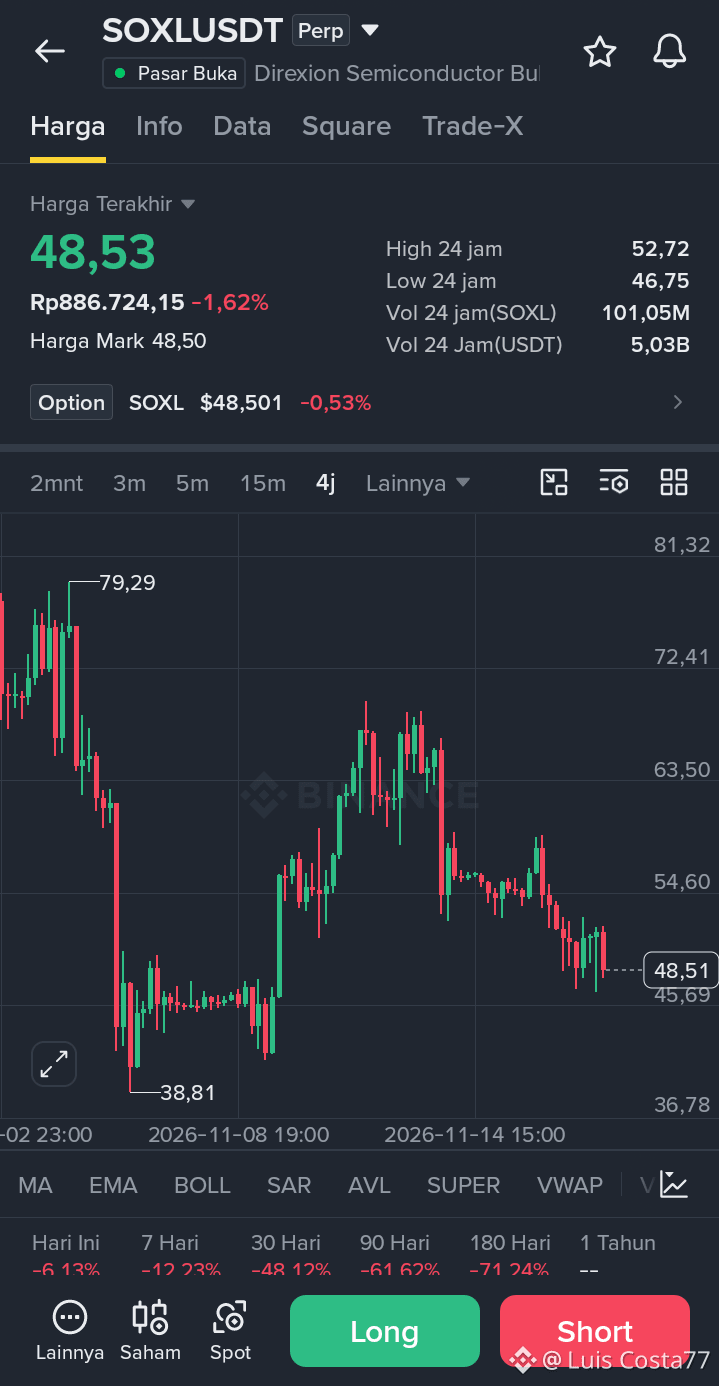
$SOXL SOXLUSDT perp - 48.53, down 1.62%
From 79.29, it broke down to 38.81; the rebound to 67 failed, and it fell back to 48.51. Down 48.12% over 30 days and 71.24% over 180 days.
Resistance 52.72. Support 46.75. Don’t go Long in the middle; wait for a break above 52.72 or a bounce at 46.75.
{future}(SOXLUSDT)
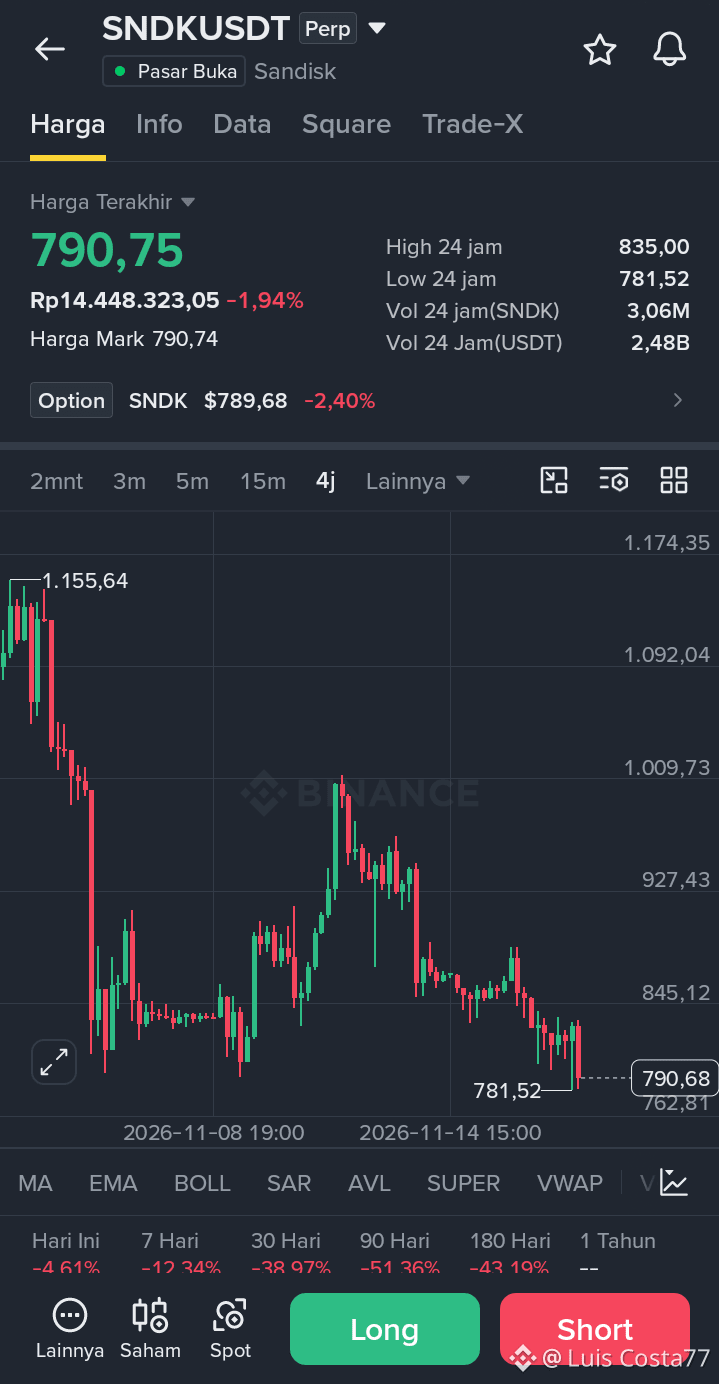
$SNDK SNDKUSDT perp - 790.75, down 1.94%
From 1,155, it broke down to 780; the rebound to 1,009 failed, and it fell back to 790. Down 38.97% over 30 days and 51.36% over 90 days.
Resistance 835. Support 781.52. It’s sitting right on support; if that breaks, it could keep falling.
{future}(SNDKUSDT)
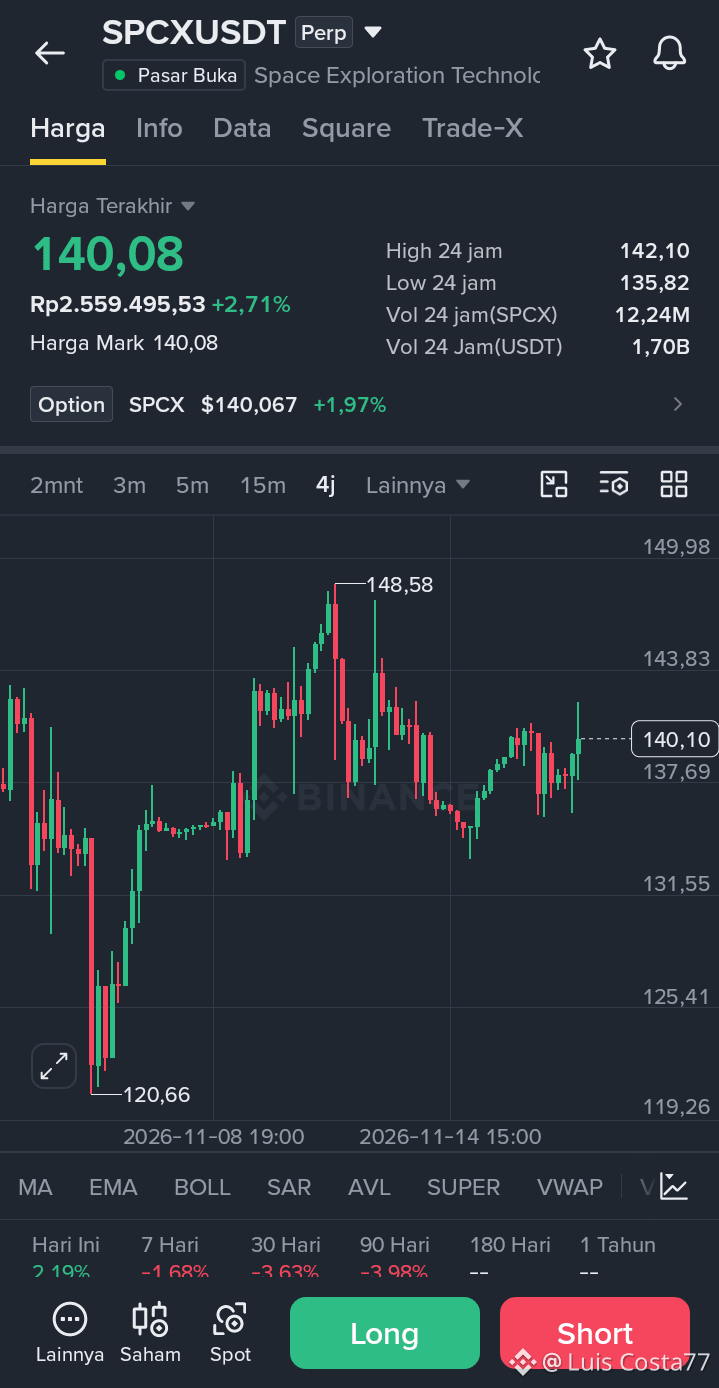
$SPCX SPCXUSDT perp - 140.08, up 2.71%
From 120.66, it rose to 148.58, corrected to 133, then climbed back to 140. Up 2.19% today, the strongest of the three.
Resistance 142.10. Support 137.69. Don’t chase near resistance; wait for a break above 142.10 or a correction to 137.69.
{future}(SPCXUSDT)
$SOXL SOXLUSDT perp - 48.53, down 1.62%
From 79.29, it broke down to 38.81; the rebound to 67 failed, and it fell back to 48.51. Down 48.12% over 30 days and 71.24% over 180 days.
Resistance 52.72. Support 46.75. Don’t go Long in the middle; wait for a break above 52.72 or a bounce at 46.75.
$SNDK SNDKUSDT perp - 790.75, down 1.94%
From 1,155, it broke down to 780; the rebound to 1,009 failed, and it fell back to 790. Down 38.97% over 30 days and 51.36% over 90 days.
Resistance 835. Support 781.52. It’s sitting right on support; if that breaks, it could keep falling.
$SPCX SPCXUSDT perp - 140.08, up 2.71%
From 120.66, it rose to 148.58, corrected to 133, then climbed back to 140. Up 2.19% today, the strongest of the three.
Resistance 142.10. Support 137.69. Don’t chase near resistance; wait for a break above 142.10 or a correction to 137.69.
From 79.29, it broke down to 38.81; the rebound to 67 failed, and it fell back to 48.51. Down 48.12% over 30 days and 71.24% over 180 days.
Resistance 52.72. Support 46.75. Don’t go Long in the middle; wait for a break above 52.72 or a bounce at 46.75.
$SNDK SNDKUSDT perp - 790.75, down 1.94%
From 1,155, it broke down to 780; the rebound to 1,009 failed, and it fell back to 790. Down 38.97% over 30 days and 51.36% over 90 days.
Resistance 835. Support 781.52. It’s sitting right on support; if that breaks, it could keep falling.
$SPCX SPCXUSDT perp - 140.08, up 2.71%
From 120.66, it rose to 148.58, corrected to 133, then climbed back to 140. Up 2.19% today, the strongest of the three.
Resistance 142.10. Support 137.69. Don’t chase near resistance; wait for a break above 142.10 or a correction to 137.69.
1
31
·
--
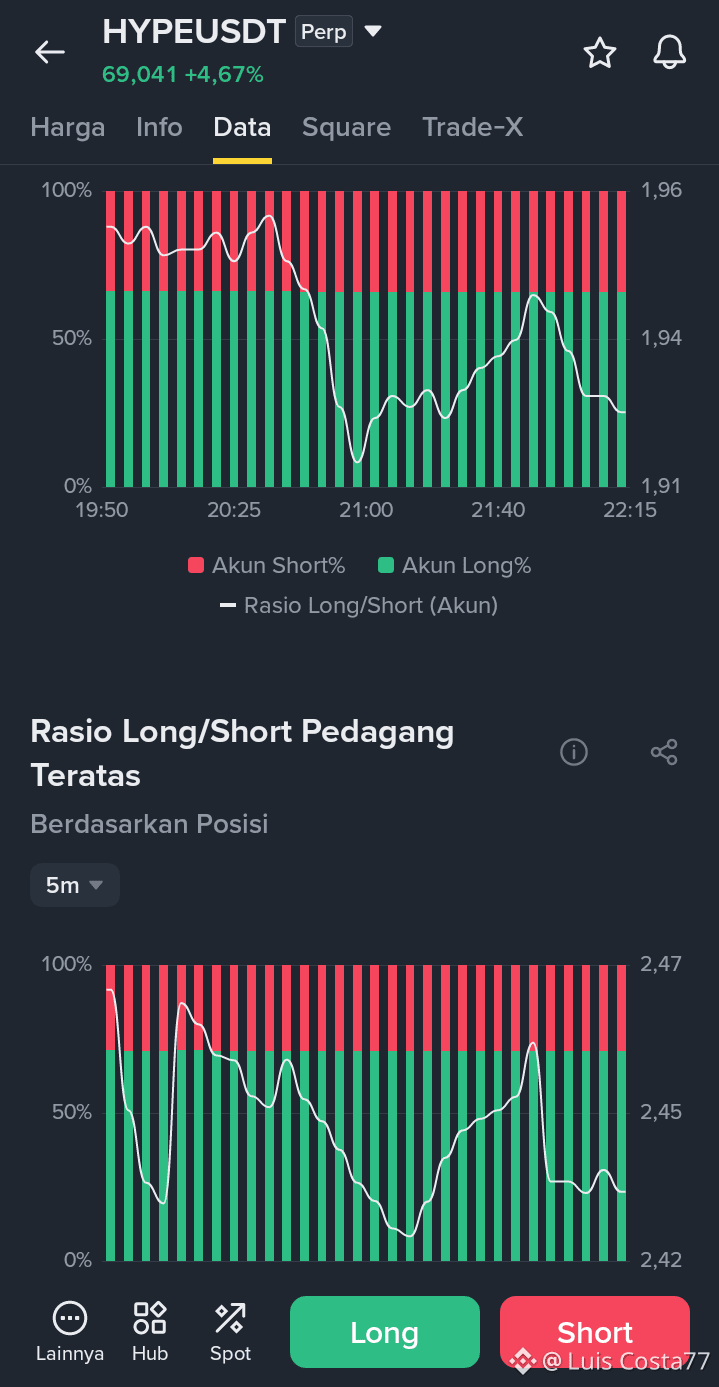
$HYPE HYPEUSDT - Price Is Up, but Longs Are Already Being Reduced #Hyperliquid
Current price: 69,041, up 4,67 percent.
Top Chart - Account Ratio: Long around 65 percent, Short around 35 percent. The ratio rose to 1,96, then plunged to 1,91 around 21.00, climbed back to 1,947, and then fell again to 1,925 by the end.
$HYPE This means retail traders are still predominantly Long, but they're starting to waver. After the sharp drop, they briefly came back, but by the end they were reducing their Long positions again. This isn't retail buying with conviction; they're starting to have doubts at these levels. #Hyperliquid
Bottom Chart - Top Trader Ratio by Position: Long around 71 percent, Short around 29 percent. The ratio plunged from 2,47 to 2,42, then slowly climbed to 2,46, before falling again to 2,43.
#HYPE This means the big players are also still Long, but they're reducing their positions too. The pattern is similar to retail: a slight uptick, then selling again. This isn't accumulation; they're maintaining their positions while reducing risk.
The signals are aligned. Retail and big players are both still Long, but both are starting to reduce their positions.
Levels $HYPE
Top Ratio Resistance: 1,96
Bottom Ratio Support: 2,42
Don't go Long at 69,041 just because the price is green. The Long ratios on both charts have already fallen from their peaks and haven't convincingly turned back up. If the price fails to hold, Long positions will exit together, and the drop could be sharp.
{future}(HYPEUSDT)
$HYPE HYPEUSDT - Price Is Up, but Longs Are Already Being Reduced #Hyperliquid
Current price: 69,041, up 4,67 percent.
Top Chart - Account Ratio: Long around 65 percent, Short around 35 percent. The ratio rose to 1,96, then plunged to 1,91 around 21.00, climbed back to 1,947, and then fell again to 1,925 by the end.
$HYPE This means retail traders are still predominantly Long, but they're starting to waver. After the sharp drop, they briefly came back, but by the end they were reducing their Long positions again. This isn't retail buying with conviction; they're starting to have doubts at these levels. #Hyperliquid
Bottom Chart - Top Trader Ratio by Position: Long around 71 percent, Short around 29 percent. The ratio plunged from 2,47 to 2,42, then slowly climbed to 2,46, before falling again to 2,43.
#HYPE This means the big players are also still Long, but they're reducing their positions too. The pattern is similar to retail: a slight uptick, then selling again. This isn't accumulation; they're maintaining their positions while reducing risk.
The signals are aligned. Retail and big players are both still Long, but both are starting to reduce their positions.
Levels $HYPE
Top Ratio Resistance: 1,96
Bottom Ratio Support: 2,42
Don't go Long at 69,041 just because the price is green. The Long ratios on both charts have already fallen from their peaks and haven't convincingly turned back up. If the price fails to hold, Long positions will exit together, and the drop could be sharp.
Current price: 69,041, up 4,67 percent.
Top Chart - Account Ratio: Long around 65 percent, Short around 35 percent. The ratio rose to 1,96, then plunged to 1,91 around 21.00, climbed back to 1,947, and then fell again to 1,925 by the end.
$HYPE This means retail traders are still predominantly Long, but they're starting to waver. After the sharp drop, they briefly came back, but by the end they were reducing their Long positions again. This isn't retail buying with conviction; they're starting to have doubts at these levels. #Hyperliquid
Bottom Chart - Top Trader Ratio by Position: Long around 71 percent, Short around 29 percent. The ratio plunged from 2,47 to 2,42, then slowly climbed to 2,46, before falling again to 2,43.
#HYPE This means the big players are also still Long, but they're reducing their positions too. The pattern is similar to retail: a slight uptick, then selling again. This isn't accumulation; they're maintaining their positions while reducing risk.
The signals are aligned. Retail and big players are both still Long, but both are starting to reduce their positions.
Levels $HYPE
Top Ratio Resistance: 1,96
Bottom Ratio Support: 2,42
Don't go Long at 69,041 just because the price is green. The Long ratios on both charts have already fallen from their peaks and haven't convincingly turned back up. If the price fails to hold, Long positions will exit together, and the drop could be sharp.
1
14
·
--
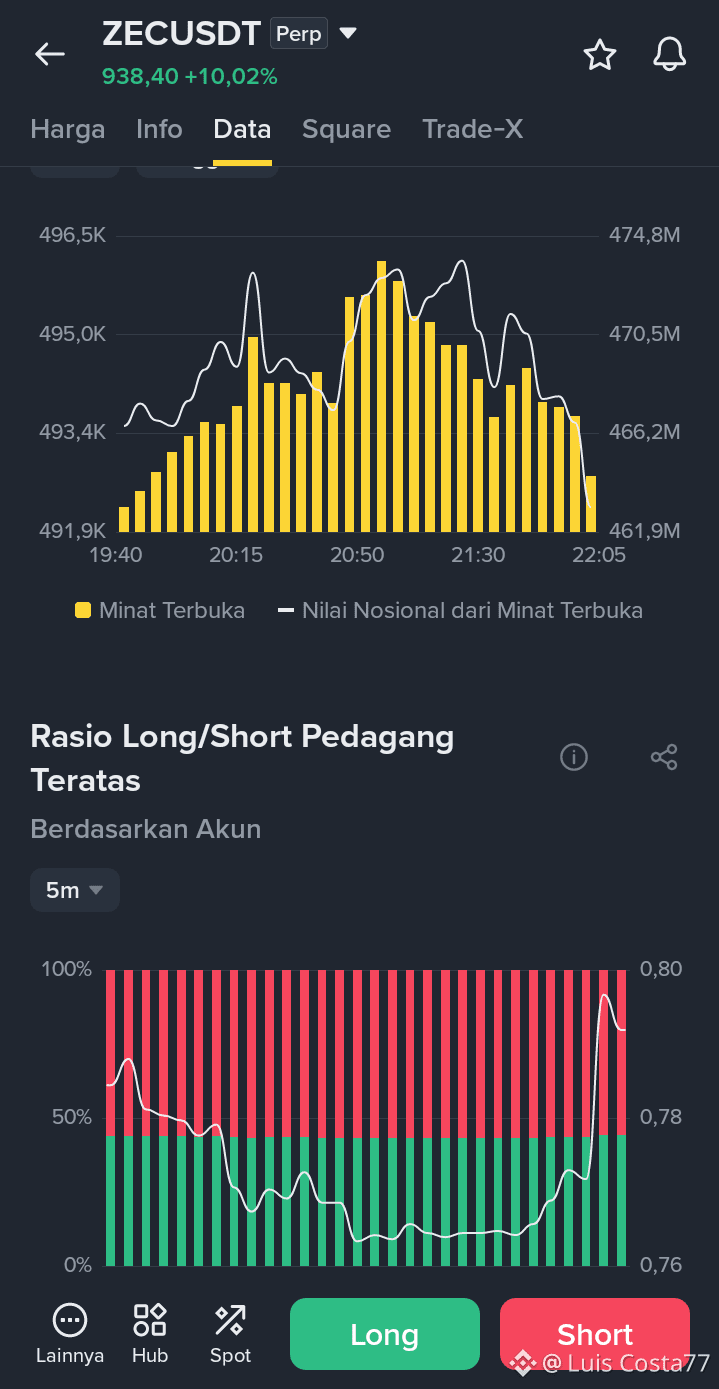
$ZEC ZECUSDT perpetual - Price Rises 10 Percent, but Open Interest Is Fleeing
#ZEC.智能策略库🏆🏆
The current price is 938.40, up 10.02 percent.
Top Chart - Open Interest: Open interest briefly rose sharply from 491.9K to a peak of around 496.5K at about 21:00, then kept falling to around 492K by the end. Notional value followed suit, rising from 461.9M to 474.8M, then dropping back to around 463M.
This means the price rise isn't backed by new money that is sticking around. Money came in briefly, then immediately flowed back out. This is a rise driven by position closures, not by new positions being opened. #ZECUSDT
Bottom Chart - Top Trader Long/Short Ratio by Accounts: Long is around 42 percent, Short around 58 percent. The ratio kept falling from 0.79 to 0.765, then shot vertically up at the end to 0.795, before dipping slightly to 0.79.
This means whales are still leaning Short, even though the price is up 10 percent. They briefly became even more Short, then only reduced their Short positions slightly at the end. These aren't whales going Long; they're whales still holding onto their Short positions.
These signals don't align. The price is rising, open interest is falling, and whales are still Short.
Level $ZEC
Open Interest Resistance: 496.5K
Ratio Support: 0.765
Don't go Long $ZEC at 938.40 just because the price is up 10 percent. Open interest has already fallen from its peak, and whales are still predominantly Short. If the price fails to hold, the drop could be swift because there's nothing supporting it from below.
{future}(ZECUSDT)
$ZEC ZECUSDT perpetual - Price Rises 10 Percent, but Open Interest Is Fleeing
#ZEC.智能策略库🏆🏆
The current price is 938.40, up 10.02 percent.
Top Chart - Open Interest: Open interest briefly rose sharply from 491.9K to a peak of around 496.5K at about 21:00, then kept falling to around 492K by the end. Notional value followed suit, rising from 461.9M to 474.8M, then dropping back to around 463M.
This means the price rise isn't backed by new money that is sticking around. Money came in briefly, then immediately flowed back out. This is a rise driven by position closures, not by new positions being opened. #ZECUSDT
Bottom Chart - Top Trader Long/Short Ratio by Accounts: Long is around 42 percent, Short around 58 percent. The ratio kept falling from 0.79 to 0.765, then shot vertically up at the end to 0.795, before dipping slightly to 0.79.
This means whales are still leaning Short, even though the price is up 10 percent. They briefly became even more Short, then only reduced their Short positions slightly at the end. These aren't whales going Long; they're whales still holding onto their Short positions.
These signals don't align. The price is rising, open interest is falling, and whales are still Short.
Level $ZEC
Open Interest Resistance: 496.5K
Ratio Support: 0.765
Don't go Long $ZEC at 938.40 just because the price is up 10 percent. Open interest has already fallen from its peak, and whales are still predominantly Short. If the price fails to hold, the drop could be swift because there's nothing supporting it from below.
#ZEC.智能策略库🏆🏆
The current price is 938.40, up 10.02 percent.
Top Chart - Open Interest: Open interest briefly rose sharply from 491.9K to a peak of around 496.5K at about 21:00, then kept falling to around 492K by the end. Notional value followed suit, rising from 461.9M to 474.8M, then dropping back to around 463M.
This means the price rise isn't backed by new money that is sticking around. Money came in briefly, then immediately flowed back out. This is a rise driven by position closures, not by new positions being opened. #ZECUSDT
Bottom Chart - Top Trader Long/Short Ratio by Accounts: Long is around 42 percent, Short around 58 percent. The ratio kept falling from 0.79 to 0.765, then shot vertically up at the end to 0.795, before dipping slightly to 0.79.
This means whales are still leaning Short, even though the price is up 10 percent. They briefly became even more Short, then only reduced their Short positions slightly at the end. These aren't whales going Long; they're whales still holding onto their Short positions.
These signals don't align. The price is rising, open interest is falling, and whales are still Short.
Level $ZEC
Open Interest Resistance: 496.5K
Ratio Support: 0.765
Don't go Long $ZEC at 938.40 just because the price is up 10 percent. Open interest has already fallen from its peak, and whales are still predominantly Short. If the price fails to hold, the drop could be swift because there's nothing supporting it from below.
1
27
·
--
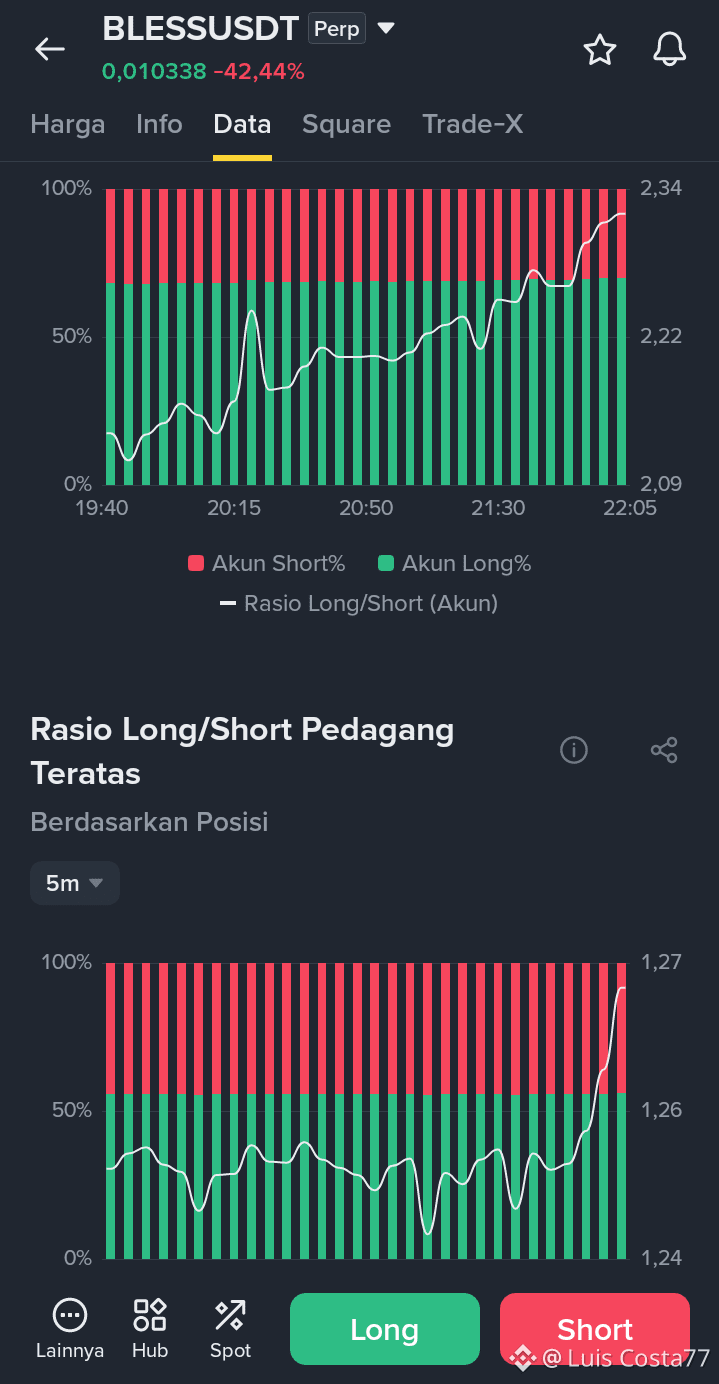
$BLESS BLESSUSDT perp - Price Crashes 42 Percent, But Everyone Keeps Adding Longs
Current price: 0.010338, down 42.44 percent.
Top Chart - Account Ratio: Long at around 68 percent, Short at around 32 percent. The ratio kept rising from 2.09 to 2.34, with almost no pullback.
This means retail traders are actually becoming more confident in going Long as the price gets hammered. They aren't running away; they're adding Long positions lower down. They might be buying the dip, or they might be trapped and holding unrealized losses.
Bottom Chart - Top Trader Position Ratio: Long at around 55 percent, Short at around 45 percent. The ratio fluctuated around 1.24 to 1.26, then shot vertically up to 1.27 at the end.
This means the whales also just added Long positions at the end of the session. After holding back for a long time, they only dared to add when the price had already plunged deep.
They're moving in the same direction. Retail traders and whales are both adding Long positions as the price crashes.
Levels:
Top Ratio Support: 2.22
Bottom Ratio Support: 1.24
Don't jump into a Short at 0.010338 just because the price is down 42 percent. Long positions have already piled up on both charts; if the price bounces even slightly, Shorts will get trapped and squeezed upward.
{future}(BLESSUSDT)
$BLESS BLESSUSDT perp - Price Crashes 42 Percent, But Everyone Keeps Adding Longs
Current price: 0.010338, down 42.44 percent.
Top Chart - Account Ratio: Long at around 68 percent, Short at around 32 percent. The ratio kept rising from 2.09 to 2.34, with almost no pullback.
This means retail traders are actually becoming more confident in going Long as the price gets hammered. They aren't running away; they're adding Long positions lower down. They might be buying the dip, or they might be trapped and holding unrealized losses.
Bottom Chart - Top Trader Position Ratio: Long at around 55 percent, Short at around 45 percent. The ratio fluctuated around 1.24 to 1.26, then shot vertically up to 1.27 at the end.
This means the whales also just added Long positions at the end of the session. After holding back for a long time, they only dared to add when the price had already plunged deep.
They're moving in the same direction. Retail traders and whales are both adding Long positions as the price crashes.
Levels:
Top Ratio Support: 2.22
Bottom Ratio Support: 1.24
Don't jump into a Short at 0.010338 just because the price is down 42 percent. Long positions have already piled up on both charts; if the price bounces even slightly, Shorts will get trapped and squeezed upward.
Current price: 0.010338, down 42.44 percent.
Top Chart - Account Ratio: Long at around 68 percent, Short at around 32 percent. The ratio kept rising from 2.09 to 2.34, with almost no pullback.
This means retail traders are actually becoming more confident in going Long as the price gets hammered. They aren't running away; they're adding Long positions lower down. They might be buying the dip, or they might be trapped and holding unrealized losses.
Bottom Chart - Top Trader Position Ratio: Long at around 55 percent, Short at around 45 percent. The ratio fluctuated around 1.24 to 1.26, then shot vertically up to 1.27 at the end.
This means the whales also just added Long positions at the end of the session. After holding back for a long time, they only dared to add when the price had already plunged deep.
They're moving in the same direction. Retail traders and whales are both adding Long positions as the price crashes.
Levels:
Top Ratio Support: 2.22
Bottom Ratio Support: 1.24
Don't jump into a Short at 0.010338 just because the price is down 42 percent. Long positions have already piled up on both charts; if the price bounces even slightly, Shorts will get trapped and squeezed upward.
1
17
·
--
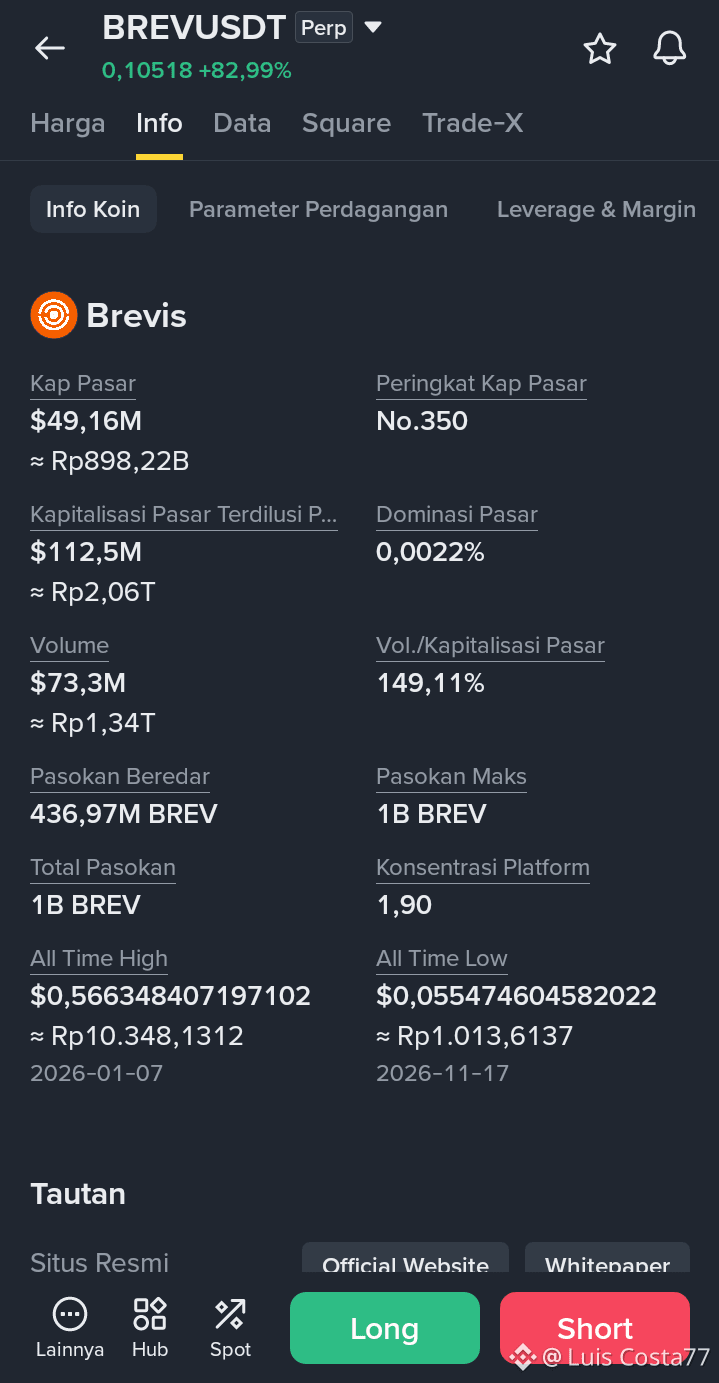
$BREV BREVUSDT perp - Just Hit a New ATL Today, Then Pumped 82 Percent #brevpump
Current price is 0.10518, up 82.99 percent.
Market cap: $BREV 49.16M USD, ranked No. 350. Fully diluted valuation is 112.5M USD. Circulating supply is 436.97M BREV out of a total 1B BREV. That means more than 56 percent of the supply is still not circulating. This is a ticking time bomb if that supply hits the market while the price is high.
Volume is 73.3M USD, with a Volume / Market Cap ratio of 149.11 percent. Daily volume is already 1.5 times the entire market cap. This isn't a healthy rise; it's being heavily manipulated.#BREVUSDT永续
All-Time High: 0.5663 USD on 2026-01-07. All-Time Low: 0.05547 USD on 2026-11-17, aka today. That means BREV just set a new ATL this morning, then immediately got pumped to nearly double its price in a day. This is a capitulation-then-reversal pattern, which is highly prone to false breakouts.
Levels $BREV
Resistance 0.12 - 0.15
Support 0.08465 - 0.07402
Don't chase a long at 0.10518 just because it's up 82 percent. The price just bounced from its ATL, and a Volume / Market Cap ratio of 149 percent is severely overheated. Wait for a pullback to 0.08465 and a bounce before joining in.
{future}(BREVUSDT)
$BREV BREVUSDT perp - Just Hit a New ATL Today, Then Pumped 82 Percent #brevpump
Current price is 0.10518, up 82.99 percent.
Market cap: $BREV 49.16M USD, ranked No. 350. Fully diluted valuation is 112.5M USD. Circulating supply is 436.97M BREV out of a total 1B BREV. That means more than 56 percent of the supply is still not circulating. This is a ticking time bomb if that supply hits the market while the price is high.
Volume is 73.3M USD, with a Volume / Market Cap ratio of 149.11 percent. Daily volume is already 1.5 times the entire market cap. This isn't a healthy rise; it's being heavily manipulated.#BREVUSDT永续
All-Time High: 0.5663 USD on 2026-01-07. All-Time Low: 0.05547 USD on 2026-11-17, aka today. That means BREV just set a new ATL this morning, then immediately got pumped to nearly double its price in a day. This is a capitulation-then-reversal pattern, which is highly prone to false breakouts.
Levels $BREV
Resistance 0.12 - 0.15
Support 0.08465 - 0.07402
Don't chase a long at 0.10518 just because it's up 82 percent. The price just bounced from its ATL, and a Volume / Market Cap ratio of 149 percent is severely overheated. Wait for a pullback to 0.08465 and a bounce before joining in.
Current price is 0.10518, up 82.99 percent.
Market cap: $BREV 49.16M USD, ranked No. 350. Fully diluted valuation is 112.5M USD. Circulating supply is 436.97M BREV out of a total 1B BREV. That means more than 56 percent of the supply is still not circulating. This is a ticking time bomb if that supply hits the market while the price is high.
Volume is 73.3M USD, with a Volume / Market Cap ratio of 149.11 percent. Daily volume is already 1.5 times the entire market cap. This isn't a healthy rise; it's being heavily manipulated.#BREVUSDT永续
All-Time High: 0.5663 USD on 2026-01-07. All-Time Low: 0.05547 USD on 2026-11-17, aka today. That means BREV just set a new ATL this morning, then immediately got pumped to nearly double its price in a day. This is a capitulation-then-reversal pattern, which is highly prone to false breakouts.
Levels $BREV
Resistance 0.12 - 0.15
Support 0.08465 - 0.07402
Don't chase a long at 0.10518 just because it's up 82 percent. The price just bounced from its ATL, and a Volume / Market Cap ratio of 149 percent is severely overheated. Wait for a pullback to 0.08465 and a bounce before joining in.
1
40
·
--
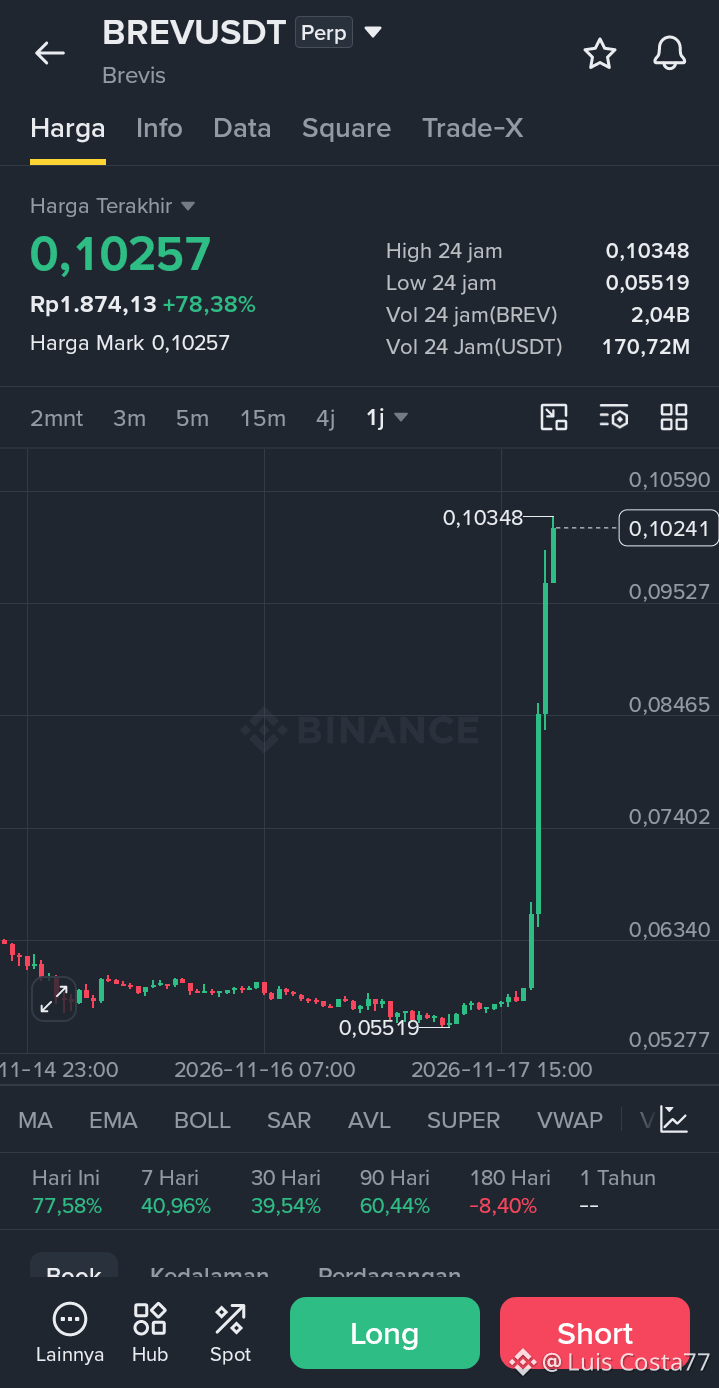
$BREV BREVUSDT - Up 78 Percent in a Vertical Pump, Now Stuck Near the Top #BREVUSDT永续
The current price is 0.10257, up 78.38 percent. High: 0.10348, low: 0.05519.
1-hour chart: $BREV The price had been flat for a long time around 0.05519, then shot straight up to 0.10348 without a pullback. It’s now at 0.10241, still very close to the top. This means there hasn’t been any sell-off in this pump yet; buyers are still holding the price up.
Today’s gain is 77.58 percent, 7-day gain 40.96 percent, 30-day gain 39.54 percent, 90-day gain 60.44 percent, and 180-day change minus 8.40 percent. That means today’s pump alone turned every timeframe green. Before today, this coin was still weak, and the 180-day change was still negative.
Volume: 2.04B BREV, 170.72M USDT. This means the pump is very active, with a large amount of money suddenly flowing in. It’s not a quiet pump.
Levels $BREV
Resistance: 0.10348
Support: 0.08465 - 0.07402
Don’t chase a Long at 0.10257. The price has nearly doubled from the low in a single move and hasn’t pulled back yet. Wait for a pullback to 0.08465 and a bounce before joining in, or wait for it to break above 0.10348 and hold there for a better entry.
{future}(BREVUSDT)
$BREV BREVUSDT - Up 78 Percent in a Vertical Pump, Now Stuck Near the Top #BREVUSDT永续
The current price is 0.10257, up 78.38 percent. High: 0.10348, low: 0.05519.
1-hour chart: $BREV The price had been flat for a long time around 0.05519, then shot straight up to 0.10348 without a pullback. It’s now at 0.10241, still very close to the top. This means there hasn’t been any sell-off in this pump yet; buyers are still holding the price up.
Today’s gain is 77.58 percent, 7-day gain 40.96 percent, 30-day gain 39.54 percent, 90-day gain 60.44 percent, and 180-day change minus 8.40 percent. That means today’s pump alone turned every timeframe green. Before today, this coin was still weak, and the 180-day change was still negative.
Volume: 2.04B BREV, 170.72M USDT. This means the pump is very active, with a large amount of money suddenly flowing in. It’s not a quiet pump.
Levels $BREV
Resistance: 0.10348
Support: 0.08465 - 0.07402
Don’t chase a Long at 0.10257. The price has nearly doubled from the low in a single move and hasn’t pulled back yet. Wait for a pullback to 0.08465 and a bounce before joining in, or wait for it to break above 0.10348 and hold there for a better entry.
The current price is 0.10257, up 78.38 percent. High: 0.10348, low: 0.05519.
1-hour chart: $BREV The price had been flat for a long time around 0.05519, then shot straight up to 0.10348 without a pullback. It’s now at 0.10241, still very close to the top. This means there hasn’t been any sell-off in this pump yet; buyers are still holding the price up.
Today’s gain is 77.58 percent, 7-day gain 40.96 percent, 30-day gain 39.54 percent, 90-day gain 60.44 percent, and 180-day change minus 8.40 percent. That means today’s pump alone turned every timeframe green. Before today, this coin was still weak, and the 180-day change was still negative.
Volume: 2.04B BREV, 170.72M USDT. This means the pump is very active, with a large amount of money suddenly flowing in. It’s not a quiet pump.
Levels $BREV
Resistance: 0.10348
Support: 0.08465 - 0.07402
Don’t chase a Long at 0.10257. The price has nearly doubled from the low in a single move and hasn’t pulled back yet. Wait for a pullback to 0.08465 and a bounce before joining in, or wait for it to break above 0.10348 and hold there for a better entry.
1
34
·
--
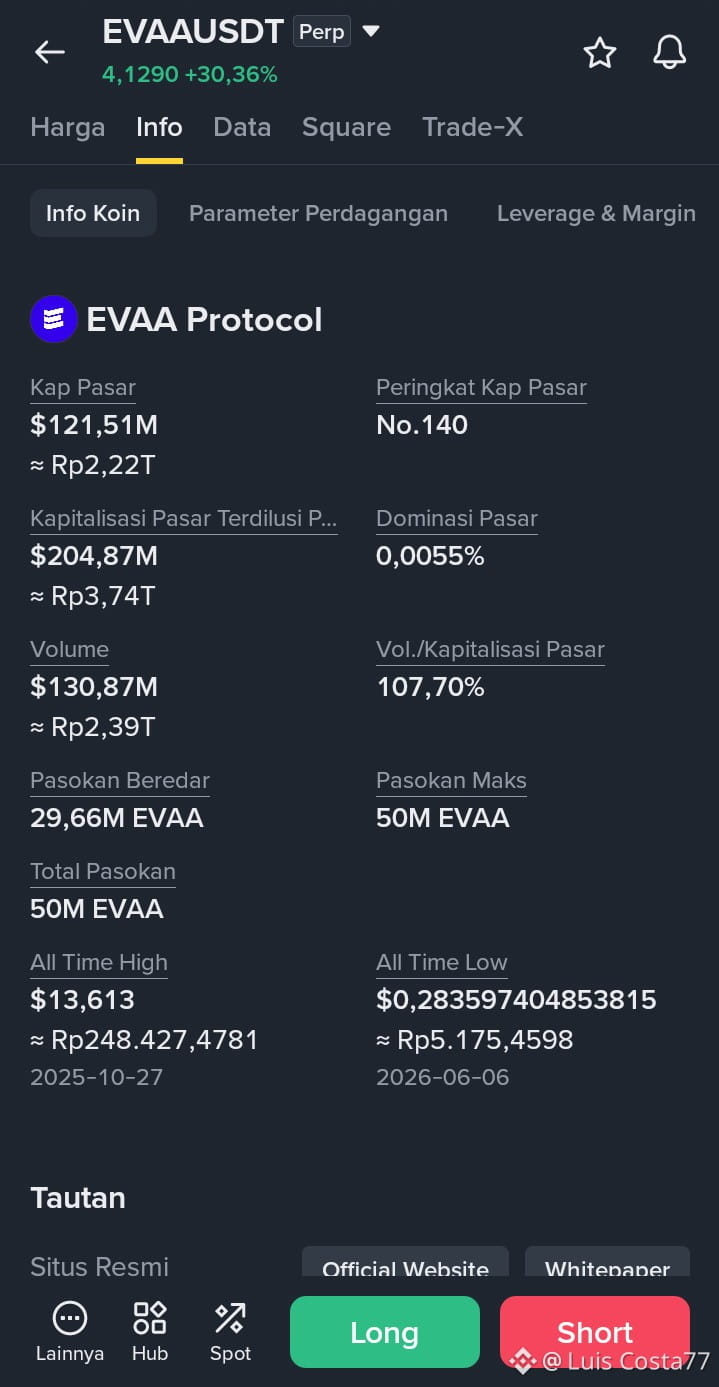
$EVAA EVAAUSDT perp - Up 30 Percent, Volume Is Already Bigger Than Market Cap
Current price: 4.1290, up 30.36 percent.
Market cap: 121.51M USD, ranked No. 140. Fully diluted valuation: 204.87M USD. This means around 40 percent of the supply is still not in circulation, since the total supply is 50M EVAA and only 29.66M EVAA is circulating. There’s a risk of selling pressure from new supply if the price keeps rising.
Volume: 130.87M USD, Vol / Market Cap: 107.70 percent. This is the most important part. Daily volume is already bigger than the entire market cap. That means this coin is being heavily pumped, with money moving extremely fast. Coins like this can rise vertically, but they can also crash just as fast.
All-Time High: 13.613 USD. All-Time Low: 0.2835 USD. The current price of 4.1290 is still very far from the ATH, around 70 percent below it. But from the ATL, the price has already risen more than 14-fold. So this isn’t a coin that just started rising—it has already rebounded a long way from the bottom.
Levels:
Psychological resistance: 4.50 - 5.00
Support: 3.20 - 2.80
Don’t chase a long at 4.1290 just because it’s up 30 percent. Vol / Market Cap at 107 percent is already a sign of overheating. Wait for a deep correction toward 3.20 and a bounce before joining in.
{future}(EVAAUSDT)
$EVAA EVAAUSDT perp - Up 30 Percent, Volume Is Already Bigger Than Market Cap
Current price: 4.1290, up 30.36 percent.
Market cap: 121.51M USD, ranked No. 140. Fully diluted valuation: 204.87M USD. This means around 40 percent of the supply is still not in circulation, since the total supply is 50M EVAA and only 29.66M EVAA is circulating. There’s a risk of selling pressure from new supply if the price keeps rising.
Volume: 130.87M USD, Vol / Market Cap: 107.70 percent. This is the most important part. Daily volume is already bigger than the entire market cap. That means this coin is being heavily pumped, with money moving extremely fast. Coins like this can rise vertically, but they can also crash just as fast.
All-Time High: 13.613 USD. All-Time Low: 0.2835 USD. The current price of 4.1290 is still very far from the ATH, around 70 percent below it. But from the ATL, the price has already risen more than 14-fold. So this isn’t a coin that just started rising—it has already rebounded a long way from the bottom.
Levels:
Psychological resistance: 4.50 - 5.00
Support: 3.20 - 2.80
Don’t chase a long at 4.1290 just because it’s up 30 percent. Vol / Market Cap at 107 percent is already a sign of overheating. Wait for a deep correction toward 3.20 and a bounce before joining in.
Current price: 4.1290, up 30.36 percent.
Market cap: 121.51M USD, ranked No. 140. Fully diluted valuation: 204.87M USD. This means around 40 percent of the supply is still not in circulation, since the total supply is 50M EVAA and only 29.66M EVAA is circulating. There’s a risk of selling pressure from new supply if the price keeps rising.
Volume: 130.87M USD, Vol / Market Cap: 107.70 percent. This is the most important part. Daily volume is already bigger than the entire market cap. That means this coin is being heavily pumped, with money moving extremely fast. Coins like this can rise vertically, but they can also crash just as fast.
All-Time High: 13.613 USD. All-Time Low: 0.2835 USD. The current price of 4.1290 is still very far from the ATH, around 70 percent below it. But from the ATL, the price has already risen more than 14-fold. So this isn’t a coin that just started rising—it has already rebounded a long way from the bottom.
Levels:
Psychological resistance: 4.50 - 5.00
Support: 3.20 - 2.80
Don’t chase a long at 4.1290 just because it’s up 30 percent. Vol / Market Cap at 107 percent is already a sign of overheating. Wait for a deep correction toward 3.20 and a bounce before joining in.
1
29
·
--
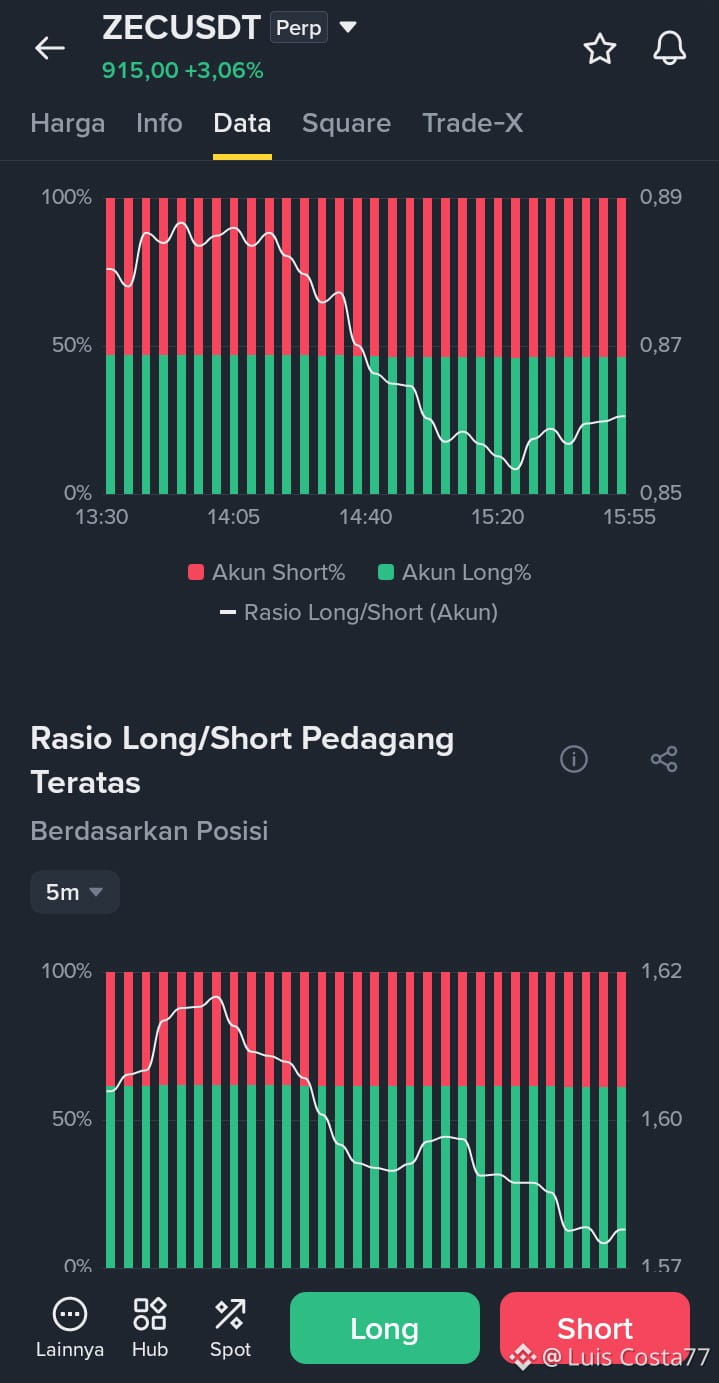
$ZEC ZECUSDT perp - Price Is Up, But Everyone Is Cutting Longs
The current price is 915.00, up 3.06 percent.
Top Chart - Account Ratio: Long at around 46 percent, Short at around 54 percent. The ratio stayed around 0.89 for a while, then kept breaking down to 0.85, before ticking up slightly to around 0.86.
This means retail traders are leaning Short. Even though the price is up 3.06 percent, they aren't going Long and are instead adding Shorts. Retail traders don't believe in this rally.
Bottom Chart - Top Trader Position Ratio: Long at around 62 percent, Short at around 38 percent. The ratio rose to 1.62, then kept dropping to 1.57.
This means the whales are also cutting Longs. They're still Long, but gradually reducing their positions. This isn't accumulation; it's slight distribution while the price is rising.
These signals align. Retail traders are Short, and the whales are cutting Longs. This price rise isn't supported by an increase in Long positions.
Levels:
Top Ratio Resistance: 0.89
Bottom Ratio Support: 1.57
Don't go Long at 915.00 just because the price is green. The whales are slowly dumping Longs, and retail traders are also Short. If the price fails to hold, the drop could be swift because there's no support from below.
{future}(ZECUSDT)
$ZEC ZECUSDT perp - Price Is Up, But Everyone Is Cutting Longs
The current price is 915.00, up 3.06 percent.
Top Chart - Account Ratio: Long at around 46 percent, Short at around 54 percent. The ratio stayed around 0.89 for a while, then kept breaking down to 0.85, before ticking up slightly to around 0.86.
This means retail traders are leaning Short. Even though the price is up 3.06 percent, they aren't going Long and are instead adding Shorts. Retail traders don't believe in this rally.
Bottom Chart - Top Trader Position Ratio: Long at around 62 percent, Short at around 38 percent. The ratio rose to 1.62, then kept dropping to 1.57.
This means the whales are also cutting Longs. They're still Long, but gradually reducing their positions. This isn't accumulation; it's slight distribution while the price is rising.
These signals align. Retail traders are Short, and the whales are cutting Longs. This price rise isn't supported by an increase in Long positions.
Levels:
Top Ratio Resistance: 0.89
Bottom Ratio Support: 1.57
Don't go Long at 915.00 just because the price is green. The whales are slowly dumping Longs, and retail traders are also Short. If the price fails to hold, the drop could be swift because there's no support from below.
The current price is 915.00, up 3.06 percent.
Top Chart - Account Ratio: Long at around 46 percent, Short at around 54 percent. The ratio stayed around 0.89 for a while, then kept breaking down to 0.85, before ticking up slightly to around 0.86.
This means retail traders are leaning Short. Even though the price is up 3.06 percent, they aren't going Long and are instead adding Shorts. Retail traders don't believe in this rally.
Bottom Chart - Top Trader Position Ratio: Long at around 62 percent, Short at around 38 percent. The ratio rose to 1.62, then kept dropping to 1.57.
This means the whales are also cutting Longs. They're still Long, but gradually reducing their positions. This isn't accumulation; it's slight distribution while the price is rising.
These signals align. Retail traders are Short, and the whales are cutting Longs. This price rise isn't supported by an increase in Long positions.
Levels:
Top Ratio Resistance: 0.89
Bottom Ratio Support: 1.57
Don't go Long at 915.00 just because the price is green. The whales are slowly dumping Longs, and retail traders are also Short. If the price fails to hold, the drop could be swift because there's no support from below.
1
25
·
--
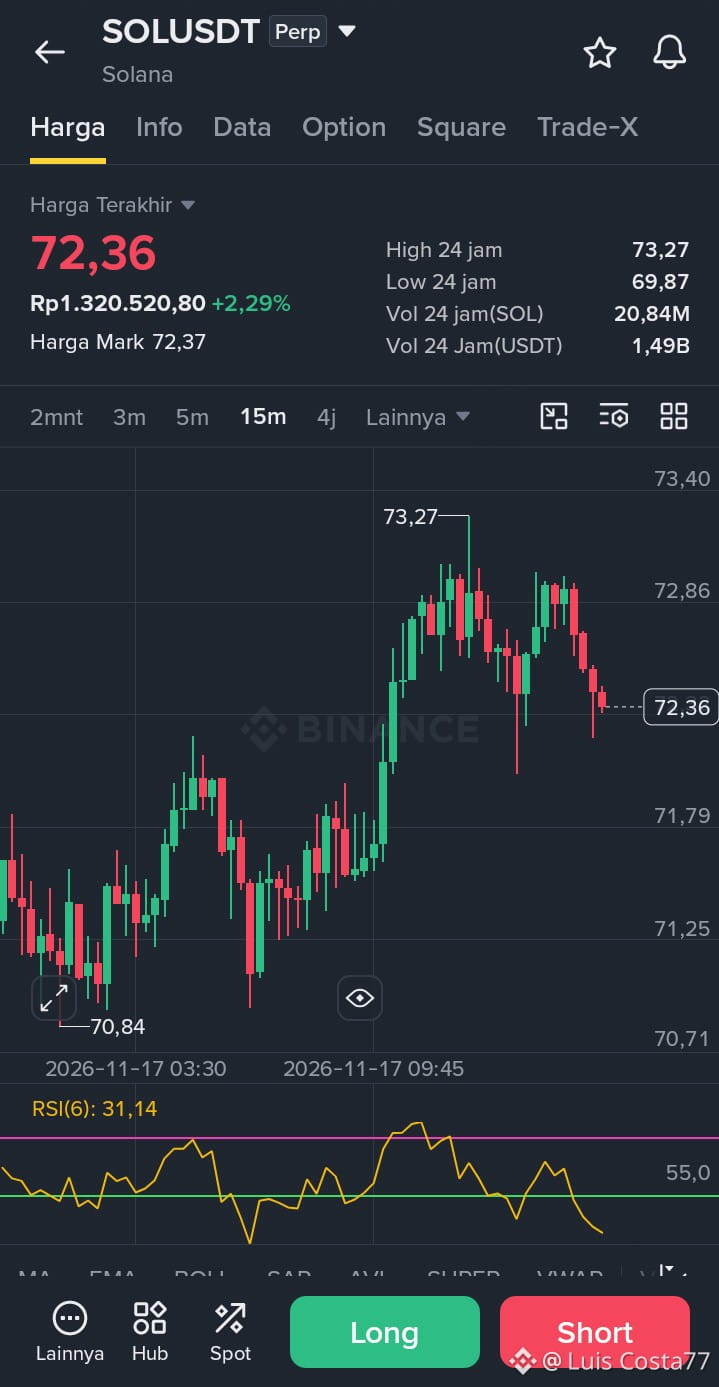
$SOL SOLUSDT perp - Failed to Break the Peak, Starting to Get Slammed
Current price 72.36, up 2.29 percent. High 73.27, Low 69.87.
15m chart: Price hovered around 70.84 for a while, then climbed gradually and shot vertically up to 73.27. After hitting that peak, it immediately stalled and got pushed down gradually to 72.36. This means buyers failed to hold above the peak, and sellers are starting to take over near the top.
RSI(6) is at 31.14. It has entered the oversold zone on the short timeframe. This means the short-term sell-off is starting to lose steam, but that doesn't necessarily mean an immediate reversal. It could bounce a little before continuing down.
Volume: 20.84M SOL, 1.49B USDT. This means the move is active, not quiet. Some holders are genuinely selling into this drop from the peak.
Levels:
Resistance 73.27
Support 71.79 - 70.84
Don't chase a Long at 72.36. Price just failed to break the peak and is getting pushed down. Wait for a bounce and for it to hold above 71.79 before joining, or wait for it to break 73.27 and hold above it before entering.
{future}(SOLUSDT)
$SOL SOLUSDT perp - Failed to Break the Peak, Starting to Get Slammed
Current price 72.36, up 2.29 percent. High 73.27, Low 69.87.
15m chart: Price hovered around 70.84 for a while, then climbed gradually and shot vertically up to 73.27. After hitting that peak, it immediately stalled and got pushed down gradually to 72.36. This means buyers failed to hold above the peak, and sellers are starting to take over near the top.
RSI(6) is at 31.14. It has entered the oversold zone on the short timeframe. This means the short-term sell-off is starting to lose steam, but that doesn't necessarily mean an immediate reversal. It could bounce a little before continuing down.
Volume: 20.84M SOL, 1.49B USDT. This means the move is active, not quiet. Some holders are genuinely selling into this drop from the peak.
Levels:
Resistance 73.27
Support 71.79 - 70.84
Don't chase a Long at 72.36. Price just failed to break the peak and is getting pushed down. Wait for a bounce and for it to hold above 71.79 before joining, or wait for it to break 73.27 and hold above it before entering.
Current price 72.36, up 2.29 percent. High 73.27, Low 69.87.
15m chart: Price hovered around 70.84 for a while, then climbed gradually and shot vertically up to 73.27. After hitting that peak, it immediately stalled and got pushed down gradually to 72.36. This means buyers failed to hold above the peak, and sellers are starting to take over near the top.
RSI(6) is at 31.14. It has entered the oversold zone on the short timeframe. This means the short-term sell-off is starting to lose steam, but that doesn't necessarily mean an immediate reversal. It could bounce a little before continuing down.
Volume: 20.84M SOL, 1.49B USDT. This means the move is active, not quiet. Some holders are genuinely selling into this drop from the peak.
Levels:
Resistance 73.27
Support 71.79 - 70.84
Don't chase a Long at 72.36. Price just failed to break the peak and is getting pushed down. Wait for a bounce and for it to hold above 71.79 before joining, or wait for it to break 73.27 and hold above it before entering.
1
20
·
--
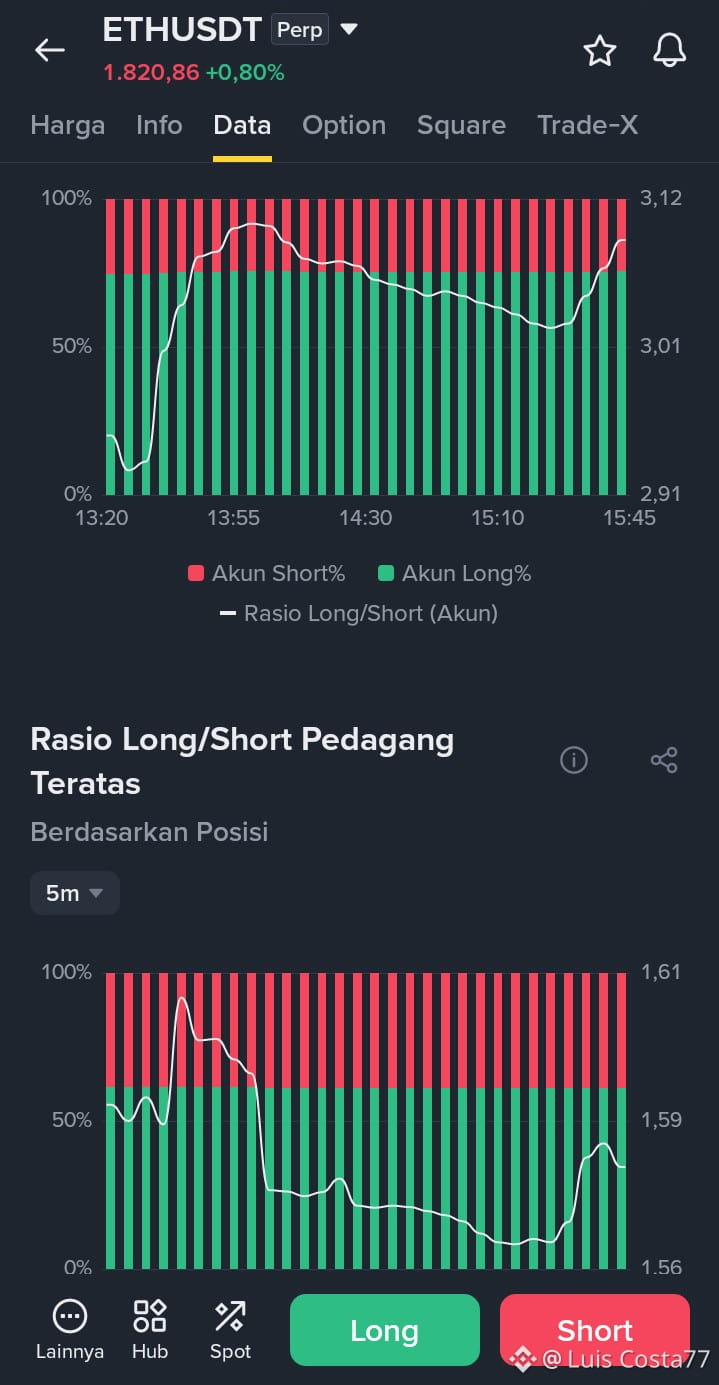
$ETH ETHUSDT perp - Retail Is Confidently Long, but Whales Are Still Hesitant
Current price: 1,820.86, up 0.80 percent.
Top Chart - Account Ratio: Long around 72 percent, Short around 28 percent. The ratio briefly shot up from 2.91 to 3.12, then slowly fell to 3.01, before climbing back to around 3.10.
This means retail traders are extremely confident in their Long positions. Even though they briefly wavered, they came back and added more Longs. Positions are now heavily crowded.
Bottom Chart - Top Trader Position Ratio: Long around 62 percent, Short around 38 percent. The ratio edged up to 1.61, then plunged to 1.56, before slowly rising to around 1.58.
This means whales aren't as confident as retail traders. They significantly cut their Long positions, and have only just started to slowly move back in. This looks more like holding positions than aggressively adding to them.
They're moving in different directions. Retail is all in on Long, while whales are still cautious.
Levels:
Top Ratio Support: 3.01
Bottom Ratio Support: 1.56
Don't go Long at 1,820.86 just because retail is piling into Long positions. The account ratio is already at 3.10—that's far too crowded. If the price breaks down, Long holders will panic together and the sell-off will accelerate.
$ETH
{future}(ETHUSDT)
$ETH ETHUSDT perp - Retail Is Confidently Long, but Whales Are Still Hesitant
Current price: 1,820.86, up 0.80 percent.
Top Chart - Account Ratio: Long around 72 percent, Short around 28 percent. The ratio briefly shot up from 2.91 to 3.12, then slowly fell to 3.01, before climbing back to around 3.10.
This means retail traders are extremely confident in their Long positions. Even though they briefly wavered, they came back and added more Longs. Positions are now heavily crowded.
Bottom Chart - Top Trader Position Ratio: Long around 62 percent, Short around 38 percent. The ratio edged up to 1.61, then plunged to 1.56, before slowly rising to around 1.58.
This means whales aren't as confident as retail traders. They significantly cut their Long positions, and have only just started to slowly move back in. This looks more like holding positions than aggressively adding to them.
They're moving in different directions. Retail is all in on Long, while whales are still cautious.
Levels:
Top Ratio Support: 3.01
Bottom Ratio Support: 1.56
Don't go Long at 1,820.86 just because retail is piling into Long positions. The account ratio is already at 3.10—that's far too crowded. If the price breaks down, Long holders will panic together and the sell-off will accelerate.
$ETH
Current price: 1,820.86, up 0.80 percent.
Top Chart - Account Ratio: Long around 72 percent, Short around 28 percent. The ratio briefly shot up from 2.91 to 3.12, then slowly fell to 3.01, before climbing back to around 3.10.
This means retail traders are extremely confident in their Long positions. Even though they briefly wavered, they came back and added more Longs. Positions are now heavily crowded.
Bottom Chart - Top Trader Position Ratio: Long around 62 percent, Short around 38 percent. The ratio edged up to 1.61, then plunged to 1.56, before slowly rising to around 1.58.
This means whales aren't as confident as retail traders. They significantly cut their Long positions, and have only just started to slowly move back in. This looks more like holding positions than aggressively adding to them.
They're moving in different directions. Retail is all in on Long, while whales are still cautious.
Levels:
Top Ratio Support: 3.01
Bottom Ratio Support: 1.56
Don't go Long at 1,820.86 just because retail is piling into Long positions. The account ratio is already at 3.10—that's far too crowded. If the price breaks down, Long holders will panic together and the sell-off will accelerate.
$ETH
1
51
·
--
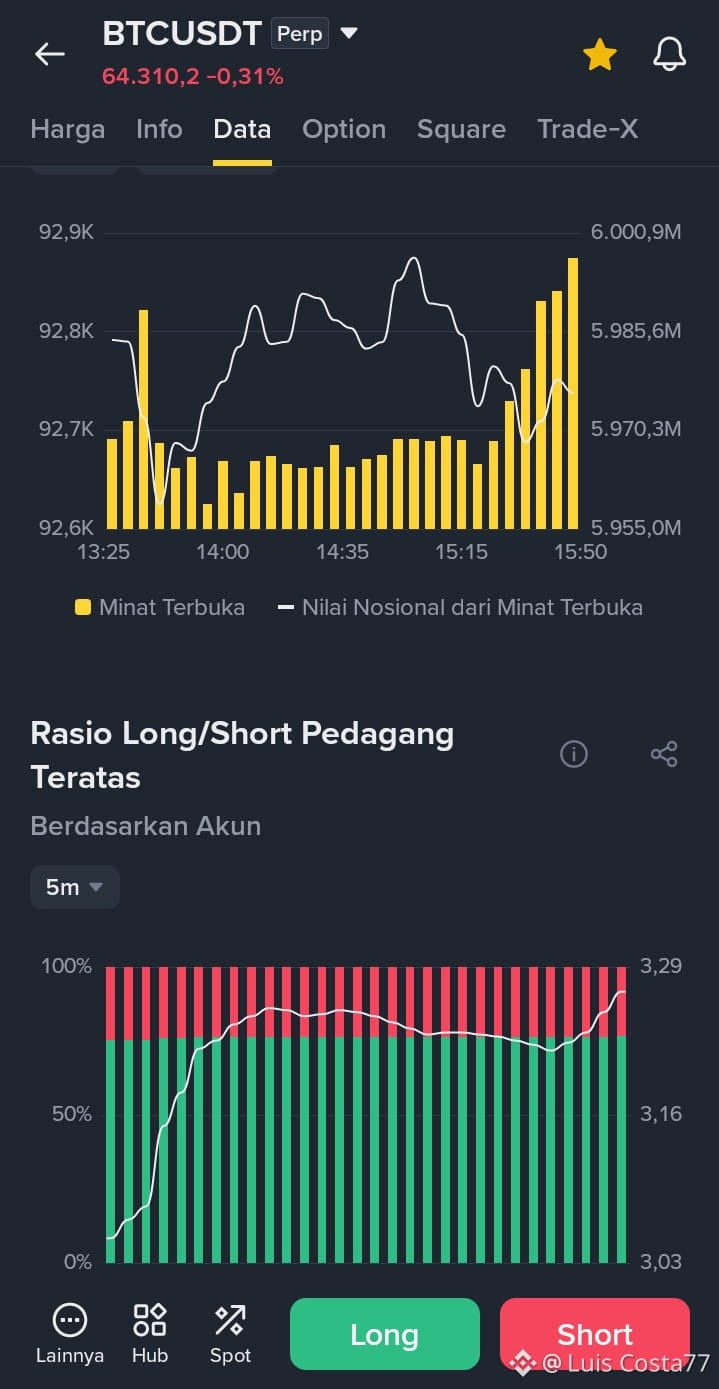
$BTC BTCUSDT - Whales Are Increasingly Going Long, Open Interest Rises
Current price: 64,310.2, down 0.31 percent.
Top Chart - Open Interest: Open interest briefly fell from 92.8K to 92.6K, then rose slowly before shooting up again at the end to around 92.9K. Notional value also rose to 6,000.9M. This means new money is flowing in again, not running away. Someone opened new positions at the end of the session.
Bottom Chart - Top Trader Ratio: Longs are around 72 percent, Shorts around 28 percent. The ratio climbed sharply from 3.03 to 3.29. It shot vertically upward at the end, with no pullback.
This means the whales are becoming more confident about going Long. Even though the price dipped slightly by 0.31 percent, they added to their Long positions and opened new ones. These aren't whales getting scared; they're accumulating.
Level $BTC
Ratio Support: 3.16
Ratio Resistance: 3.29
Don't go Short at 64,310.2 just because the price is slightly in the red. The whales have piled into Long positions and open interest is rising. If the price bounces, Short sellers will get trapped.
$BTC
{future}(BTCUSDT)
$BTC BTCUSDT - Whales Are Increasingly Going Long, Open Interest Rises
Current price: 64,310.2, down 0.31 percent.
Top Chart - Open Interest: Open interest briefly fell from 92.8K to 92.6K, then rose slowly before shooting up again at the end to around 92.9K. Notional value also rose to 6,000.9M. This means new money is flowing in again, not running away. Someone opened new positions at the end of the session.
Bottom Chart - Top Trader Ratio: Longs are around 72 percent, Shorts around 28 percent. The ratio climbed sharply from 3.03 to 3.29. It shot vertically upward at the end, with no pullback.
This means the whales are becoming more confident about going Long. Even though the price dipped slightly by 0.31 percent, they added to their Long positions and opened new ones. These aren't whales getting scared; they're accumulating.
Level $BTC
Ratio Support: 3.16
Ratio Resistance: 3.29
Don't go Short at 64,310.2 just because the price is slightly in the red. The whales have piled into Long positions and open interest is rising. If the price bounces, Short sellers will get trapped.
$BTC
Current price: 64,310.2, down 0.31 percent.
Top Chart - Open Interest: Open interest briefly fell from 92.8K to 92.6K, then rose slowly before shooting up again at the end to around 92.9K. Notional value also rose to 6,000.9M. This means new money is flowing in again, not running away. Someone opened new positions at the end of the session.
Bottom Chart - Top Trader Ratio: Longs are around 72 percent, Shorts around 28 percent. The ratio climbed sharply from 3.03 to 3.29. It shot vertically upward at the end, with no pullback.
This means the whales are becoming more confident about going Long. Even though the price dipped slightly by 0.31 percent, they added to their Long positions and opened new ones. These aren't whales getting scared; they're accumulating.
Level $BTC
Ratio Support: 3.16
Ratio Resistance: 3.29
Don't go Short at 64,310.2 just because the price is slightly in the red. The whales have piled into Long positions and open interest is rising. If the price bounces, Short sellers will get trapped.
$BTC
1
33
·
--
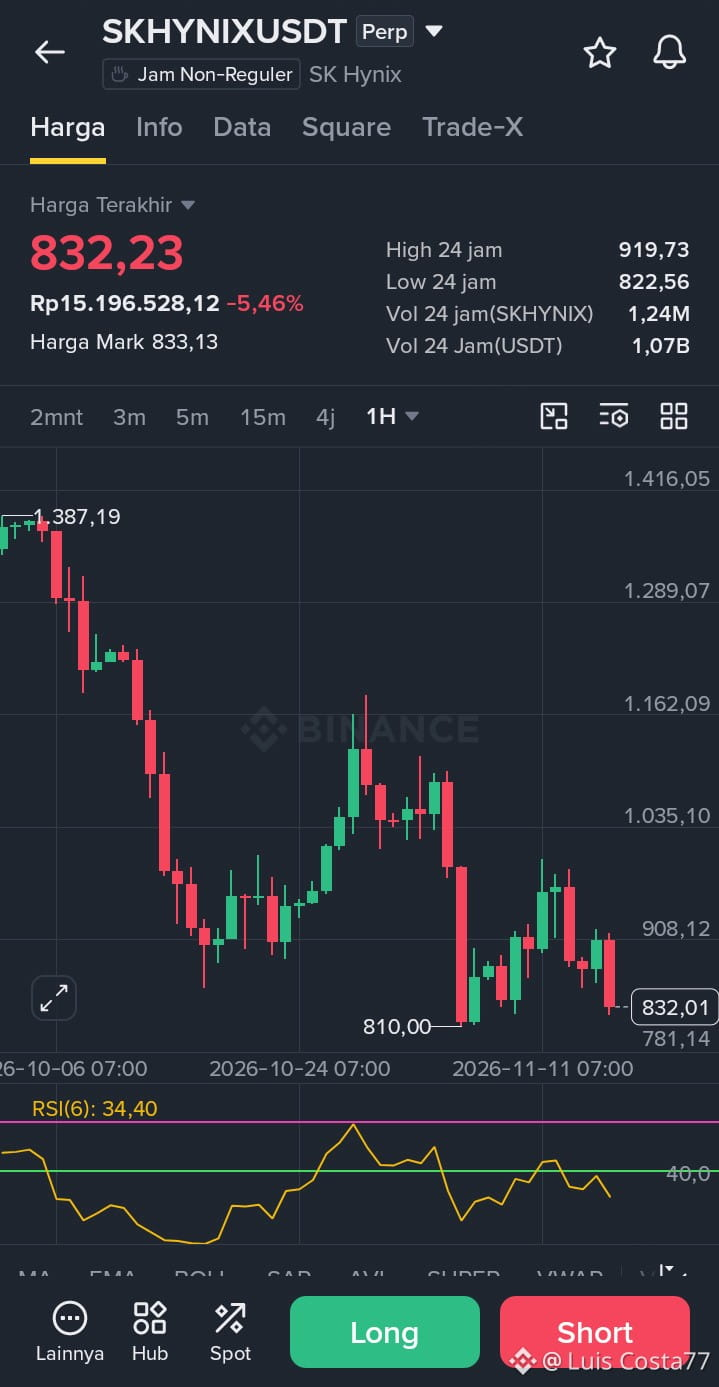
$SKHYNIX SKHYNIXUSDT - Breaking Down Again, Close to the Low #SKHYNIXUSDT
Current price is 832,23, down 5,46 percent. High 919,73, Low 822,56.
1-Day Chart $SKHYNIX : The trend is still clearly downward. Price was pushed down from 1.387,19 all the way to 810,00. It then bounced to 1.162,09, but failed to hold and was pushed down again.
Price is now at 832,01, very close to the low of 822,56. This means price is testing the latest bottom. If this low breaks, the decline could continue. If it bounces, then it may get some breathing room.#SKHNYIX
RSI is at 34,40. It’s close to oversold territory, but hasn’t reached it yet. This means selling pressure is still strong, but it’s starting to ease. It’s not a sign of an immediate reversal, just a sign that the sell-off is slowing down.
Daily volume is 1,24M SKHYNIX, 1,07B USDT. This means selling activity is still high, not quiet. There are still sellers dumping during this sell-off.
Levels $SKHYNIX
Resistance 908,12
Support 822,56 - 810,00
Don’t chase a Long at 832,23. Price is still near the low and the trend is still downward. Wait for a bounce and for it to hold above 822,56 before joining in, or wait for it to break 908,12 for a better setup.
{future}(SKHYNIXUSDT)
$SKHYNIX SKHYNIXUSDT - Breaking Down Again, Close to the Low #SKHYNIXUSDT
Current price is 832,23, down 5,46 percent. High 919,73, Low 822,56.
1-Day Chart $SKHYNIX : The trend is still clearly downward. Price was pushed down from 1.387,19 all the way to 810,00. It then bounced to 1.162,09, but failed to hold and was pushed down again.
Price is now at 832,01, very close to the low of 822,56. This means price is testing the latest bottom. If this low breaks, the decline could continue. If it bounces, then it may get some breathing room.#SKHNYIX
RSI is at 34,40. It’s close to oversold territory, but hasn’t reached it yet. This means selling pressure is still strong, but it’s starting to ease. It’s not a sign of an immediate reversal, just a sign that the sell-off is slowing down.
Daily volume is 1,24M SKHYNIX, 1,07B USDT. This means selling activity is still high, not quiet. There are still sellers dumping during this sell-off.
Levels $SKHYNIX
Resistance 908,12
Support 822,56 - 810,00
Don’t chase a Long at 832,23. Price is still near the low and the trend is still downward. Wait for a bounce and for it to hold above 822,56 before joining in, or wait for it to break 908,12 for a better setup.
Current price is 832,23, down 5,46 percent. High 919,73, Low 822,56.
1-Day Chart $SKHYNIX : The trend is still clearly downward. Price was pushed down from 1.387,19 all the way to 810,00. It then bounced to 1.162,09, but failed to hold and was pushed down again.
Price is now at 832,01, very close to the low of 822,56. This means price is testing the latest bottom. If this low breaks, the decline could continue. If it bounces, then it may get some breathing room.#SKHNYIX
RSI is at 34,40. It’s close to oversold territory, but hasn’t reached it yet. This means selling pressure is still strong, but it’s starting to ease. It’s not a sign of an immediate reversal, just a sign that the sell-off is slowing down.
Daily volume is 1,24M SKHYNIX, 1,07B USDT. This means selling activity is still high, not quiet. There are still sellers dumping during this sell-off.
Levels $SKHYNIX
Resistance 908,12
Support 822,56 - 810,00
Don’t chase a Long at 832,23. Price is still near the low and the trend is still downward. Wait for a bounce and for it to hold above 822,56 before joining in, or wait for it to break 908,12 for a better setup.
2
22
·
--
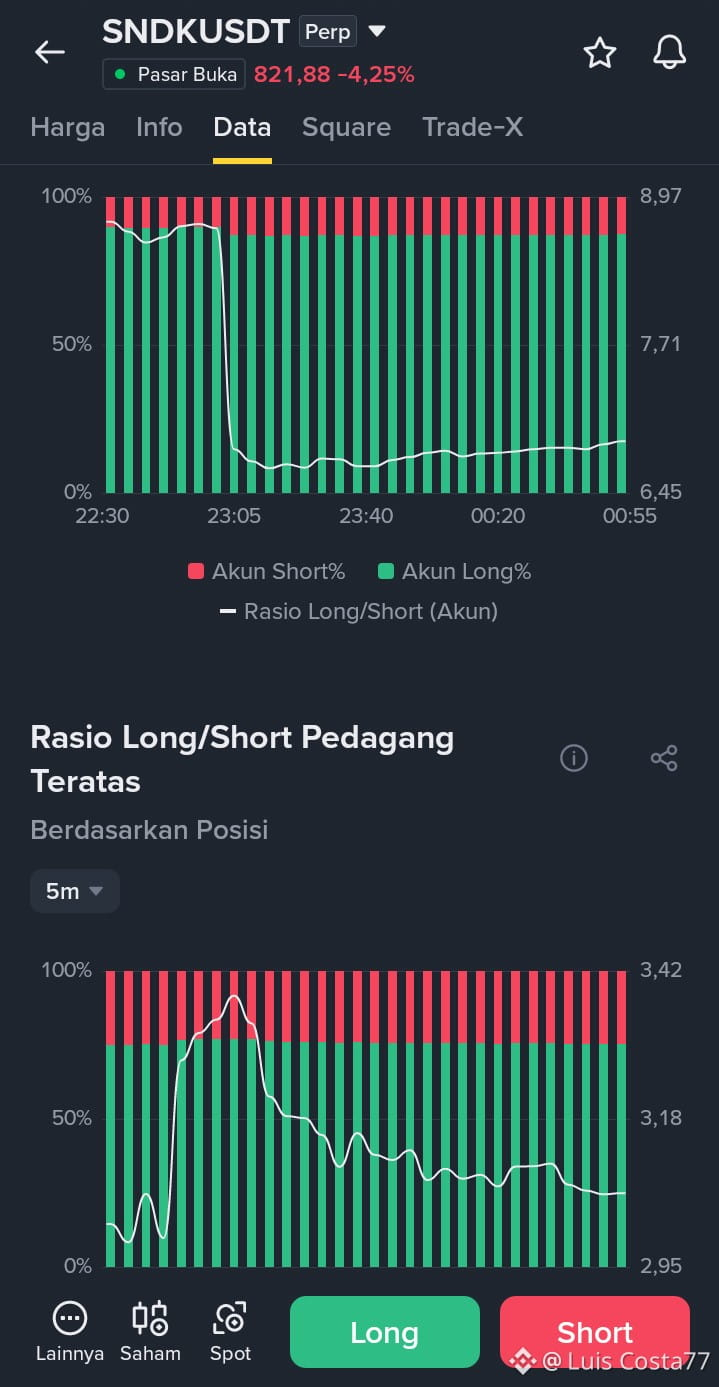
$SNDK SNDKUSDT perp - Retail Got Slammed, Whales Starting to Trim Longs
Price #SNDK分析 is now 821.88, down 4.25 percent.
Top Chart - Account Ratio: Long around 87 percent, Short around 13 percent. The ratio had been holding steady above 8, then plunged sharply to 6.45. After that, it slowly rose to around 6.90 but couldn't get back above 7.#SNDKUSDT还会跌吗
This means retail traders were caught off guard and many closed their Long positions when the price was slammed. After that, they started going Long again, but are still hesitant. They aren't as confident as before. #SNDK
Bottom Chart - Top Trader Ratio: Long around 75 percent, Short around 25 percent. The ratio surged from 2.95 to a peak of 3.42, then kept falling until it returned to 2.95.
This means the whales $SNDK had joined the Long side near the top, but then gradually started trimming their Long positions. This isn't accumulation; it's light distribution. The whales haven't exited completely, but they're no longer adding to their positions.
Levels $SNDK :
Top Ratio Support: 6.45
Bottom Ratio Support: 2.95
Don't chase Long at 821.88. Retail is still shaken after getting slammed, and the whales are also trimming their Long positions. Wait for the bottom ratio to hold above 3.18 before joining the Long side.
{future}(SNDKUSDT)
$SNDK SNDKUSDT perp - Retail Got Slammed, Whales Starting to Trim Longs
Price #SNDK分析 is now 821.88, down 4.25 percent.
Top Chart - Account Ratio: Long around 87 percent, Short around 13 percent. The ratio had been holding steady above 8, then plunged sharply to 6.45. After that, it slowly rose to around 6.90 but couldn't get back above 7.#SNDKUSDT还会跌吗
This means retail traders were caught off guard and many closed their Long positions when the price was slammed. After that, they started going Long again, but are still hesitant. They aren't as confident as before. #SNDK
Bottom Chart - Top Trader Ratio: Long around 75 percent, Short around 25 percent. The ratio surged from 2.95 to a peak of 3.42, then kept falling until it returned to 2.95.
This means the whales $SNDK had joined the Long side near the top, but then gradually started trimming their Long positions. This isn't accumulation; it's light distribution. The whales haven't exited completely, but they're no longer adding to their positions.
Levels $SNDK :
Top Ratio Support: 6.45
Bottom Ratio Support: 2.95
Don't chase Long at 821.88. Retail is still shaken after getting slammed, and the whales are also trimming their Long positions. Wait for the bottom ratio to hold above 3.18 before joining the Long side.
Price #SNDK分析 is now 821.88, down 4.25 percent.
Top Chart - Account Ratio: Long around 87 percent, Short around 13 percent. The ratio had been holding steady above 8, then plunged sharply to 6.45. After that, it slowly rose to around 6.90 but couldn't get back above 7.#SNDKUSDT还会跌吗
This means retail traders were caught off guard and many closed their Long positions when the price was slammed. After that, they started going Long again, but are still hesitant. They aren't as confident as before. #SNDK
Bottom Chart - Top Trader Ratio: Long around 75 percent, Short around 25 percent. The ratio surged from 2.95 to a peak of 3.42, then kept falling until it returned to 2.95.
This means the whales $SNDK had joined the Long side near the top, but then gradually started trimming their Long positions. This isn't accumulation; it's light distribution. The whales haven't exited completely, but they're no longer adding to their positions.
Levels $SNDK :
Top Ratio Support: 6.45
Bottom Ratio Support: 2.95
Don't chase Long at 821.88. Retail is still shaken after getting slammed, and the whales are also trimming their Long positions. Wait for the bottom ratio to hold above 3.18 before joining the Long side.
1
30
·
--
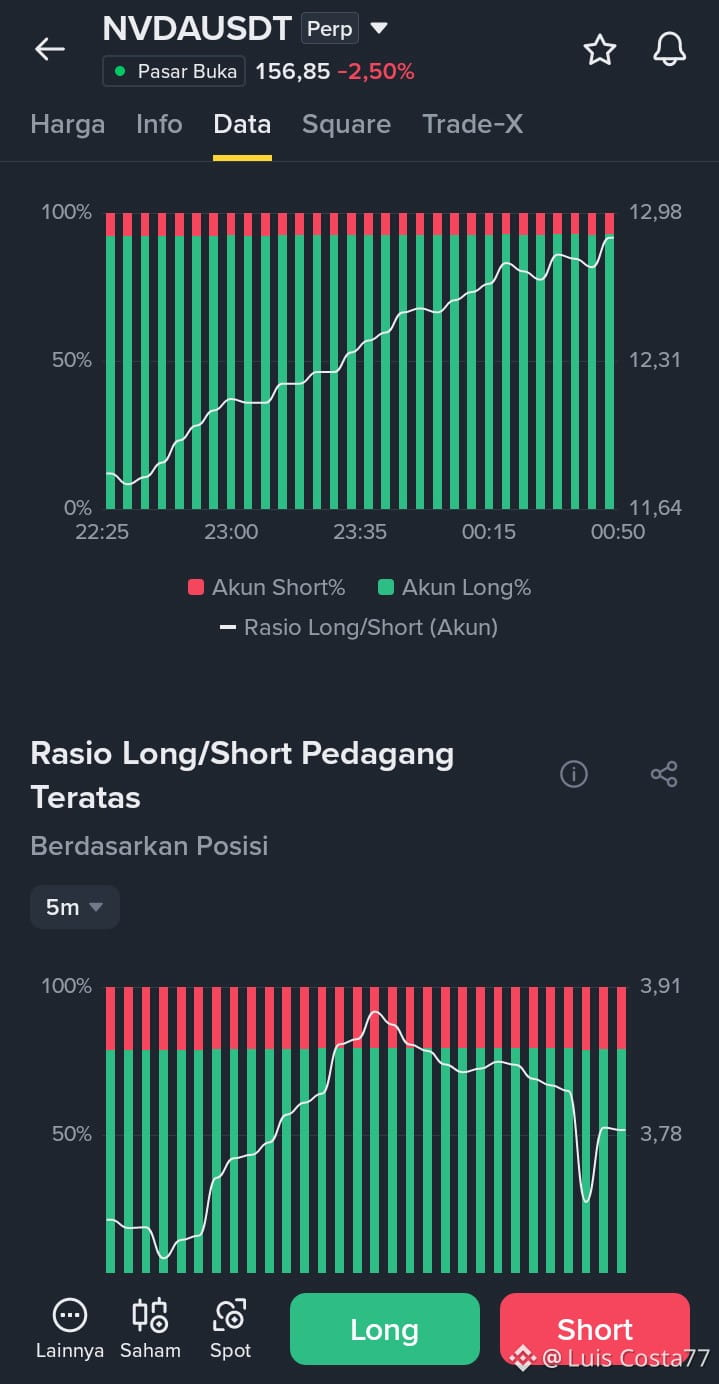
$NVDA NVDAUSDT - Price Falls, Retail and Whales Still Go Long
Current price: 156.85, down 2.50 percent.
Top Chart - Account Ratio: About 92 percent Long, with only about 8 percent Short. The ratio kept rising from 11.64 to 12.98. It rose slowly, without any major correction.
This means retail traders are extremely confident in their Long positions. Even though the price fell 2.50 percent, they didn't run away—instead, they kept adding to their Long positions. It's already very crowded, which makes things risky if the price breaks lower again.
Bottom Chart - Top Trader Ratio: About 78 percent Long, and about 22 percent Short. The ratio rose from 3.78 to a peak of 3.91, then slowly declined, briefly broke down, and then returned to 3.78.
This means the whales are also still Long, but they're not as aggressive as retail traders. They reduced their Long positions a little when the price came under pressure, then added back. This looks more like holding positions than piling in aggressively.
Level $NVDA
Top Ratio Support: 12.31
Bottom Ratio Support: 3.78
Don't go Long at 156.85 just because everyone else is Long. The account ratio is already at 12.98—that's far too crowded. If the price breaks lower, Longs will panic together and the sell-off will get even stronger.
{future}(NVDAUSDT)
$NVDA NVDAUSDT - Price Falls, Retail and Whales Still Go Long
Current price: 156.85, down 2.50 percent.
Top Chart - Account Ratio: About 92 percent Long, with only about 8 percent Short. The ratio kept rising from 11.64 to 12.98. It rose slowly, without any major correction.
This means retail traders are extremely confident in their Long positions. Even though the price fell 2.50 percent, they didn't run away—instead, they kept adding to their Long positions. It's already very crowded, which makes things risky if the price breaks lower again.
Bottom Chart - Top Trader Ratio: About 78 percent Long, and about 22 percent Short. The ratio rose from 3.78 to a peak of 3.91, then slowly declined, briefly broke down, and then returned to 3.78.
This means the whales are also still Long, but they're not as aggressive as retail traders. They reduced their Long positions a little when the price came under pressure, then added back. This looks more like holding positions than piling in aggressively.
Level $NVDA
Top Ratio Support: 12.31
Bottom Ratio Support: 3.78
Don't go Long at 156.85 just because everyone else is Long. The account ratio is already at 12.98—that's far too crowded. If the price breaks lower, Longs will panic together and the sell-off will get even stronger.
Current price: 156.85, down 2.50 percent.
Top Chart - Account Ratio: About 92 percent Long, with only about 8 percent Short. The ratio kept rising from 11.64 to 12.98. It rose slowly, without any major correction.
This means retail traders are extremely confident in their Long positions. Even though the price fell 2.50 percent, they didn't run away—instead, they kept adding to their Long positions. It's already very crowded, which makes things risky if the price breaks lower again.
Bottom Chart - Top Trader Ratio: About 78 percent Long, and about 22 percent Short. The ratio rose from 3.78 to a peak of 3.91, then slowly declined, briefly broke down, and then returned to 3.78.
This means the whales are also still Long, but they're not as aggressive as retail traders. They reduced their Long positions a little when the price came under pressure, then added back. This looks more like holding positions than piling in aggressively.
Level $NVDA
Top Ratio Support: 12.31
Bottom Ratio Support: 3.78
Don't go Long at 156.85 just because everyone else is Long. The account ratio is already at 12.98—that's far too crowded. If the price breaks lower, Longs will panic together and the sell-off will get even stronger.
1
12
·
--
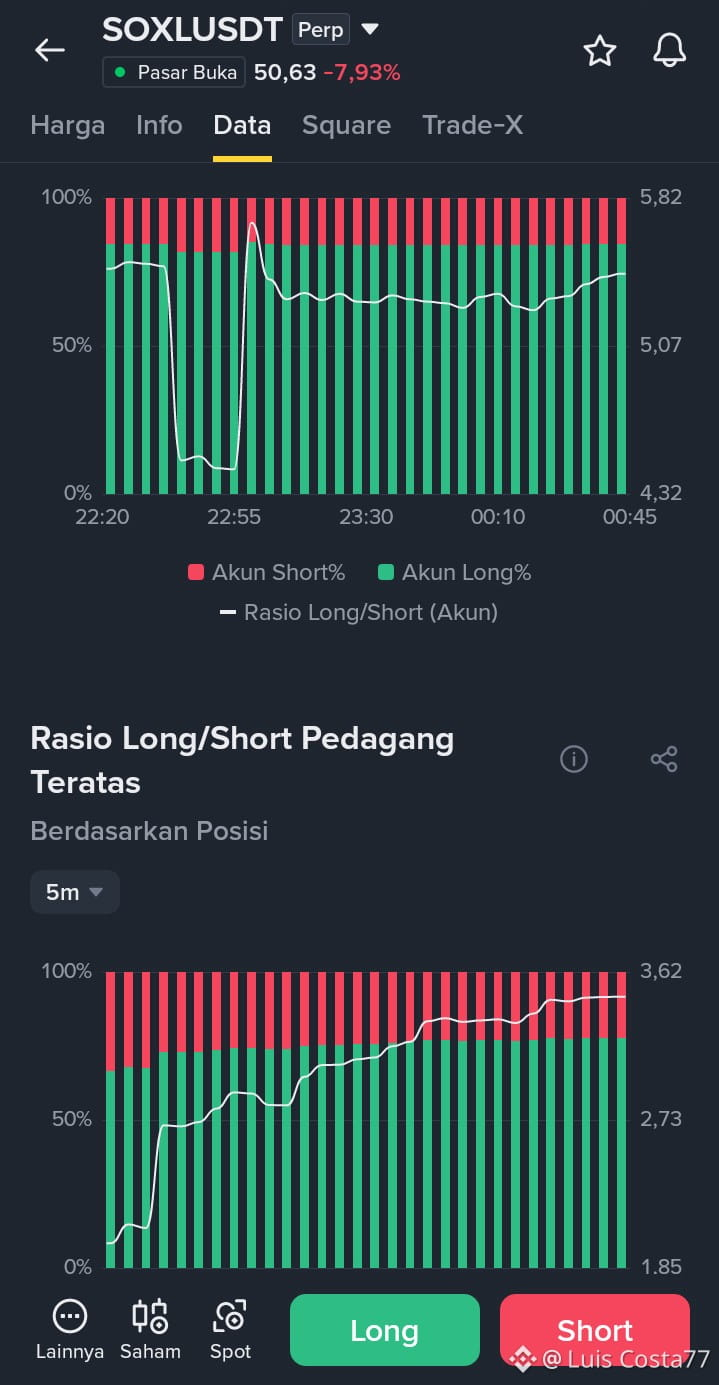
$SOXL SOXLUSDT perp - Price Drops, but Whales Go Long! #SOXLPriceAnalysis
Current price: 50.63, down 7.93 percent.
Top Chart $SOXL - Account Ratio: About 70 percent Long, about 30 percent Short. The ratio briefly plunged to 4.32, then shot straight up to 5.82. After that, it gradually fell to 5.07 and then climbed steadily back to around 5.30.
This means retail traders panicked for a moment and rushed to switch to Short as the price was dumped. #SOXL But after that, they went back to Long. Retail traders aren't fleeing; they wavered for a bit, then regained confidence and went Long again.
Bottom Chart #SOXLUSDT - Top Trader Ratio: About 68 percent Long, about 32 percent Short. The ratio kept rising from 1.85 to 3.62 without any major correction. This means the whales didn't panic at all. Even though the price fell 7.93 percent, they just kept adding to their Long positions #SOXL .
They're moving in opposite directions. Retail traders wavered, while the whales kept accumulating Long positions.
Levels $SOXL
Top Ratio Support: 5.07
Bottom Ratio Support: 2.73
Don't go Short at 50.63 just because the #SOXL price has already dropped. The whales have piled into Long positions from lower levels, and retail traders have also gone back to Long. If the price bounces, those who are Short will get trapped.
{future}(SOXLUSDT)
$SOXL SOXLUSDT perp - Price Drops, but Whales Go Long! #SOXLPriceAnalysis
Current price: 50.63, down 7.93 percent.
Top Chart $SOXL - Account Ratio: About 70 percent Long, about 30 percent Short. The ratio briefly plunged to 4.32, then shot straight up to 5.82. After that, it gradually fell to 5.07 and then climbed steadily back to around 5.30.
This means retail traders panicked for a moment and rushed to switch to Short as the price was dumped. #SOXL But after that, they went back to Long. Retail traders aren't fleeing; they wavered for a bit, then regained confidence and went Long again.
Bottom Chart #SOXLUSDT - Top Trader Ratio: About 68 percent Long, about 32 percent Short. The ratio kept rising from 1.85 to 3.62 without any major correction. This means the whales didn't panic at all. Even though the price fell 7.93 percent, they just kept adding to their Long positions #SOXL .
They're moving in opposite directions. Retail traders wavered, while the whales kept accumulating Long positions.
Levels $SOXL
Top Ratio Support: 5.07
Bottom Ratio Support: 2.73
Don't go Short at 50.63 just because the #SOXL price has already dropped. The whales have piled into Long positions from lower levels, and retail traders have also gone back to Long. If the price bounces, those who are Short will get trapped.
Current price: 50.63, down 7.93 percent.
Top Chart $SOXL - Account Ratio: About 70 percent Long, about 30 percent Short. The ratio briefly plunged to 4.32, then shot straight up to 5.82. After that, it gradually fell to 5.07 and then climbed steadily back to around 5.30.
This means retail traders panicked for a moment and rushed to switch to Short as the price was dumped. #SOXL But after that, they went back to Long. Retail traders aren't fleeing; they wavered for a bit, then regained confidence and went Long again.
Bottom Chart #SOXLUSDT - Top Trader Ratio: About 68 percent Long, about 32 percent Short. The ratio kept rising from 1.85 to 3.62 without any major correction. This means the whales didn't panic at all. Even though the price fell 7.93 percent, they just kept adding to their Long positions #SOXL .
They're moving in opposite directions. Retail traders wavered, while the whales kept accumulating Long positions.
Levels $SOXL
Top Ratio Support: 5.07
Bottom Ratio Support: 2.73
Don't go Short at 50.63 just because the #SOXL price has already dropped. The whales have piled into Long positions from lower levels, and retail traders have also gone back to Long. If the price bounces, those who are Short will get trapped.
1
28
Log in to explore more content
Join global crypto users on Binance Square
⚡️ Get latest and useful information about crypto.
💬 Trusted by the world’s largest crypto exchange.
👍 Discover real insights from verified creators.
Email / Phone number
Trending Topics
NvidiaBeatsEstimatesWith$130BQ4Outlook
557 views
19 Discussing
Nvidia Beats With $115.8 Billion in Revenue, Guides to $130 Billion and Adds $150 Billion Buyback
Binance News
·19 Likes
·22.1k views
AnthropicIPOPriceCouldExceed$80
827 views
30 Discussing
CanNvidia’sDataCenterGrowthContinue?
1,466 views
60 Discussing