
定投30年
265 Posts

定投30年
Report
Block User
一个普通程序员,坚持定投比特币,记录财富增长的全过程
Open Trade
Frequent Trader
6.4 Months
47 Following
17 Followers
13 Liked
Posts
Portfolio
All
Videos
·
--
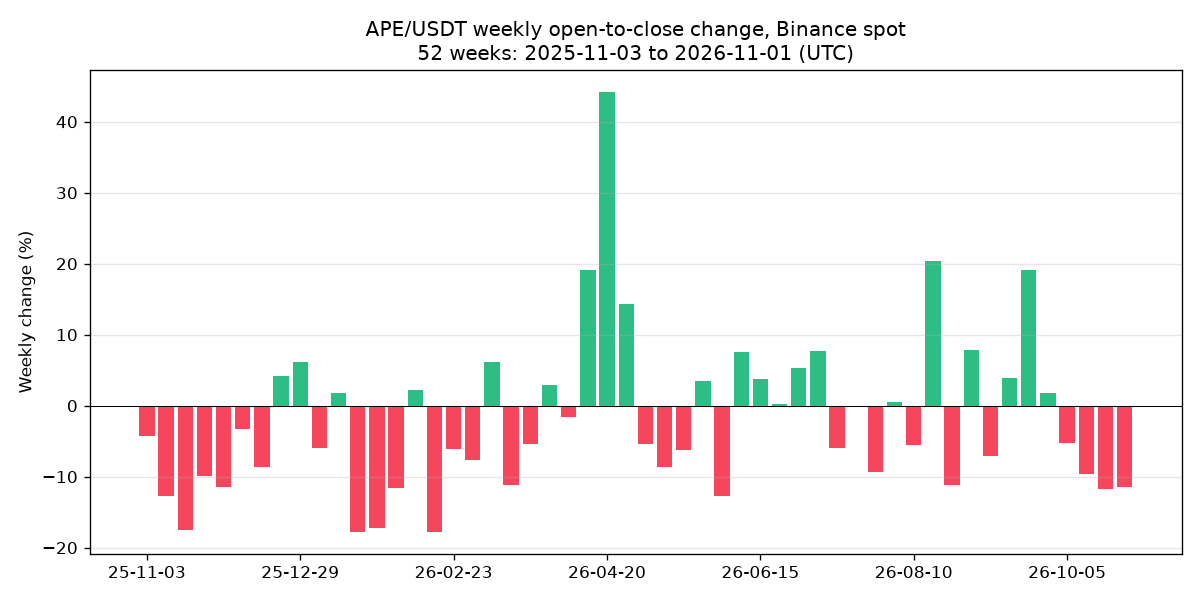
I plotted $APE ’s last 52 complete weekly candles on Binance Spot (from the week of November 3, 2025, through November 1, 2026, UTC) as weekly up-and-down bars. There’s a lot more red than green—it’s immediately obvious.
Of the 52 weeks, 21 closed up and 31 closed down. The price went from 0.4118 to 0.1115, a drop of 72.9%.
A few things worth calling out:
The stretch at the beginning was the hardest to sit through. The window started with seven straight down weeks, during which the price fell 51.4%. Most of the year’s decline happened right then.
The biggest green bar was the week of April 20, 2026. It opened at 0.1007, spiked to a high of 0.278 during the week, and closed at 0.1452, up 44.19%. The weekly high was more than double the opening price, but only a small part of that gain remained by the close. Anyone who bought near that week’s high is still underwater.
The longest winning streak ran from the week of June 8 through the week of July 6: five consecutive up weeks, for a combined gain of 26.4%.
Now it’s falling again: it’s been down for four straight weeks since the week of October 5, dropping from 0.1667 to 0.1115, or 33.1%. The low for the year was 0.0811 in the week of March 23, still some distance below the current price.
One advantage of looking at weekly candles is that they filter out intraday noise, making it easier to see whether a trend is really forming or the price is just grinding back and forth. APE has done both this year, but the downtrends have clearly lasted longer.
Do you make decisions based on weekly charts, or do you only look at daily and hourly charts?
I plotted $APE ’s last 52 complete weekly candles on Binance Spot (from the week of November 3, 2025, through November 1, 2026, UTC) as weekly up-and-down bars. There’s a lot more red than green—it’s immediately obvious.
Of the 52 weeks, 21 closed up and 31 closed down. The price went from 0.4118 to 0.1115, a drop of 72.9%.
A few things worth calling out:
The stretch at the beginning was the hardest to sit through. The window started with seven straight down weeks, during which the price fell 51.4%. Most of the year’s decline happened right then.
The biggest green bar was the week of April 20, 2026. It opened at 0.1007, spiked to a high of 0.278 during the week, and closed at 0.1452, up 44.19%. The weekly high was more than double the opening price, but only a small part of that gain remained by the close. Anyone who bought near that week’s high is still underwater.
The longest winning streak ran from the week of June 8 through the week of July 6: five consecutive up weeks, for a combined gain of 26.4%.
Now it’s falling again: it’s been down for four straight weeks since the week of October 5, dropping from 0.1667 to 0.1115, or 33.1%. The low for the year was 0.0811 in the week of March 23, still some distance below the current price.
One advantage of looking at weekly candles is that they filter out intraday noise, making it easier to see whether a trend is really forming or the price is just grinding back and forth. APE has done both this year, but the downtrends have clearly lasted longer.
Do you make decisions based on weekly charts, or do you only look at daily and hourly charts?
Of the 52 weeks, 21 closed up and 31 closed down. The price went from 0.4118 to 0.1115, a drop of 72.9%.
A few things worth calling out:
The stretch at the beginning was the hardest to sit through. The window started with seven straight down weeks, during which the price fell 51.4%. Most of the year’s decline happened right then.
The biggest green bar was the week of April 20, 2026. It opened at 0.1007, spiked to a high of 0.278 during the week, and closed at 0.1452, up 44.19%. The weekly high was more than double the opening price, but only a small part of that gain remained by the close. Anyone who bought near that week’s high is still underwater.
The longest winning streak ran from the week of June 8 through the week of July 6: five consecutive up weeks, for a combined gain of 26.4%.
Now it’s falling again: it’s been down for four straight weeks since the week of October 5, dropping from 0.1667 to 0.1115, or 33.1%. The low for the year was 0.0811 in the week of March 23, still some distance below the current price.
One advantage of looking at weekly candles is that they filter out intraday noise, making it easier to see whether a trend is really forming or the price is just grinding back and forth. APE has done both this year, but the downtrends have clearly lasted longer.
Do you make decisions based on weekly charts, or do you only look at daily and hourly charts?
6
·
--
At 6:45 a.m., I took a quick look at the Binance spot order book for $AEVO and jotted down a few numbers for anyone thinking of buying small-cap coins.
Trading volume over the past 24 hours was about 48,800 USDT, across 1,881 trades. The price was around 0.01903, down 2.11% over 24 hours.
The order book itself wasn’t bad: the spread between the best bid and ask was just 0.105%. The issue was depth:
Within 1% of the mid-price, there were about 35,000 USDT in bids, but only around 8,700 USDT in asks.
Within 2%, there were about 69,400 USDT in bids and 16,900 USDT in asks.
In other words, there wasn’t much supply on the way up, but there were buyers waiting on the way down.
I estimated the cost of placing market orders against the order book at that moment:
A 5,000 USDT market buy would have an average execution price 0.37% above the mid-price;
A 20,000 USDT market buy would average 1.21% higher, with the final level filled at 0.0195;
A 20,000 USDT market sell would average 0.72% lower.
A 20,000 USDT order is already roughly 40% of this coin’s daily trading volume. For beginners, it’s best to use limit orders and split purchases into several batches rather than rushing in with one market order. If you’re using the spot price as a reference for futures, remember that spot liquidity is this thin, so it doesn’t take much to trigger a sharp wick.
This is just a snapshot from one moment—the order book can change at any time. Do you check market depth before buying small-cap coins?
At 6:45 a.m., I took a quick look at the Binance spot order book for $AEVO and jotted down a few numbers for anyone thinking of buying small-cap coins.
Trading volume over the past 24 hours was about 48,800 USDT, across 1,881 trades. The price was around 0.01903, down 2.11% over 24 hours.
The order book itself wasn’t bad: the spread between the best bid and ask was just 0.105%. The issue was depth:
Within 1% of the mid-price, there were about 35,000 USDT in bids, but only around 8,700 USDT in asks.
Within 2%, there were about 69,400 USDT in bids and 16,900 USDT in asks.
In other words, there wasn’t much supply on the way up, but there were buyers waiting on the way down.
I estimated the cost of placing market orders against the order book at that moment:
A 5,000 USDT market buy would have an average execution price 0.37% above the mid-price;
A 20,000 USDT market buy would average 1.21% higher, with the final level filled at 0.0195;
A 20,000 USDT market sell would average 0.72% lower.
A 20,000 USDT order is already roughly 40% of this coin’s daily trading volume. For beginners, it’s best to use limit orders and split purchases into several batches rather than rushing in with one market order. If you’re using the spot price as a reference for futures, remember that spot liquidity is this thin, so it doesn’t take much to trigger a sharp wick.
This is just a snapshot from one moment—the order book can change at any time. Do you check market depth before buying small-cap coins?
Trading volume over the past 24 hours was about 48,800 USDT, across 1,881 trades. The price was around 0.01903, down 2.11% over 24 hours.
The order book itself wasn’t bad: the spread between the best bid and ask was just 0.105%. The issue was depth:
Within 1% of the mid-price, there were about 35,000 USDT in bids, but only around 8,700 USDT in asks.
Within 2%, there were about 69,400 USDT in bids and 16,900 USDT in asks.
In other words, there wasn’t much supply on the way up, but there were buyers waiting on the way down.
I estimated the cost of placing market orders against the order book at that moment:
A 5,000 USDT market buy would have an average execution price 0.37% above the mid-price;
A 20,000 USDT market buy would average 1.21% higher, with the final level filled at 0.0195;
A 20,000 USDT market sell would average 0.72% lower.
A 20,000 USDT order is already roughly 40% of this coin’s daily trading volume. For beginners, it’s best to use limit orders and split purchases into several batches rather than rushing in with one market order. If you’re using the spot price as a reference for futures, remember that spot liquidity is this thin, so it doesn’t take much to trigger a sharp wick.
This is just a snapshot from one moment—the order book can change at any time. Do you check market depth before buying small-cap coins?
3
·
--
$FLOW vs. $BTC over 12 monthly candles: it closely follows on the way down, but can’t keep up on the way upMany people buy small-cap coins based on this logic: when BTC rises, altcoins will rise even more. I compared the last 12 complete monthly candles (November 2025 to October 2026) for Binance spot FLOWUSDT and BTCUSDT. At least for FLOW, that wasn’t the case over this year.
First, let’s look at the overall numbers. Over these 12 months, FLOW fell from 0.26 to 0.02344, down 91.0%; over the same period, BTC was down 29.2%.
1. The overall direction was mostly in sync
They moved in the same direction in 10 of the 12 months. So the claim that FLOW ignores the broader market doesn’t hold up—it really does follow BTC most of the time.
2. FLOW didn’t escape a single month when BTC fell
$FLOW vs. $BTC over 12 monthly candles: it closely follows on the way down, but can’t keep up on the way up
Many people buy small-cap coins based on this logic: when BTC rises, altcoins will rise even more. I compared the last 12 complete monthly candles (November 2025 to October 2026) for Binance spot FLOWUSDT and BTCUSDT. At least for FLOW, that wasn’t the case over this year.
First, let’s look at the overall numbers. Over these 12 months, FLOW fell from 0.26 to 0.02344, down 91.0%; over the same period, BTC was down 29.2%.
1. The overall direction was mostly in sync
They moved in the same direction in 10 of the 12 months. So the claim that FLOW ignores the broader market doesn’t hold up—it really does follow BTC most of the time.
2. FLOW didn’t escape a single month when BTC fell
First, let’s look at the overall numbers. Over these 12 months, FLOW fell from 0.26 to 0.02344, down 91.0%; over the same period, BTC was down 29.2%.
1. The overall direction was mostly in sync
They moved in the same direction in 10 of the 12 months. So the claim that FLOW ignores the broader market doesn’t hold up—it really does follow BTC most of the time.
2. FLOW didn’t escape a single month when BTC fell
117
·
--
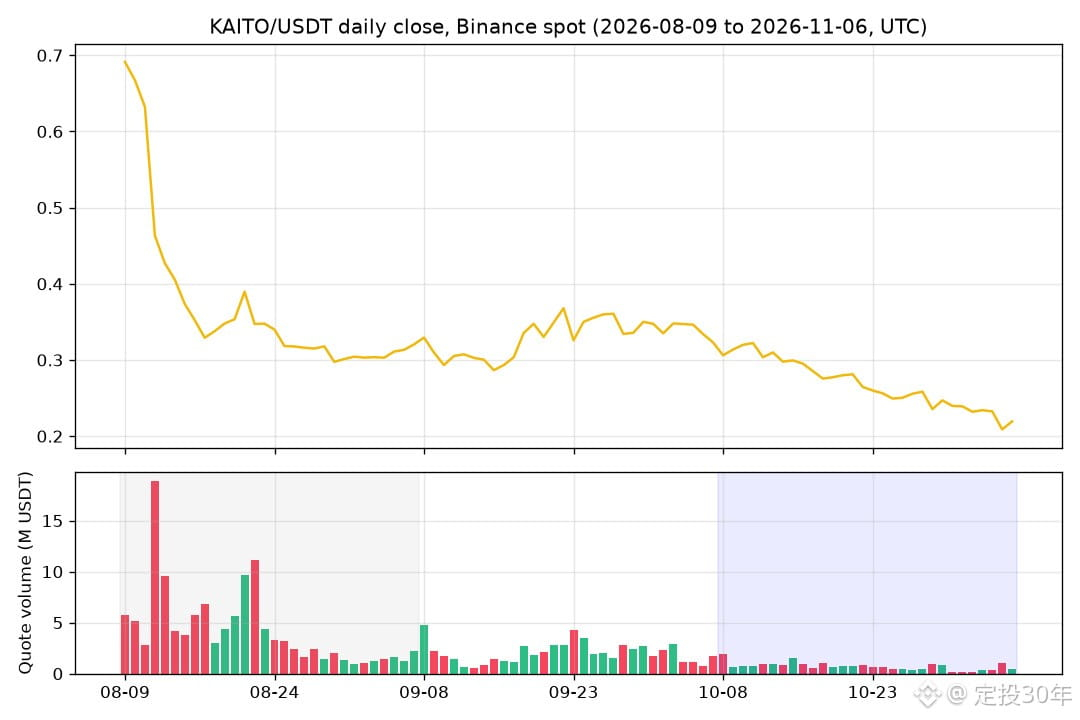
$KAITO Over the last 90 daily candles (UTC, August 9 to November 6), it fell from 0.726 to 0.2194 on Binance Spot, down 69.8%. A steep drop isn’t unusual; what matters more to me is volume.
Average daily trading volume was about 4.29M USDT in the first 30 days, but only about 0.71M in the most recent 30 days, down 83.3%.
I picked out the days when trading volume exceeded twice the 90-day median. There were 19 in total: 16 fell in the first 30 days, and none in the most recent 30. The biggest was August 12, with 18.86M in volume—12.7 times the median—and a 26.63% drop that day.
The most recent 30 days were also down 32.0%, but the average daily range narrowed from 9.68% in the first 30 days to 6.69%, and the price closed higher on 14 of those 30 days. Prices kept falling while both volatility and volume shrank. On November 5, it even touched a 90-day low of 0.2043.
The data shows that the concentrated selling seen in August hasn’t returned; there are simply fewer buyers and sellers. No one rushing in doesn’t mean the bottom is in.
For spot traders, with volume this low, even dip-buying orders should be placed in batches. For futures traders, frequently reversing positions in a low-volume grind down can easily get you whipsawed.
The chart shows the closing price and daily trading volume. The first 30 days are shaded gray, and the most recent 30 days are shaded blue.
Which do you find harder to endure: a low-volume grind down or a high-volume crash?
$KAITO Over the last 90 daily candles (UTC, August 9 to November 6), it fell from 0.726 to 0.2194 on Binance Spot, down 69.8%. A steep drop isn’t unusual; what matters more to me is volume.
Average daily trading volume was about 4.29M USDT in the first 30 days, but only about 0.71M in the most recent 30 days, down 83.3%.
I picked out the days when trading volume exceeded twice the 90-day median. There were 19 in total: 16 fell in the first 30 days, and none in the most recent 30. The biggest was August 12, with 18.86M in volume—12.7 times the median—and a 26.63% drop that day.
The most recent 30 days were also down 32.0%, but the average daily range narrowed from 9.68% in the first 30 days to 6.69%, and the price closed higher on 14 of those 30 days. Prices kept falling while both volatility and volume shrank. On November 5, it even touched a 90-day low of 0.2043.
The data shows that the concentrated selling seen in August hasn’t returned; there are simply fewer buyers and sellers. No one rushing in doesn’t mean the bottom is in.
For spot traders, with volume this low, even dip-buying orders should be placed in batches. For futures traders, frequently reversing positions in a low-volume grind down can easily get you whipsawed.
The chart shows the closing price and daily trading volume. The first 30 days are shaded gray, and the most recent 30 days are shaded blue.
Which do you find harder to endure: a low-volume grind down or a high-volume crash?
Average daily trading volume was about 4.29M USDT in the first 30 days, but only about 0.71M in the most recent 30 days, down 83.3%.
I picked out the days when trading volume exceeded twice the 90-day median. There were 19 in total: 16 fell in the first 30 days, and none in the most recent 30. The biggest was August 12, with 18.86M in volume—12.7 times the median—and a 26.63% drop that day.
The most recent 30 days were also down 32.0%, but the average daily range narrowed from 9.68% in the first 30 days to 6.69%, and the price closed higher on 14 of those 30 days. Prices kept falling while both volatility and volume shrank. On November 5, it even touched a 90-day low of 0.2043.
The data shows that the concentrated selling seen in August hasn’t returned; there are simply fewer buyers and sellers. No one rushing in doesn’t mean the bottom is in.
For spot traders, with volume this low, even dip-buying orders should be placed in batches. For futures traders, frequently reversing positions in a low-volume grind down can easily get you whipsawed.
The chart shows the closing price and daily trading volume. The first 30 days are shaded gray, and the most recent 30 days are shaded blue.
Which do you find harder to endure: a low-volume grind down or a high-volume crash?
6
·
--
Imagine someone named Ajie. He runs a print shop in a county town, usually checks crypto prices on his phone, and has only a few thousand yuan in his account.
On the evening of May 9, he saw $JASMY had risen 13.5% in a day. The comments were full of people saying it was "taking off." He held back for one night, then bought in at the market open on May 10, at 0.00743. The price peaked at 0.00783 that day, and he sent a screenshot to his wife, saying, "See? I do have a pretty good eye for this."
That screenshot would later turn out to show the highest point of the past six months.
The next day, May 11, the price briefly moved above his entry price, reaching a high of 0.00749. He thought it was only the beginning, so he stayed in.
What happened next was pretty ordinary. Most days, nothing much happened; the price just edged lower every few days. Ajie made a rule for himself: don't cut losses—wait until I'm back to even. By August 19, JASMY had fallen to a low of 0.0034, 54.2% below his entry price. He said that around then, he was so distracted he couldn't even bring himself to fix a paper jam in the printer.
On October 1, a big bullish candle appeared, with the price rising 12.6% in a day. The group chat sprang back to life, and Ajie was tempted too, thinking he might finally break even. But the price only reached a high of 0.00624 that day, still 16.0% below his entry price, and then continued to slide.
By the close on November 6, the price was 0.00369, and he was still down 50.3% on paper. To get back to 0.00743, it would have to rise 101.4% first.
Later, Ajie came to understand one thing: I wasn't confident in this project back then. I was confident in the fact that "it went up 13% yesterday."
Buying in the day after a big green candle means treating someone else's gains as your starting point. "Wait until I break even" sounds like a strategy, but really, it's just handing the decision over to the price.
Have you ever bought a position just because it had "gone up so much yesterday"?
Imagine someone named Ajie. He runs a print shop in a county town, usually checks crypto prices on his phone, and has only a few thousand yuan in his account.
On the evening of May 9, he saw $JASMY had risen 13.5% in a day. The comments were full of people saying it was "taking off." He held back for one night, then bought in at the market open on May 10, at 0.00743. The price peaked at 0.00783 that day, and he sent a screenshot to his wife, saying, "See? I do have a pretty good eye for this."
That screenshot would later turn out to show the highest point of the past six months.
The next day, May 11, the price briefly moved above his entry price, reaching a high of 0.00749. He thought it was only the beginning, so he stayed in.
What happened next was pretty ordinary. Most days, nothing much happened; the price just edged lower every few days. Ajie made a rule for himself: don't cut losses—wait until I'm back to even. By August 19, JASMY had fallen to a low of 0.0034, 54.2% below his entry price. He said that around then, he was so distracted he couldn't even bring himself to fix a paper jam in the printer.
On October 1, a big bullish candle appeared, with the price rising 12.6% in a day. The group chat sprang back to life, and Ajie was tempted too, thinking he might finally break even. But the price only reached a high of 0.00624 that day, still 16.0% below his entry price, and then continued to slide.
By the close on November 6, the price was 0.00369, and he was still down 50.3% on paper. To get back to 0.00743, it would have to rise 101.4% first.
Later, Ajie came to understand one thing: I wasn't confident in this project back then. I was confident in the fact that "it went up 13% yesterday."
Buying in the day after a big green candle means treating someone else's gains as your starting point. "Wait until I break even" sounds like a strategy, but really, it's just handing the decision over to the price.
Have you ever bought a position just because it had "gone up so much yesterday"?
On the evening of May 9, he saw $JASMY had risen 13.5% in a day. The comments were full of people saying it was "taking off." He held back for one night, then bought in at the market open on May 10, at 0.00743. The price peaked at 0.00783 that day, and he sent a screenshot to his wife, saying, "See? I do have a pretty good eye for this."
That screenshot would later turn out to show the highest point of the past six months.
The next day, May 11, the price briefly moved above his entry price, reaching a high of 0.00749. He thought it was only the beginning, so he stayed in.
What happened next was pretty ordinary. Most days, nothing much happened; the price just edged lower every few days. Ajie made a rule for himself: don't cut losses—wait until I'm back to even. By August 19, JASMY had fallen to a low of 0.0034, 54.2% below his entry price. He said that around then, he was so distracted he couldn't even bring himself to fix a paper jam in the printer.
On October 1, a big bullish candle appeared, with the price rising 12.6% in a day. The group chat sprang back to life, and Ajie was tempted too, thinking he might finally break even. But the price only reached a high of 0.00624 that day, still 16.0% below his entry price, and then continued to slide.
By the close on November 6, the price was 0.00369, and he was still down 50.3% on paper. To get back to 0.00743, it would have to rise 101.4% first.
Later, Ajie came to understand one thing: I wasn't confident in this project back then. I was confident in the fact that "it went up 13% yesterday."
Buying in the day after a big green candle means treating someone else's gains as your starting point. "Wait until I break even" sounds like a strategy, but really, it's just handing the decision over to the price.
Have you ever bought a position just because it had "gone up so much yesterday"?
11
·
--
A six-month look at $GMX daily candles: weekends aren't wilder—they're quieterPeople often say that order books for small-cap coins are thin on weekends, making them easy to pump or dump. I checked $GMX against the most recent 182 daily candles on Binance spot (using UTC days, from May 9 to November 6), and the results don't quite match that claim.
First, some background: Over the past six months, GMXUSDT rose from 7.47 to 8.14, up 9.0%. The low of 5.05 came on June 5, and the high of 9.33 on November 4—a difference of 84.8% from low to high. It has now pulled back 12.8% from that peak.
1. Lower trading volume on weekends
Of the 182 days, 52 were Saturdays or Sundays and 130 were weekdays. Average daily trading volume was about 270,000 USDT on weekends and about 303,000 USDT on weekdays, making weekend volume just 0.89 times weekday volume.
A six-month look at $GMX daily candles: weekends aren't wilder—they're quieter
People often say that order books for small-cap coins are thin on weekends, making them easy to pump or dump. I checked $GMX against the most recent 182 daily candles on Binance spot (using UTC days, from May 9 to November 6), and the results don't quite match that claim.
First, some background: Over the past six months, GMXUSDT rose from 7.47 to 8.14, up 9.0%. The low of 5.05 came on June 5, and the high of 9.33 on November 4—a difference of 84.8% from low to high. It has now pulled back 12.8% from that peak.
1. Lower trading volume on weekends
Of the 182 days, 52 were Saturdays or Sundays and 130 were weekdays. Average daily trading volume was about 270,000 USDT on weekends and about 303,000 USDT on weekdays, making weekend volume just 0.89 times weekday volume.
First, some background: Over the past six months, GMXUSDT rose from 7.47 to 8.14, up 9.0%. The low of 5.05 came on June 5, and the high of 9.33 on November 4—a difference of 84.8% from low to high. It has now pulled back 12.8% from that peak.
1. Lower trading volume on weekends
Of the 182 days, 52 were Saturdays or Sundays and 130 were weekdays. Average daily trading volume was about 270,000 USDT on weekends and about 303,000 USDT on weekdays, making weekend volume just 0.89 times weekday volume.
7
·
--
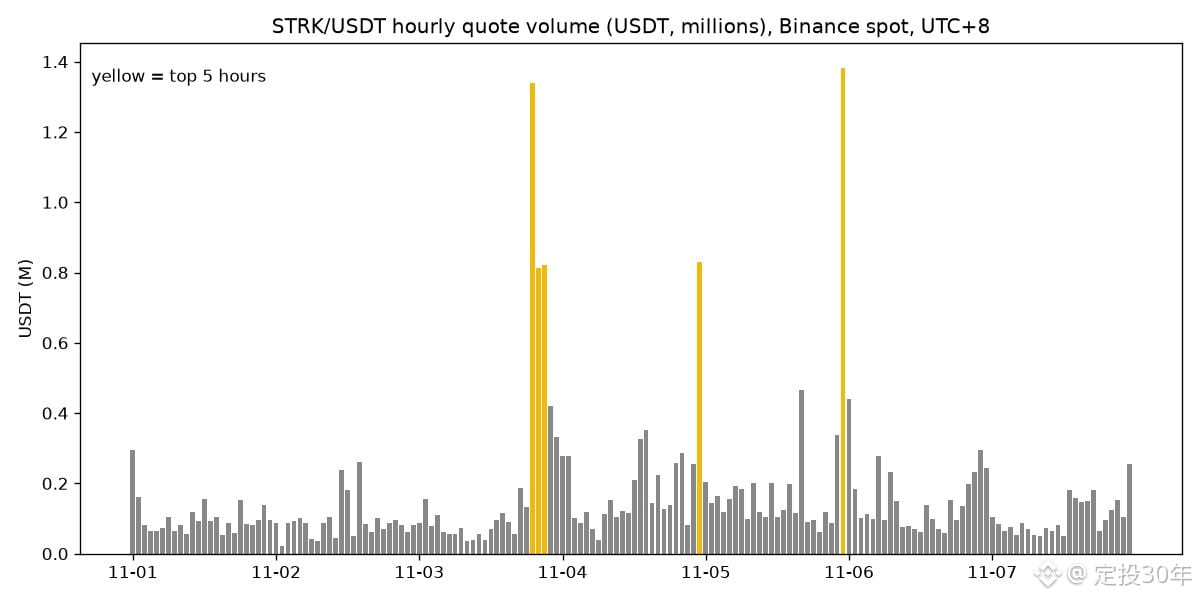
$STRK Last week (00:00 on November 1 to 00:00 on November 8, Beijing time; 168 hourly candles), about 26.1M USDT was traded on Binance spot in total. The price moved from 0.04578 to 0.04035, a drop of 11.9%.
I ranked the trading volume for each hour: the top five hours accounted for 19.9% of the week's total; the bottom 84 hours combined accounted for just 23.6%.
The two highest-volume candles: the hour at 23:00 on November 5 saw 1.38M traded, 13.5 times the median hourly volume for the week, and the price fell 7.05% that hour; at 19:00 on November 3, 1.34M was traded and the price rose 6.21%. One fell and one rose, with roughly similar volume.
There's another thing that can be misleading if you look only at averages. When you tally the busiest hours by time of day, the 23:00 slot accounts for 12.3% of the week's volume, making it look like a consistently active period. But 42.9% of that came from the single candle on November 5. Remove it, and 23:00 accounts for just 7.4%.
Trading in small-cap coins is highly concentrated. Order books are usually thin, and real volume comes in just a few hours. This week, the two hourly candles with the biggest price moves were also the two with the highest volume. If you're trading futures, don't rush to jump in with high leverage when volume surges.
When you look at small-cap coins, do you pay attention to hourly trading volume, or just the daily chart?
$STRK Last week (00:00 on November 1 to 00:00 on November 8, Beijing time; 168 hourly candles), about 26.1M USDT was traded on Binance spot in total. The price moved from 0.04578 to 0.04035, a drop of 11.9%.
I ranked the trading volume for each hour: the top five hours accounted for 19.9% of the week's total; the bottom 84 hours combined accounted for just 23.6%.
The two highest-volume candles: the hour at 23:00 on November 5 saw 1.38M traded, 13.5 times the median hourly volume for the week, and the price fell 7.05% that hour; at 19:00 on November 3, 1.34M was traded and the price rose 6.21%. One fell and one rose, with roughly similar volume.
There's another thing that can be misleading if you look only at averages. When you tally the busiest hours by time of day, the 23:00 slot accounts for 12.3% of the week's volume, making it look like a consistently active period. But 42.9% of that came from the single candle on November 5. Remove it, and 23:00 accounts for just 7.4%.
Trading in small-cap coins is highly concentrated. Order books are usually thin, and real volume comes in just a few hours. This week, the two hourly candles with the biggest price moves were also the two with the highest volume. If you're trading futures, don't rush to jump in with high leverage when volume surges.
When you look at small-cap coins, do you pay attention to hourly trading volume, or just the daily chart?
I ranked the trading volume for each hour: the top five hours accounted for 19.9% of the week's total; the bottom 84 hours combined accounted for just 23.6%.
The two highest-volume candles: the hour at 23:00 on November 5 saw 1.38M traded, 13.5 times the median hourly volume for the week, and the price fell 7.05% that hour; at 19:00 on November 3, 1.34M was traded and the price rose 6.21%. One fell and one rose, with roughly similar volume.
There's another thing that can be misleading if you look only at averages. When you tally the busiest hours by time of day, the 23:00 slot accounts for 12.3% of the week's volume, making it look like a consistently active period. But 42.9% of that came from the single candle on November 5. Remove it, and 23:00 accounts for just 7.4%.
Trading in small-cap coins is highly concentrated. Order books are usually thin, and real volume comes in just a few hours. This week, the two hourly candles with the biggest price moves were also the two with the highest volume. If you're trading futures, don't rush to jump in with high leverage when volume surges.
When you look at small-cap coins, do you pay attention to hourly trading volume, or just the daily chart?
23
·
--
Imagine a guy named Lao Zhou who runs a hardware store in a county town. There’s always a phone propped up by the cash register, showing the charts.
In early to mid-August, he kept an eye on $EIGEN for a while. For those 12 days from August 7 to 18, the daily closing price just drifted between 0.1669 and 0.1799. He told his wife, “Nobody wants this coin anymore.”
Then came three days in a row: +9.3% on August 19, +6.8% on the 20th, and +11.6% on the 21st. The closing price surged from 0.1687 to 0.2198—a 30.3% gain in three days. Lao Zhou rushed in just before the close on the third day, buying at 0.2198.
It started falling almost as soon as he bought. On August 25, it closed at 0.2054, putting him down 6.6% on paper. The more he watched, the more anxious he got, and that night he cut his losses.
A month later, it hurt even more. On September 27, it closed at 0.276, 25.6% above his purchase price, and had hit an intraday high of 0.2858. Those days, he couldn’t even be bothered to check the invoices for the stock coming into his store.
But that wasn’t the end of it. By November 6, EIGEN had closed at 0.1726—21.5% below what he paid, and 16.0% below the price at which he sold.
So, was Lao Zhou wrong or right to cut his losses? On August 25, it looked like he’d lost money. By the end of September, it looked like he’d made a foolish mistake. Looking back in November, it seemed he’d dodged a bullet. The same move can be judged very differently depending on when you look back. His real problem may have come earlier: after 12 days of sideways trading and a 30% surge over three days, he entered the market without having decided how long he planned to hold or at what price he’d get out if it fell.
Have you ever had a trade like that, where looking back, whether it was right or wrong keeps changing?
Imagine a guy named Lao Zhou who runs a hardware store in a county town. There’s always a phone propped up by the cash register, showing the charts.
In early to mid-August, he kept an eye on $EIGEN for a while. For those 12 days from August 7 to 18, the daily closing price just drifted between 0.1669 and 0.1799. He told his wife, “Nobody wants this coin anymore.”
Then came three days in a row: +9.3% on August 19, +6.8% on the 20th, and +11.6% on the 21st. The closing price surged from 0.1687 to 0.2198—a 30.3% gain in three days. Lao Zhou rushed in just before the close on the third day, buying at 0.2198.
It started falling almost as soon as he bought. On August 25, it closed at 0.2054, putting him down 6.6% on paper. The more he watched, the more anxious he got, and that night he cut his losses.
A month later, it hurt even more. On September 27, it closed at 0.276, 25.6% above his purchase price, and had hit an intraday high of 0.2858. Those days, he couldn’t even be bothered to check the invoices for the stock coming into his store.
But that wasn’t the end of it. By November 6, EIGEN had closed at 0.1726—21.5% below what he paid, and 16.0% below the price at which he sold.
So, was Lao Zhou wrong or right to cut his losses? On August 25, it looked like he’d lost money. By the end of September, it looked like he’d made a foolish mistake. Looking back in November, it seemed he’d dodged a bullet. The same move can be judged very differently depending on when you look back. His real problem may have come earlier: after 12 days of sideways trading and a 30% surge over three days, he entered the market without having decided how long he planned to hold or at what price he’d get out if it fell.
Have you ever had a trade like that, where looking back, whether it was right or wrong keeps changing?
In early to mid-August, he kept an eye on $EIGEN for a while. For those 12 days from August 7 to 18, the daily closing price just drifted between 0.1669 and 0.1799. He told his wife, “Nobody wants this coin anymore.”
Then came three days in a row: +9.3% on August 19, +6.8% on the 20th, and +11.6% on the 21st. The closing price surged from 0.1687 to 0.2198—a 30.3% gain in three days. Lao Zhou rushed in just before the close on the third day, buying at 0.2198.
It started falling almost as soon as he bought. On August 25, it closed at 0.2054, putting him down 6.6% on paper. The more he watched, the more anxious he got, and that night he cut his losses.
A month later, it hurt even more. On September 27, it closed at 0.276, 25.6% above his purchase price, and had hit an intraday high of 0.2858. Those days, he couldn’t even be bothered to check the invoices for the stock coming into his store.
But that wasn’t the end of it. By November 6, EIGEN had closed at 0.1726—21.5% below what he paid, and 16.0% below the price at which he sold.
So, was Lao Zhou wrong or right to cut his losses? On August 25, it looked like he’d lost money. By the end of September, it looked like he’d made a foolish mistake. Looking back in November, it seemed he’d dodged a bullet. The same move can be judged very differently depending on when you look back. His real problem may have come earlier: after 12 days of sideways trading and a 30% surge over three days, he entered the market without having decided how long he planned to hold or at what price he’d get out if it fell.
Have you ever had a trade like that, where looking back, whether it was right or wrong keeps changing?
3
·
--
ETHFI’s two big rallies and three pullbacks over the past six months, compared with ETH$ETHFI Over the last 180 days (May 11 to November 6, based on UTC daily closes), it went from 0.454 to 0.5831, up 28.4% overall. Over the same period, $ETH was down 4.3%. Looking at just these two figures, it’s easy to think ETHFI charted a course of its own.
Using closing prices, when I break it down into swings of more than 20% in either direction, a different picture emerges.
First, the drop: from May 11 to June 5, ETHFI fell from 0.454 to 0.287, down 36.8%; ETH fell 32.3% over the same period.
First rally: from June 5 to July 22, over 47 days, it rose from 0.287 to 0.4622, up 61.0%; ETH rose 22.2% over the same period.
Pullback: by August 4, it had fallen to 0.3562, down 22.9%; ETH was down just 3.3% over this stretch.
ETHFI’s two big rallies and three pullbacks over the past six months, compared with ETH
$ETHFI Over the last 180 days (May 11 to November 6, based on UTC daily closes), it went from 0.454 to 0.5831, up 28.4% overall. Over the same period, $ETH was down 4.3%. Looking at just these two figures, it’s easy to think ETHFI charted a course of its own.
Using closing prices, when I break it down into swings of more than 20% in either direction, a different picture emerges.
First, the drop: from May 11 to June 5, ETHFI fell from 0.454 to 0.287, down 36.8%; ETH fell 32.3% over the same period.
First rally: from June 5 to July 22, over 47 days, it rose from 0.287 to 0.4622, up 61.0%; ETH rose 22.2% over the same period.
Pullback: by August 4, it had fallen to 0.3562, down 22.9%; ETH was down just 3.3% over this stretch.
Using closing prices, when I break it down into swings of more than 20% in either direction, a different picture emerges.
First, the drop: from May 11 to June 5, ETHFI fell from 0.454 to 0.287, down 36.8%; ETH fell 32.3% over the same period.
First rally: from June 5 to July 22, over 47 days, it rose from 0.287 to 0.4622, up 61.0%; ETH rose 22.2% over the same period.
Pullback: by August 4, it had fallen to 0.3562, down 22.9%; ETH was down just 3.3% over this stretch.
131
·
--
$ZRO Over these 60 days (September 8 to November 6, on UTC daily candles), it rose from 1.136 to 1.637, a total gain of 44.1%. But looking at the candles one by one, only 29 days closed in the green—less than half.
I counted something more specific, too: on 33 days, the price surged more than 5% above the open intraday. Of those, 25 ended above the opening price, while the other 8 surged and then fell back, closing in the red.
Two of the clearest examples: on October 12, it was up 17.4% from the open at one point, but closed down 2.1%; on October 29, it first surged 5.8%, then closed down 10.5%.
So even with a coin that's gained more than 40% in two months, a sharp intraday rally doesn't necessarily hold. If you're trading spot and chase the spike, you could get stuck holding through a pullback on one of those 8 days. If you're trading futures, this kind of move—up first, then down—can easily liquidate positions on either side.
When you see a 5% intraday surge, do you usually chase it right away, or wait for the close?
$ZRO Over these 60 days (September 8 to November 6, on UTC daily candles), it rose from 1.136 to 1.637, a total gain of 44.1%. But looking at the candles one by one, only 29 days closed in the green—less than half.
I counted something more specific, too: on 33 days, the price surged more than 5% above the open intraday. Of those, 25 ended above the opening price, while the other 8 surged and then fell back, closing in the red.
Two of the clearest examples: on October 12, it was up 17.4% from the open at one point, but closed down 2.1%; on October 29, it first surged 5.8%, then closed down 10.5%.
So even with a coin that's gained more than 40% in two months, a sharp intraday rally doesn't necessarily hold. If you're trading spot and chase the spike, you could get stuck holding through a pullback on one of those 8 days. If you're trading futures, this kind of move—up first, then down—can easily liquidate positions on either side.
When you see a 5% intraday surge, do you usually chase it right away, or wait for the close?
I counted something more specific, too: on 33 days, the price surged more than 5% above the open intraday. Of those, 25 ended above the opening price, while the other 8 surged and then fell back, closing in the red.
Two of the clearest examples: on October 12, it was up 17.4% from the open at one point, but closed down 2.1%; on October 29, it first surged 5.8%, then closed down 10.5%.
So even with a coin that's gained more than 40% in two months, a sharp intraday rally doesn't necessarily hold. If you're trading spot and chase the spike, you could get stuck holding through a pullback on one of those 8 days. If you're trading futures, this kind of move—up first, then down—can easily liquidate positions on either side.
When you see a 5% intraday surge, do you usually chase it right away, or wait for the close?
12
·
--
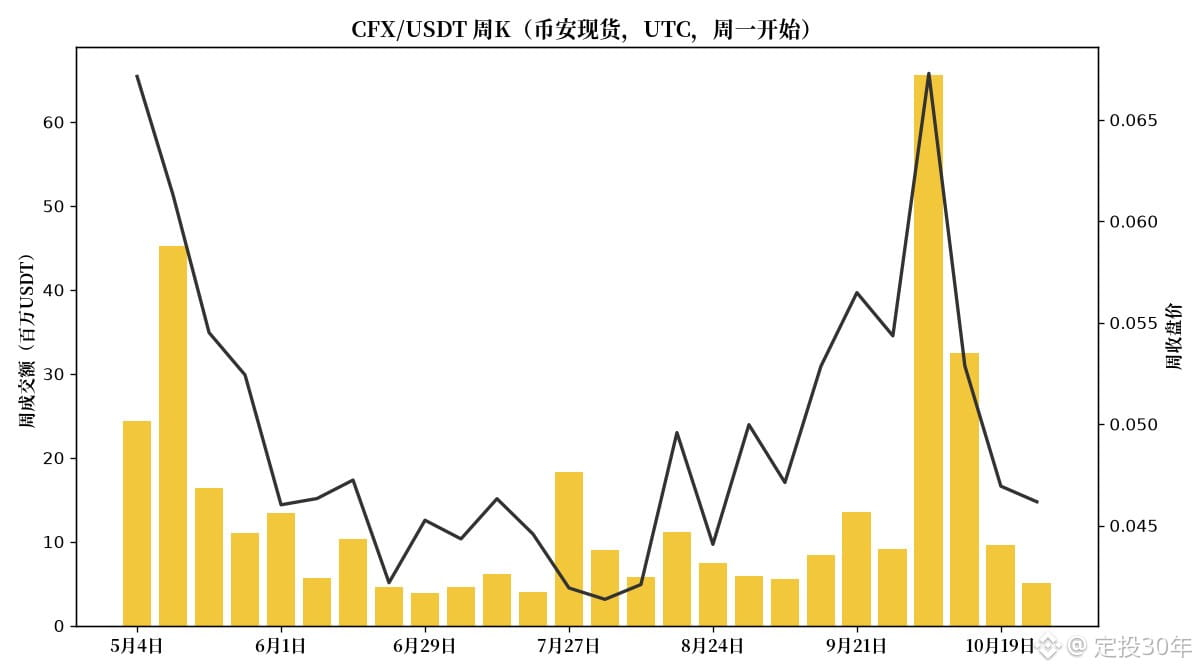
$CFX The week with the highest trading volume stands out in the last 26 complete weekly candlesticks (Binance spot, UTC, from the week of May 4 to the week of October 26).
In the week of October 5, CFX trading volume was about 65.6 million USDT, 7.2 times the 9.1 million median for those 26 weeks. The price peaked at 0.0728 intraday and closed at 0.06729, up 23.8% for the week.
The excitement didn't last long. The following week (starting October 12) closed down 21.4%, and the next two weeks also ended lower. By the close of the week of October 26, the price was 0.04617—31.4% below the close of the high-volume week, and even below that week's opening price of 0.05436.
The second-highest trading volume was in the week of May 11, at about 45.2 million. That week closed down 8.7%.
For spot traders, a high-volume bullish candle isn't necessarily the beginning of a rally; it may just be a concentrated shift in ownership, with those who chased the price getting caught over the following weeks. For futures traders, the speed of the pullback after a high-volume week is worth noting—it says more about the coin's volatility profile than the gain alone.
How long do you think a price needs to hold after a high-volume spike before you can say it's "found support"?
$CFX The week with the highest trading volume stands out in the last 26 complete weekly candlesticks (Binance spot, UTC, from the week of May 4 to the week of October 26).
In the week of October 5, CFX trading volume was about 65.6 million USDT, 7.2 times the 9.1 million median for those 26 weeks. The price peaked at 0.0728 intraday and closed at 0.06729, up 23.8% for the week.
The excitement didn't last long. The following week (starting October 12) closed down 21.4%, and the next two weeks also ended lower. By the close of the week of October 26, the price was 0.04617—31.4% below the close of the high-volume week, and even below that week's opening price of 0.05436.
The second-highest trading volume was in the week of May 11, at about 45.2 million. That week closed down 8.7%.
For spot traders, a high-volume bullish candle isn't necessarily the beginning of a rally; it may just be a concentrated shift in ownership, with those who chased the price getting caught over the following weeks. For futures traders, the speed of the pullback after a high-volume week is worth noting—it says more about the coin's volatility profile than the gain alone.
How long do you think a price needs to hold after a high-volume spike before you can say it's "found support"?
In the week of October 5, CFX trading volume was about 65.6 million USDT, 7.2 times the 9.1 million median for those 26 weeks. The price peaked at 0.0728 intraday and closed at 0.06729, up 23.8% for the week.
The excitement didn't last long. The following week (starting October 12) closed down 21.4%, and the next two weeks also ended lower. By the close of the week of October 26, the price was 0.04617—31.4% below the close of the high-volume week, and even below that week's opening price of 0.05436.
The second-highest trading volume was in the week of May 11, at about 45.2 million. That week closed down 8.7%.
For spot traders, a high-volume bullish candle isn't necessarily the beginning of a rally; it may just be a concentrated shift in ownership, with those who chased the price getting caught over the following weeks. For futures traders, the speed of the pullback after a high-volume week is worth noting—it says more about the coin's volatility profile than the gain alone.
How long do you think a price needs to hold after a high-volume spike before you can say it's "found support"?
25
·
--
Is TAO a buy-the-dip after 4+ consecutive down days? A look at six months of daily chartsMany people have a habit: when a coin falls for several days in a row, they think, “It’s fallen enough; it’s due for a rebound.” I tested this using the most recent 180 daily candles for $TAO on Binance Spot (UTC, May 11 to November 6).
Here, “consecutive down days” means consecutive days when the closing price was lower than the opening price. The statistics track price changes over the following 7 days, starting from the close on the last consecutive down day.
TAO had 7 instances of 4 or more consecutive down days in the past six months:
May 15 to May 19: 5 consecutive down days, for a cumulative decline of 15.6%; over the following 7 days, it rose 8.2%.
May 26 to May 29: 4 consecutive down days, for a cumulative decline of 10.5%; over the following 7 days, it fell 22.0%.
Is TAO a buy-the-dip after 4+ consecutive down days? A look at six months of daily charts
Many people have a habit: when a coin falls for several days in a row, they think, “It’s fallen enough; it’s due for a rebound.” I tested this using the most recent 180 daily candles for $TAO on Binance Spot (UTC, May 11 to November 6).
Here, “consecutive down days” means consecutive days when the closing price was lower than the opening price. The statistics track price changes over the following 7 days, starting from the close on the last consecutive down day.
TAO had 7 instances of 4 or more consecutive down days in the past six months:
May 15 to May 19: 5 consecutive down days, for a cumulative decline of 15.6%; over the following 7 days, it rose 8.2%.
May 26 to May 29: 4 consecutive down days, for a cumulative decline of 10.5%; over the following 7 days, it fell 22.0%.
Here, “consecutive down days” means consecutive days when the closing price was lower than the opening price. The statistics track price changes over the following 7 days, starting from the close on the last consecutive down day.
TAO had 7 instances of 4 or more consecutive down days in the past six months:
May 15 to May 19: 5 consecutive down days, for a cumulative decline of 15.6%; over the following 7 days, it rose 8.2%.
May 26 to May 29: 4 consecutive down days, for a cumulative decline of 10.5%; over the following 7 days, it fell 22.0%.
69
·
--
Suppose there’s someone named Xiaolin who works as a dispatcher at a logistics company. He often works night shifts and catches up on sleep during the day. This May, he set himself a rule: on the first of every month, use 100 USDT to buy $1INCH at that month’s opening price, then close the app as soon as the purchase is done.
His first purchase was at 0.0925, and the second at 0.0867. By the end of June, the price had closed at 0.0657. The 200 he’d invested was worth only about 146.8, an unrealized loss of 26.6%. After a night shift that day, he nearly deleted the plan while riding the bus, but in the end he left it alone.
His July 1 purchase was at 0.0657, the cheapest of the past six months. August: 0.0813. September: 0.0887. By the end of September, the closing price was 0.1014. He’d invested 500 across five purchases, and his holdings were worth about 620.0—a gain of 24.0%. For the first time, he felt pretty patient.
The turning point came in October. His October 1 purchase was at exactly 0.1014, the most expensive of the six. The price then fell over the next month. By the November 6 close, at 0.0781, his six purchases totaling 600 were worth about 554.5, putting him back in the red by 7.6%. His average cost was around 0.0845, well above the current price.
Xiaolin eventually realized something: dollar-cost averaging can smooth out your purchase price, but it can’t erase the impact of those last few purchases made at higher prices, nor does it guarantee that you’ll be in profit whenever you check your account. That 24.0% gain at the end of September was just a number on that day—not money in the bank.
If it were you, when your holdings showed a gain of over 20% at the end of September, would you have stopped, sold some, or kept buying as usual?
Suppose there’s someone named Xiaolin who works as a dispatcher at a logistics company. He often works night shifts and catches up on sleep during the day. This May, he set himself a rule: on the first of every month, use 100 USDT to buy $1INCH at that month’s opening price, then close the app as soon as the purchase is done.
His first purchase was at 0.0925, and the second at 0.0867. By the end of June, the price had closed at 0.0657. The 200 he’d invested was worth only about 146.8, an unrealized loss of 26.6%. After a night shift that day, he nearly deleted the plan while riding the bus, but in the end he left it alone.
His July 1 purchase was at 0.0657, the cheapest of the past six months. August: 0.0813. September: 0.0887. By the end of September, the closing price was 0.1014. He’d invested 500 across five purchases, and his holdings were worth about 620.0—a gain of 24.0%. For the first time, he felt pretty patient.
The turning point came in October. His October 1 purchase was at exactly 0.1014, the most expensive of the six. The price then fell over the next month. By the November 6 close, at 0.0781, his six purchases totaling 600 were worth about 554.5, putting him back in the red by 7.6%. His average cost was around 0.0845, well above the current price.
Xiaolin eventually realized something: dollar-cost averaging can smooth out your purchase price, but it can’t erase the impact of those last few purchases made at higher prices, nor does it guarantee that you’ll be in profit whenever you check your account. That 24.0% gain at the end of September was just a number on that day—not money in the bank.
If it were you, when your holdings showed a gain of over 20% at the end of September, would you have stopped, sold some, or kept buying as usual?
His first purchase was at 0.0925, and the second at 0.0867. By the end of June, the price had closed at 0.0657. The 200 he’d invested was worth only about 146.8, an unrealized loss of 26.6%. After a night shift that day, he nearly deleted the plan while riding the bus, but in the end he left it alone.
His July 1 purchase was at 0.0657, the cheapest of the past six months. August: 0.0813. September: 0.0887. By the end of September, the closing price was 0.1014. He’d invested 500 across five purchases, and his holdings were worth about 620.0—a gain of 24.0%. For the first time, he felt pretty patient.
The turning point came in October. His October 1 purchase was at exactly 0.1014, the most expensive of the six. The price then fell over the next month. By the November 6 close, at 0.0781, his six purchases totaling 600 were worth about 554.5, putting him back in the red by 7.6%. His average cost was around 0.0845, well above the current price.
Xiaolin eventually realized something: dollar-cost averaging can smooth out your purchase price, but it can’t erase the impact of those last few purchases made at higher prices, nor does it guarantee that you’ll be in profit whenever you check your account. That 24.0% gain at the end of September was just a number on that day—not money in the bank.
If it were you, when your holdings showed a gain of over 20% at the end of September, would you have stopped, sold some, or kept buying as usual?
17
·
--
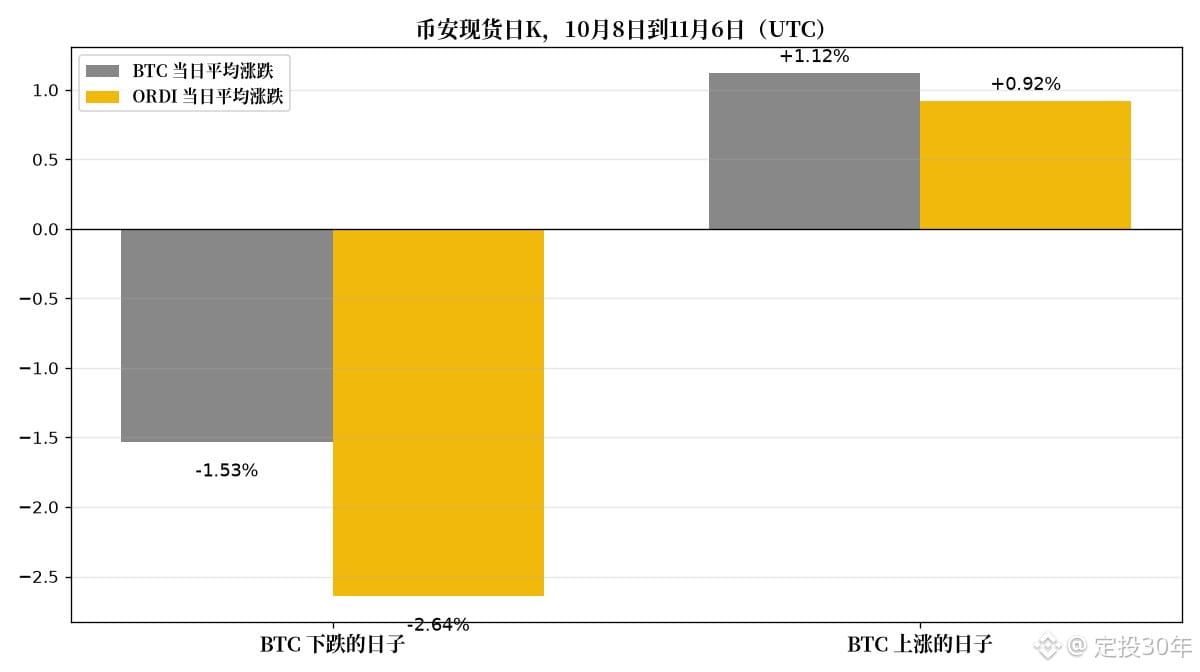
Looking at the most recent 30 daily candles for $ORDI and $BTC (Binance spot, UTC, October 8 to November 6), split by whether BTC closed up or down that day, the results are quite asymmetric.
BTC closed down on 16 of those 30 days. On 12 of those days, ORDI also closed down, and on 11 days it fell more than BTC. On average, BTC fell 1.53% per day, while ORDI fell 2.64%.
On the 14 days BTC closed up, ORDI also closed up on 10 of them, but it outperformed BTC on only 7 days. On average, BTC rose 1.12% per day, while ORDI rose just 0.92%.
It falls more when prices are down and rises less when they’re up. Over the full 30 days, ORDI dropped 27.1%, from 4.515 to 3.292, while BTC fell 9.0% over the same period.
If you’re trading spot, don’t use “high beta” as your only reason to buy. During this period, its volatility mostly showed up on the downside. If you’re trading futures, betting on a BTC rebound with ORDI in this kind of market structure has been a losing proposition on average. Whether ORDI can start outperforming on days when BTC rises is more worth watching than price alone.
Do you think this asymmetry will persist?
Looking at the most recent 30 daily candles for $ORDI and $BTC (Binance spot, UTC, October 8 to November 6), split by whether BTC closed up or down that day, the results are quite asymmetric.
BTC closed down on 16 of those 30 days. On 12 of those days, ORDI also closed down, and on 11 days it fell more than BTC. On average, BTC fell 1.53% per day, while ORDI fell 2.64%.
On the 14 days BTC closed up, ORDI also closed up on 10 of them, but it outperformed BTC on only 7 days. On average, BTC rose 1.12% per day, while ORDI rose just 0.92%.
It falls more when prices are down and rises less when they’re up. Over the full 30 days, ORDI dropped 27.1%, from 4.515 to 3.292, while BTC fell 9.0% over the same period.
If you’re trading spot, don’t use “high beta” as your only reason to buy. During this period, its volatility mostly showed up on the downside. If you’re trading futures, betting on a BTC rebound with ORDI in this kind of market structure has been a losing proposition on average. Whether ORDI can start outperforming on days when BTC rises is more worth watching than price alone.
Do you think this asymmetry will persist?
BTC closed down on 16 of those 30 days. On 12 of those days, ORDI also closed down, and on 11 days it fell more than BTC. On average, BTC fell 1.53% per day, while ORDI fell 2.64%.
On the 14 days BTC closed up, ORDI also closed up on 10 of them, but it outperformed BTC on only 7 days. On average, BTC rose 1.12% per day, while ORDI rose just 0.92%.
It falls more when prices are down and rises less when they’re up. Over the full 30 days, ORDI dropped 27.1%, from 4.515 to 3.292, while BTC fell 9.0% over the same period.
If you’re trading spot, don’t use “high beta” as your only reason to buy. During this period, its volatility mostly showed up on the downside. If you’re trading futures, betting on a BTC rebound with ORDI in this kind of market structure has been a losing proposition on average. Whether ORDI can start outperforming on days when BTC rises is more worth watching than price alone.
Do you think this asymmetry will persist?
342
·
--
IOTA’s monthly candles over the past year: only 3 of 12 months closed higherLooking at the monthly candlesticks for $IOTA on Binance spot, there are 12 complete monthly candles from November 2025 to October 2026.
The conclusion first: only 3 of these 12 months closed higher—May, August, and September. It opened at 0.1375 in November 2025 and closed at 0.0397 in October 2026, down 71.1% overall.
But it didn’t decline steadily throughout the year. There were two moments when it really looked like it was "about to take off."
The first was in January 2026. It opened that month at 0.0809 and surged to an intramonth high of 0.1369, 69.2% above the start of the month. But it closed at 0.0733, meaning it actually fell 9.4% for the month. If you’d checked the price only midway through the month, it would have been easy to think the trend had changed.
IOTA’s monthly candles over the past year: only 3 of 12 months closed higher
Looking at the monthly candlesticks for $IOTA on Binance spot, there are 12 complete monthly candles from November 2025 to October 2026.
The conclusion first: only 3 of these 12 months closed higher—May, August, and September. It opened at 0.1375 in November 2025 and closed at 0.0397 in October 2026, down 71.1% overall.
But it didn’t decline steadily throughout the year. There were two moments when it really looked like it was "about to take off."
The first was in January 2026. It opened that month at 0.0809 and surged to an intramonth high of 0.1369, 69.2% above the start of the month. But it closed at 0.0733, meaning it actually fell 9.4% for the month. If you’d checked the price only midway through the month, it would have been easy to think the trend had changed.
The conclusion first: only 3 of these 12 months closed higher—May, August, and September. It opened at 0.1375 in November 2025 and closed at 0.0397 in October 2026, down 71.1% overall.
But it didn’t decline steadily throughout the year. There were two moments when it really looked like it was "about to take off."
The first was in January 2026. It opened that month at 0.0809 and surged to an intramonth high of 0.1369, 69.2% above the start of the month. But it closed at 0.0733, meaning it actually fell 9.4% for the month. If you’d checked the price only midway through the month, it would have been easy to think the trend had changed.
13
·
--
$KSM is Polkadot’s canary network, and many people assume it’s simply “a scaled-up version of $DOT.” I checked Binance spot data for the latest 60 daily candles (UTC, September 8 to November 6), and the picture isn’t quite that simple.
Over those 60 days, KSM fell from 3.97 to 3.33, down 16.1%; DOT fell from 1.062 to 0.913, down 14.0%. Overall, KSM fell only a little more.
But the path was different. Based on closing prices, here’s how many DOT you could get for 1 KSM: about 3.33 on September 8, the lowest during this period; about 4.46 on October 2, the highest; and back down to about 3.65 by November 6. In other words, KSM had a period when it significantly outperformed DOT, but later gave back most of those gains.
Looking at the daily moves, the two moved in the same direction on 41 days, and KSM outperformed DOT on 30 days—exactly half the time.
My take is that KSM and DOT generally move up and down together, but KSM shouldn’t be treated as a stable “leveraged version” of DOT. If you use KSM to bet on DOT’s greater upside potential, you have to accept that KSM may also underperform DOT over certain periods. For spot trading, watching the ratio is more useful than looking at price alone; for futures, don’t assume the two will hedge each other perfectly.
Would you treat KSM as a substitute for DOT, or view it as a separate asset?
$KSM is Polkadot’s canary network, and many people assume it’s simply “a scaled-up version of $DOT .” I checked Binance spot data for the latest 60 daily candles (UTC, September 8 to November 6), and the picture isn’t quite that simple.
Over those 60 days, KSM fell from 3.97 to 3.33, down 16.1%; DOT fell from 1.062 to 0.913, down 14.0%. Overall, KSM fell only a little more.
But the path was different. Based on closing prices, here’s how many DOT you could get for 1 KSM: about 3.33 on September 8, the lowest during this period; about 4.46 on October 2, the highest; and back down to about 3.65 by November 6. In other words, KSM had a period when it significantly outperformed DOT, but later gave back most of those gains.
Looking at the daily moves, the two moved in the same direction on 41 days, and KSM outperformed DOT on 30 days—exactly half the time.
My take is that KSM and DOT generally move up and down together, but KSM shouldn’t be treated as a stable “leveraged version” of DOT. If you use KSM to bet on DOT’s greater upside potential, you have to accept that KSM may also underperform DOT over certain periods. For spot trading, watching the ratio is more useful than looking at price alone; for futures, don’t assume the two will hedge each other perfectly.
Would you treat KSM as a substitute for DOT, or view it as a separate asset?
Over those 60 days, KSM fell from 3.97 to 3.33, down 16.1%; DOT fell from 1.062 to 0.913, down 14.0%. Overall, KSM fell only a little more.
But the path was different. Based on closing prices, here’s how many DOT you could get for 1 KSM: about 3.33 on September 8, the lowest during this period; about 4.46 on October 2, the highest; and back down to about 3.65 by November 6. In other words, KSM had a period when it significantly outperformed DOT, but later gave back most of those gains.
Looking at the daily moves, the two moved in the same direction on 41 days, and KSM outperformed DOT on 30 days—exactly half the time.
My take is that KSM and DOT generally move up and down together, but KSM shouldn’t be treated as a stable “leveraged version” of DOT. If you use KSM to bet on DOT’s greater upside potential, you have to accept that KSM may also underperform DOT over certain periods. For spot trading, watching the ratio is more useful than looking at price alone; for futures, don’t assume the two will hedge each other perfectly.
Would you treat KSM as a substitute for DOT, or view it as a separate asset?
100
·
--
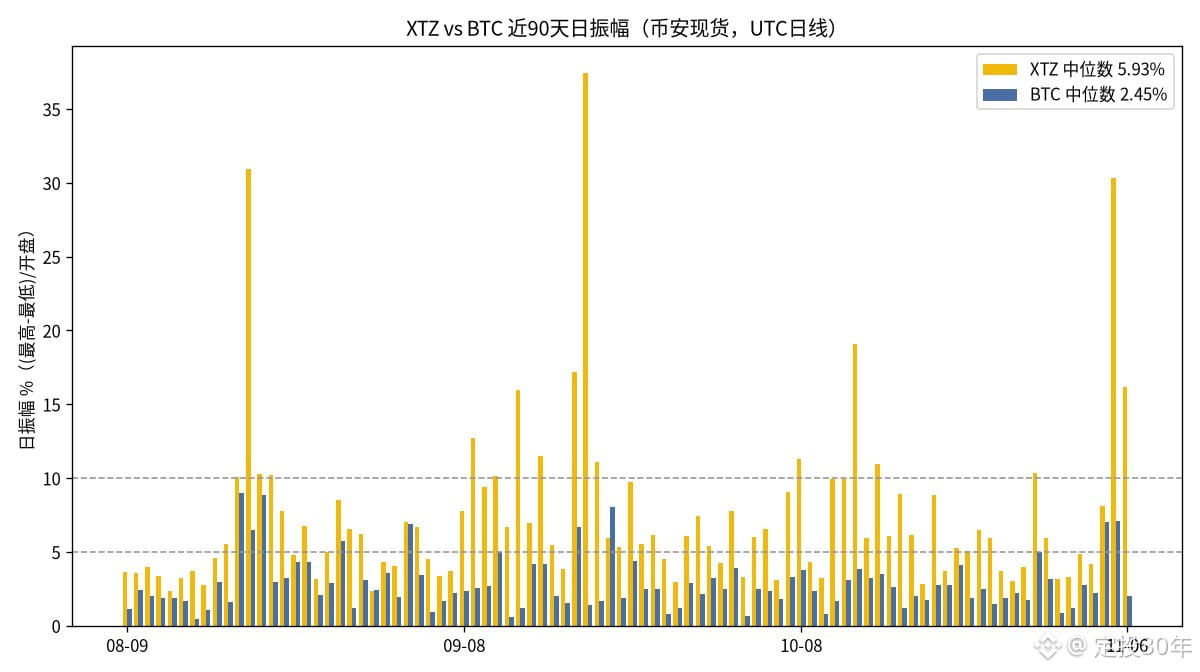
I compared the daily candlesticks for $XTZ and $BTC over the past 90 days (Binance spot, UTC daily candles, August 9 to November 6), looking at each day’s range—that is, the day’s high minus its low, divided by the opening price.
XTZ’s median daily range was about 5.93%, compared with about 2.45% for BTC.
Over the 90 days, XTZ had 55 days with a range above 5% and 18 days above 10%. BTC had only 10 days above 5%, and not a single day above 10%. BTC’s largest daily range during this period was about 9.0%.
XTZ’s biggest daily range was on September 19, at about 37.4%. That day, it opened at 0.2954, reached a high of 0.4025, fell to a low of 0.292, and closed at 0.3671.
Comparing the two day by day, XTZ’s range was smaller than BTC’s on only 2 of the 90 days. Taking the median of the daily range ratios, XTZ’s was about 2.37 times BTC’s.
This means different things to different people. For spot traders, an XTZ daily swing of around 5.93% is normal, so don’t assume something major has happened just because you see a long candlestick. For futures traders, the same stop-loss distance might rarely be hit on BTC, but could be hit several times in a week on XTZ. It’s best to adjust leverage inversely to the range.
How much wider do you set your stop-losses for altcoins compared with BTC?
Data from the public Binance Spot XTZUSDT and BTCUSDT daily candlestick API. Data retrieved on November 8, 2026, at 04:12 Beijing time. Not investment advice.
I compared the daily candlesticks for $XTZ and $BTC over the past 90 days (Binance spot, UTC daily candles, August 9 to November 6), looking at each day’s range—that is, the day’s high minus its low, divided by the opening price.
XTZ’s median daily range was about 5.93%, compared with about 2.45% for BTC.
Over the 90 days, XTZ had 55 days with a range above 5% and 18 days above 10%. BTC had only 10 days above 5%, and not a single day above 10%. BTC’s largest daily range during this period was about 9.0%.
XTZ’s biggest daily range was on September 19, at about 37.4%. That day, it opened at 0.2954, reached a high of 0.4025, fell to a low of 0.292, and closed at 0.3671.
Comparing the two day by day, XTZ’s range was smaller than BTC’s on only 2 of the 90 days. Taking the median of the daily range ratios, XTZ’s was about 2.37 times BTC’s.
This means different things to different people. For spot traders, an XTZ daily swing of around 5.93% is normal, so don’t assume something major has happened just because you see a long candlestick. For futures traders, the same stop-loss distance might rarely be hit on BTC, but could be hit several times in a week on XTZ. It’s best to adjust leverage inversely to the range.
How much wider do you set your stop-losses for altcoins compared with BTC?
Data from the public Binance Spot XTZUSDT and BTCUSDT daily candlestick API. Data retrieved on November 8, 2026, at 04:12 Beijing time. Not investment advice.
XTZ’s median daily range was about 5.93%, compared with about 2.45% for BTC.
Over the 90 days, XTZ had 55 days with a range above 5% and 18 days above 10%. BTC had only 10 days above 5%, and not a single day above 10%. BTC’s largest daily range during this period was about 9.0%.
XTZ’s biggest daily range was on September 19, at about 37.4%. That day, it opened at 0.2954, reached a high of 0.4025, fell to a low of 0.292, and closed at 0.3671.
Comparing the two day by day, XTZ’s range was smaller than BTC’s on only 2 of the 90 days. Taking the median of the daily range ratios, XTZ’s was about 2.37 times BTC’s.
This means different things to different people. For spot traders, an XTZ daily swing of around 5.93% is normal, so don’t assume something major has happened just because you see a long candlestick. For futures traders, the same stop-loss distance might rarely be hit on BTC, but could be hit several times in a week on XTZ. It’s best to adjust leverage inversely to the range.
How much wider do you set your stop-losses for altcoins compared with BTC?
Data from the public Binance Spot XTZUSDT and BTCUSDT daily candlestick API. Data retrieved on November 8, 2026, at 04:12 Beijing time. Not investment advice.
183
·
--
Suppose there’s someone named Ajie who doesn’t usually pay much attention to the charts.
On September 21, he came across $FLOKI and saw it had risen 12.7% in one day. The next day, he couldn’t resist buying a little. Let’s say his purchase price was the September 22 closing price: 0.00003032 USDT.
The day after he bought, on September 23, the price reached an intraday high of 0.00003092, so he was already up a little. But he didn’t sell, thinking it could go even higher. That day, FLOKI closed down 10.2%.
After that, Ajie made himself a rule: he’d sell once the price got back to his entry price. As long as he didn’t lose money, that was enough.
Over the next two weeks, it nearly happened. On October 5, the price reached a high of 0.00003000; on October 6, it hit 0.00003030—just 0.07% short of his entry price.
Those two days, he was probably staring at the screen thinking: just a little more and I’ll be free. But on October 6, it closed at 0.00002867. From September 24 to November 6, the October 6 daily candlestick marked the highest point; the price never returned to that level afterward.
By the November 6 close, FLOKI was at 0.00002165, about 28.6% below his entry price.
The hardest part of this story wasn’t the sharp drop that day, but the two lines: the small profit he didn’t take on September 23, and the break-even line he missed by 0.07% on October 6. Just missing it and missing it by a lot lead to the same result.
If it were you, would you set your break-even point at your entry price, or give it some leeway?
Prices are from Binance spot FLOKIUSDT daily candlesticks (UTC daily chart), retrieved at 03:54 Beijing time on November 8, 2026. The person is hypothetical. This is not investment advice.
Suppose there’s someone named Ajie who doesn’t usually pay much attention to the charts.
On September 21, he came across $FLOKI and saw it had risen 12.7% in one day. The next day, he couldn’t resist buying a little. Let’s say his purchase price was the September 22 closing price: 0.00003032 USDT.
The day after he bought, on September 23, the price reached an intraday high of 0.00003092, so he was already up a little. But he didn’t sell, thinking it could go even higher. That day, FLOKI closed down 10.2%.
After that, Ajie made himself a rule: he’d sell once the price got back to his entry price. As long as he didn’t lose money, that was enough.
Over the next two weeks, it nearly happened. On October 5, the price reached a high of 0.00003000; on October 6, it hit 0.00003030—just 0.07% short of his entry price.
Those two days, he was probably staring at the screen thinking: just a little more and I’ll be free. But on October 6, it closed at 0.00002867. From September 24 to November 6, the October 6 daily candlestick marked the highest point; the price never returned to that level afterward.
By the November 6 close, FLOKI was at 0.00002165, about 28.6% below his entry price.
The hardest part of this story wasn’t the sharp drop that day, but the two lines: the small profit he didn’t take on September 23, and the break-even line he missed by 0.07% on October 6. Just missing it and missing it by a lot lead to the same result.
If it were you, would you set your break-even point at your entry price, or give it some leeway?
Prices are from Binance spot FLOKIUSDT daily candlesticks (UTC daily chart), retrieved at 03:54 Beijing time on November 8, 2026. The person is hypothetical. This is not investment advice.
On September 21, he came across $FLOKI and saw it had risen 12.7% in one day. The next day, he couldn’t resist buying a little. Let’s say his purchase price was the September 22 closing price: 0.00003032 USDT.
The day after he bought, on September 23, the price reached an intraday high of 0.00003092, so he was already up a little. But he didn’t sell, thinking it could go even higher. That day, FLOKI closed down 10.2%.
After that, Ajie made himself a rule: he’d sell once the price got back to his entry price. As long as he didn’t lose money, that was enough.
Over the next two weeks, it nearly happened. On October 5, the price reached a high of 0.00003000; on October 6, it hit 0.00003030—just 0.07% short of his entry price.
Those two days, he was probably staring at the screen thinking: just a little more and I’ll be free. But on October 6, it closed at 0.00002867. From September 24 to November 6, the October 6 daily candlestick marked the highest point; the price never returned to that level afterward.
By the November 6 close, FLOKI was at 0.00002165, about 28.6% below his entry price.
The hardest part of this story wasn’t the sharp drop that day, but the two lines: the small profit he didn’t take on September 23, and the break-even line he missed by 0.07% on October 6. Just missing it and missing it by a lot lead to the same result.
If it were you, would you set your break-even point at your entry price, or give it some leeway?
Prices are from Binance spot FLOKIUSDT daily candlesticks (UTC daily chart), retrieved at 03:54 Beijing time on November 8, 2026. The person is hypothetical. This is not investment advice.
53
·
--
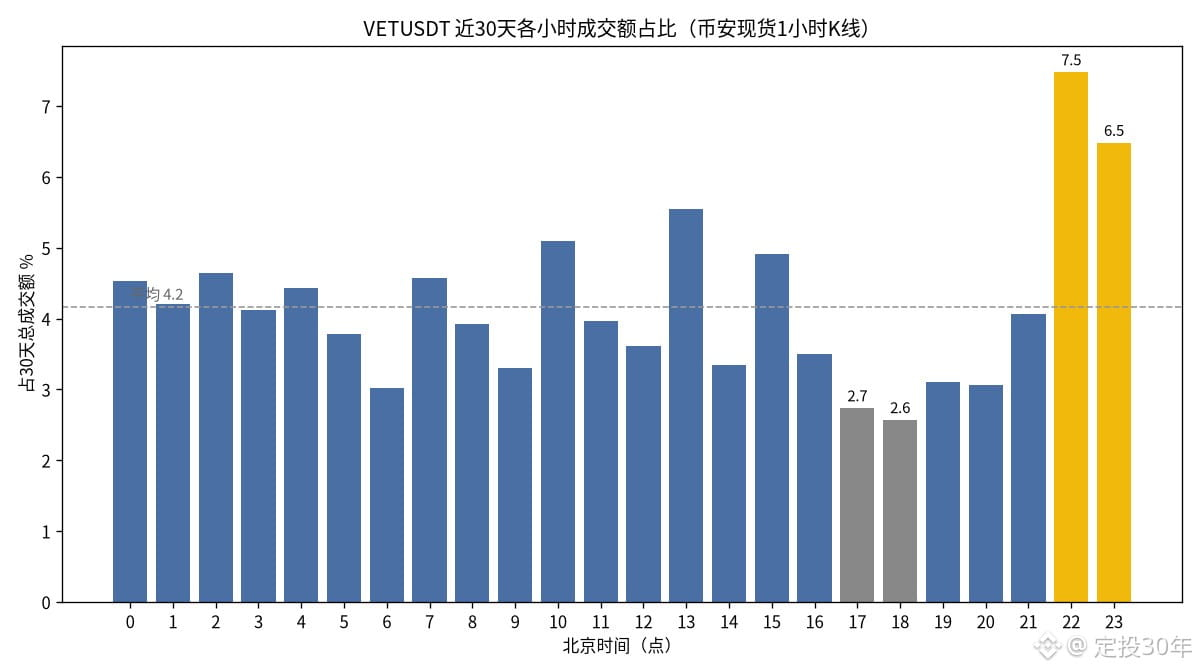
$VET When is the busiest time of day? I broke down the last 30 days of Binance spot VETUSDT 1-hour candles—720 in total—by Beijing time.
Trading volume was most concentrated during the 10 p.m. hour, which accounted for 7.5% of the total over the 30 days. The 11 p.m. hour followed at 6.5%. Together, those two hours made up 14.0%—about 1.7 times the average (around 4.2% per hour across 24 hours).
The quietest period was early evening: 6 p.m. accounted for just 2.6%, and 5 p.m. for 2.7%.
To make sure one or two days of major market moves weren’t skewing the results, I also checked the median: the median trading volume during the 10 p.m. hour was about 59K USDT, compared with about 25K at 6 p.m. The former was still around 2.4 times the latter, so the difference wasn’t driven by a single high-volume day.
Volatility followed a similar pattern. The average hourly range was about 1.88% at 10 p.m., compared with about 0.92% at 6 p.m.
Around 10 p.m. Beijing time, the U.S. stock market also opens. Liquidity tends to be better during this period, but prices are also more prone to swings. If you place limit orders or set stop-losses, you may want to keep a closer eye on this time of day.
What time do you usually watch the market?
Data is from Binance spot VETUSDT’s public 1-hour candlestick API. The analysis covers October 9, 2026, 03:00 to November 8, 2026, 03:00, Beijing time. Data retrieved at 03:42 Beijing time. Not investment advice.
$VET When is the busiest time of day? I broke down the last 30 days of Binance spot VETUSDT 1-hour candles—720 in total—by Beijing time.
Trading volume was most concentrated during the 10 p.m. hour, which accounted for 7.5% of the total over the 30 days. The 11 p.m. hour followed at 6.5%. Together, those two hours made up 14.0%—about 1.7 times the average (around 4.2% per hour across 24 hours).
The quietest period was early evening: 6 p.m. accounted for just 2.6%, and 5 p.m. for 2.7%.
To make sure one or two days of major market moves weren’t skewing the results, I also checked the median: the median trading volume during the 10 p.m. hour was about 59K USDT, compared with about 25K at 6 p.m. The former was still around 2.4 times the latter, so the difference wasn’t driven by a single high-volume day.
Volatility followed a similar pattern. The average hourly range was about 1.88% at 10 p.m., compared with about 0.92% at 6 p.m.
Around 10 p.m. Beijing time, the U.S. stock market also opens. Liquidity tends to be better during this period, but prices are also more prone to swings. If you place limit orders or set stop-losses, you may want to keep a closer eye on this time of day.
What time do you usually watch the market?
Data is from Binance spot VETUSDT’s public 1-hour candlestick API. The analysis covers October 9, 2026, 03:00 to November 8, 2026, 03:00, Beijing time. Data retrieved at 03:42 Beijing time. Not investment advice.
Trading volume was most concentrated during the 10 p.m. hour, which accounted for 7.5% of the total over the 30 days. The 11 p.m. hour followed at 6.5%. Together, those two hours made up 14.0%—about 1.7 times the average (around 4.2% per hour across 24 hours).
The quietest period was early evening: 6 p.m. accounted for just 2.6%, and 5 p.m. for 2.7%.
To make sure one or two days of major market moves weren’t skewing the results, I also checked the median: the median trading volume during the 10 p.m. hour was about 59K USDT, compared with about 25K at 6 p.m. The former was still around 2.4 times the latter, so the difference wasn’t driven by a single high-volume day.
Volatility followed a similar pattern. The average hourly range was about 1.88% at 10 p.m., compared with about 0.92% at 6 p.m.
Around 10 p.m. Beijing time, the U.S. stock market also opens. Liquidity tends to be better during this period, but prices are also more prone to swings. If you place limit orders or set stop-losses, you may want to keep a closer eye on this time of day.
What time do you usually watch the market?
Data is from Binance spot VETUSDT’s public 1-hour candlestick API. The analysis covers October 9, 2026, 03:00 to November 8, 2026, 03:00, Beijing time. Data retrieved at 03:42 Beijing time. Not investment advice.
21
·
--
$BONK is down 60.6% over the past six months, but if you look only at weekends, it has barely fallen.
I split the 182 most recent complete daily candles for Binance BONK/USDT (May 9 to November 6, UTC) by day of the week. I counted only each day’s change from open to close, then compounded the returns for each group of days:
Saturday and Sunday totaled 52 days, with 24 up days, for a compounded return of -2.9%.
Monday through Friday totaled 130 days, with 55 up days, for a compounded return of -57.8%.
Looking at the days individually, Tuesday was the worst: only 8 of 26 Tuesdays were up, for a compounded return of -34.3%. Friday, on the other hand, was up 14 times out of 26, for a compounded return of +21.7%. Sunday was also up, at +11.6%.
This doesn’t mean you can make money by buying on weekends. There are only a couple dozen observations over six months, and the pattern could easily be completely different over another six months. Plus, gaps between daily candles aren’t included.
But it does at least point to one thing: BONK’s losses over the past six months mostly happened on weekdays. For futures traders, the pattern of Tuesdays closing lower most of the time can be more draining than a single-day crash. If you’re holding spot, rather than watching weekend price action, it may be worth considering whether you can stomach the slow weekday decline.
Have you noticed a similar pattern with any coins you often trade—where a particular day of the week is especially rough?
Data: Binance BONK/USDT daily candles, retrieved shortly after 3 a.m. Beijing time on November 8.
$BONK is down 60.6% over the past six months, but if you look only at weekends, it has barely fallen.
I split the 182 most recent complete daily candles for Binance BONK/USDT (May 9 to November 6, UTC) by day of the week. I counted only each day’s change from open to close, then compounded the returns for each group of days:
Saturday and Sunday totaled 52 days, with 24 up days, for a compounded return of -2.9%.
Monday through Friday totaled 130 days, with 55 up days, for a compounded return of -57.8%.
Looking at the days individually, Tuesday was the worst: only 8 of 26 Tuesdays were up, for a compounded return of -34.3%. Friday, on the other hand, was up 14 times out of 26, for a compounded return of +21.7%. Sunday was also up, at +11.6%.
This doesn’t mean you can make money by buying on weekends. There are only a couple dozen observations over six months, and the pattern could easily be completely different over another six months. Plus, gaps between daily candles aren’t included.
But it does at least point to one thing: BONK’s losses over the past six months mostly happened on weekdays. For futures traders, the pattern of Tuesdays closing lower most of the time can be more draining than a single-day crash. If you’re holding spot, rather than watching weekend price action, it may be worth considering whether you can stomach the slow weekday decline.
Have you noticed a similar pattern with any coins you often trade—where a particular day of the week is especially rough?
Data: Binance BONK/USDT daily candles, retrieved shortly after 3 a.m. Beijing time on November 8.
I split the 182 most recent complete daily candles for Binance BONK/USDT (May 9 to November 6, UTC) by day of the week. I counted only each day’s change from open to close, then compounded the returns for each group of days:
Saturday and Sunday totaled 52 days, with 24 up days, for a compounded return of -2.9%.
Monday through Friday totaled 130 days, with 55 up days, for a compounded return of -57.8%.
Looking at the days individually, Tuesday was the worst: only 8 of 26 Tuesdays were up, for a compounded return of -34.3%. Friday, on the other hand, was up 14 times out of 26, for a compounded return of +21.7%. Sunday was also up, at +11.6%.
This doesn’t mean you can make money by buying on weekends. There are only a couple dozen observations over six months, and the pattern could easily be completely different over another six months. Plus, gaps between daily candles aren’t included.
But it does at least point to one thing: BONK’s losses over the past six months mostly happened on weekdays. For futures traders, the pattern of Tuesdays closing lower most of the time can be more draining than a single-day crash. If you’re holding spot, rather than watching weekend price action, it may be worth considering whether you can stomach the slow weekday decline.
Have you noticed a similar pattern with any coins you often trade—where a particular day of the week is especially rough?
Data: Binance BONK/USDT daily candles, retrieved shortly after 3 a.m. Beijing time on November 8.
18
Log in to explore more content
Join global crypto users on Binance Square
⚡️ Get latest and useful information about crypto.
💬 Trusted by the world’s largest crypto exchange.
👍 Discover real insights from verified creators.
Email / Phone number
Trending Topics
JobsReportRaisesHikeOdds
482,076 views
3,192 Discussing
TradFi News | US Adds 165,000 Jobs in October, More Than Double the 65,000 Forecast, as Unemployment Falls to 4.1%
Binance News
·42 Likes
·24.1k views
CPITestsDecemberRateOutlook
131,239 views
1,030 Discussing
BitcoinRebounds$75KAsChipsLead
43,039 views
332 Discussing