
Ifiok Trades
392 Posts

Ifiok Trades
Report
Block User
Trader. Investor. Builder. Creator of 2Sydes -Trading intelligence for Crypto & Stocks- Signals•Scanners•Bots. -See what others Miss! X:@2sydestrading
Open Trade

PEPE Holder
High-Frequency Trader
9.2 Years
71 Following
1.7K+ Followers
1.2K+ Liked
Posts
Portfolio
All
Quotes
Videos
PINNED
·
--
Bullish
$DOT
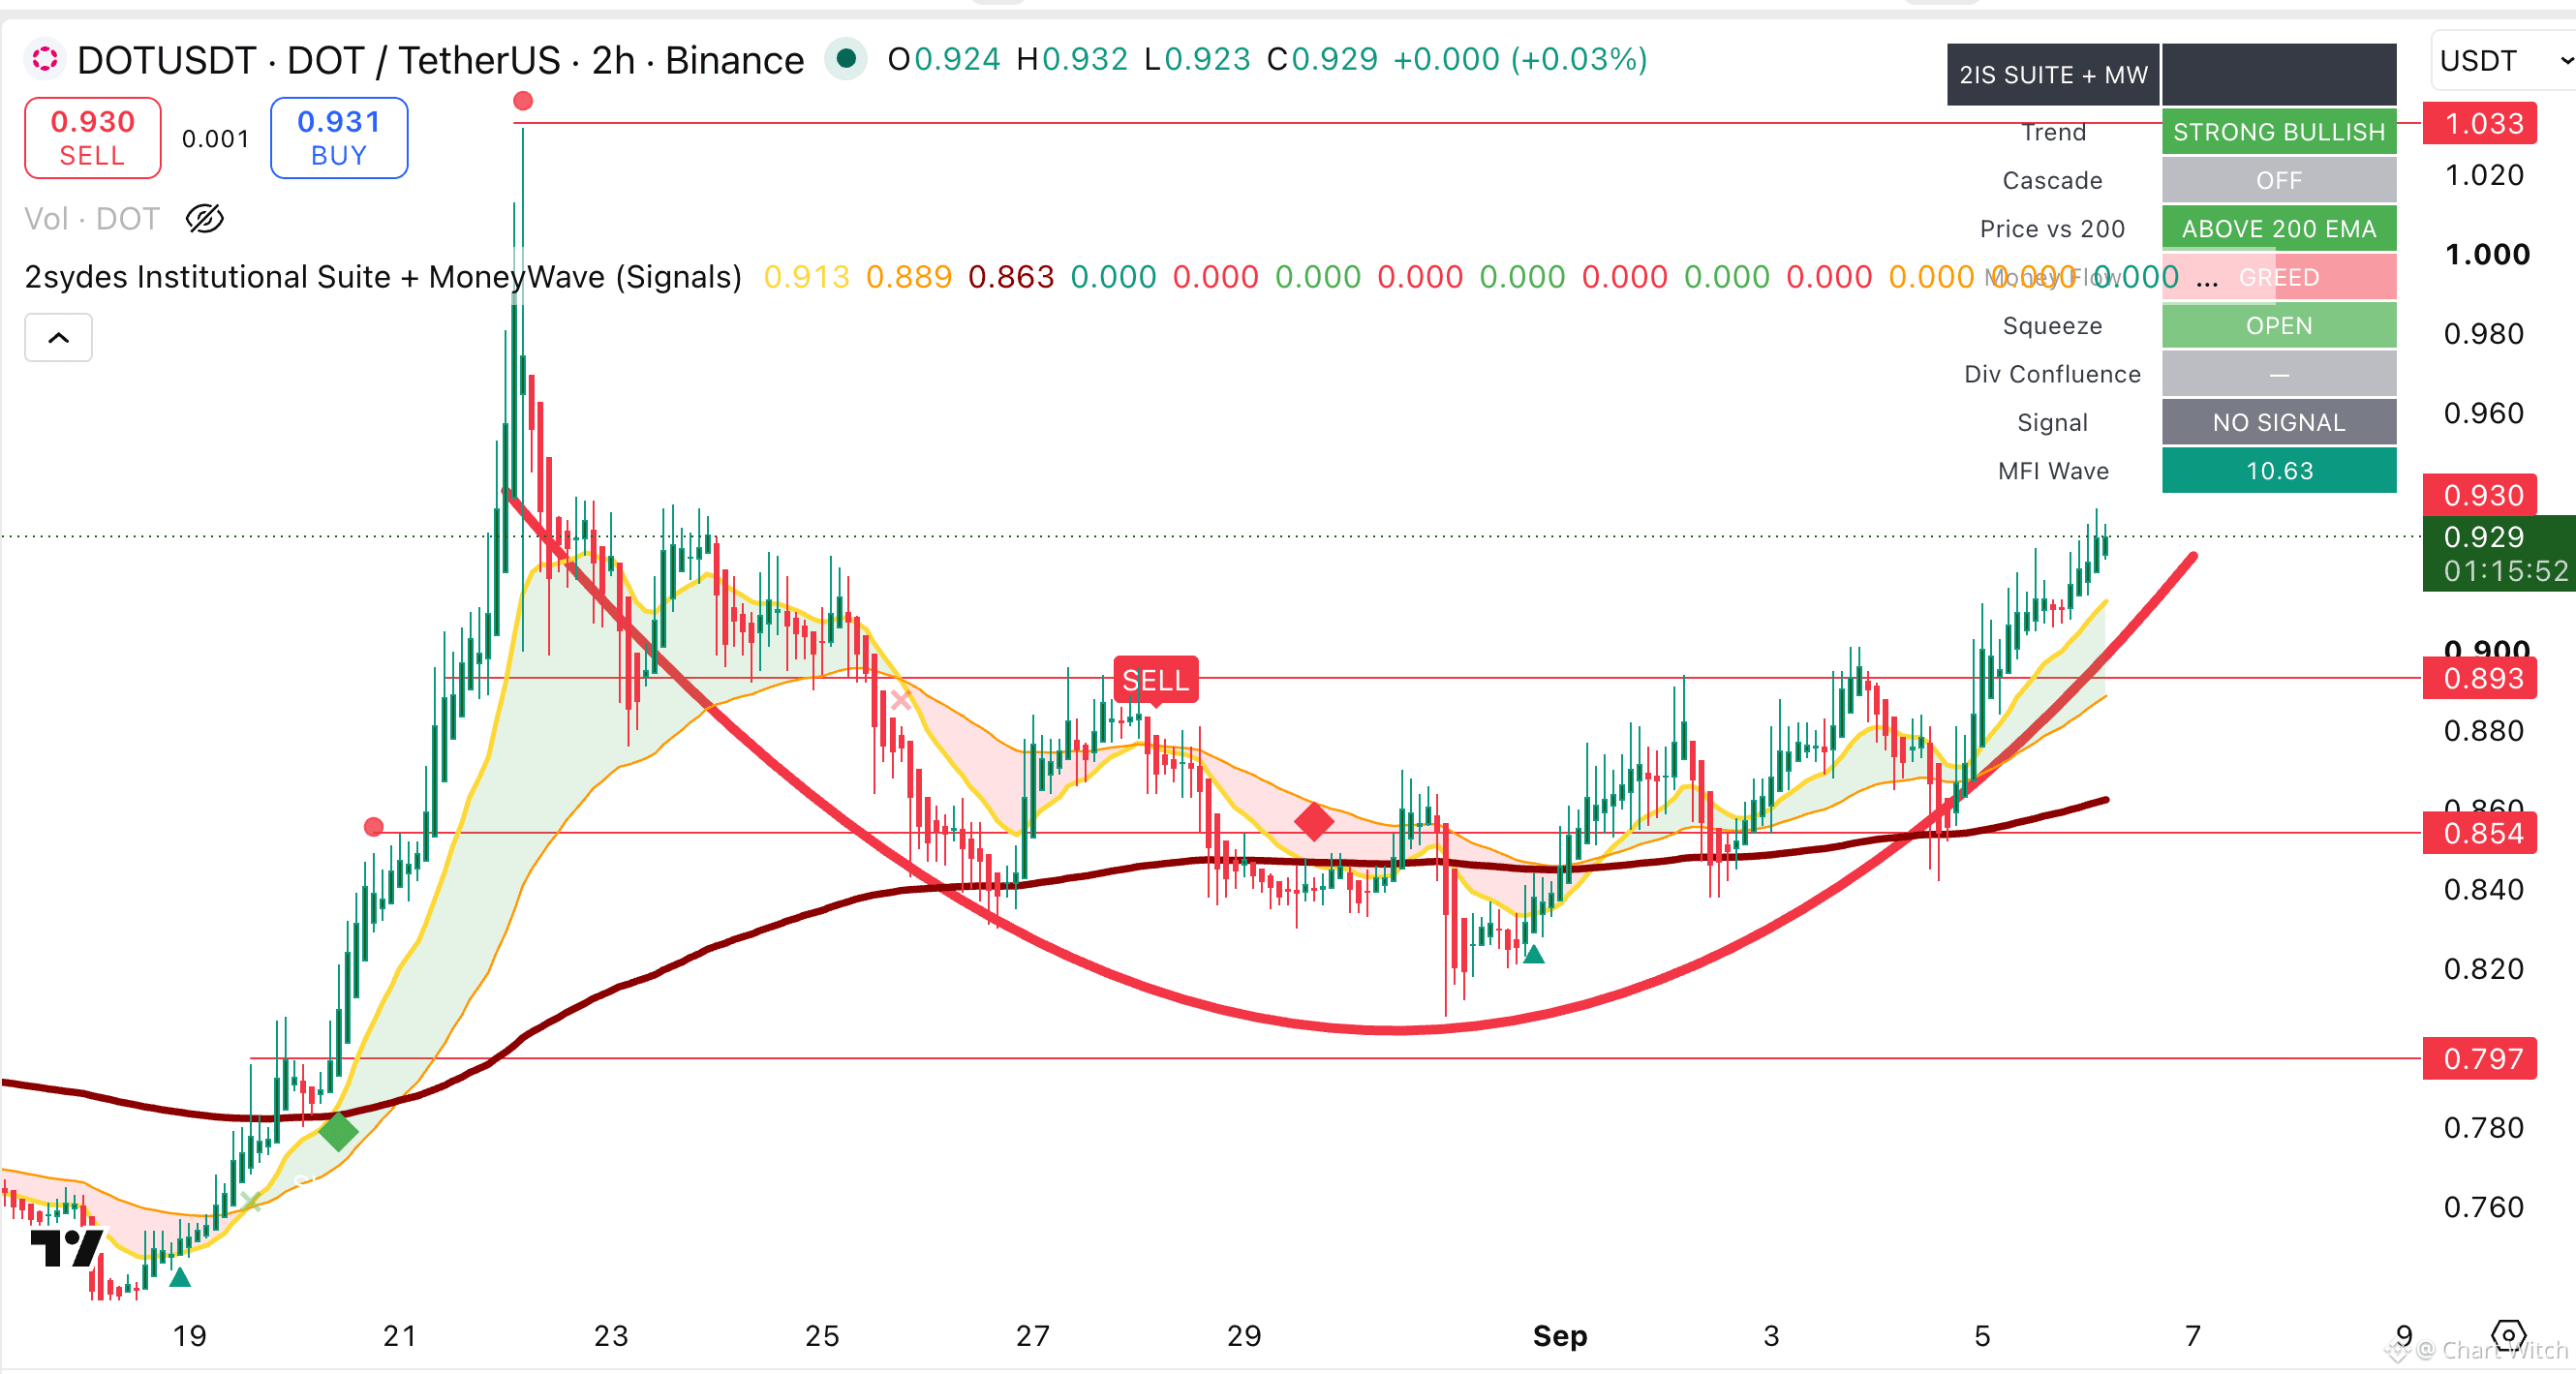
Polkadot in a bullish rounded bottom pattern on the 2hr timeframe.
Current price: 0.92
Dot will continue bullish up to $1.1 as long as price action remains above $0.89.
Invalidation of this idea lives under 0.89
#Dot
Follow for more...
$DOT
Polkadot in a bullish rounded bottom pattern on the 2hr timeframe.
Current price: 0.92
Dot will continue bullish up to $1.1 as long as price action remains above $0.89.
Invalidation of this idea lives under 0.89
#Dot
Follow for more...
Polkadot in a bullish rounded bottom pattern on the 2hr timeframe.
Current price: 0.92
Dot will continue bullish up to $1.1 as long as price action remains above $0.89.
Invalidation of this idea lives under 0.89
#Dot
Follow for more...
31
6
56
42.9k
·
--
$BTC
{spot}(BTCUSDT)
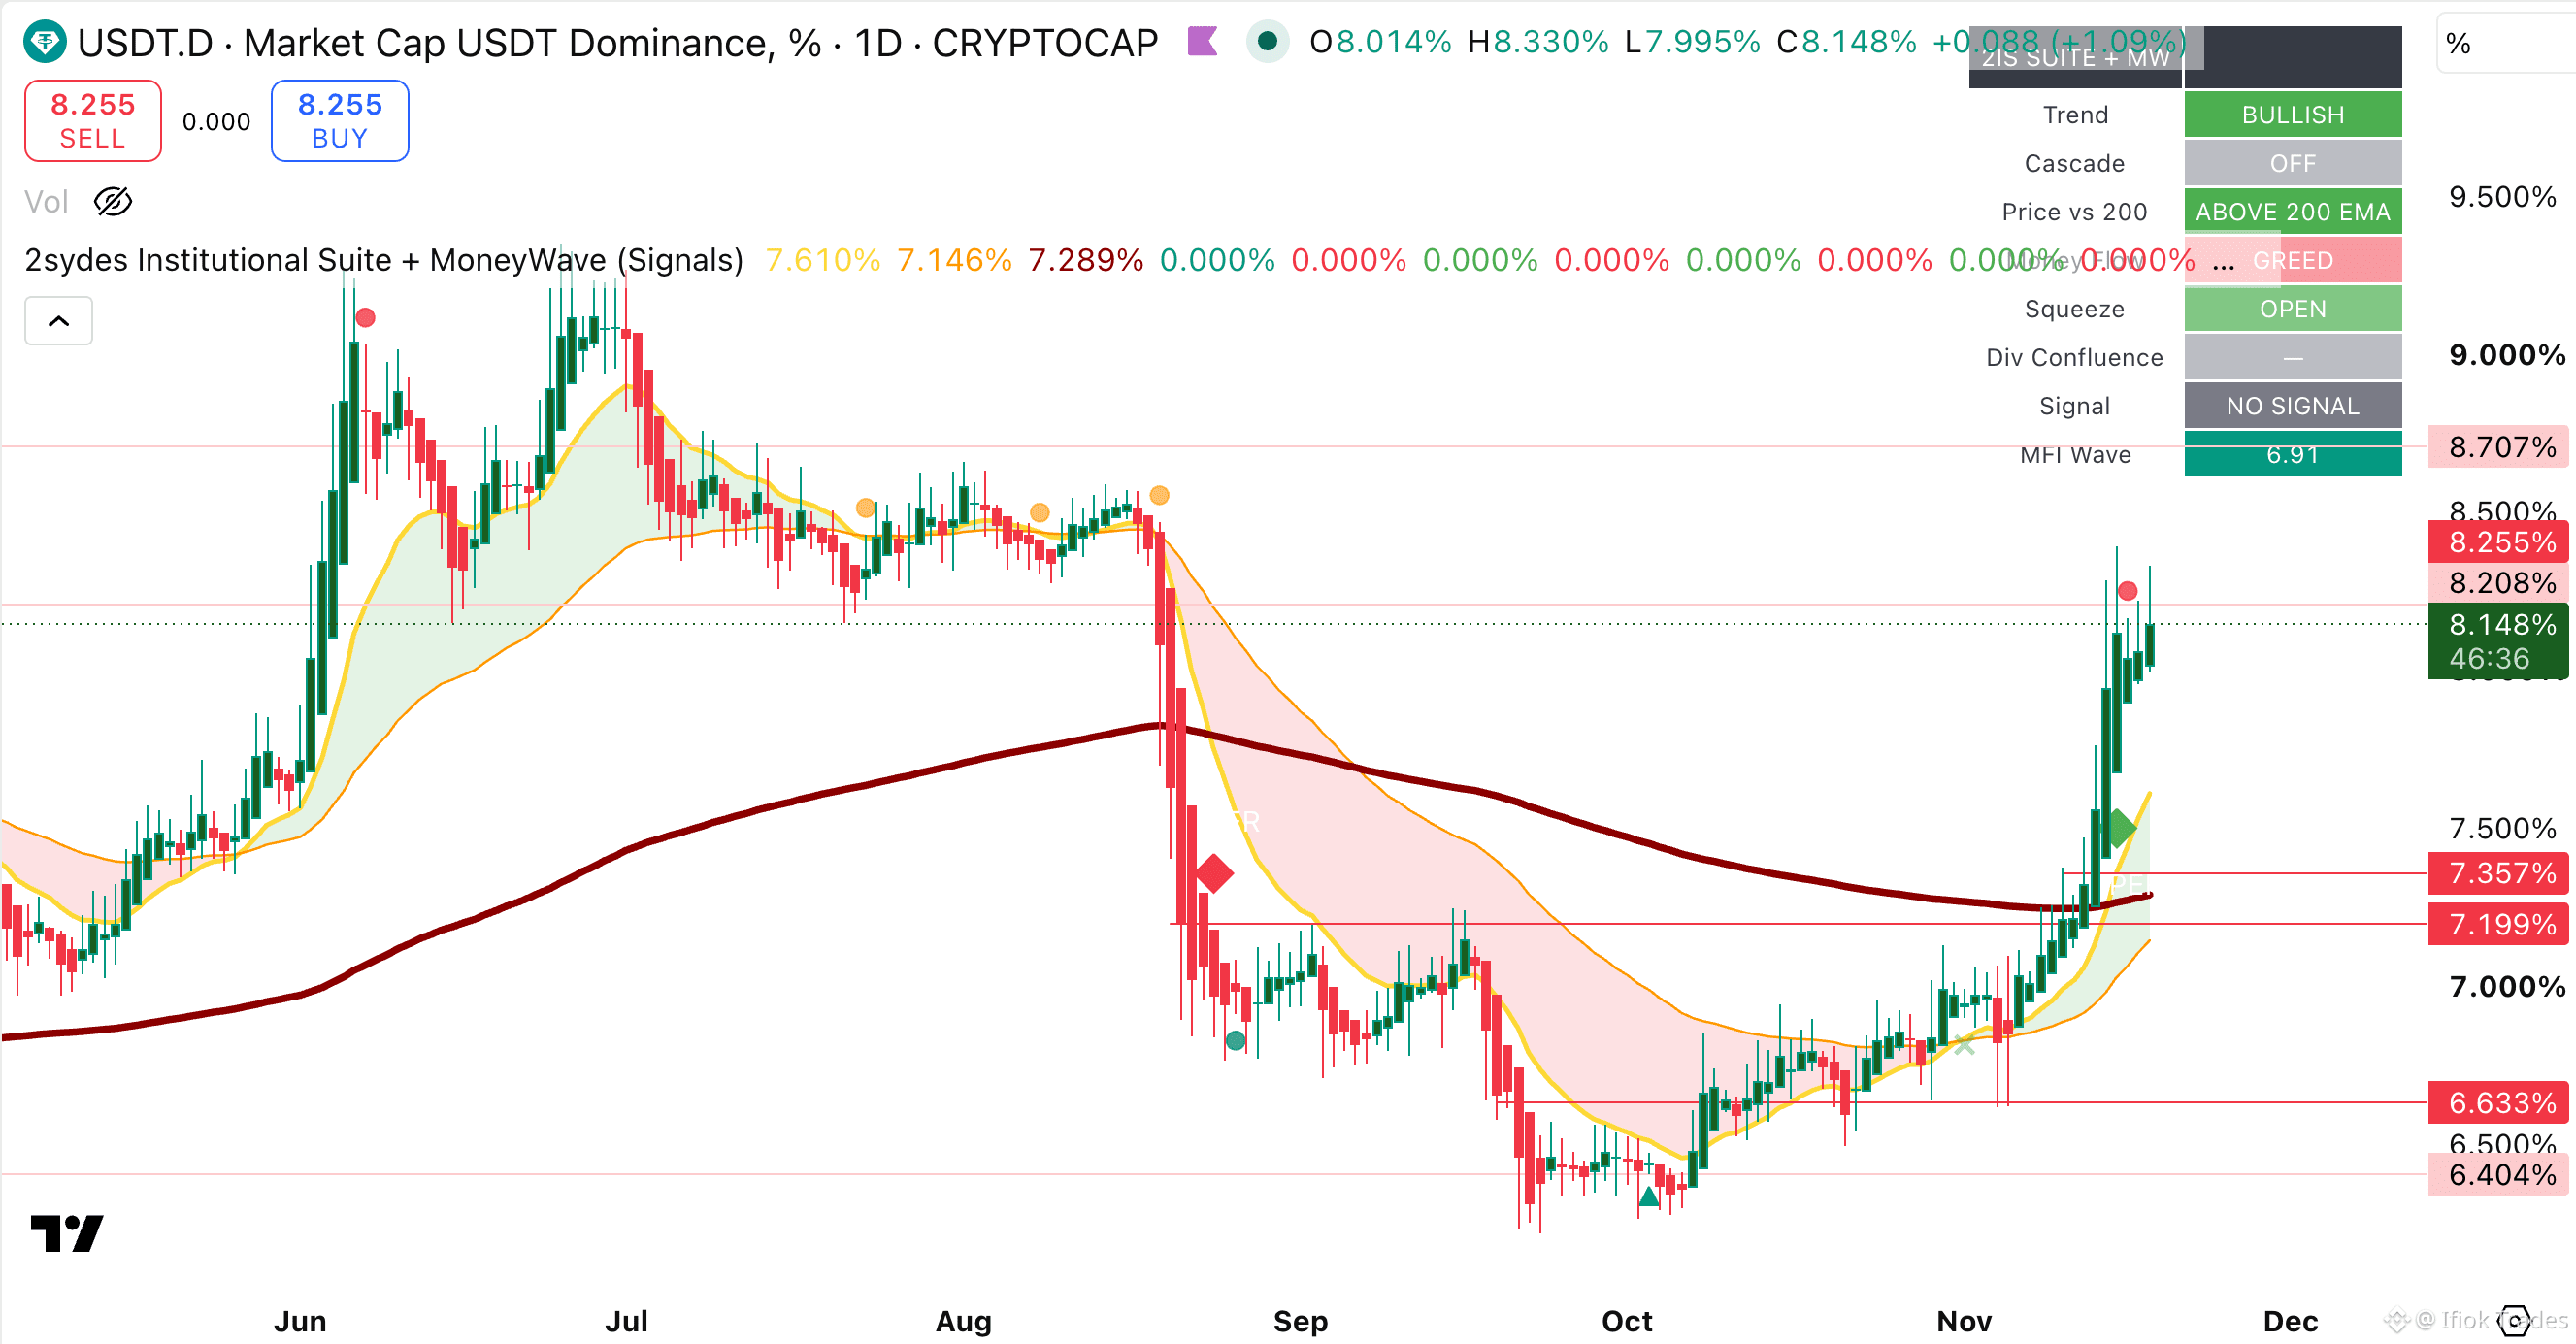
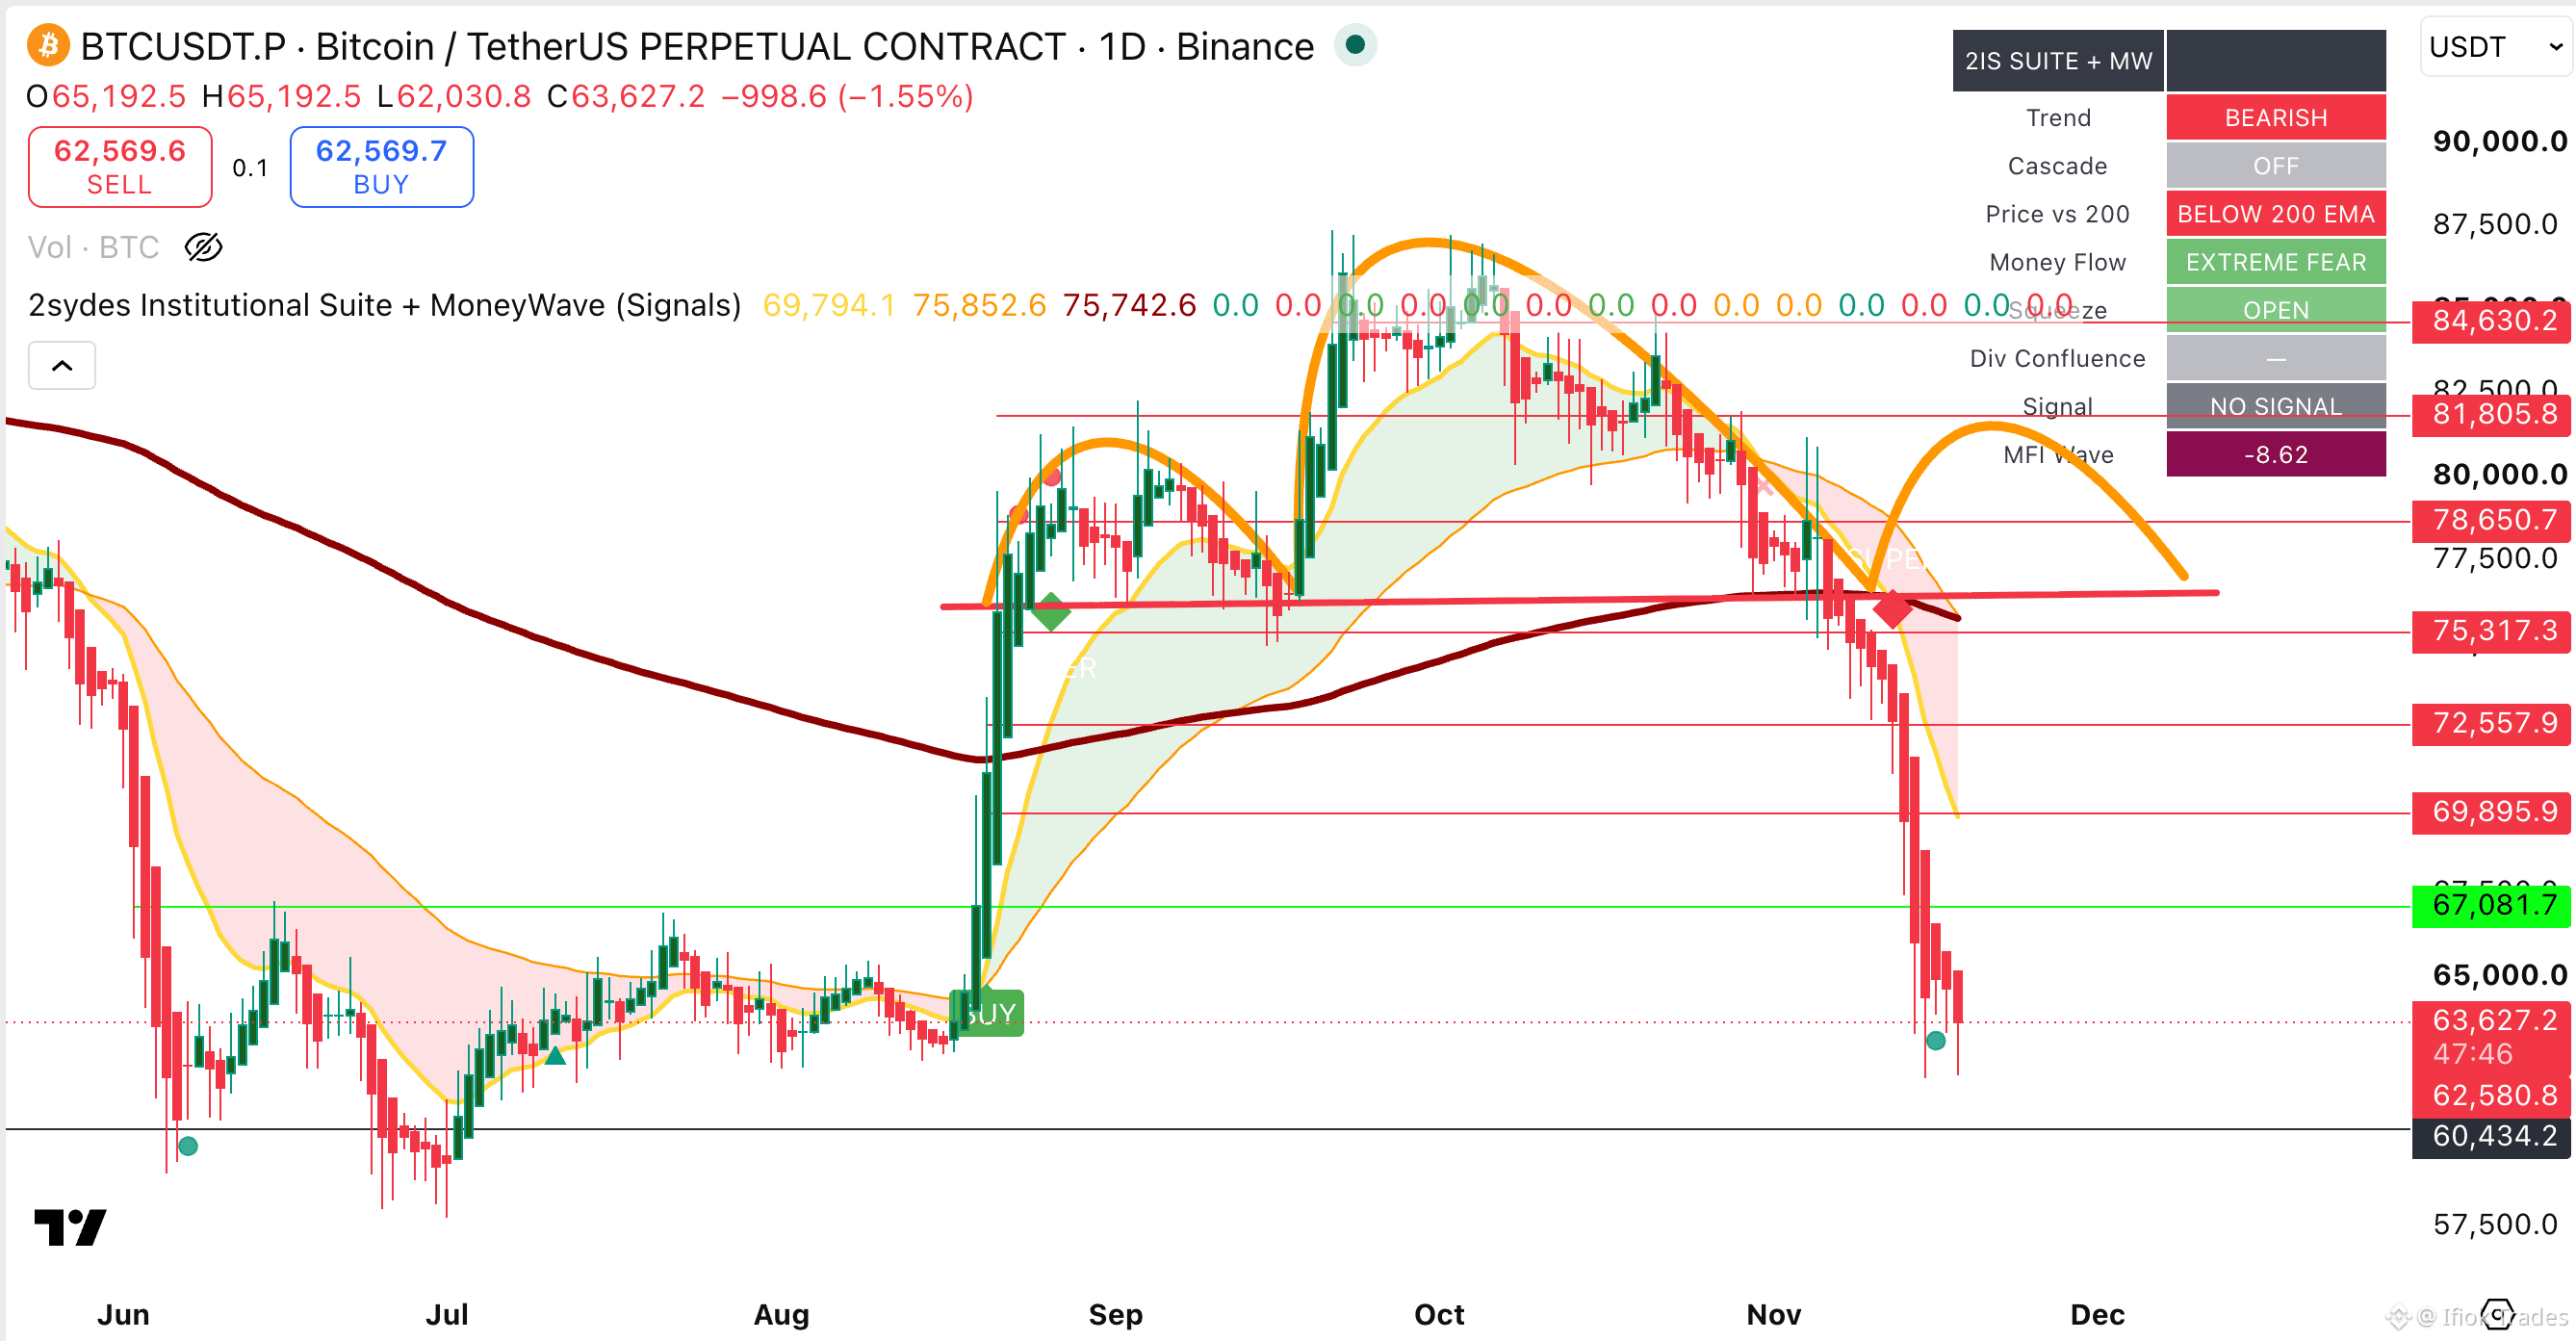
🚨 WHAT IF BITCOIN IS CLOSER TO A BOTTOM THAN EVERYONE THINKS?
While traders panic, I noticed something unusual on two charts.
🟢 $BTC: 2Sydes Bottom Dot + EXTREME FEAR.
🔴 USDT.D: 2Sydes Top Dot + GREED.
Here's why this matters 👇
Bitcoin and USDT dominance often move in opposite directions.
Now, BOTH are showing potential exhaustion signals — in opposite directions.
BTC is approaching support.
USDT.D is approaching resistance.
The last thing I'd ignore is this combination.
Does it guarantee a reversal? No.
But could the market be setting up for a move most traders aren't expecting?
I'm watching both charts closely. 👀
See what others miss. Trade with intelligence.
#BTC #bitcoin #2Sydes
$BTC
🚨 WHAT IF BITCOIN IS CLOSER TO A BOTTOM THAN EVERYONE THINKS?
While traders panic, I noticed something unusual on two charts.
🟢 $BTC : 2Sydes Bottom Dot + EXTREME FEAR.
🔴 USDT.D: 2Sydes Top Dot + GREED.
Here's why this matters 👇
Bitcoin and USDT dominance often move in opposite directions.
Now, BOTH are showing potential exhaustion signals — in opposite directions.
BTC is approaching support.
USDT.D is approaching resistance.
The last thing I'd ignore is this combination.
Does it guarantee a reversal? No.
But could the market be setting up for a move most traders aren't expecting?
I'm watching both charts closely. 👀
See what others miss. Trade with intelligence.
#BTC #bitcoin #2Sydes
🚨 WHAT IF BITCOIN IS CLOSER TO A BOTTOM THAN EVERYONE THINKS?
While traders panic, I noticed something unusual on two charts.
🟢 $BTC : 2Sydes Bottom Dot + EXTREME FEAR.
🔴 USDT.D: 2Sydes Top Dot + GREED.
Here's why this matters 👇
Bitcoin and USDT dominance often move in opposite directions.
Now, BOTH are showing potential exhaustion signals — in opposite directions.
BTC is approaching support.
USDT.D is approaching resistance.
The last thing I'd ignore is this combination.
Does it guarantee a reversal? No.
But could the market be setting up for a move most traders aren't expecting?
I'm watching both charts closely. 👀
See what others miss. Trade with intelligence.
#BTC #bitcoin #2Sydes
1
2
573
·
--
Bearish
$BTC — WHAT IF THIS CRASH IS PART OF A MUCH BIGGER PATTERN?
{spot}(BTCUSDT)
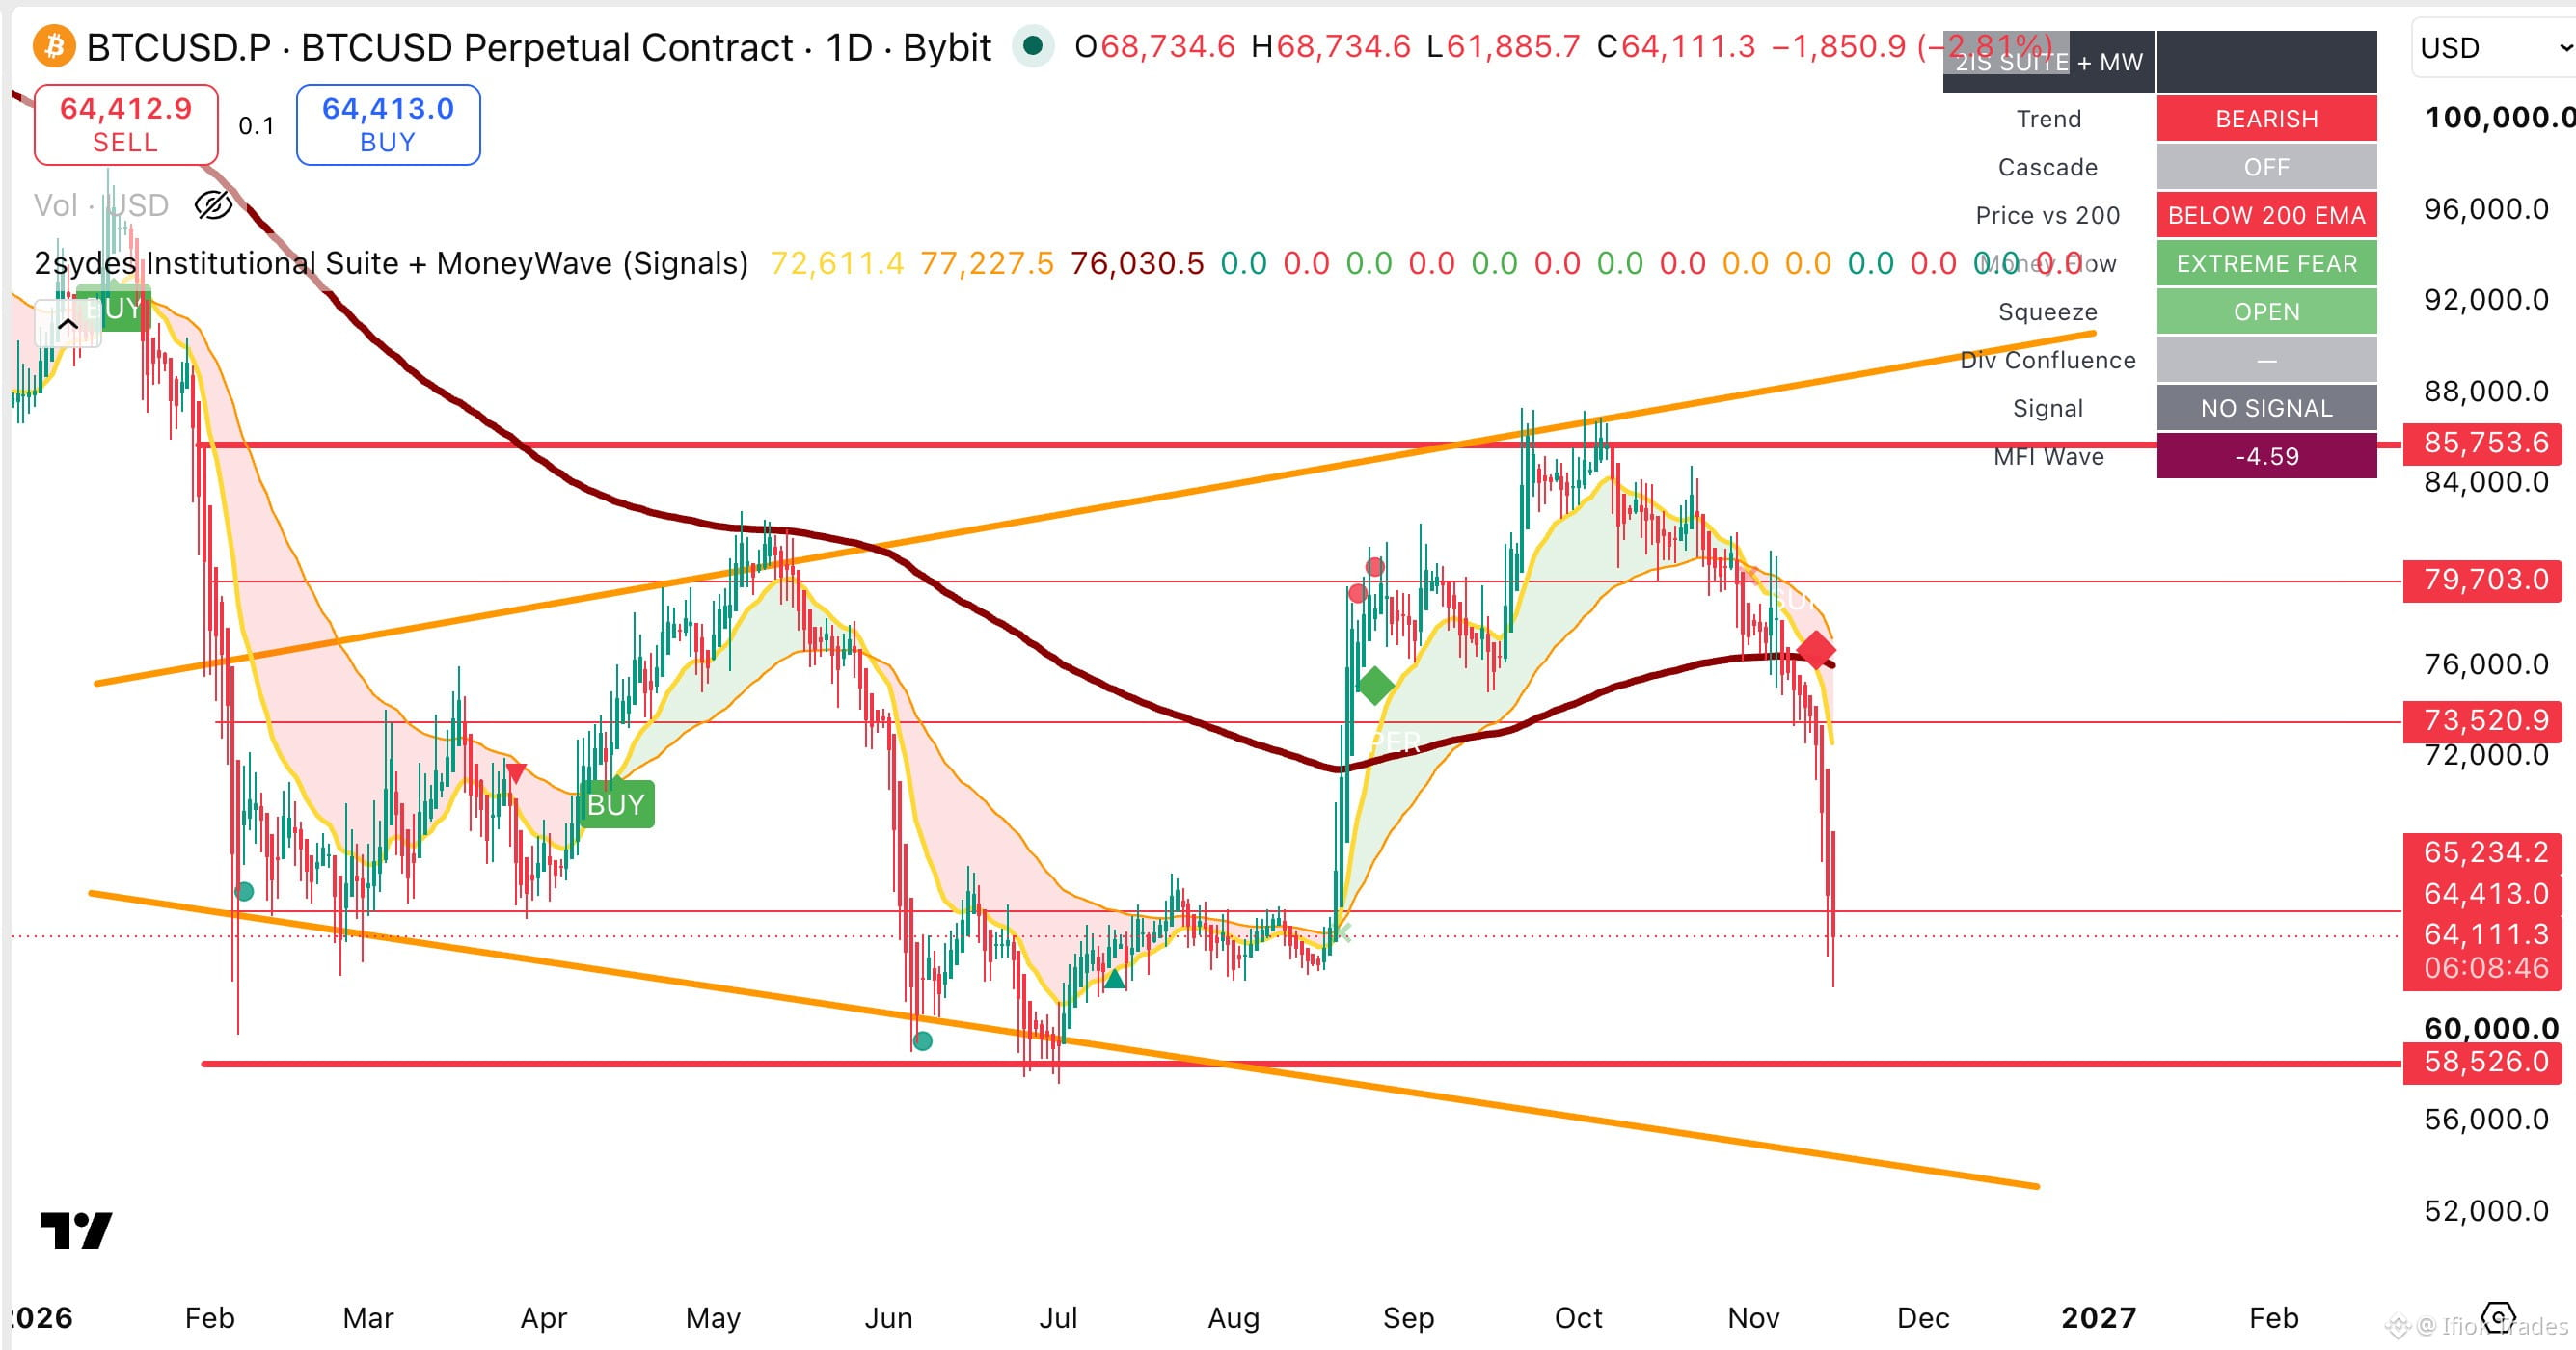
Bitcoin has plunged from $85,750 to $64,000, wiping out weeks of gains. But zoom out. 👀
TWO interesting possibilities are emerging:
🔥RANGE-BOUND: BTC could be rotating between $58,526 support and $85,750 resistance.
🔥 BROADENING TRIANGLE: What looks like a crash could be another leg of an expanding volatility pattern.
What does 2Sydes say?
🔴 Bearish trend
🔴 Below 200 EMA
EXTREME FEAR
🎯 $58,526 is the level I'm watching.
If it holds, another major recovery becomes possible. If it breaks, the bearish case strengthens.
Are we witnessing the beginning of a deeper crash or one of Bitcoin's biggest shakeouts? Which one do you see?
#BTC #bitcoin #2Sydes
$BTC — WHAT IF THIS CRASH IS PART OF A MUCH BIGGER PATTERN?
Bitcoin has plunged from $85,750 to $64,000, wiping out weeks of gains. But zoom out. 👀
TWO interesting possibilities are emerging:
🔥RANGE-BOUND: BTC could be rotating between $58,526 support and $85,750 resistance.
🔥 BROADENING TRIANGLE: What looks like a crash could be another leg of an expanding volatility pattern.
What does 2Sydes say?
🔴 Bearish trend
🔴 Below 200 EMA
EXTREME FEAR
🎯 $58,526 is the level I'm watching.
If it holds, another major recovery becomes possible. If it breaks, the bearish case strengthens.
Are we witnessing the beginning of a deeper crash or one of Bitcoin's biggest shakeouts? Which one do you see?
#BTC #bitcoin #2Sydes
Bitcoin has plunged from $85,750 to $64,000, wiping out weeks of gains. But zoom out. 👀
TWO interesting possibilities are emerging:
🔥RANGE-BOUND: BTC could be rotating between $58,526 support and $85,750 resistance.
🔥 BROADENING TRIANGLE: What looks like a crash could be another leg of an expanding volatility pattern.
What does 2Sydes say?
🔴 Bearish trend
🔴 Below 200 EMA
EXTREME FEAR
🎯 $58,526 is the level I'm watching.
If it holds, another major recovery becomes possible. If it breaks, the bearish case strengthens.
Are we witnessing the beginning of a deeper crash or one of Bitcoin's biggest shakeouts? Which one do you see?
#BTC #bitcoin #2Sydes
2
5
3.1k
·
--
Bullish
2
6
307
·
--
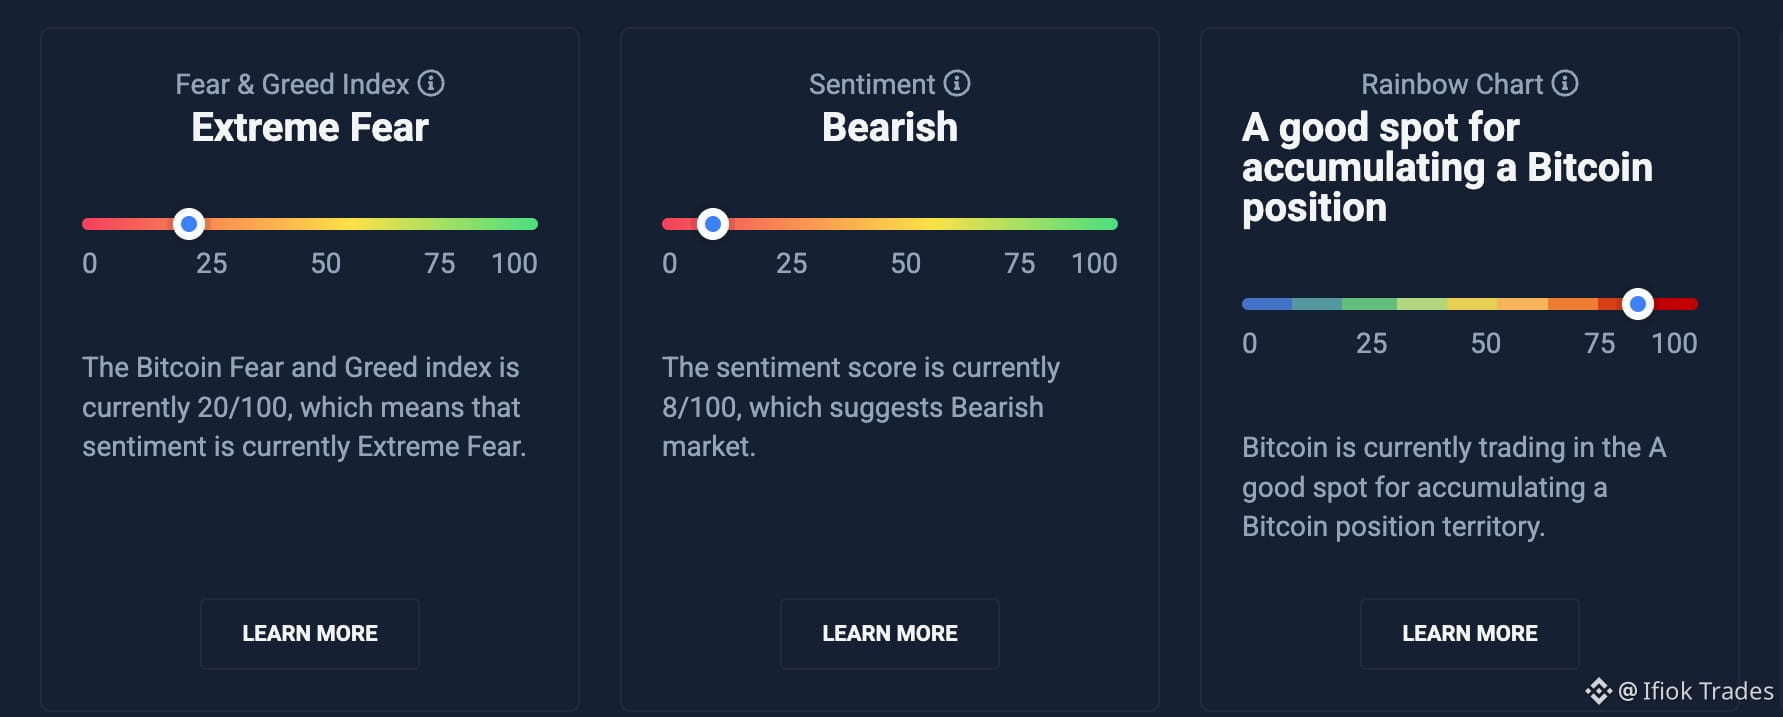
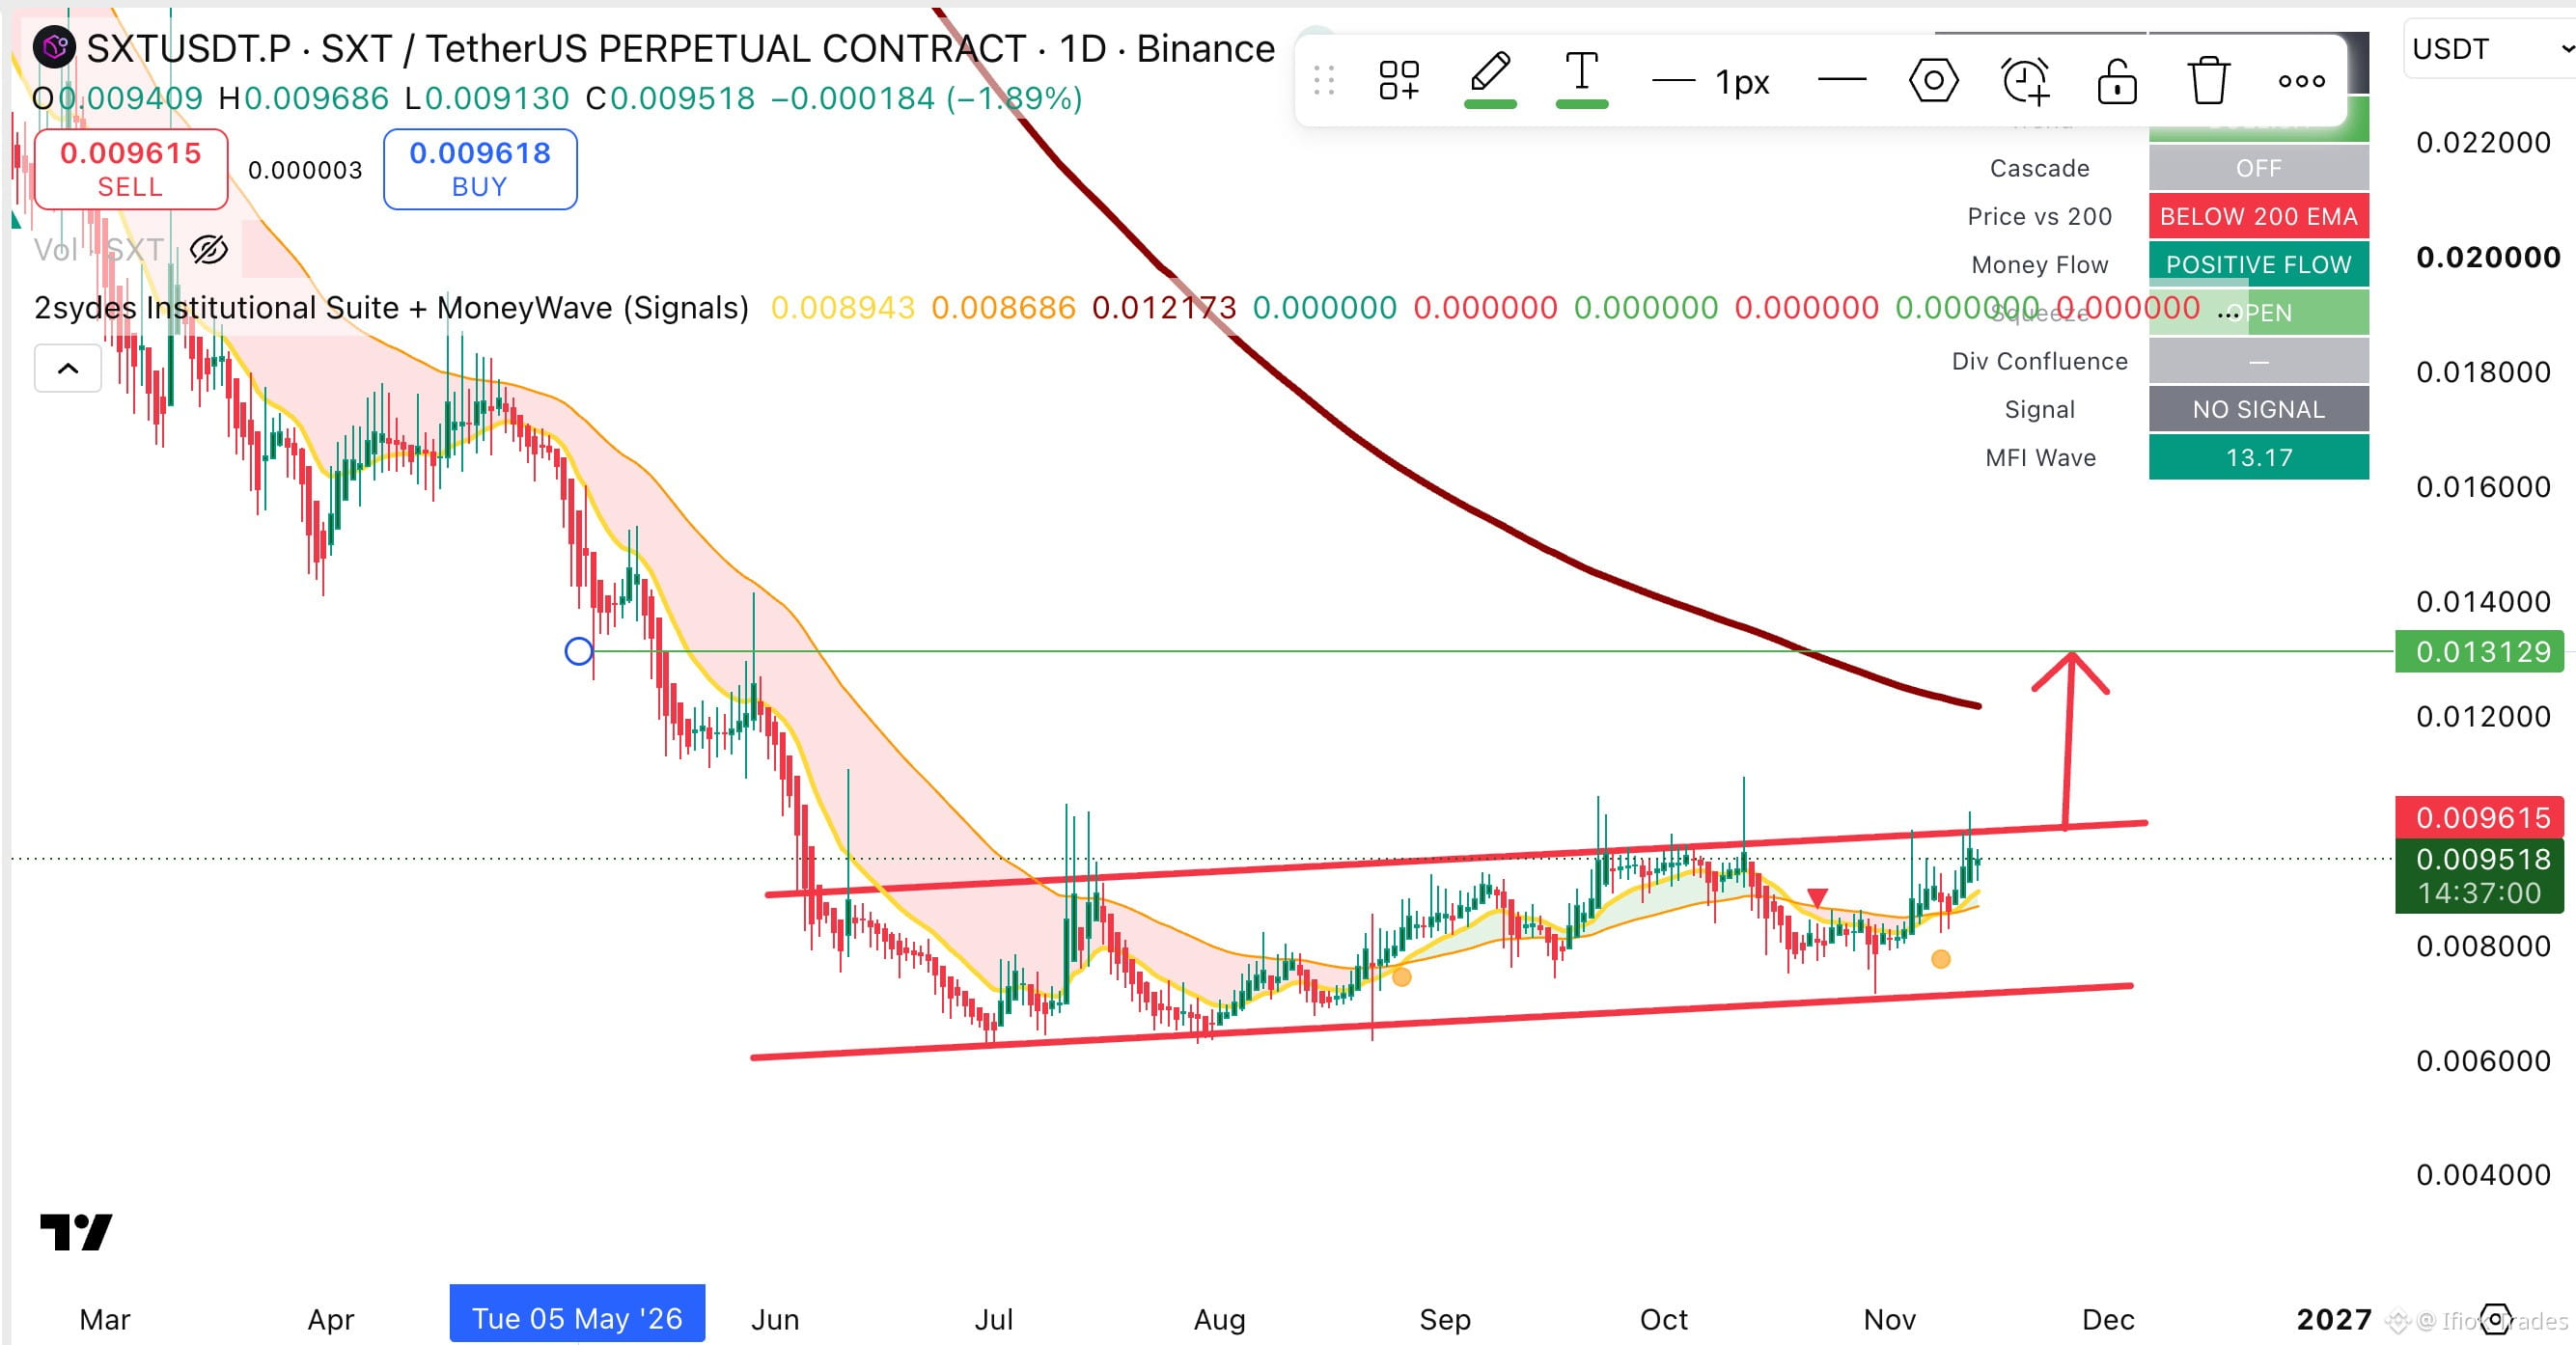
Alot of #altcoins went back to the lows of August.... Terrible!
Alot of #altcoins went back to the lows of August.... Terrible!
2
147
·
--
Bullish
$SOL.D $SOL
{spot}(SOLUSDT)
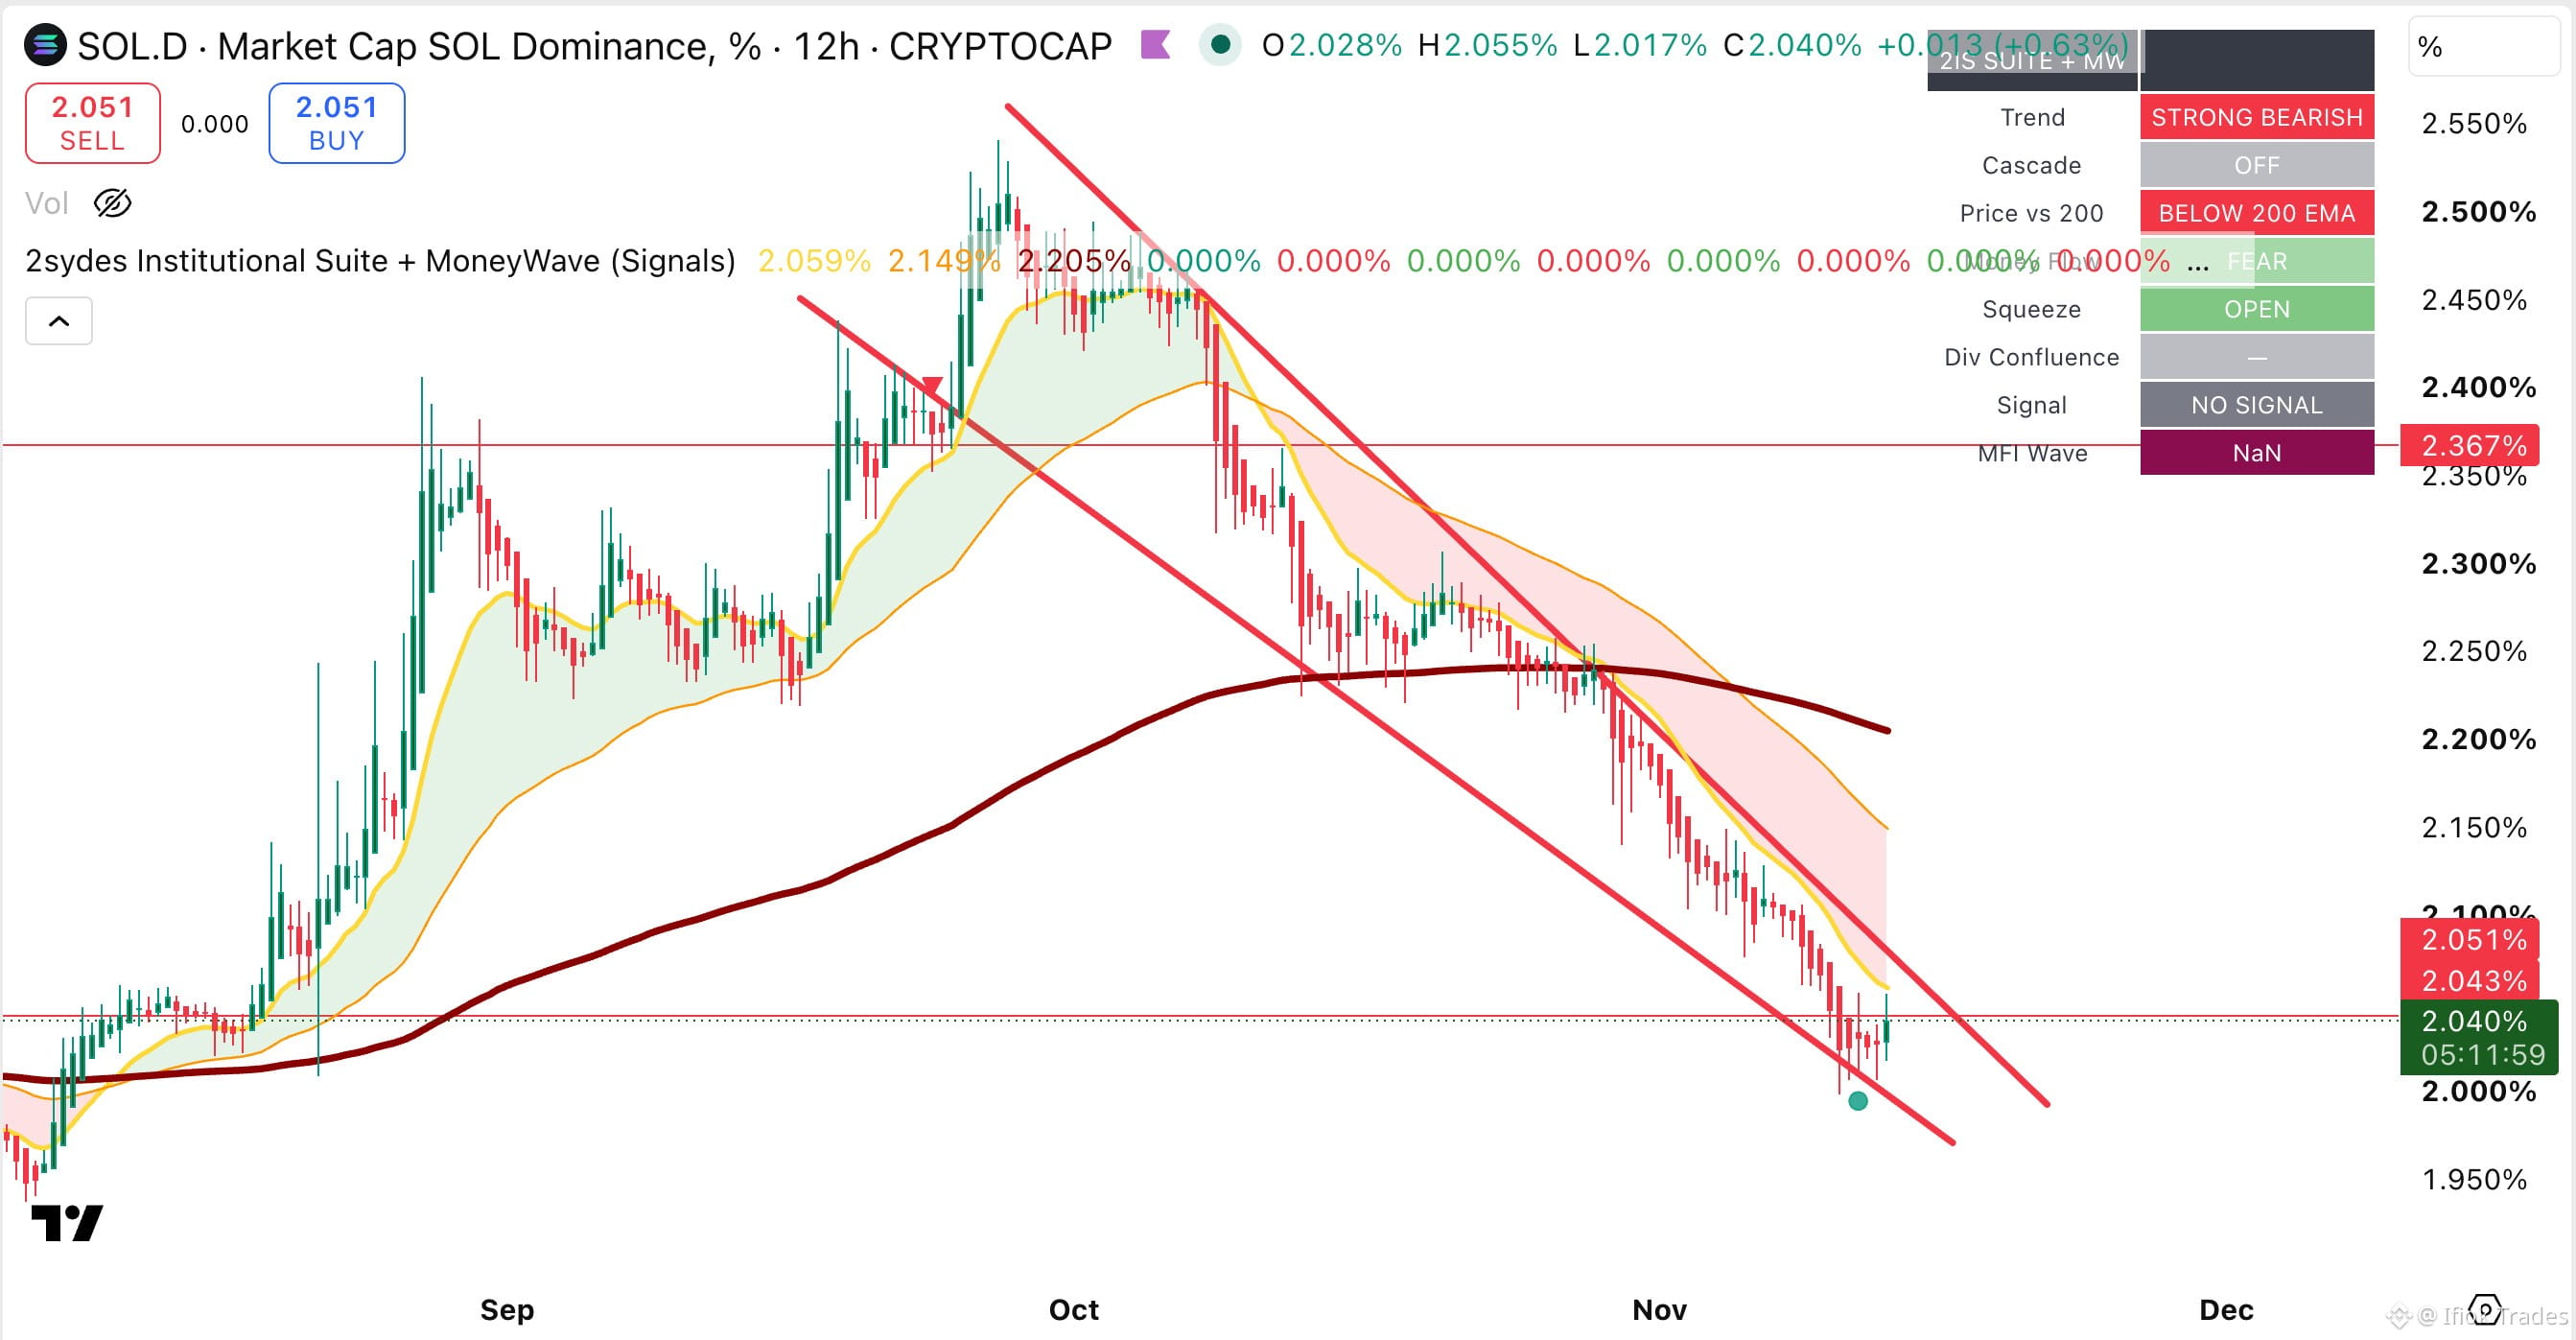
— Is Solana Dominance Preparing for a Reversal? 👀
Solana's market dominance has fallen from approximately 2.50% to 2.04%, following a sustained decline within a descending channel.
Now, price is attempting a rebound near the channel's lower boundary and the psychological 2.00% level.
🔍 What does 2Sydes say?
🔴 Trend: STRONG BEARISH
🔴 Below 200 EMA
🟢 Early rebound from channel support
⚪ No confirmed reversal signal
🎯 Key levels:
2.00% — Critical support
2.05%–2.10% — Immediate resistance
2.20% — Major resistance near the 200 EMA
2.367% — Higher recovery target
Is Solana preparing to regain market share, or is this simply another bounce within a downtrend?
See what others miss. Trade with intelligence.
#SOL #solana #2Sydes
$SOL .D $SOL
— Is Solana Dominance Preparing for a Reversal? 👀
Solana's market dominance has fallen from approximately 2.50% to 2.04%, following a sustained decline within a descending channel.
Now, price is attempting a rebound near the channel's lower boundary and the psychological 2.00% level.
🔍 What does 2Sydes say?
🔴 Trend: STRONG BEARISH
🔴 Below 200 EMA
🟢 Early rebound from channel support
⚪ No confirmed reversal signal
🎯 Key levels:
2.00% — Critical support
2.05%–2.10% — Immediate resistance
2.20% — Major resistance near the 200 EMA
2.367% — Higher recovery target
Is Solana preparing to regain market share, or is this simply another bounce within a downtrend?
See what others miss. Trade with intelligence.
#SOL #solana #2Sydes
— Is Solana Dominance Preparing for a Reversal? 👀
Solana's market dominance has fallen from approximately 2.50% to 2.04%, following a sustained decline within a descending channel.
Now, price is attempting a rebound near the channel's lower boundary and the psychological 2.00% level.
🔍 What does 2Sydes say?
🔴 Trend: STRONG BEARISH
🔴 Below 200 EMA
🟢 Early rebound from channel support
⚪ No confirmed reversal signal
🎯 Key levels:
2.00% — Critical support
2.05%–2.10% — Immediate resistance
2.20% — Major resistance near the 200 EMA
2.367% — Higher recovery target
Is Solana preparing to regain market share, or is this simply another bounce within a downtrend?
See what others miss. Trade with intelligence.
#SOL #solana #2Sydes
3
1.1k
·
--
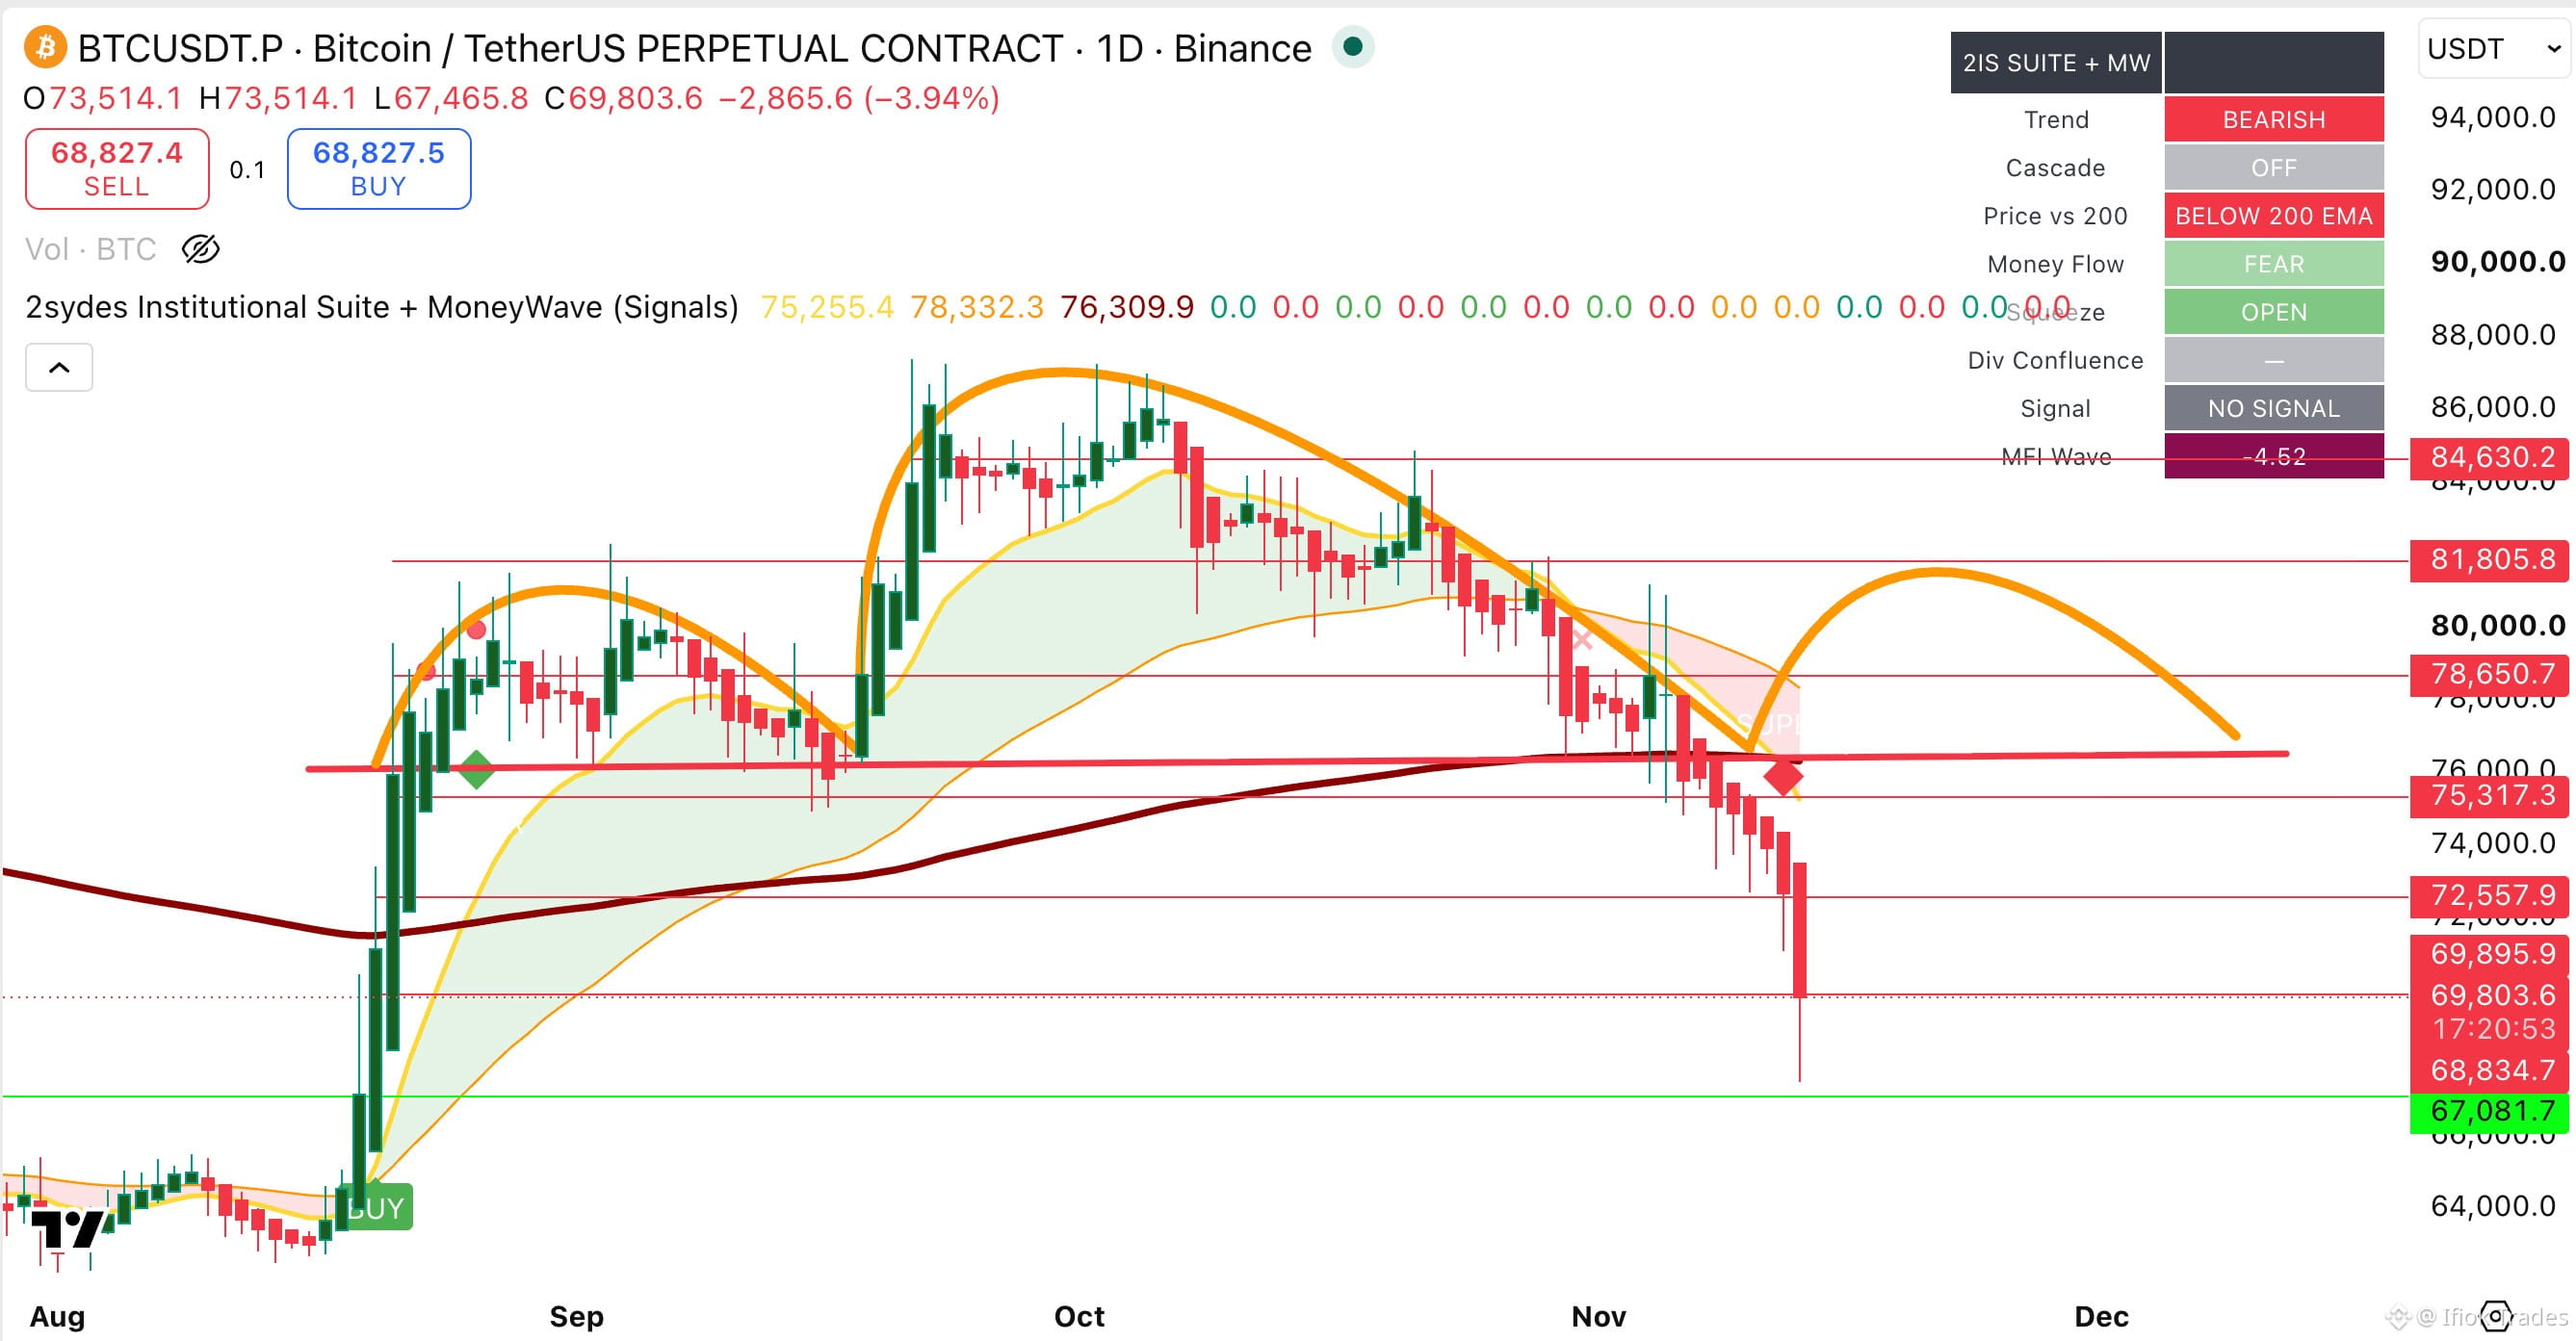
$BTC barely formed a right shoulder.... Hit 81k and puked!
As a permabull, I'm Long #altcoins from lows of 68k.
{spot}(BTCUSDT)
$BTC barely formed a right shoulder.... Hit 81k and puked!
As a permabull, I'm Long #altcoins from lows of 68k.
As a permabull, I'm Long #altcoins from lows of 68k.
Ifiok Trades
·
--
Bullish$BTC
— Is Bitcoin Preparing to Form Its Right Shoulder? 👀
A potential Head & Shoulders pattern is developing on Bitcoin's daily chart at 78k.
The left shoulder and head are already visible. What's missing? The right shoulder.
Here's what I'm watching:
🟢 Hold $76,500–$75,300 → Potential bounce towards $81,000–$82,000 to form the right shoulder.
🔴 Break below $75,300 → INVALIDATION.
What does 2Sydes say?
• Trend: BEARISH 🔴
• Money Flow: POSITIVE 🟢
• Price: ABOVE 200 EMA 🟢
The interesting possibility is a short-term bullish rebound within a developing bearish reversal structure.
Could BTC rally towards $81K before its next major move?
#BTC #Bitcoin #TechnicalAnalysis #2Sydes
— Is Bitcoin Preparing to Form Its Right Shoulder? 👀
A potential Head & Shoulders pattern is developing on Bitcoin's daily chart at 78k.
The left shoulder and head are already visible. What's missing? The right shoulder.
Here's what I'm watching:
🟢 Hold $76,500–$75,300 → Potential bounce towards $81,000–$82,000 to form the right shoulder.
🔴 Break below $75,300 → INVALIDATION.
What does 2Sydes say?
• Trend: BEARISH 🔴
• Money Flow: POSITIVE 🟢
• Price: ABOVE 200 EMA 🟢
The interesting possibility is a short-term bullish rebound within a developing bearish reversal structure.
Could BTC rally towards $81K before its next major move?
#BTC #Bitcoin #TechnicalAnalysis #2Sydes
2
200
·
--
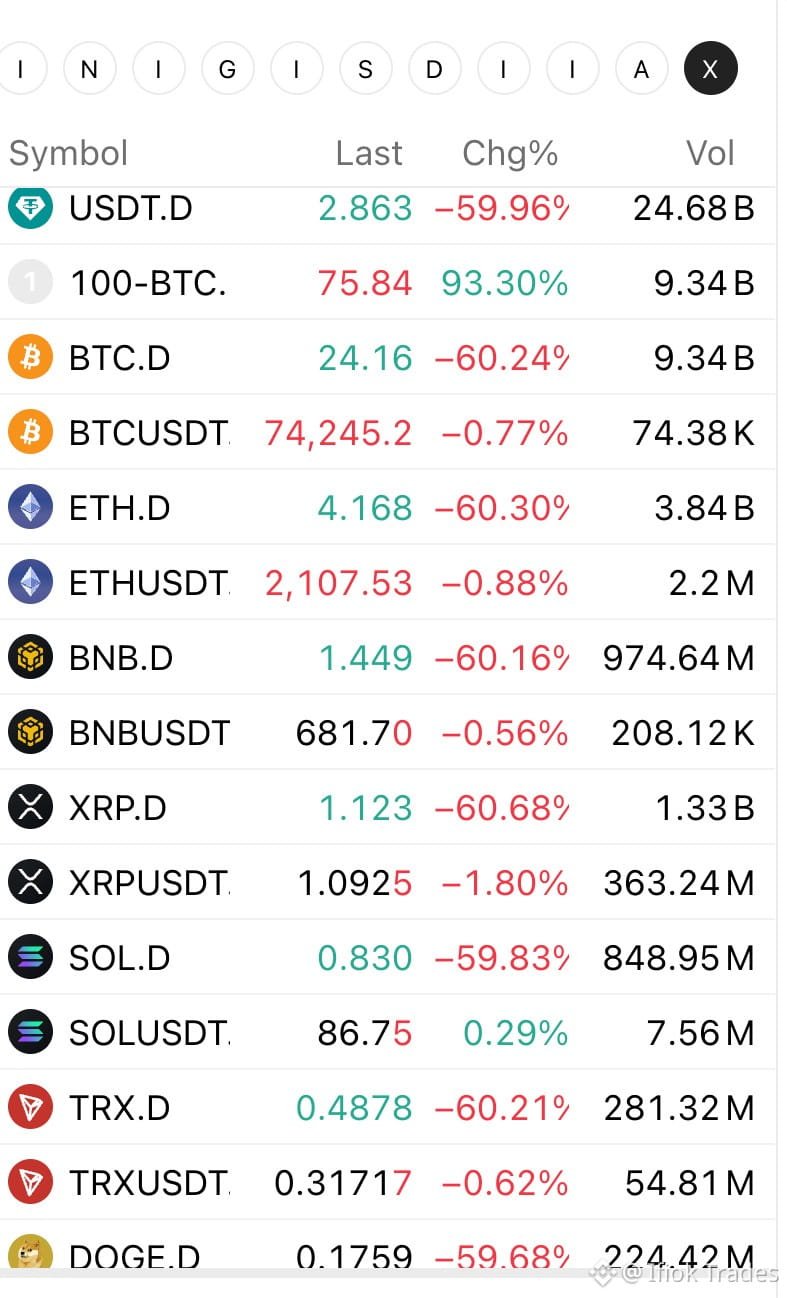
What da hell is going on with altcoin dominance? These figures are not right... Or is this the future? #altcoins
What da hell is going on with altcoin dominance? These figures are not right... Or is this the future? #altcoins
5
3.9k
·
--
Bullish
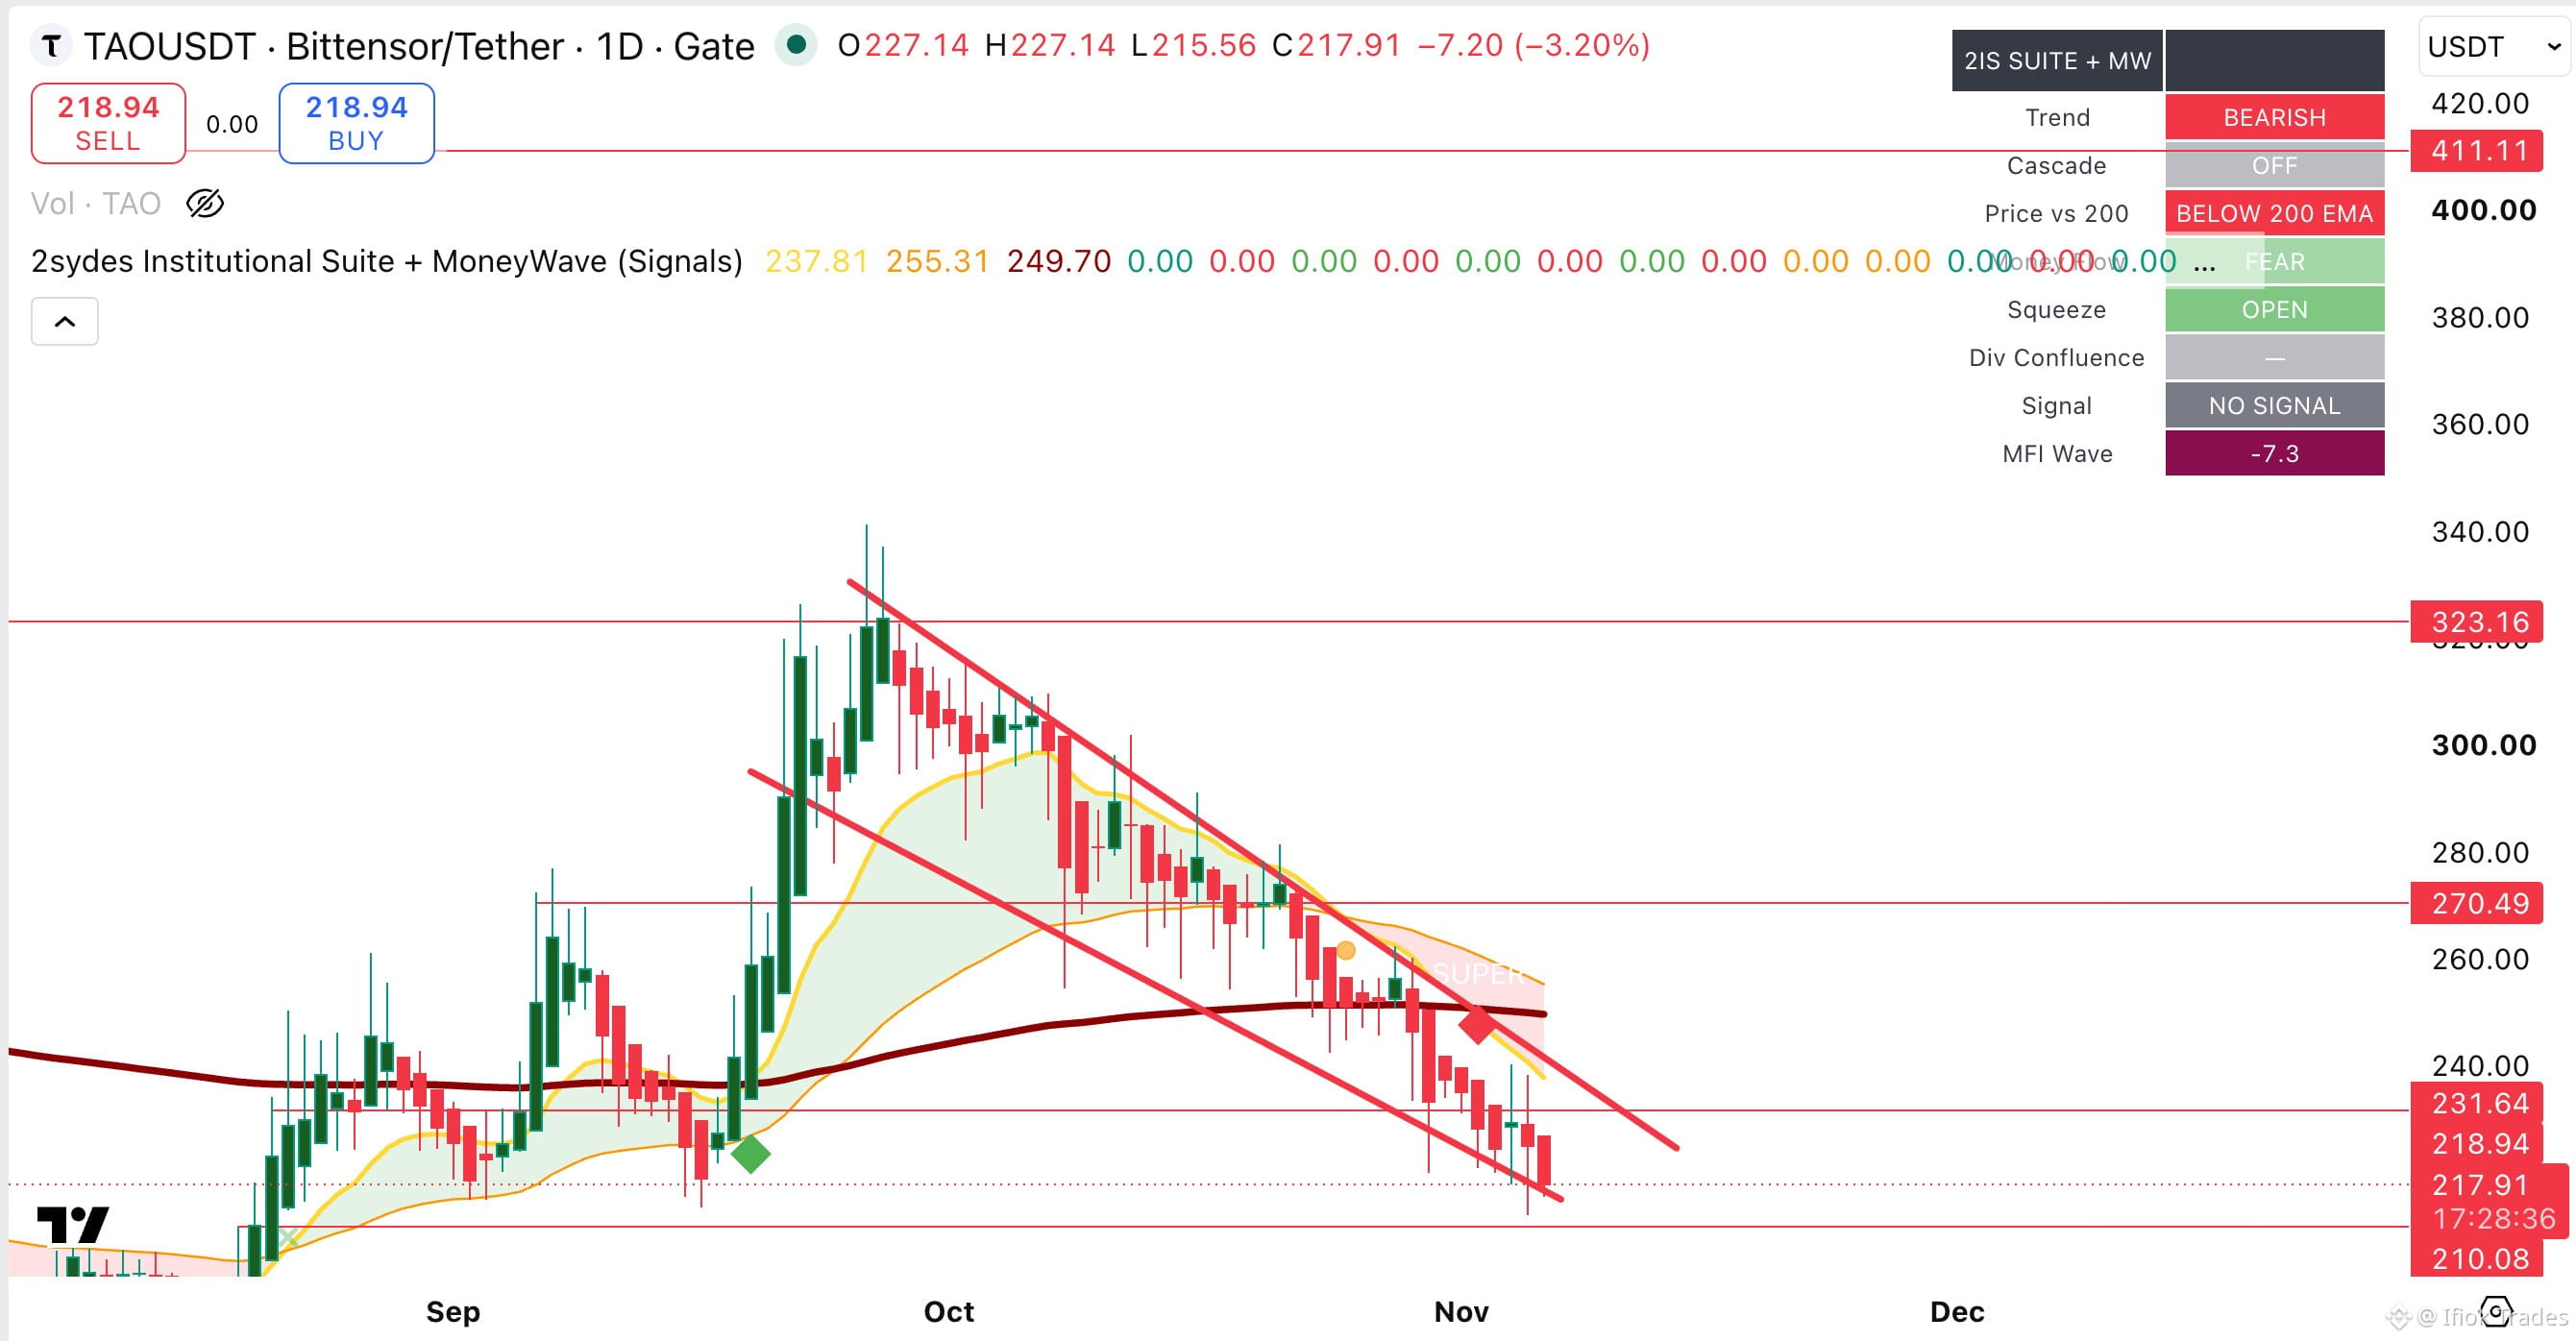
$TAO — All Gains Erased. Is the Falling Wedge the Next Opportunity? 👀
{spot}(TAOUSDT)
TAO has given back virtually all its gains from the September rally, falling from $323 to around $218.
Price is now approaching the lower boundary of a falling wedge, right around its previous breakout base.
🎯 Key levels:
🟢 $210–$218 — Critical support
🟡 $231.64 — Immediate resistance
🎯 $270.49 — Major resistance
🎯 $323.16 — Previous high
What does 2Sydes say?
🔴 Trend: BEARISH
🔴 Price: Below 200 EMA
🟠 MoneyWave: FEAR
A falling wedge can precede a bullish reversal, but the pattern alone isn't confirmation.
The question: Will $210–$218 hold long enough for a breakout, or will sellers push TAO lower?
See what others miss. Trade with intelligence.
#TAO #bittensor #2Sydes
$TAO — All Gains Erased. Is the Falling Wedge the Next Opportunity? 👀
TAO has given back virtually all its gains from the September rally, falling from $323 to around $218.
Price is now approaching the lower boundary of a falling wedge, right around its previous breakout base.
🎯 Key levels:
🟢 $210–$218 — Critical support
🟡 $231.64 — Immediate resistance
🎯 $270.49 — Major resistance
🎯 $323.16 — Previous high
What does 2Sydes say?
🔴 Trend: BEARISH
🔴 Price: Below 200 EMA
🟠 MoneyWave: FEAR
A falling wedge can precede a bullish reversal, but the pattern alone isn't confirmation.
The question: Will $210–$218 hold long enough for a breakout, or will sellers push TAO lower?
See what others miss. Trade with intelligence.
#TAO #bittensor #2Sydes
TAO has given back virtually all its gains from the September rally, falling from $323 to around $218.
Price is now approaching the lower boundary of a falling wedge, right around its previous breakout base.
🎯 Key levels:
🟢 $210–$218 — Critical support
🟡 $231.64 — Immediate resistance
🎯 $270.49 — Major resistance
🎯 $323.16 — Previous high
What does 2Sydes say?
🔴 Trend: BEARISH
🔴 Price: Below 200 EMA
🟠 MoneyWave: FEAR
A falling wedge can precede a bullish reversal, but the pattern alone isn't confirmation.
The question: Will $210–$218 hold long enough for a breakout, or will sellers push TAO lower?
See what others miss. Trade with intelligence.
#TAO #bittensor #2Sydes
5
2.7k
·
--
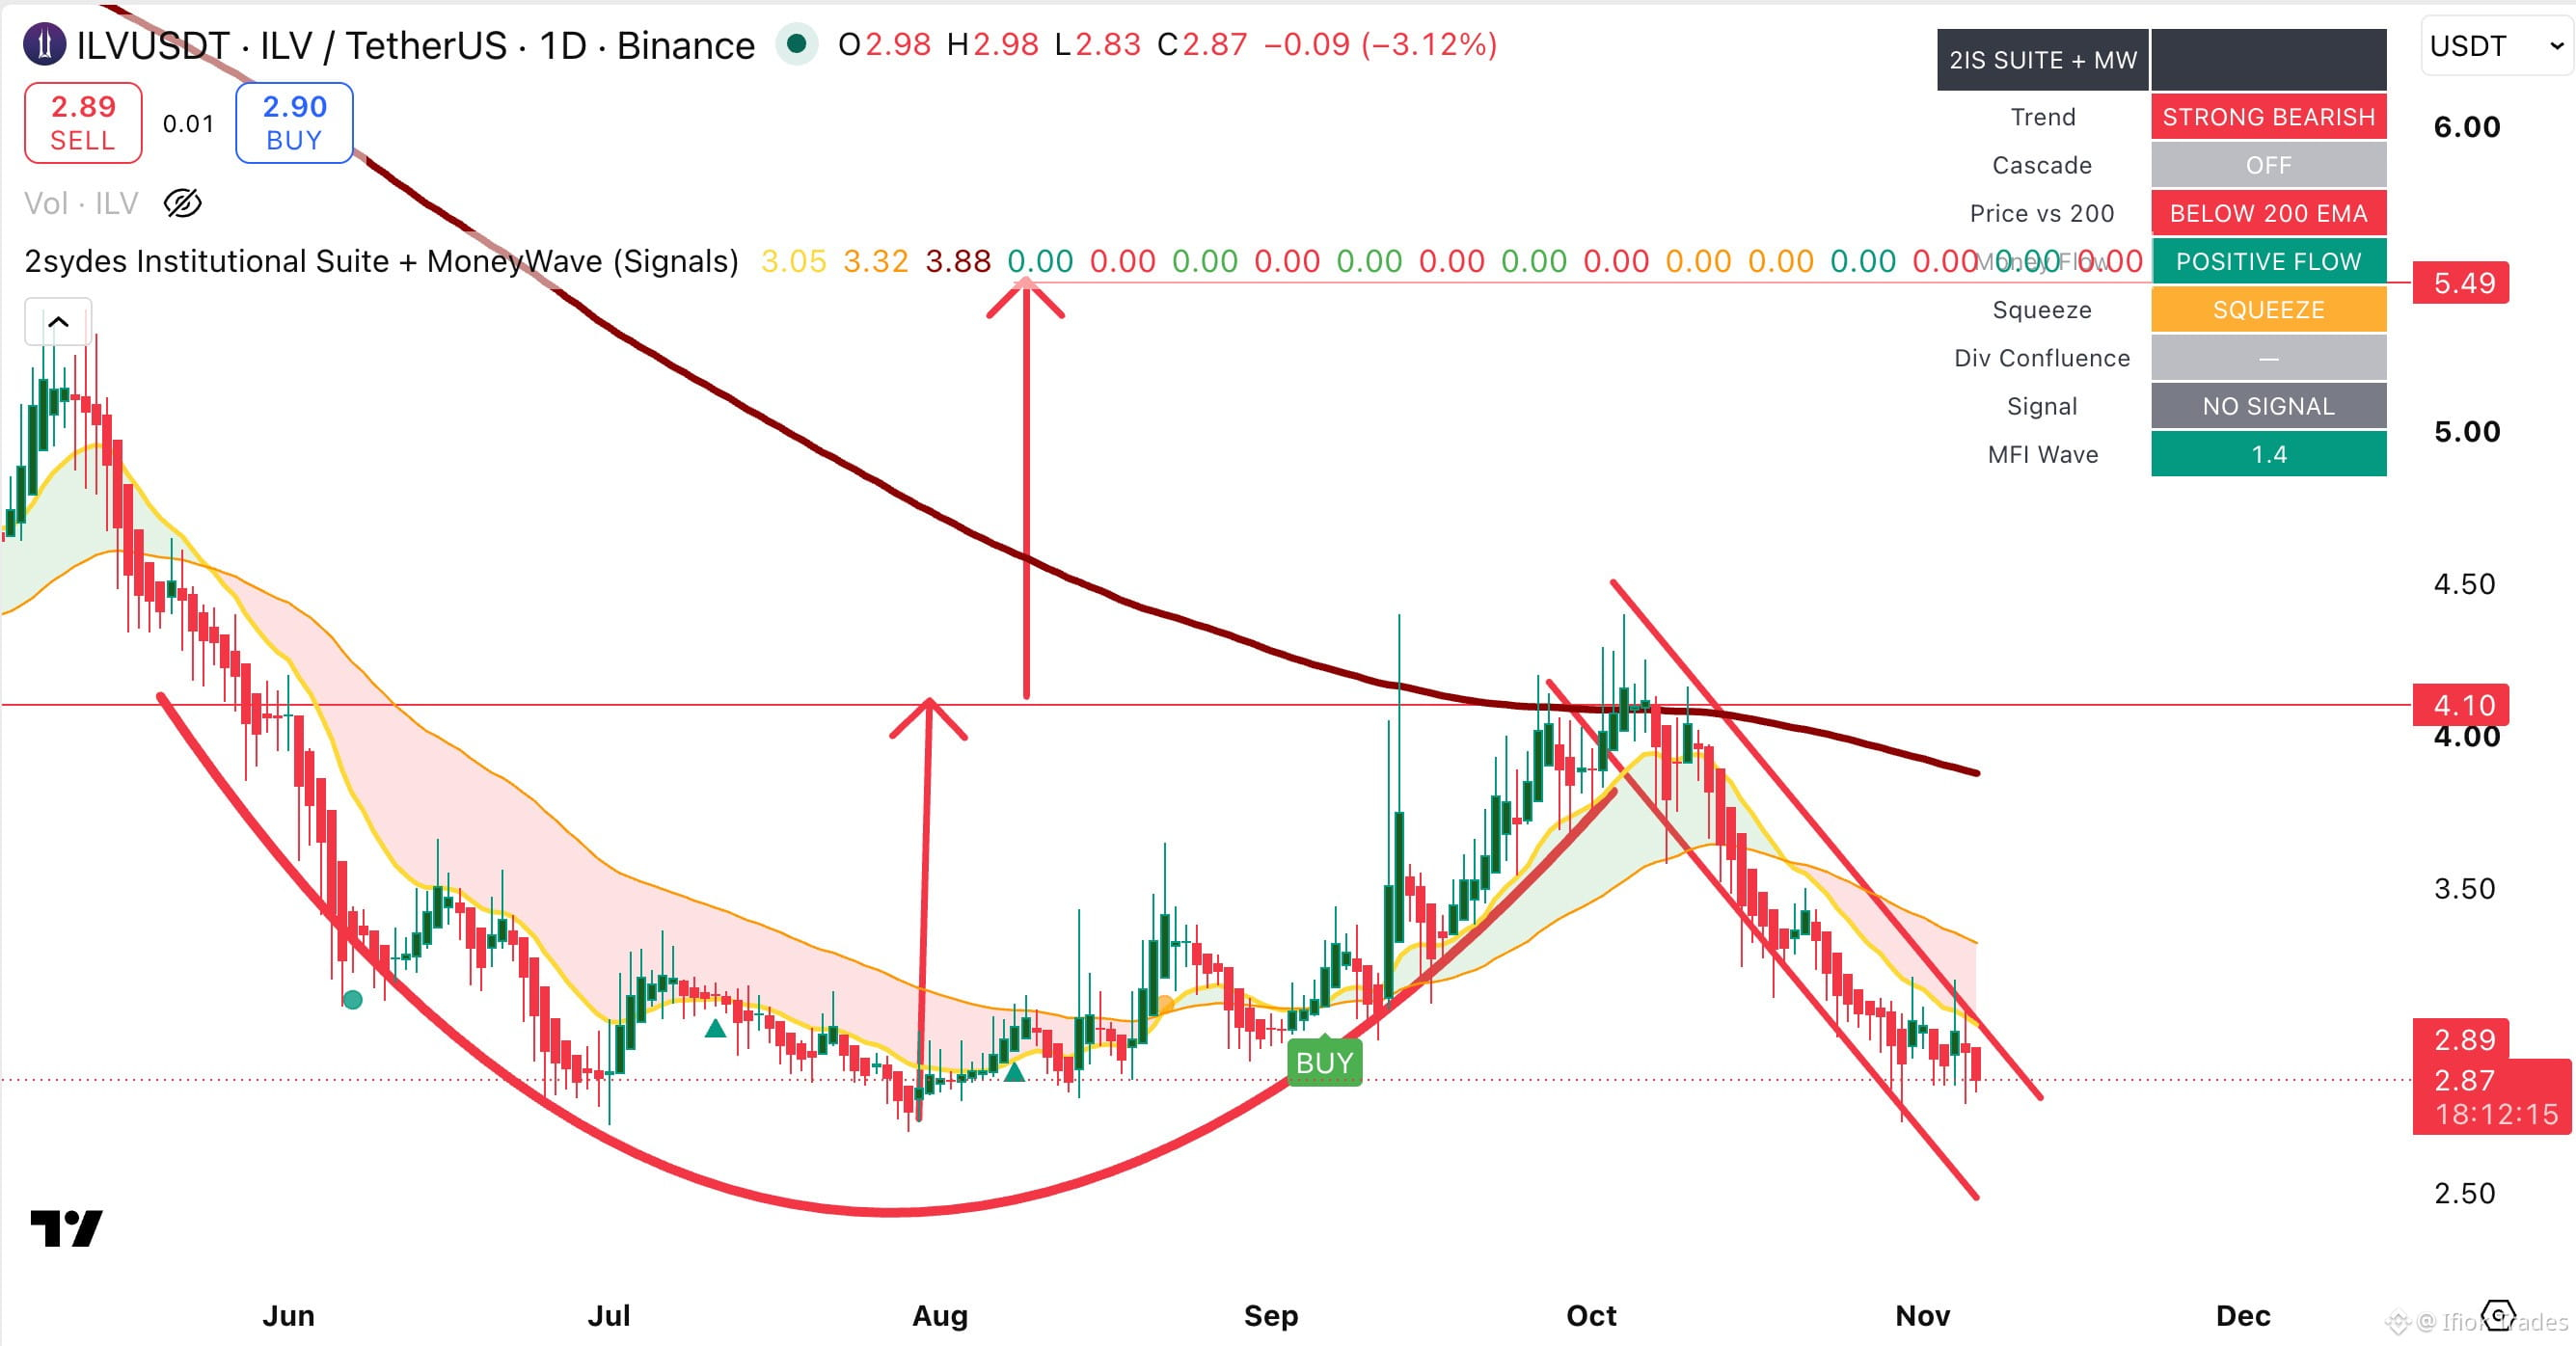
$ILV — From Rounded Bottom to Cup & Handle? 👀
{spot}(ILVUSDT)
The market has taken back virtually all the gains from ILV's previous rally after price was rejected at the $4.10 neckline resistance.
Now we're back at the $2.80–$2.90 base.
What was previously a rounded bottom could be evolving into a larger cup-and-handle formation, with the current decline potentially forming the handle.
🔍 Key levels:
$2.80–$2.90 — Critical support zone
$3.32 — Near-term resistance
$4.10 — Major neckline resistance
$5.49 — Potential target if the pattern confirms
What does 2Sydes say?
🔴 Trend: STRONG BEARISH
🟢 Money Flow: POSITIVE
🟠 Squeeze: ACTIVE
The bullish structure remains speculative. The handle needs to hold support, and price must eventually reclaim $4.10 to validate the pattern.
Is this another accumulation opportunity?
See what others miss. Trade with intelligence.
#ILV #CryptoTrading #TechnicalAnalysis #2Sydes
$ILV — From Rounded Bottom to Cup & Handle? 👀
The market has taken back virtually all the gains from ILV's previous rally after price was rejected at the $4.10 neckline resistance.
Now we're back at the $2.80–$2.90 base.
What was previously a rounded bottom could be evolving into a larger cup-and-handle formation, with the current decline potentially forming the handle.
🔍 Key levels:
$2.80–$2.90 — Critical support zone
$3.32 — Near-term resistance
$4.10 — Major neckline resistance
$5.49 — Potential target if the pattern confirms
What does 2Sydes say?
🔴 Trend: STRONG BEARISH
🟢 Money Flow: POSITIVE
🟠 Squeeze: ACTIVE
The bullish structure remains speculative. The handle needs to hold support, and price must eventually reclaim $4.10 to validate the pattern.
Is this another accumulation opportunity?
See what others miss. Trade with intelligence.
#ILV #CryptoTrading #TechnicalAnalysis #2Sydes
The market has taken back virtually all the gains from ILV's previous rally after price was rejected at the $4.10 neckline resistance.
Now we're back at the $2.80–$2.90 base.
What was previously a rounded bottom could be evolving into a larger cup-and-handle formation, with the current decline potentially forming the handle.
🔍 Key levels:
$2.80–$2.90 — Critical support zone
$3.32 — Near-term resistance
$4.10 — Major neckline resistance
$5.49 — Potential target if the pattern confirms
What does 2Sydes say?
🔴 Trend: STRONG BEARISH
🟢 Money Flow: POSITIVE
🟠 Squeeze: ACTIVE
The bullish structure remains speculative. The handle needs to hold support, and price must eventually reclaim $4.10 to validate the pattern.
Is this another accumulation opportunity?
See what others miss. Trade with intelligence.
#ILV #CryptoTrading #TechnicalAnalysis #2Sydes
4
5
1.1k
·
--
Bullish
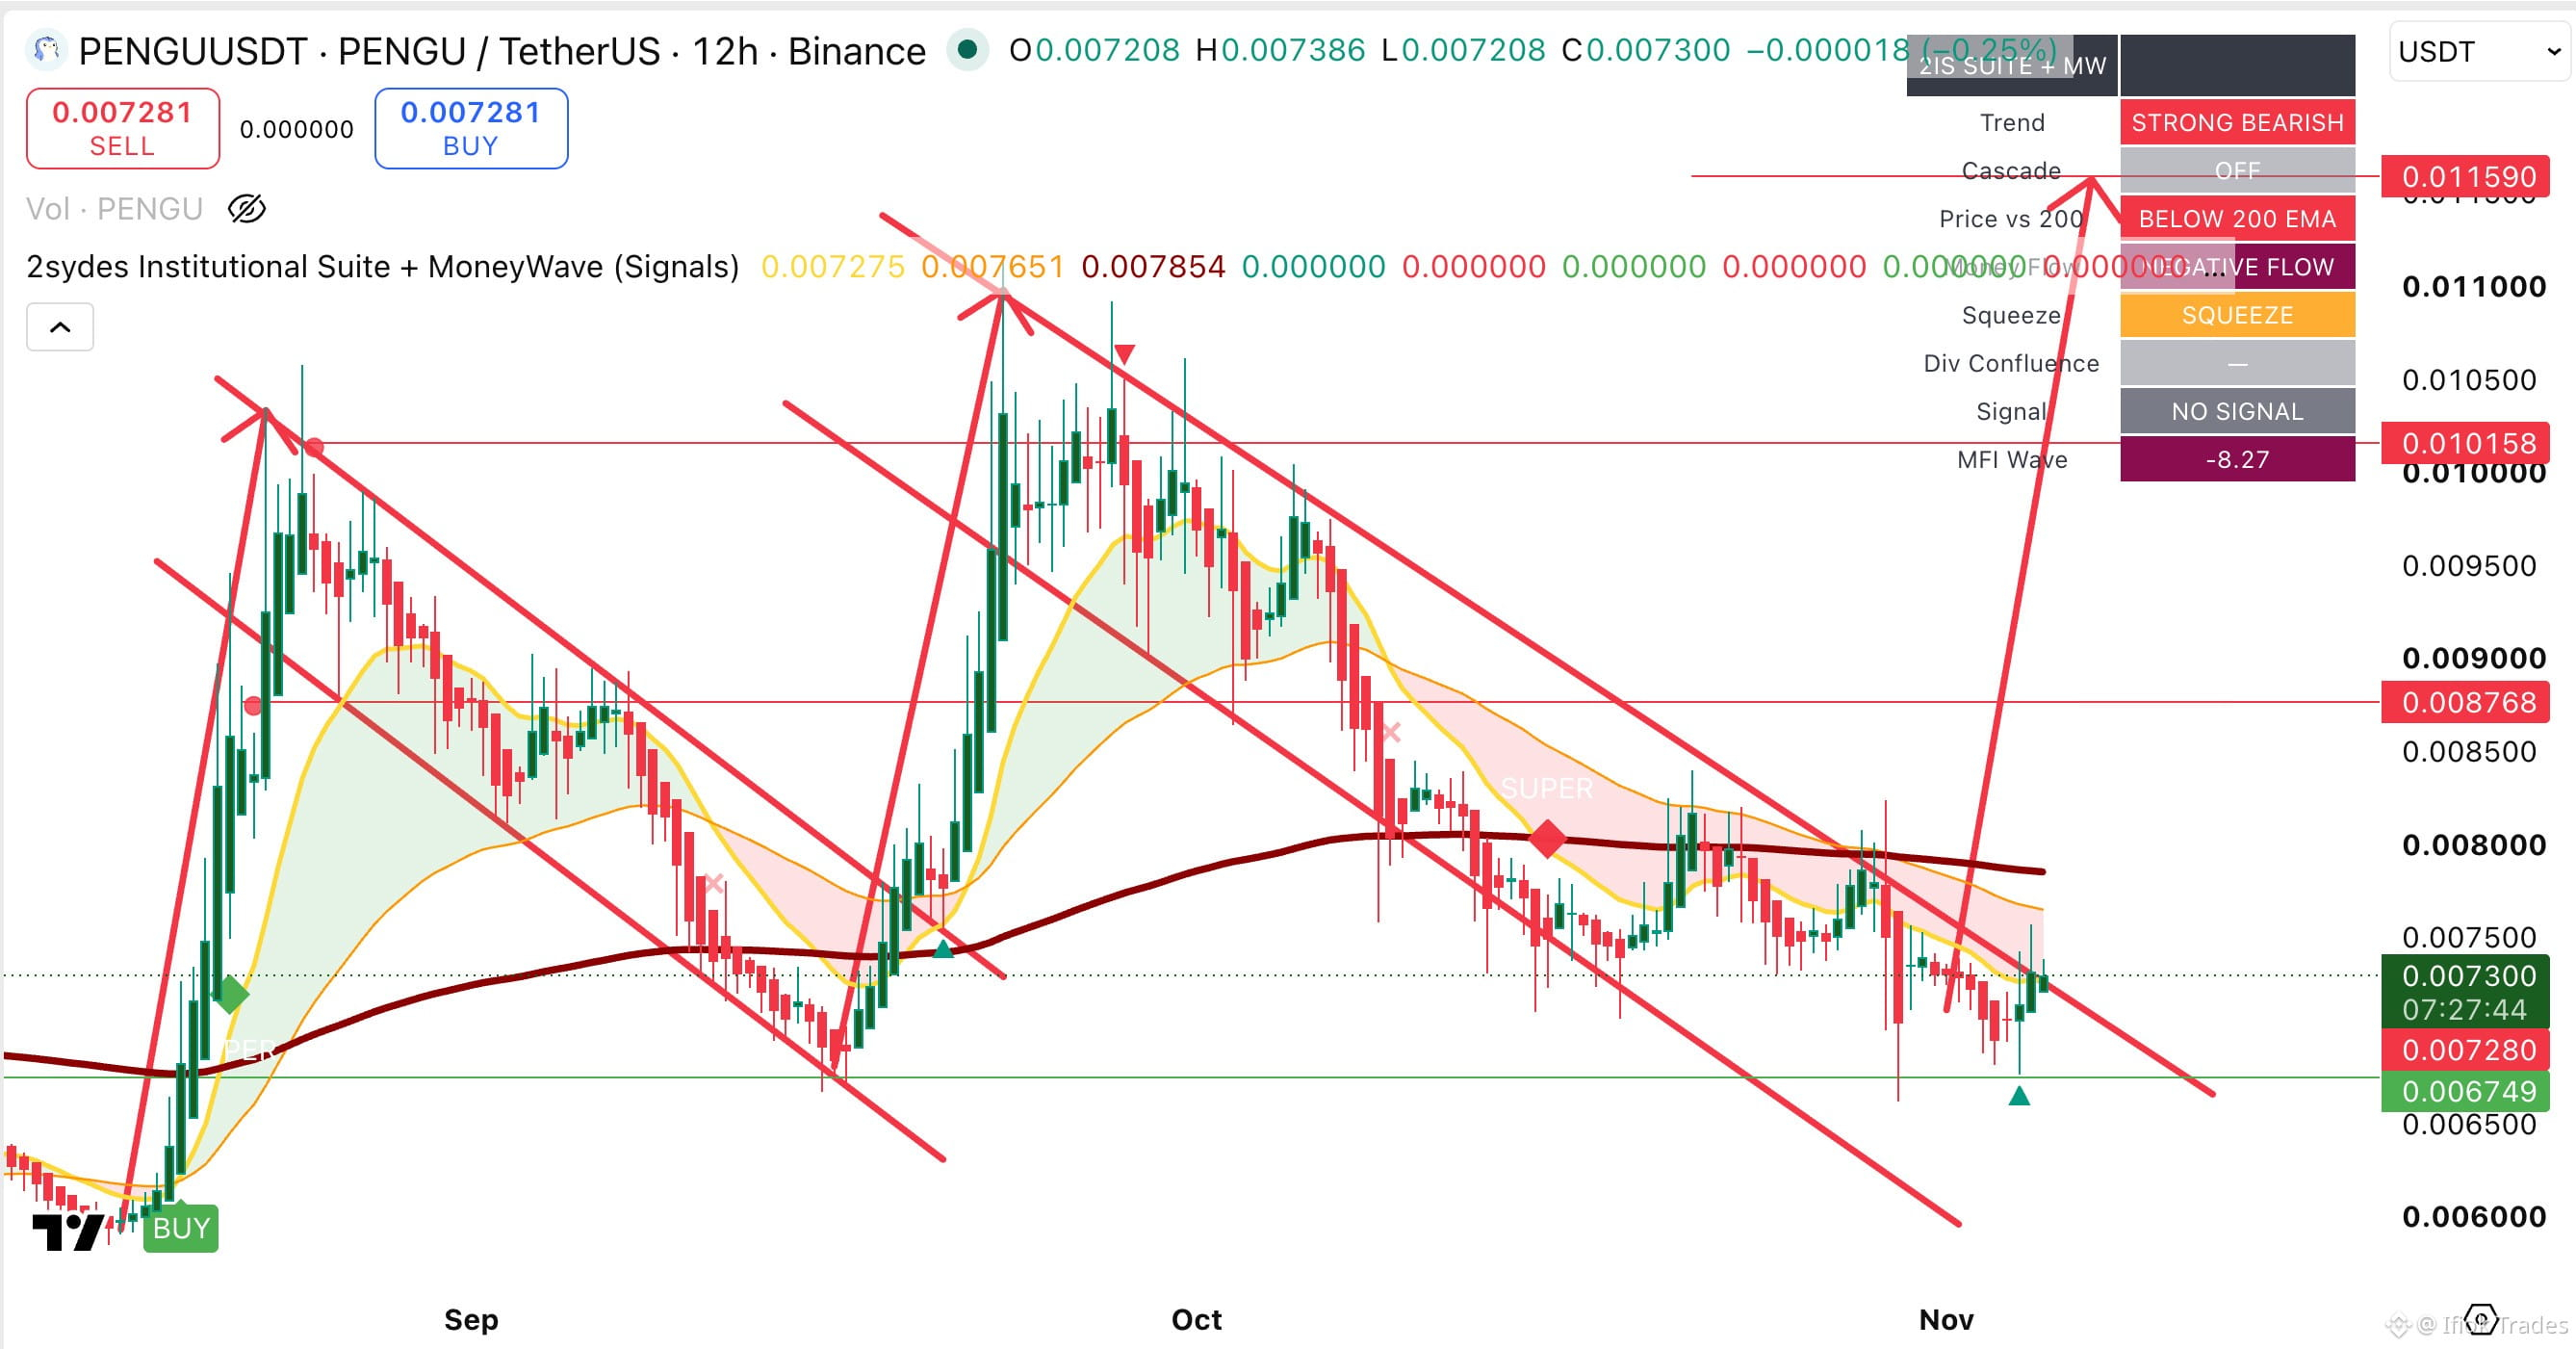
$PENGU — Lower Prices, Stronger Bullish Signal? 🚀
In my previous analysis, PENGU was trading around $0.00782, with a potential bullish reversal developing.
Price went lower, testing the strong $0.00675 support zone.
But something important has changed. 👀
🟢 The 2Sydes Pivot Up Arrow has now appeared, confirming a bullish pivot signal near support.
This is particularly interesting because previous rallies also emerged from descending channels.
🎯 Levels to watch:
$0.00785–$0.00877 — Resistance zone
$0.01016 — Bullish target
$0.01159 — Extended target
⚠️ The broader trend remains STRONG BEARISH. A breakout above the descending channel is still needed to confirm a structural reversal.
The pivot signal is confirmed. The bullish breakout isn't — yet.
Will history repeat itself?
See what others miss. Trade with intelligence.
#PENGU #cryptotrading #2Sydes
$PENGU — Lower Prices, Stronger Bullish Signal? 🚀
In my previous analysis, PENGU was trading around $0.00782, with a potential bullish reversal developing.
Price went lower, testing the strong $0.00675 support zone.
But something important has changed. 👀
🟢 The 2Sydes Pivot Up Arrow has now appeared, confirming a bullish pivot signal near support.
This is particularly interesting because previous rallies also emerged from descending channels.
🎯 Levels to watch:
$0.00785–$0.00877 — Resistance zone
$0.01016 — Bullish target
$0.01159 — Extended target
⚠️ The broader trend remains STRONG BEARISH. A breakout above the descending channel is still needed to confirm a structural reversal.
The pivot signal is confirmed. The bullish breakout isn't — yet.
Will history repeat itself?
See what others miss. Trade with intelligence.
#PENGU #cryptotrading #2Sydes
In my previous analysis, PENGU was trading around $0.00782, with a potential bullish reversal developing.
Price went lower, testing the strong $0.00675 support zone.
But something important has changed. 👀
🟢 The 2Sydes Pivot Up Arrow has now appeared, confirming a bullish pivot signal near support.
This is particularly interesting because previous rallies also emerged from descending channels.
🎯 Levels to watch:
$0.00785–$0.00877 — Resistance zone
$0.01016 — Bullish target
$0.01159 — Extended target
⚠️ The broader trend remains STRONG BEARISH. A breakout above the descending channel is still needed to confirm a structural reversal.
The pivot signal is confirmed. The bullish breakout isn't — yet.
Will history repeat itself?
See what others miss. Trade with intelligence.
#PENGU #cryptotrading #2Sydes
Ifiok Trades
·
--
Bullish$PENGU
Is a fractal about to repeat? I'm LONG #pengu
Follow for more... See what others Miss!
Is a fractal about to repeat? I'm LONG #pengu
Follow for more... See what others Miss!
4
853
·
--
Bullish
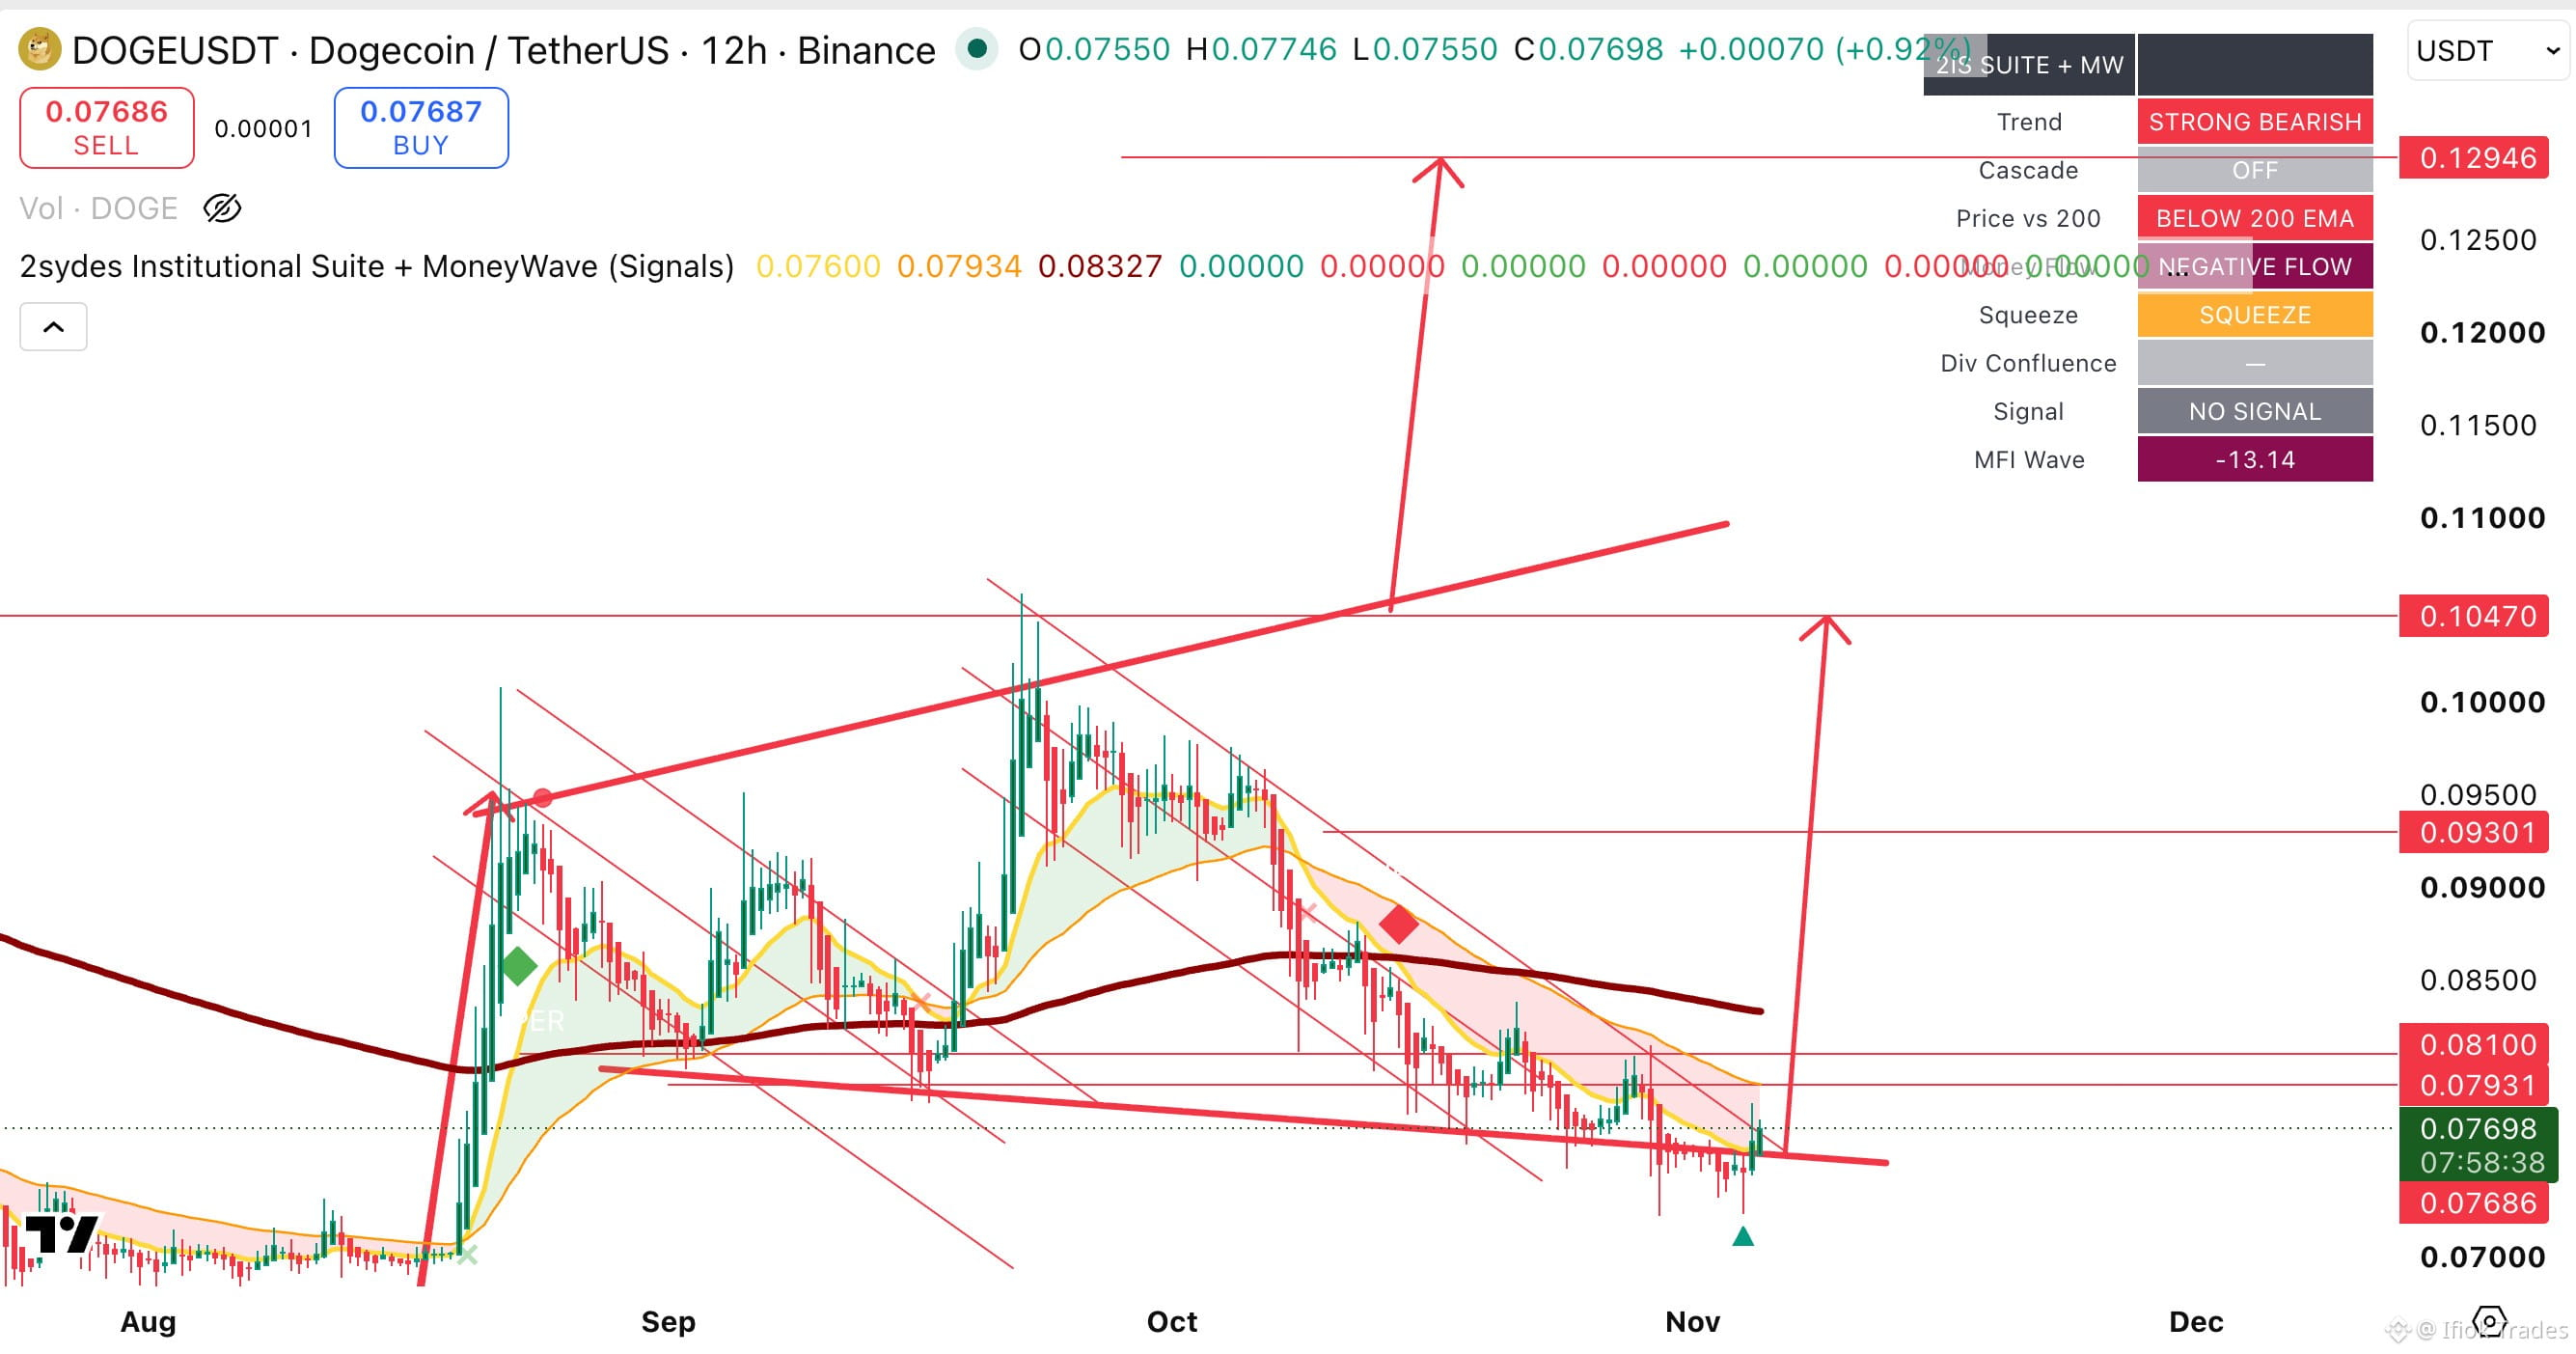
$DOGE — Is Another Major Rally Brewing? 🚀
DOGE is testing a critical support zone around $0.0768 on 12hr, with a potential breakout from its declining structure.
The chart suggests a possible repeat of the previous bullish move, but confirmation is still needed.
🎯 Key levels to watch:
$0.0793–$0.0810 — First resistance
$0.0930 — Breakout confirmation zone
$0.1047 — Next major target
$0.1295 — Extended bullish target
🔍 What does 2Sydes say?
Trend: STRONG BEARISH
Money Flow: NEGATIVE
Squeeze: ACTIVE
Pivot Up Arrow: Appearing near support
The opportunity? An early reversal may be developing, but the bearish trend hasn't changed yet.
A sustained break below $0.0768 is INVALIDATION!.
See what others miss. Trade with intelligence.
#Doge🚀🚀🚀 #DOGECOİN #CryptoTrading #2Sydes
$DOGE — Is Another Major Rally Brewing? 🚀
DOGE is testing a critical support zone around $0.0768 on 12hr, with a potential breakout from its declining structure.
The chart suggests a possible repeat of the previous bullish move, but confirmation is still needed.
🎯 Key levels to watch:
$0.0793–$0.0810 — First resistance
$0.0930 — Breakout confirmation zone
$0.1047 — Next major target
$0.1295 — Extended bullish target
🔍 What does 2Sydes say?
Trend: STRONG BEARISH
Money Flow: NEGATIVE
Squeeze: ACTIVE
Pivot Up Arrow: Appearing near support
The opportunity? An early reversal may be developing, but the bearish trend hasn't changed yet.
A sustained break below $0.0768 is INVALIDATION!.
See what others miss. Trade with intelligence.
#Doge🚀🚀🚀 #DOGECOİN #CryptoTrading #2Sydes
DOGE is testing a critical support zone around $0.0768 on 12hr, with a potential breakout from its declining structure.
The chart suggests a possible repeat of the previous bullish move, but confirmation is still needed.
🎯 Key levels to watch:
$0.0793–$0.0810 — First resistance
$0.0930 — Breakout confirmation zone
$0.1047 — Next major target
$0.1295 — Extended bullish target
🔍 What does 2Sydes say?
Trend: STRONG BEARISH
Money Flow: NEGATIVE
Squeeze: ACTIVE
Pivot Up Arrow: Appearing near support
The opportunity? An early reversal may be developing, but the bearish trend hasn't changed yet.
A sustained break below $0.0768 is INVALIDATION!.
See what others miss. Trade with intelligence.
#Doge🚀🚀🚀 #DOGECOİN #CryptoTrading #2Sydes
1
501
·
--
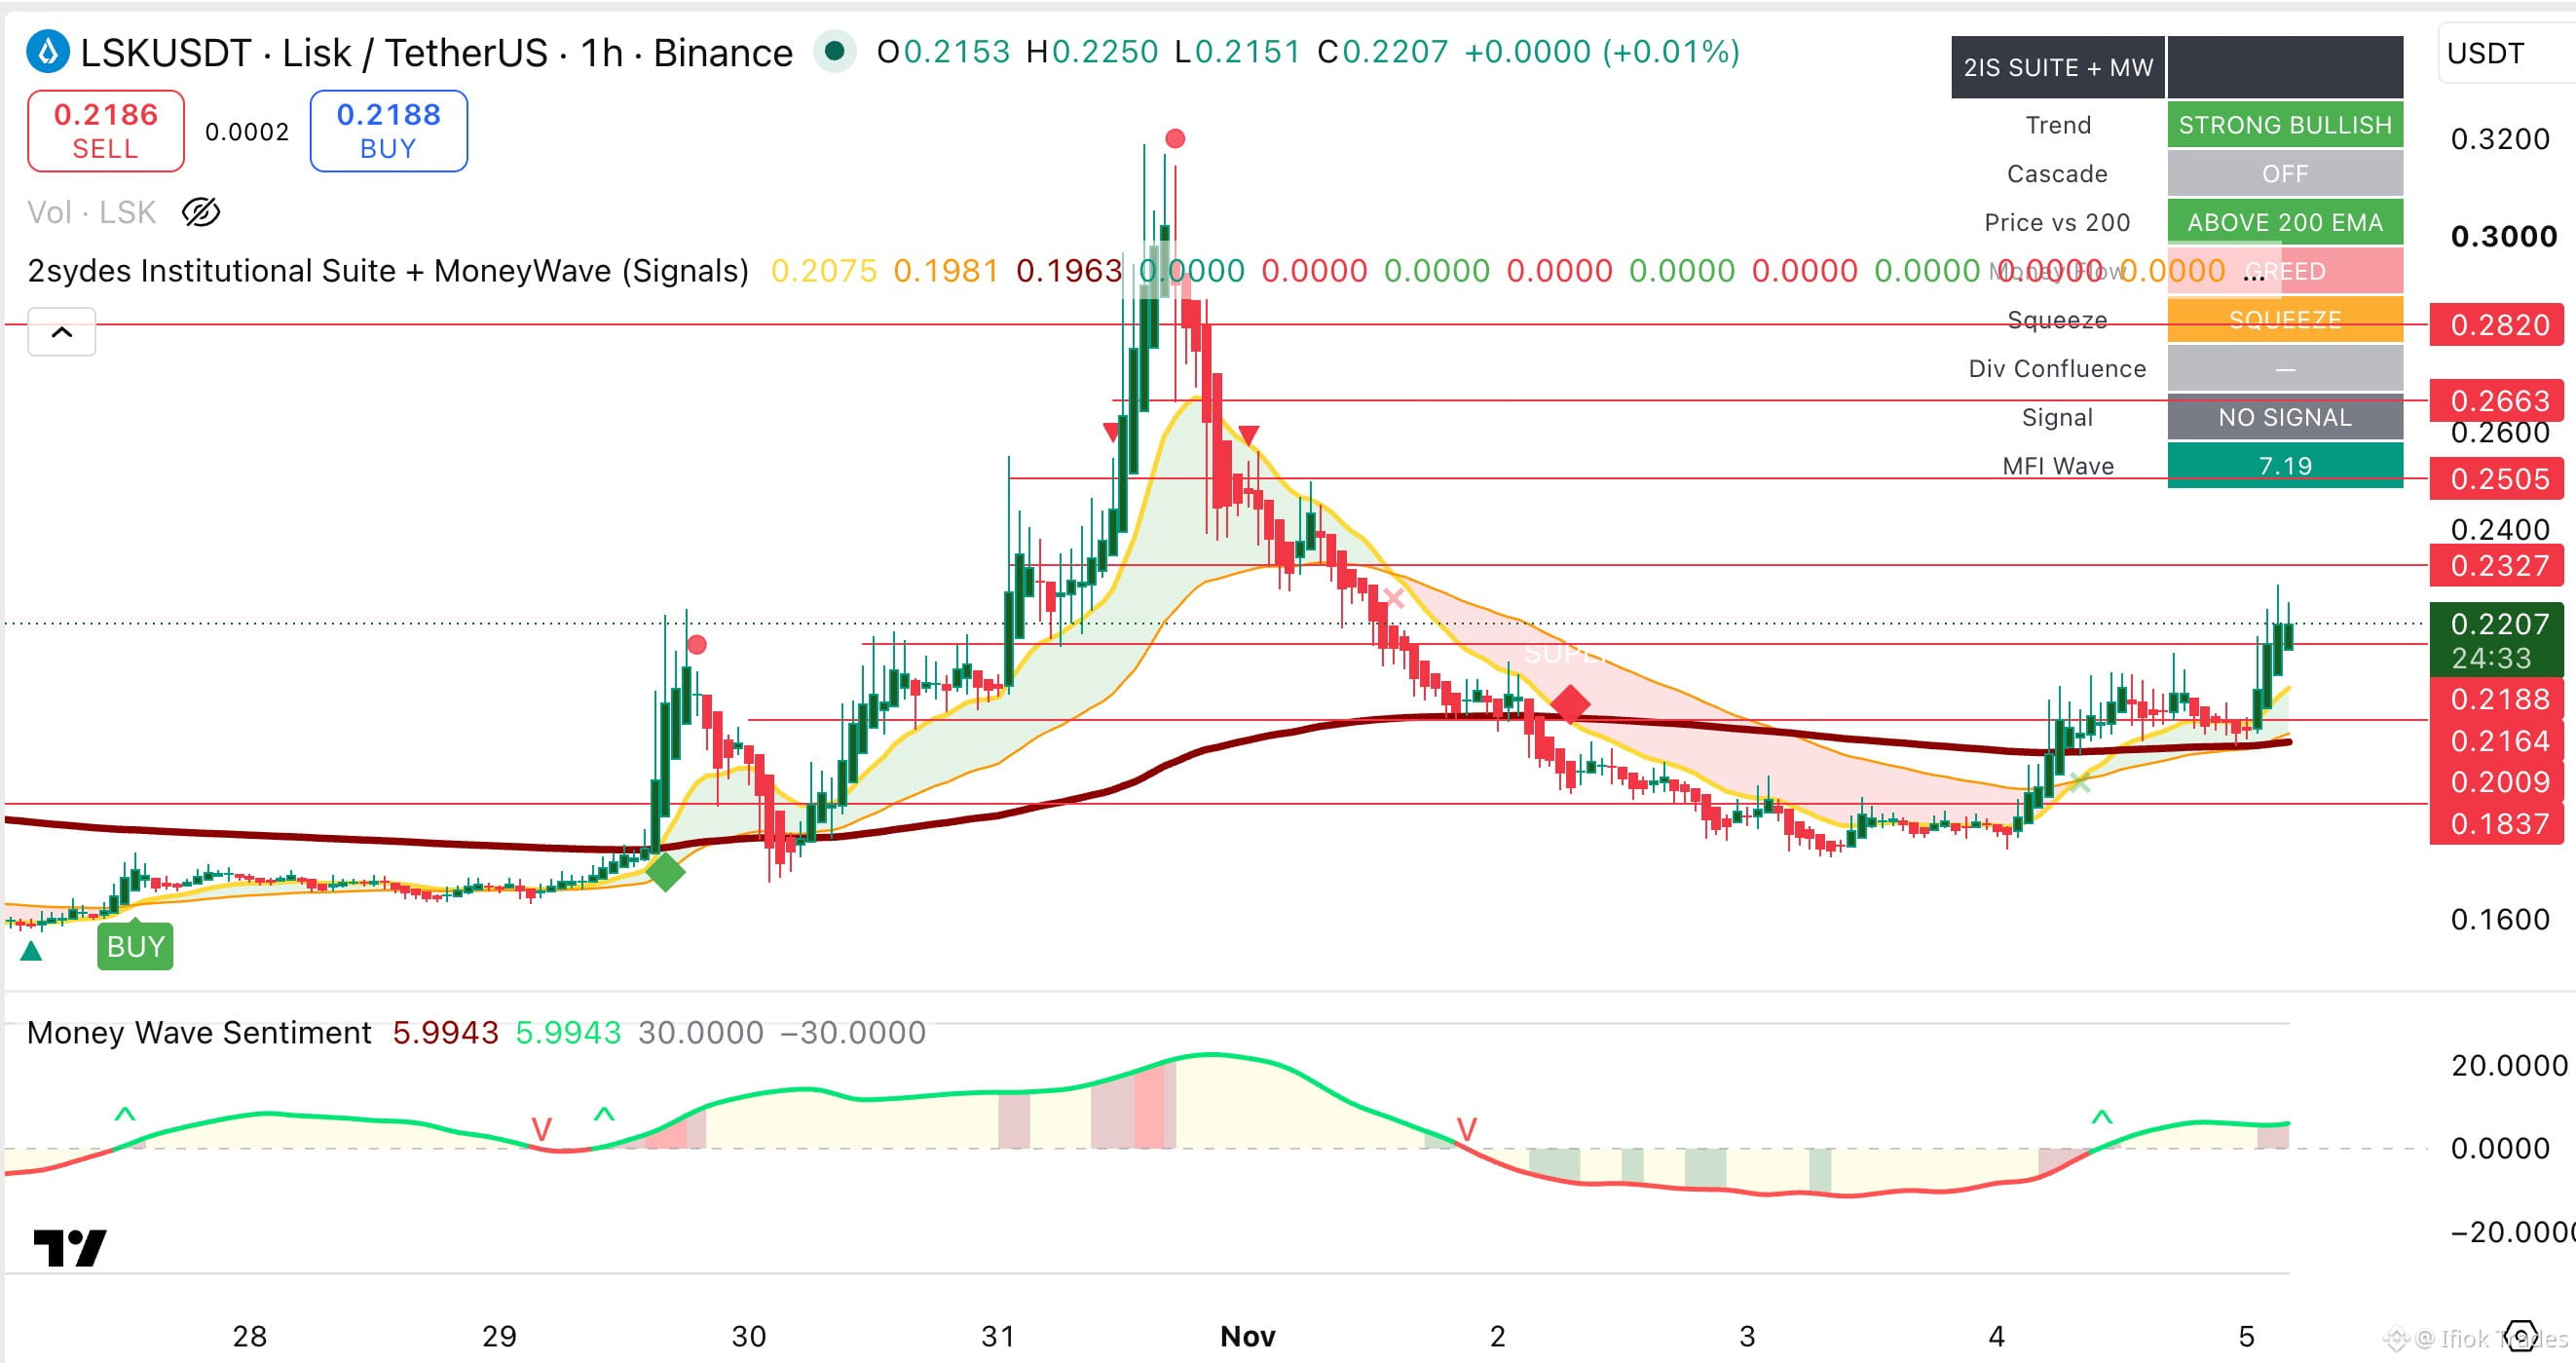
$LSK still moving up from recovery...
{spot}(LSKUSDT)
$LSK still moving up from recovery...
Ifiok Trades
·
--
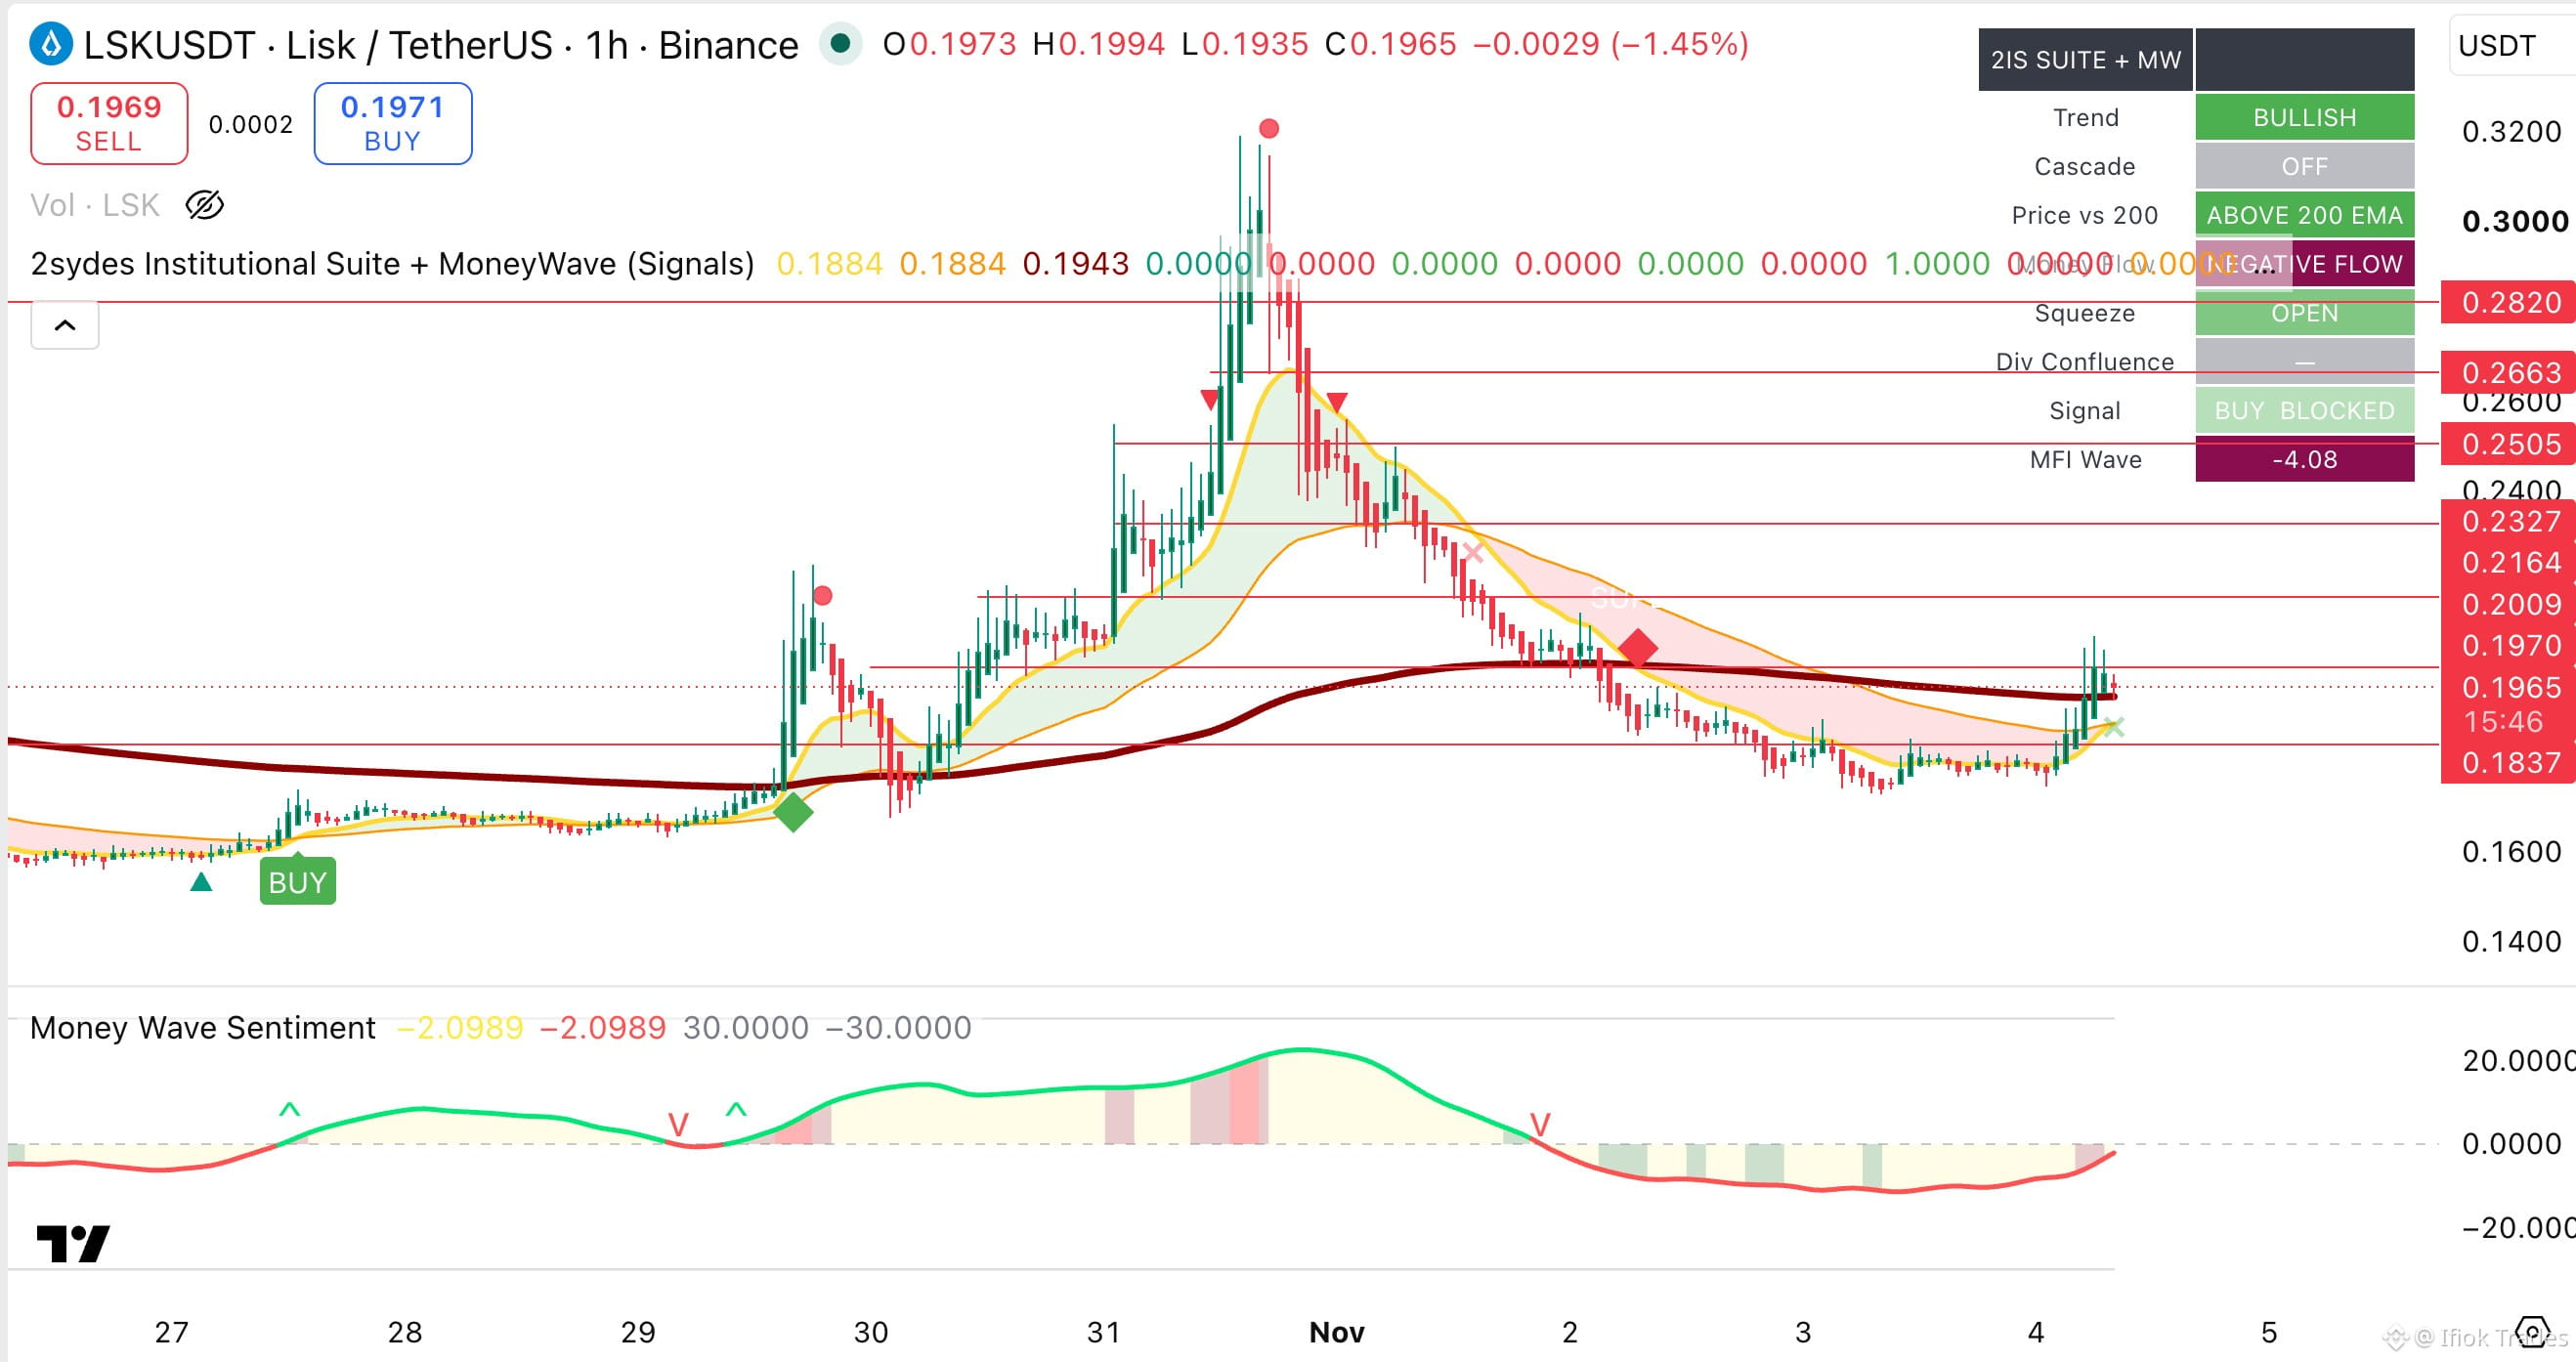
Bullish$LSK in recovery...
Up from here 0.197 through the levels
My invalidation lives under 0.183
#LSK
Up from here 0.197 through the levels
My invalidation lives under 0.183
#LSK
1
503
·
--
I am a more profitable SPOT trader than FUTURES trader....
The facts are that Futures trading requires alot more RULES than SPOT!
If you must trade futures, Be ready to stick to laid down rules. If you cant follow those rules, You will ALWAYS lose money in Futures. Better yet do only SPOT TRADING!
Note to Self!
I am a more profitable SPOT trader than FUTURES trader....
The facts are that Futures trading requires alot more RULES than SPOT!
If you must trade futures, Be ready to stick to laid down rules. If you cant follow those rules, You will ALWAYS lose money in Futures. Better yet do only SPOT TRADING!
Note to Self!
The facts are that Futures trading requires alot more RULES than SPOT!
If you must trade futures, Be ready to stick to laid down rules. If you cant follow those rules, You will ALWAYS lose money in Futures. Better yet do only SPOT TRADING!
Note to Self!
1
232
·
--
Bullish
$BTC
{spot}(BTCUSDT)
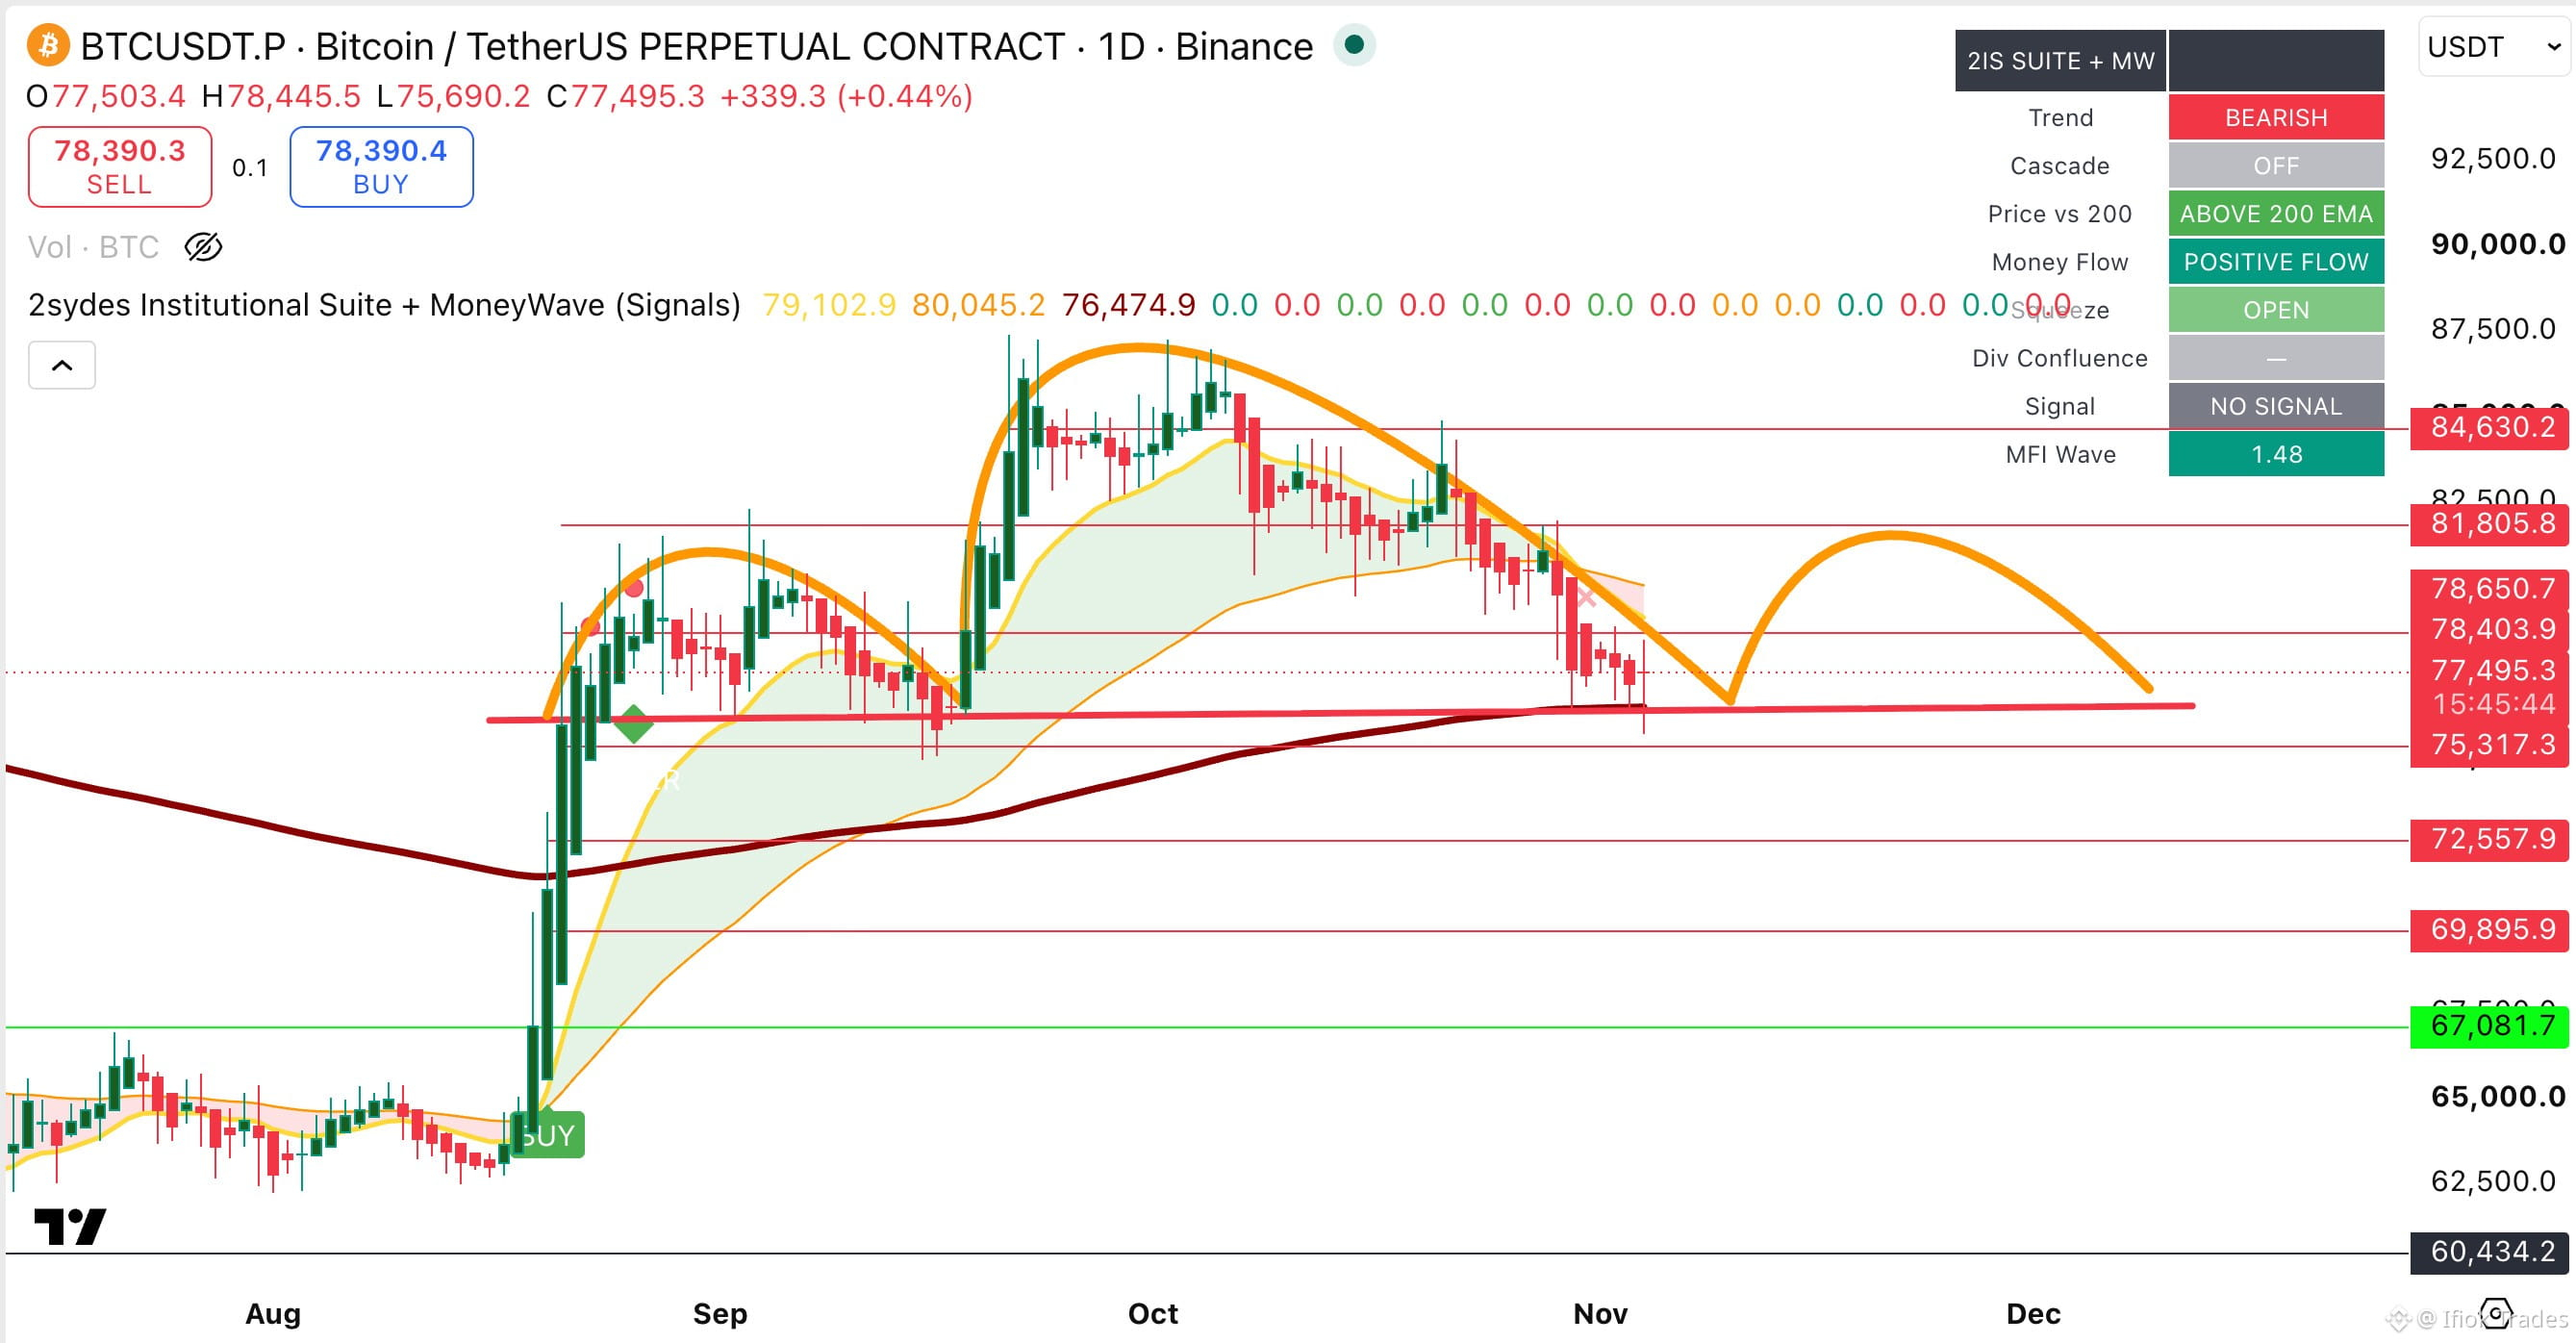
— Is Bitcoin Preparing to Form Its Right Shoulder? 👀
A potential Head & Shoulders pattern is developing on Bitcoin's daily chart at 78k.
The left shoulder and head are already visible. What's missing? The right shoulder.
Here's what I'm watching:
🟢 Hold $76,500–$75,300 → Potential bounce towards $81,000–$82,000 to form the right shoulder.
🔴 Break below $75,300 → INVALIDATION.
What does 2Sydes say?
• Trend: BEARISH 🔴
• Money Flow: POSITIVE 🟢
• Price: ABOVE 200 EMA 🟢
The interesting possibility is a short-term bullish rebound within a developing bearish reversal structure.
Could BTC rally towards $81K before its next major move?
#BTC #Bitcoin #TechnicalAnalysis #2Sydes
$BTC
— Is Bitcoin Preparing to Form Its Right Shoulder? 👀
A potential Head & Shoulders pattern is developing on Bitcoin's daily chart at 78k.
The left shoulder and head are already visible. What's missing? The right shoulder.
Here's what I'm watching:
🟢 Hold $76,500–$75,300 → Potential bounce towards $81,000–$82,000 to form the right shoulder.
🔴 Break below $75,300 → INVALIDATION.
What does 2Sydes say?
• Trend: BEARISH 🔴
• Money Flow: POSITIVE 🟢
• Price: ABOVE 200 EMA 🟢
The interesting possibility is a short-term bullish rebound within a developing bearish reversal structure.
Could BTC rally towards $81K before its next major move?
#BTC #Bitcoin #TechnicalAnalysis #2Sydes
— Is Bitcoin Preparing to Form Its Right Shoulder? 👀
A potential Head & Shoulders pattern is developing on Bitcoin's daily chart at 78k.
The left shoulder and head are already visible. What's missing? The right shoulder.
Here's what I'm watching:
🟢 Hold $76,500–$75,300 → Potential bounce towards $81,000–$82,000 to form the right shoulder.
🔴 Break below $75,300 → INVALIDATION.
What does 2Sydes say?
• Trend: BEARISH 🔴
• Money Flow: POSITIVE 🟢
• Price: ABOVE 200 EMA 🟢
The interesting possibility is a short-term bullish rebound within a developing bearish reversal structure.
Could BTC rally towards $81K before its next major move?
#BTC #Bitcoin #TechnicalAnalysis #2Sydes
8
1
6
3.1k
·
--
Bullish
Ifiok Trades
·
--
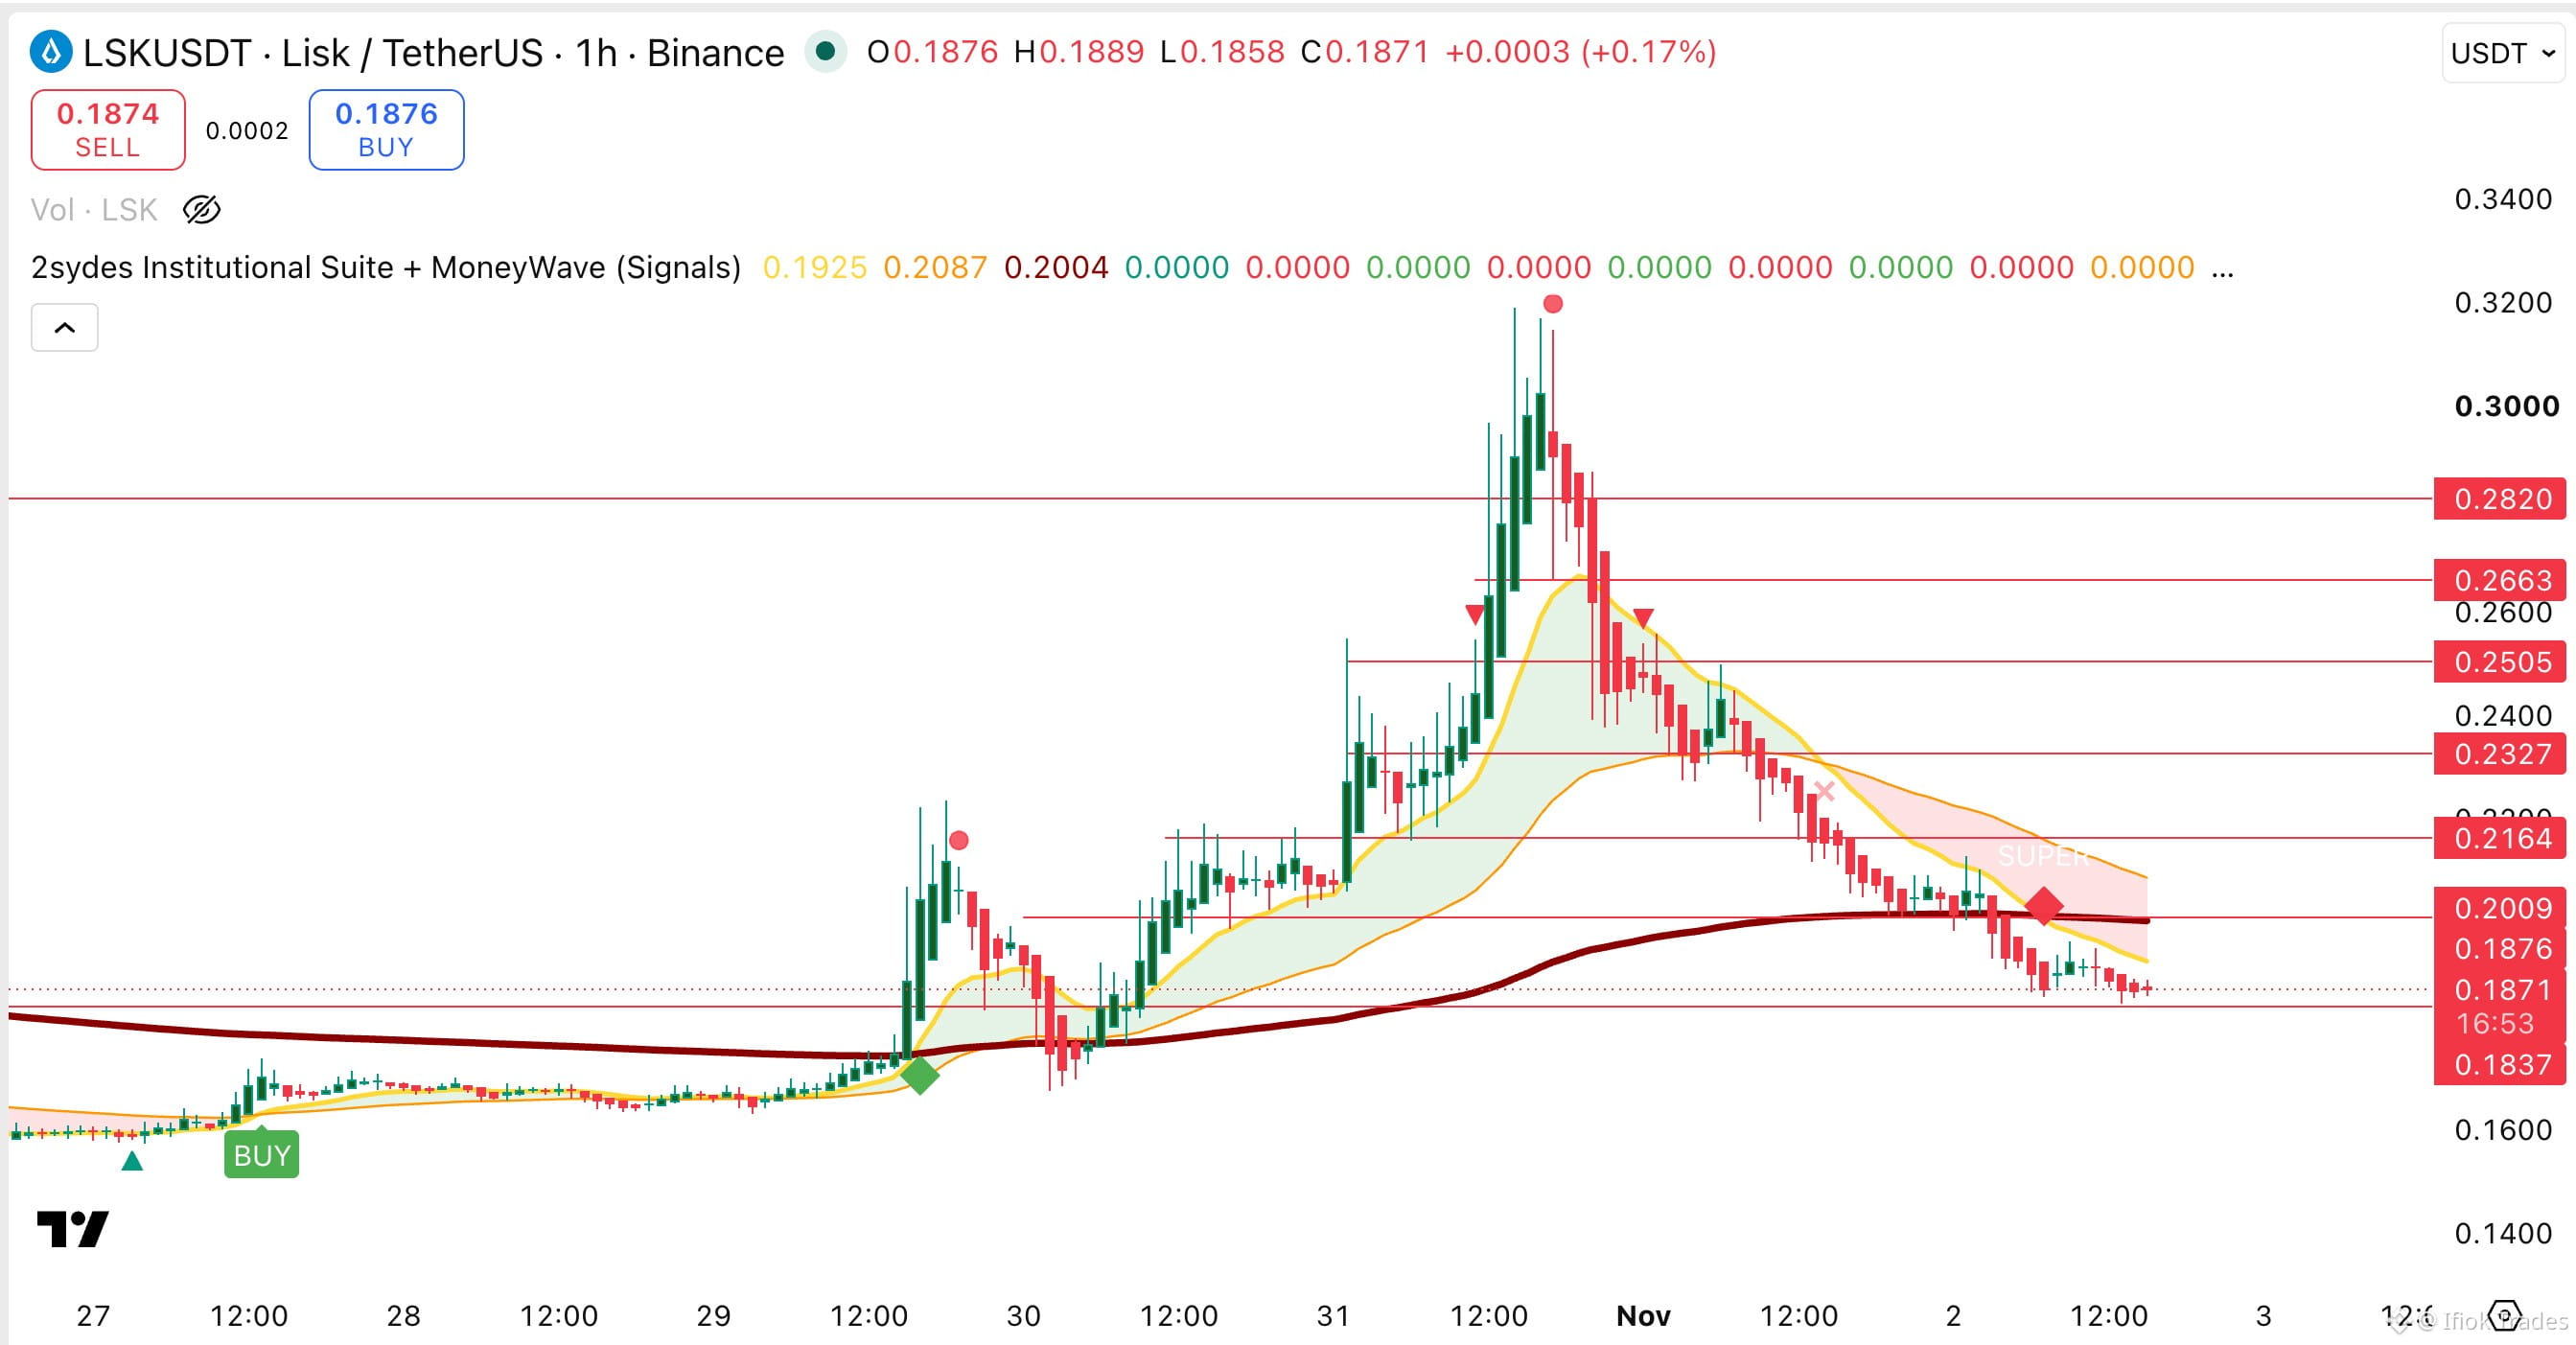
$LSK even though Lisk has puked it's guts in the past few days.. the daily timeframe form is bullish...
I'm watching these levels!!
#LSK👍
I'm watching these levels!!
#LSK👍
1
1
434
·
--
$LSK even though Lisk has puked it's guts in the past few days.. the daily timeframe form is bullish...
I'm watching these levels!!
#LSK👍
{spot}(LSKUSDT)
$LSK even though Lisk has puked it's guts in the past few days.. the daily timeframe form is bullish...
I'm watching these levels!!
#LSK👍
I'm watching these levels!!
#LSK👍
1
3
1k
·
--
INVALIDATED!
INVALIDATED!
Ifiok Trades
·
--
Bullish$PENGU
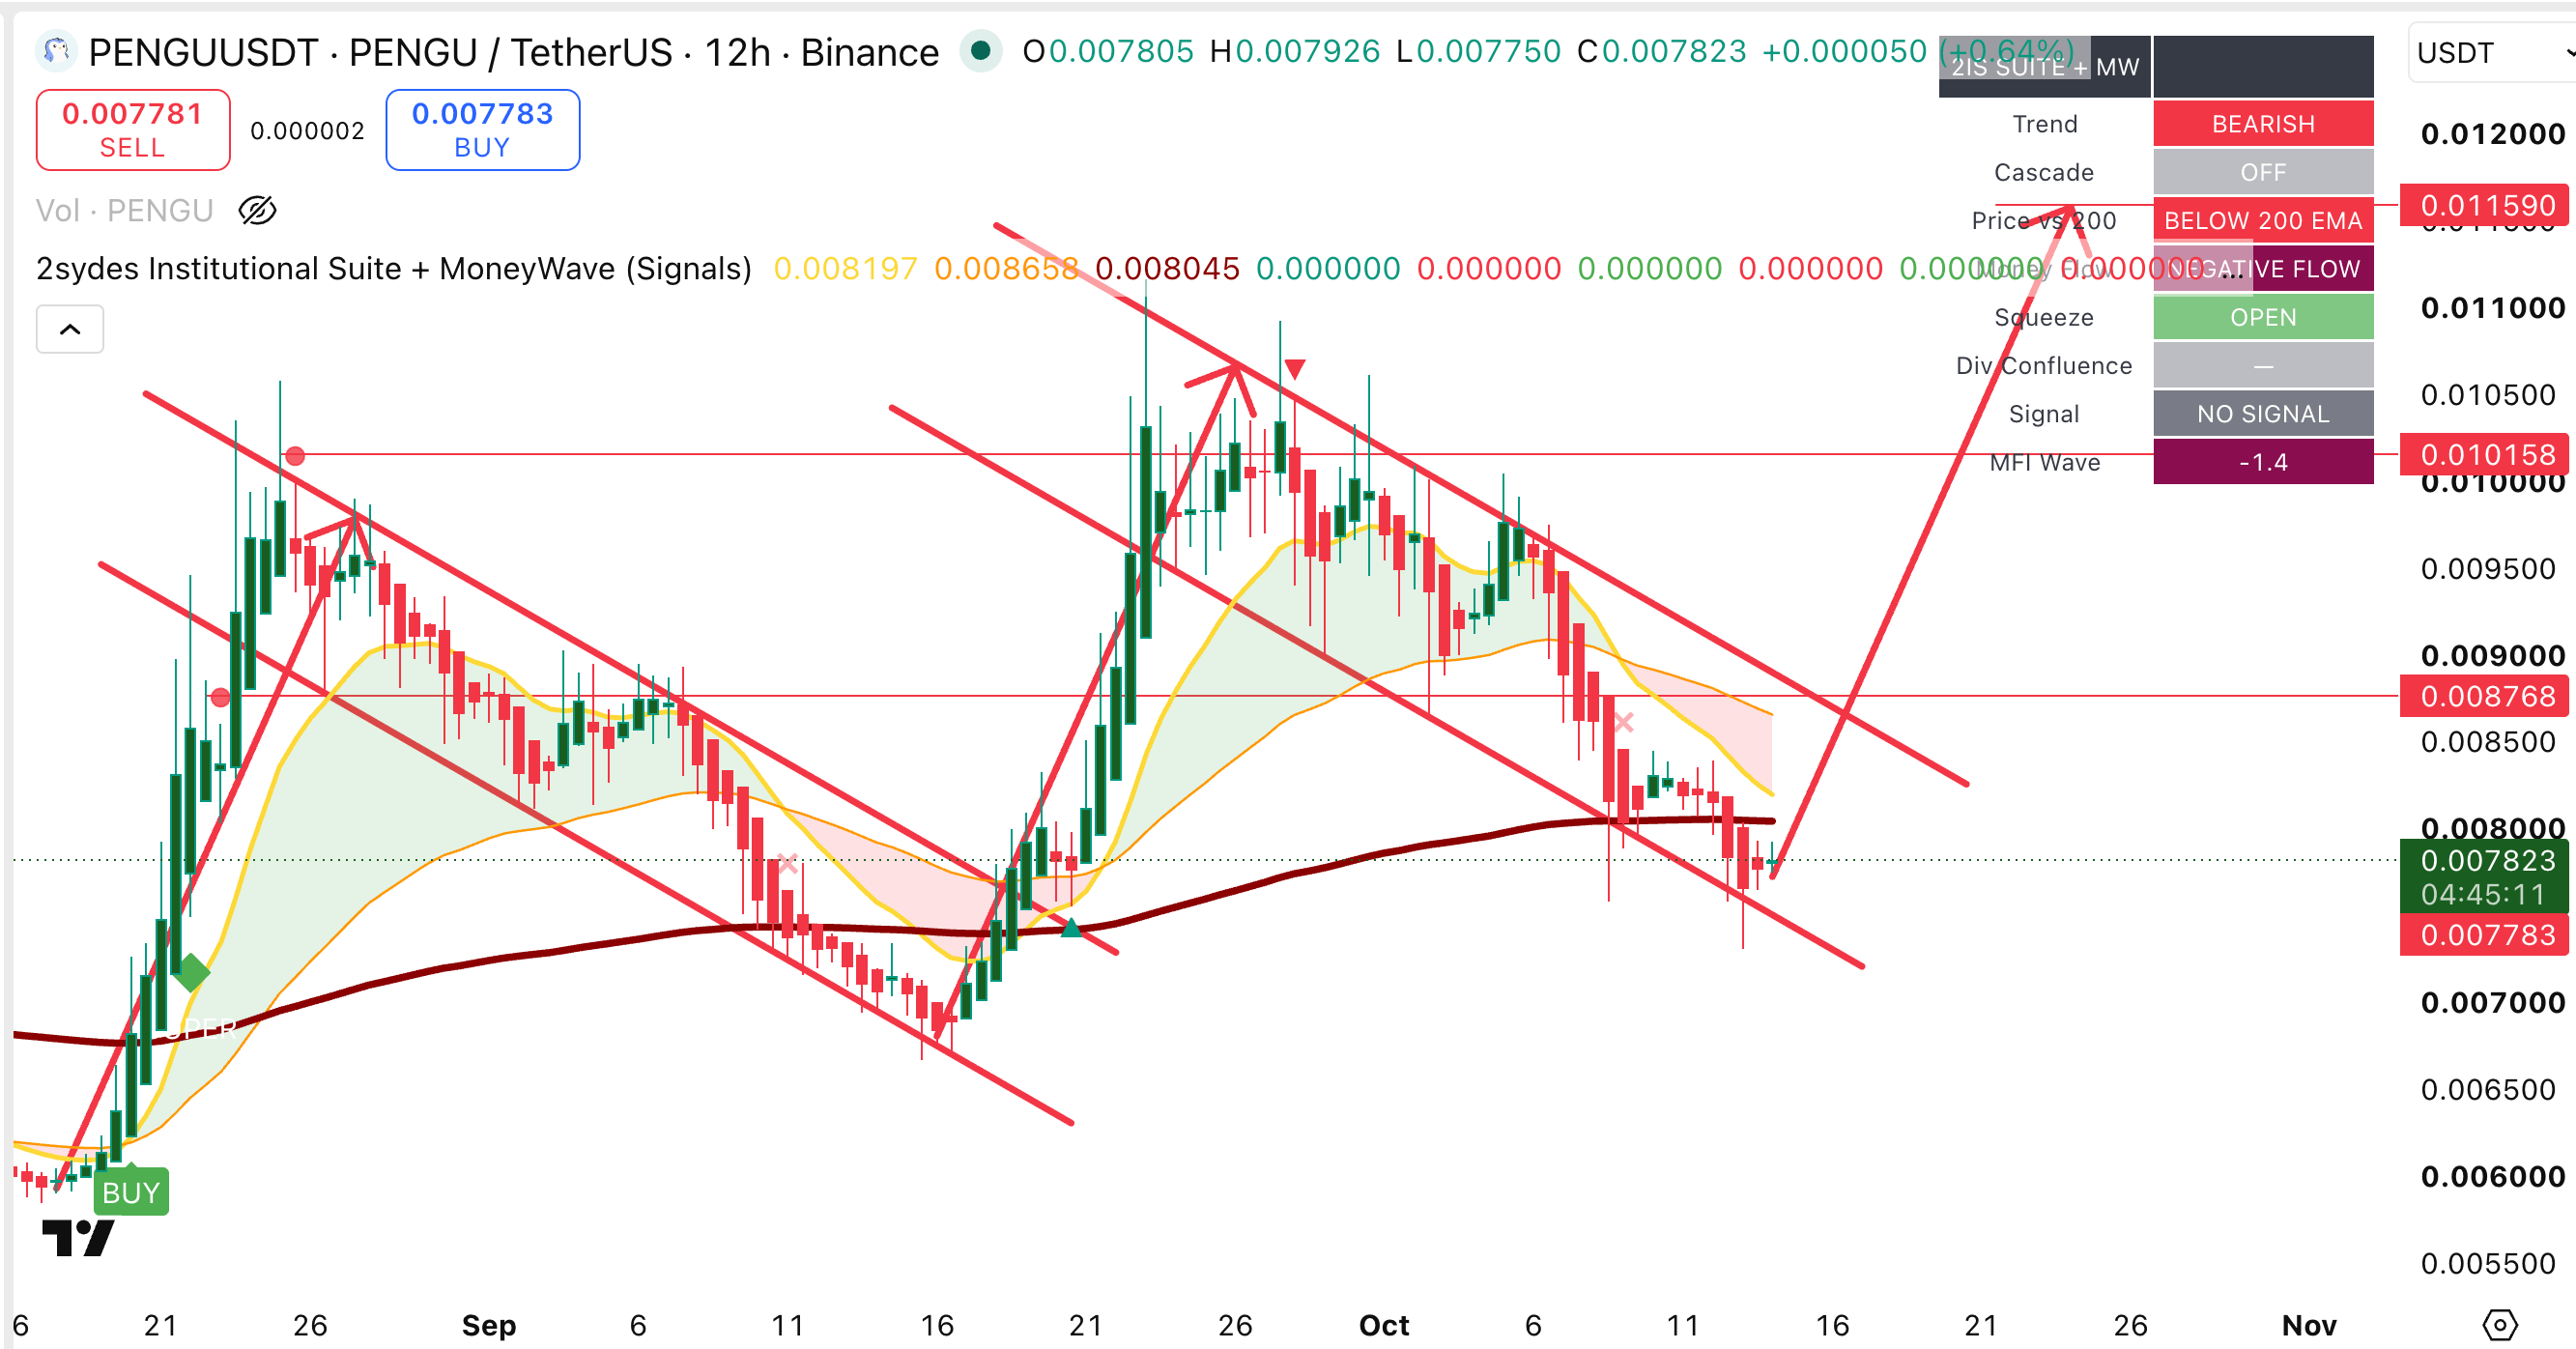
Is a fractal about to repeat? I'm LONG #pengu
Follow for more... See what others Miss!
Is a fractal about to repeat? I'm LONG #pengu
Follow for more... See what others Miss!
91
·
--
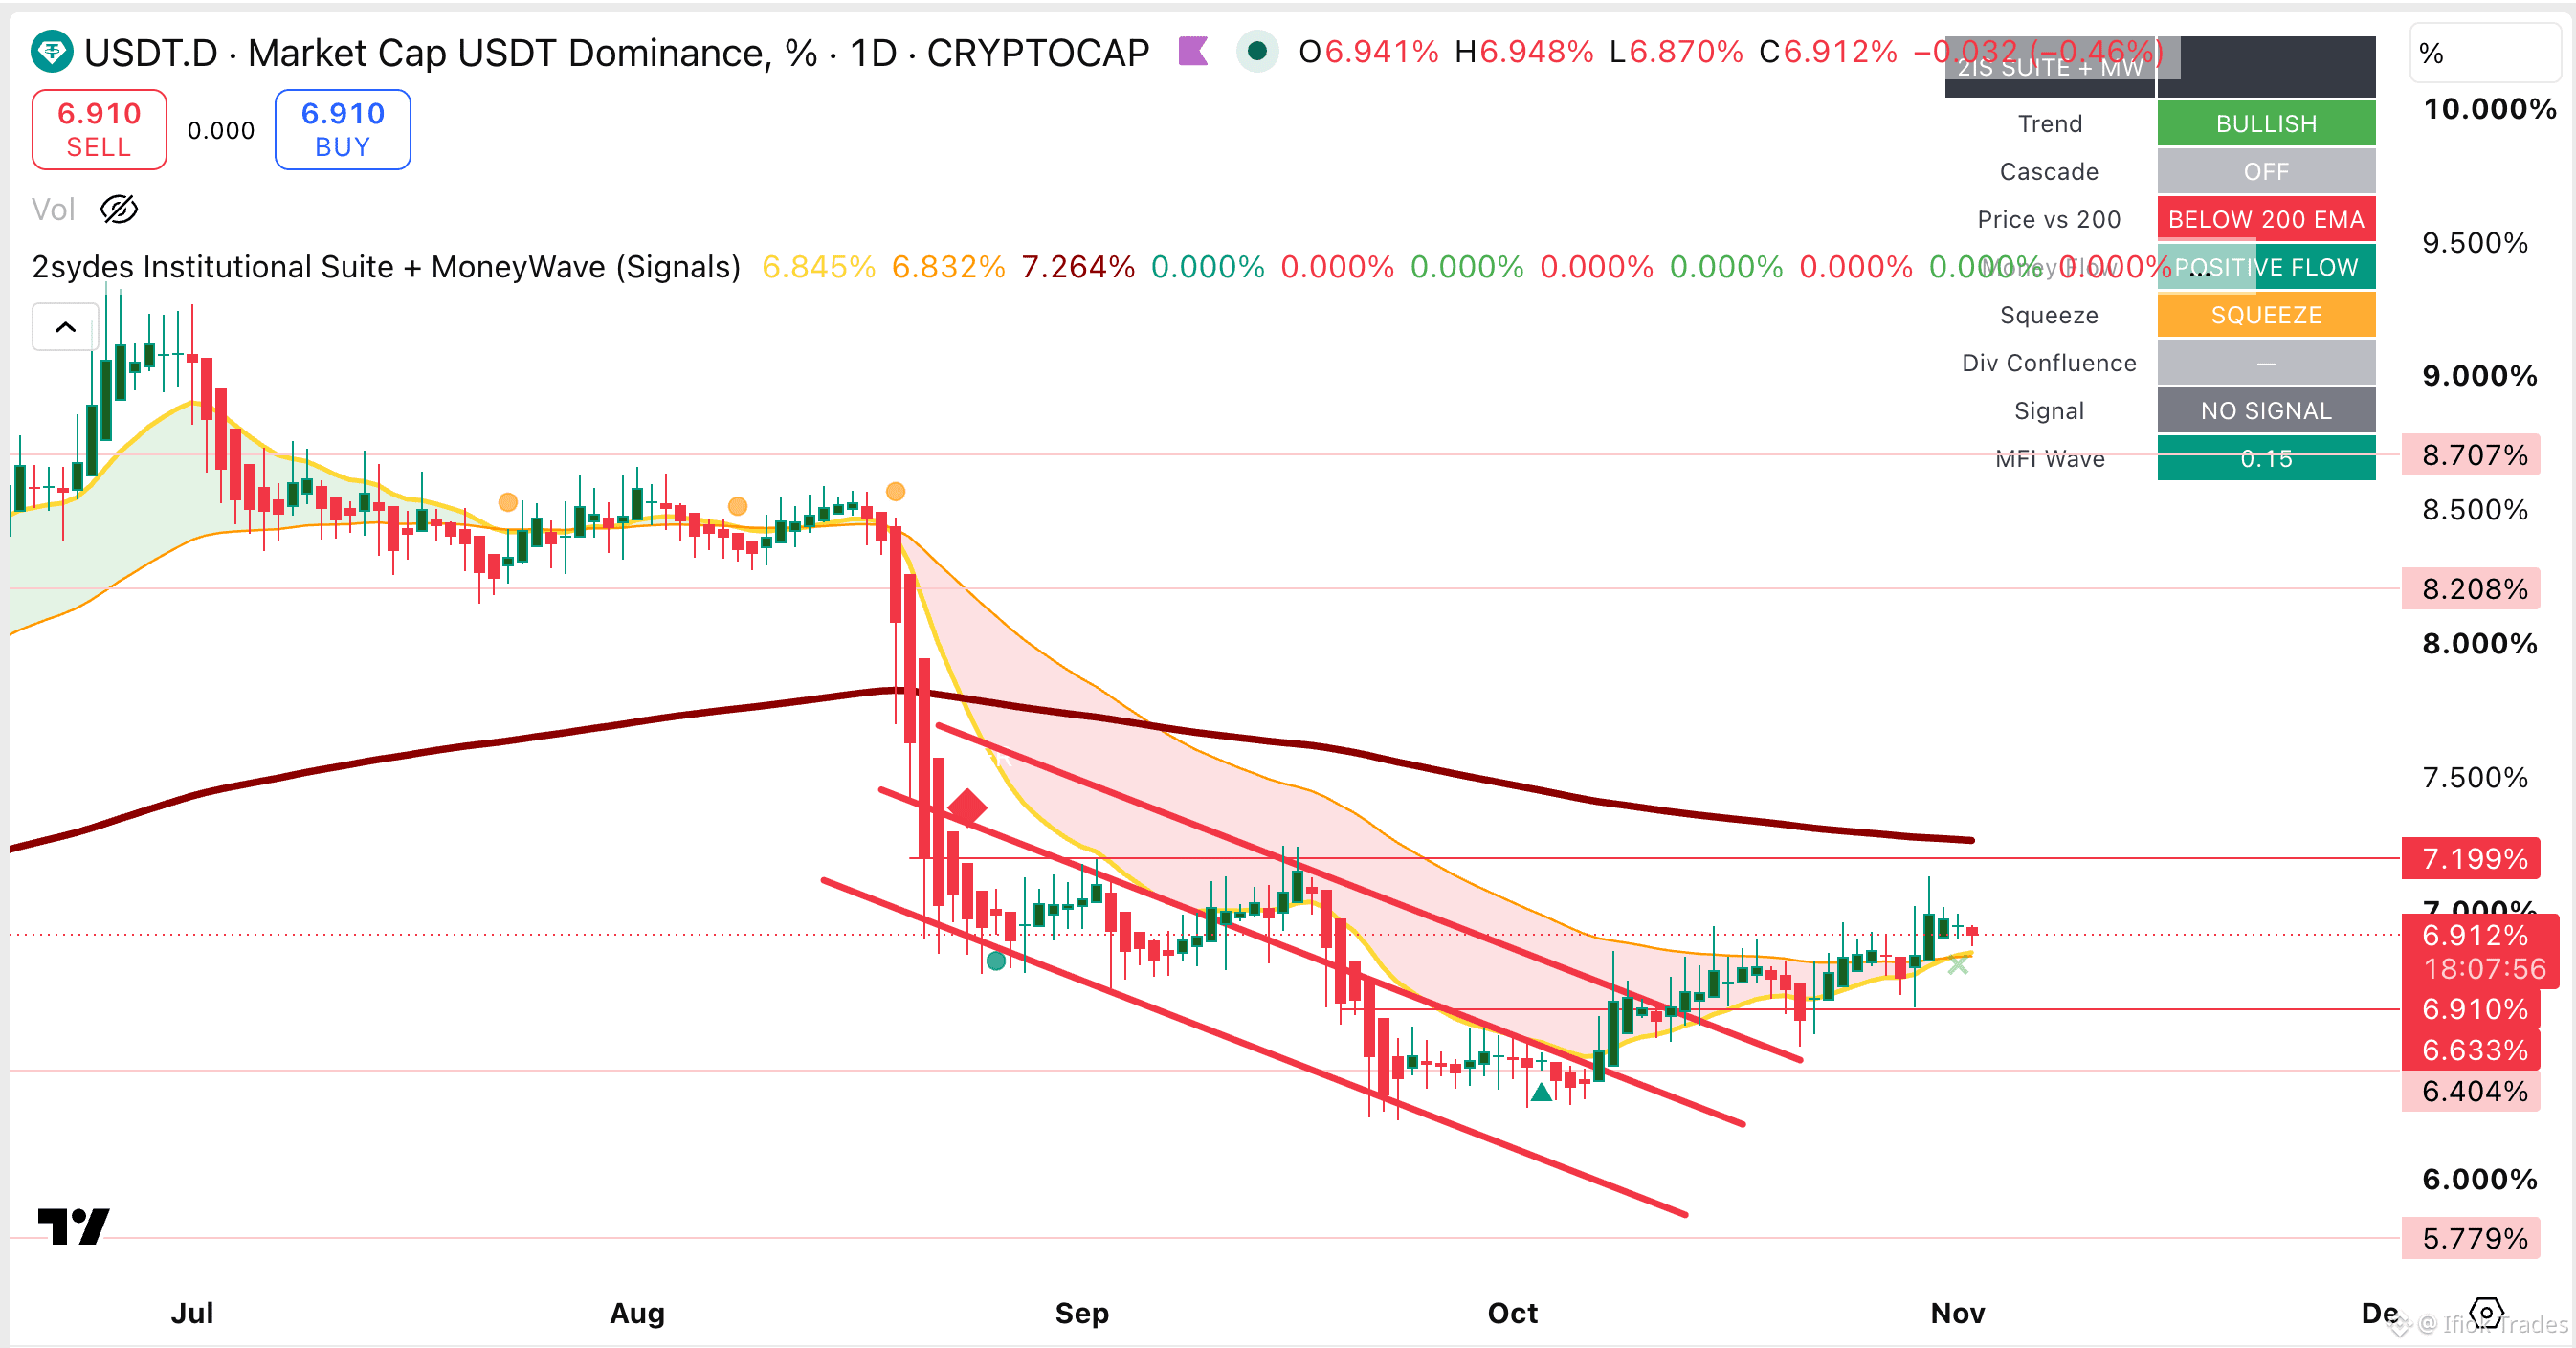
USDT.D $USDT Dominance has flipped bullish on the daily timeframe..
Guys that is not good for Altcoins for bitcoins. The stronger this gets... The more red will be seen in our markets!
#USDT🔥🔥🔥
USDT.D $USDT Dominance has flipped bullish on the daily timeframe..
Guys that is not good for Altcoins for bitcoins. The stronger this gets... The more red will be seen in our markets!
#USDT🔥🔥🔥
Guys that is not good for Altcoins for bitcoins. The stronger this gets... The more red will be seen in our markets!
#USDT🔥🔥🔥
Ifiok Trades
·
--
usdt.d dominance flipping bullish is concerning to me..
If it continues higher then expect the continous perishing of altcoins and $BTC
Currently 6.75%
I will have less concern under 6.6%
#CPIWatch
If it continues higher then expect the continous perishing of altcoins and $BTC
Currently 6.75%
I will have less concern under 6.6%
#CPIWatch
1
301
Log in to explore more content
Join global crypto users on Binance Square
⚡️ Get latest and useful information about crypto.
💬 Trusted by the world’s largest crypto exchange.
👍 Discover real insights from verified creators.
Email / Phone number
Trending Topics
IsAnthropic’s$1.5TMarketCapJustified?
11,232 views
90 Discussing
Anthropic Set to Open at $105 in Record Nasdaq Debut
Binance News
·12 Likes
·15.4k views
BTCRemainsUnderPressureAfterHawkishFOMCMinutes
251,137 views
2,112 Discussing
NvidiaBoardReportedlySplitOverHuang’sReturn
122,402 views
1,143 Discussing