

GAS WOLF
9k Posts

GAS WOLF
Report
Block User
I’m driven by purpose. I’m building something bigger than a moment..
Open Trade
Frequent Trader
1.9 Years
154 Following
22.1K+ Followers
18.4K+ Liked
Posts
Portfolio
All
Quotes
Live
·
--
Bullish
$APM — Price Action Setup
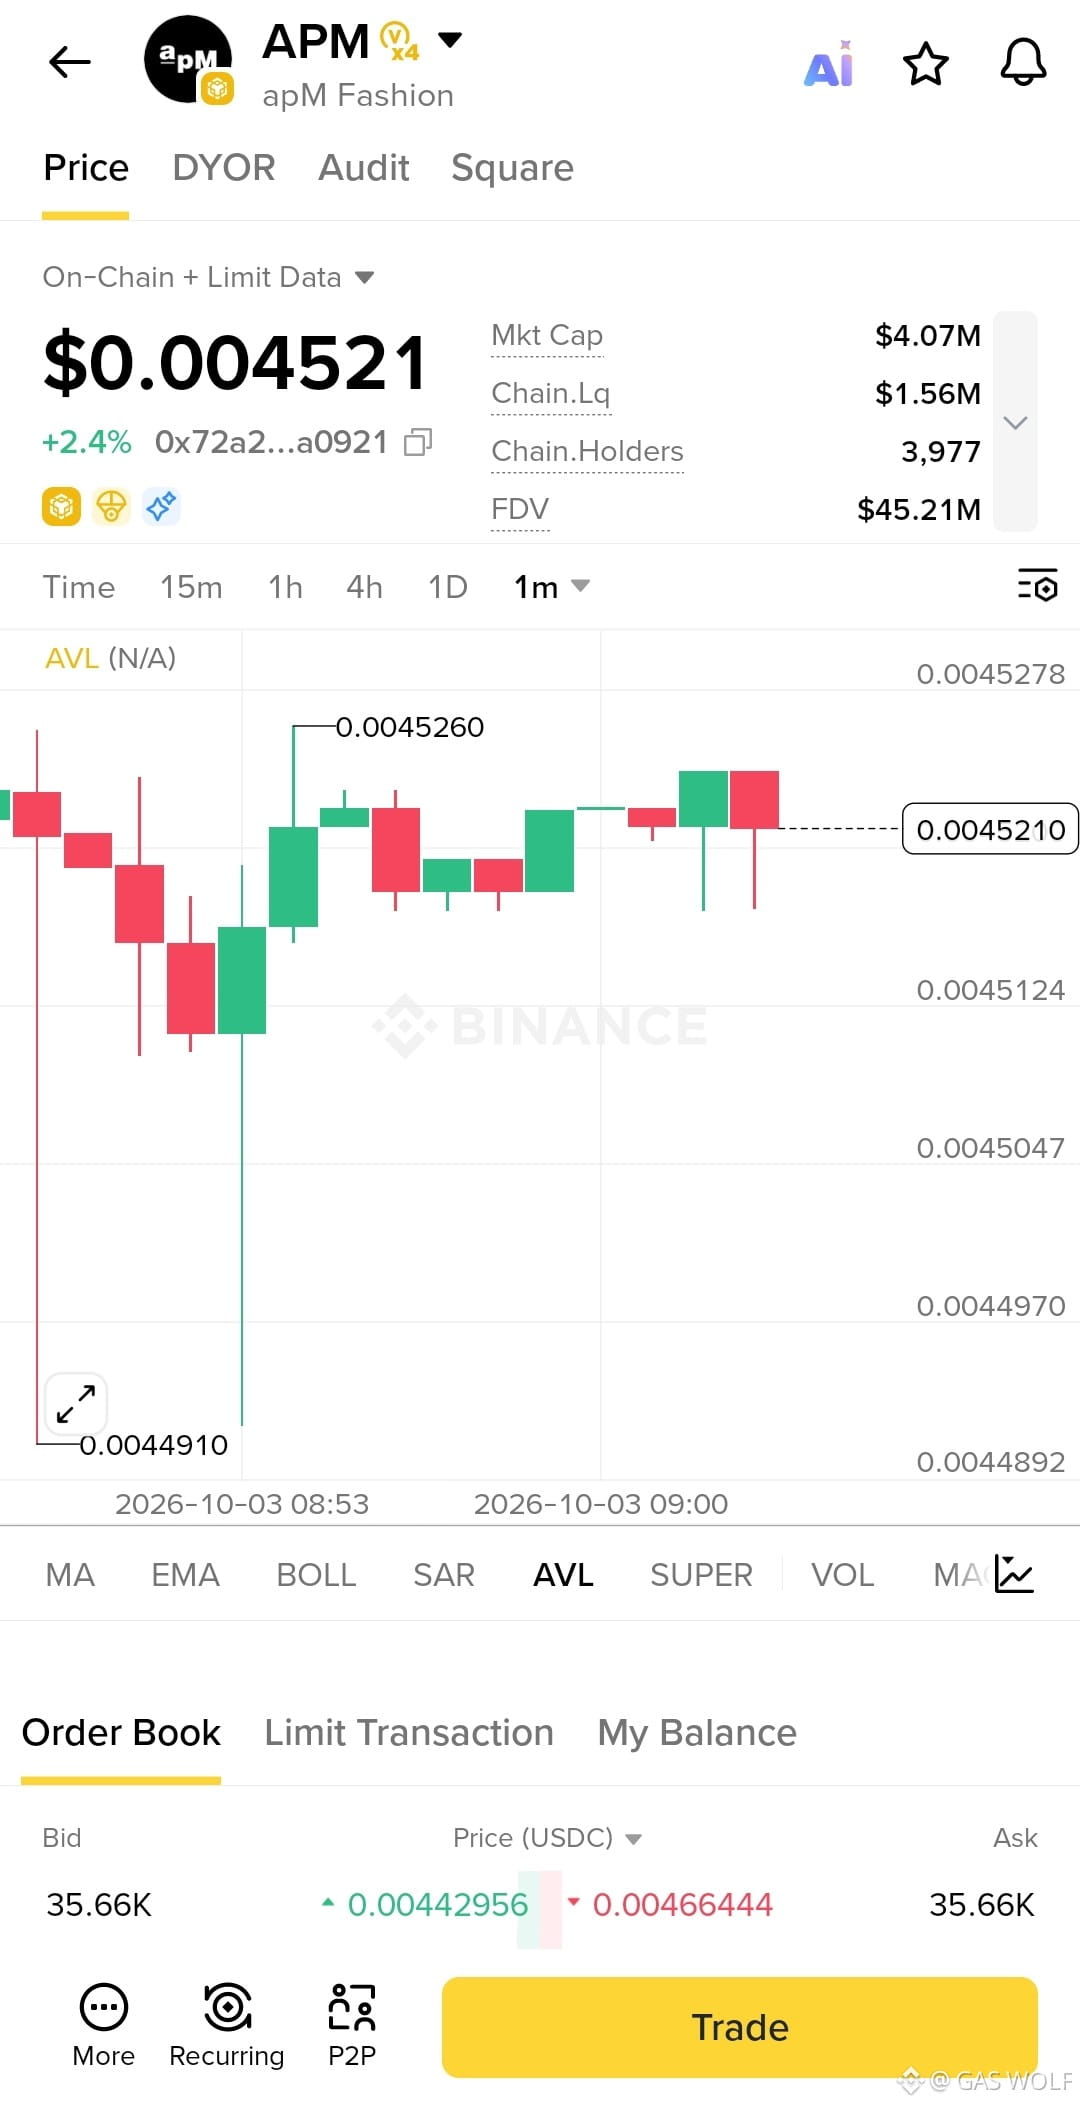
APM/USDT is trading around $0.004521, consolidating just below the recent $0.004526 high. This zone is important because price has recovered from the $0.004491 low and is now pressing against a nearby resistance level.
Buyers appear to be holding the $0.00451–$0.00452 area, but the latest candles show hesitation near the local high. My focus is on whether buyers can defend this base and establish a clean break above $0.004526.
A sustained move above that level could bring the next upside area into play. If price loses the $0.00451 region, the short-term bullish structure would weaken and the setup would need reassessment.
Trade Setup:
Entry Zone: $0.004515–$0.004525
Take Profit 1: $0.004560
Take Profit 2: $0.004600
Stop Loss: $0.004490
The key will be confirmation rather than chasing the move. With a tight range and low-priced asset, disciplined position sizing and risk management remain important.
{alpha}(560x72a22faa6a522c81a8f5d508381e18af3da0921e)
$APM — Price Action Setup
APM/USDT is trading around $0.004521, consolidating just below the recent $0.004526 high. This zone is important because price has recovered from the $0.004491 low and is now pressing against a nearby resistance level.
Buyers appear to be holding the $0.00451–$0.00452 area, but the latest candles show hesitation near the local high. My focus is on whether buyers can defend this base and establish a clean break above $0.004526.
A sustained move above that level could bring the next upside area into play. If price loses the $0.00451 region, the short-term bullish structure would weaken and the setup would need reassessment.
Trade Setup:
Entry Zone: $0.004515–$0.004525
Take Profit 1: $0.004560
Take Profit 2: $0.004600
Stop Loss: $0.004490
The key will be confirmation rather than chasing the move. With a tight range and low-priced asset, disciplined position sizing and risk management remain important.
APM/USDT is trading around $0.004521, consolidating just below the recent $0.004526 high. This zone is important because price has recovered from the $0.004491 low and is now pressing against a nearby resistance level.
Buyers appear to be holding the $0.00451–$0.00452 area, but the latest candles show hesitation near the local high. My focus is on whether buyers can defend this base and establish a clean break above $0.004526.
A sustained move above that level could bring the next upside area into play. If price loses the $0.00451 region, the short-term bullish structure would weaken and the setup would need reassessment.
Trade Setup:
Entry Zone: $0.004515–$0.004525
Take Profit 1: $0.004560
Take Profit 2: $0.004600
Stop Loss: $0.004490
The key will be confirmation rather than chasing the move. With a tight range and low-priced asset, disciplined position sizing and risk management remain important.
1
52
·
--
Bullish
$CTSI — Price Action Setup
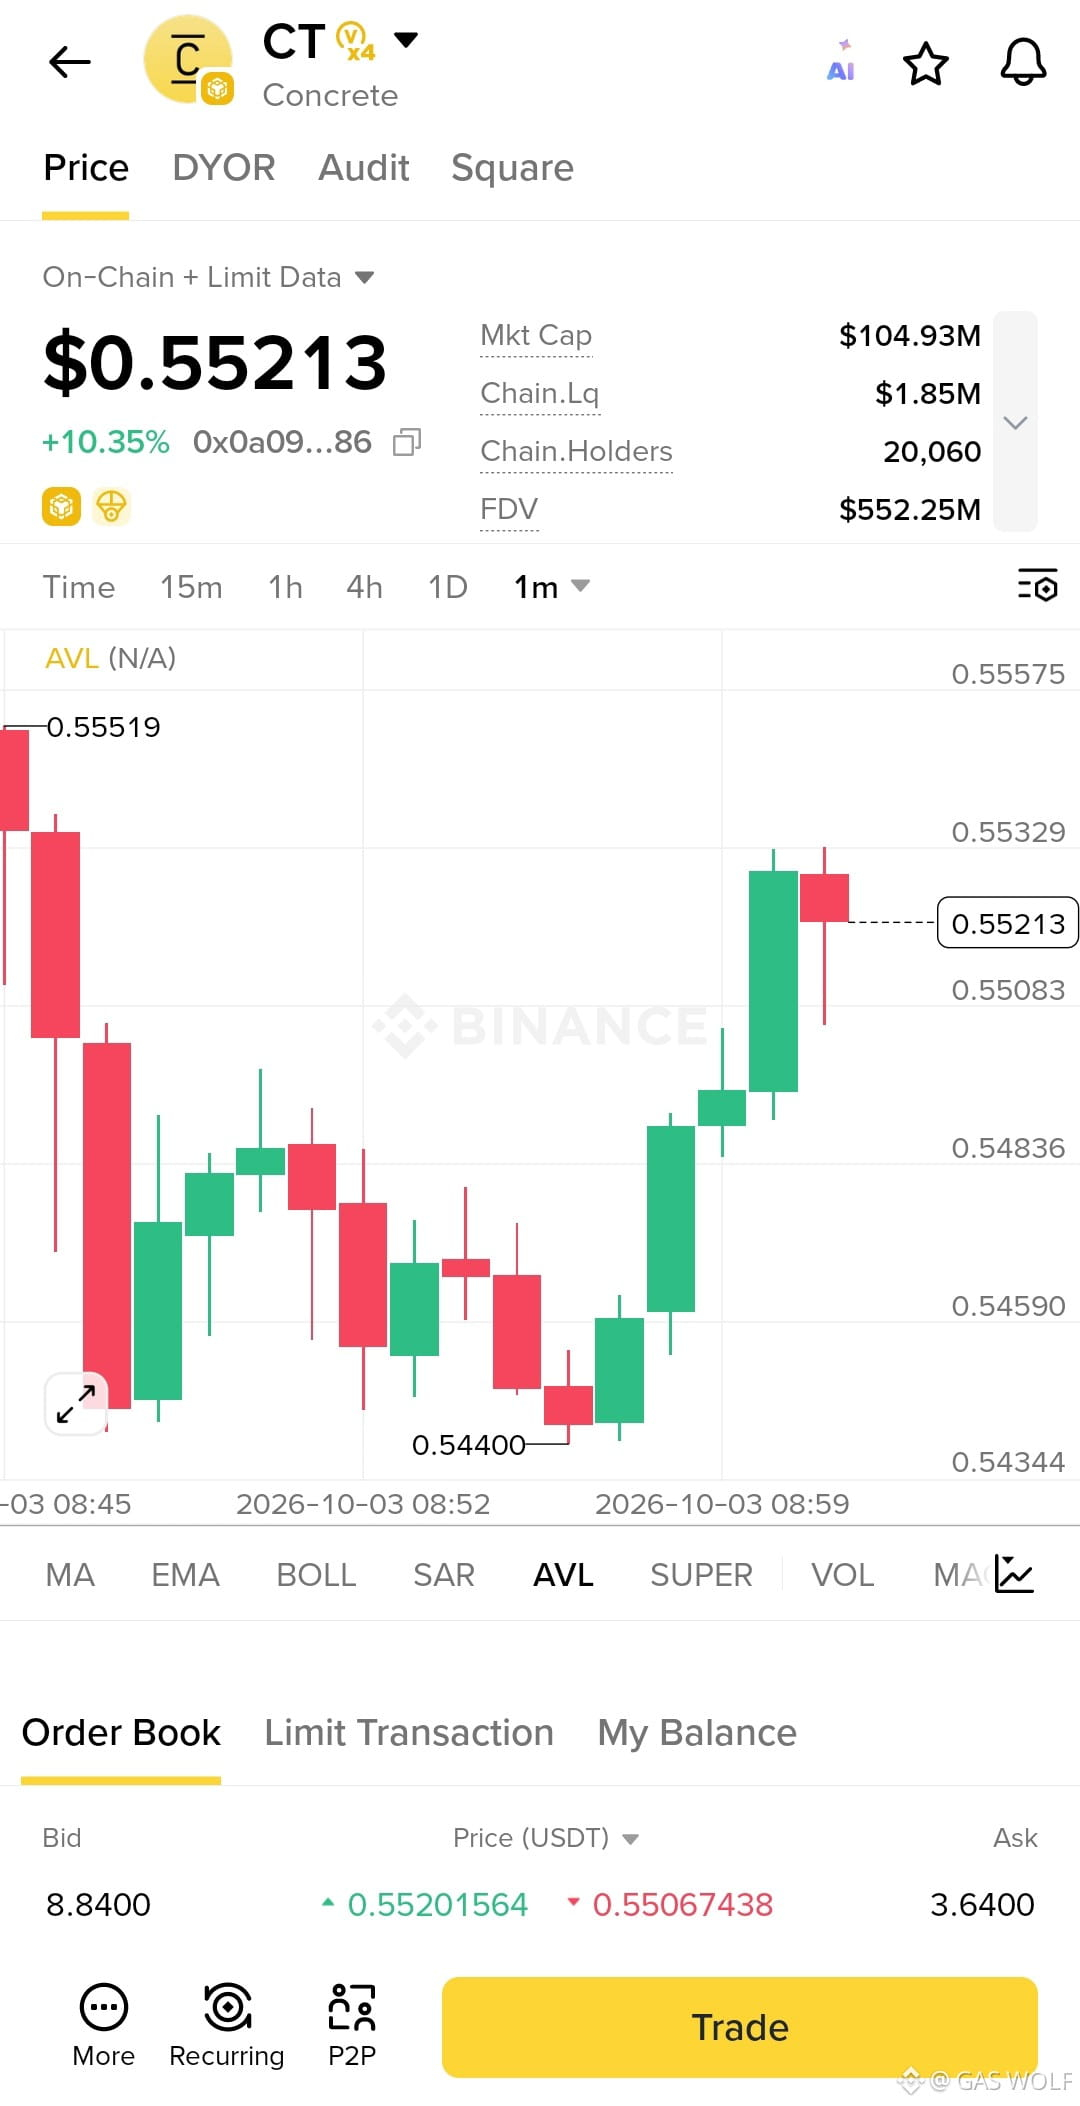
CT/USDT is trading around $0.5521, holding near the $0.5508–$0.5520 area after a strong recovery from the $0.5440 low. This zone is important because price has shifted into a short-term higher-low structure and is now testing the recent $0.5533 resistance.
Buyers have controlled the latest move, but the pullback from $0.5533 shows that sellers are still active near the upper range. My focus is on whether buyers can defend the current area and reclaim that resistance.
A clean break and hold above $0.5533 could bring the previous $0.5552 area into focus. If price loses the $0.5508 region, the bullish setup would need reassessment.
Trade Setup:
Entry Zone: $0.5510–$0.5522
Take Profit 1: $0.5533
Take Profit 2: $0.5552
Stop Loss: $0.5498
The structure is constructive, but confirmation remains important after a sharp move. Patience and disciplined risk management matter more than chasing momentum.
{alpha}(560x0a092e544da31150b439a1aaa1a3a2214a867f46)
$CTSI — Price Action Setup
CT/USDT is trading around $0.5521, holding near the $0.5508–$0.5520 area after a strong recovery from the $0.5440 low. This zone is important because price has shifted into a short-term higher-low structure and is now testing the recent $0.5533 resistance.
Buyers have controlled the latest move, but the pullback from $0.5533 shows that sellers are still active near the upper range. My focus is on whether buyers can defend the current area and reclaim that resistance.
A clean break and hold above $0.5533 could bring the previous $0.5552 area into focus. If price loses the $0.5508 region, the bullish setup would need reassessment.
Trade Setup:
Entry Zone: $0.5510–$0.5522
Take Profit 1: $0.5533
Take Profit 2: $0.5552
Stop Loss: $0.5498
The structure is constructive, but confirmation remains important after a sharp move. Patience and disciplined risk management matter more than chasing momentum.
CT/USDT is trading around $0.5521, holding near the $0.5508–$0.5520 area after a strong recovery from the $0.5440 low. This zone is important because price has shifted into a short-term higher-low structure and is now testing the recent $0.5533 resistance.
Buyers have controlled the latest move, but the pullback from $0.5533 shows that sellers are still active near the upper range. My focus is on whether buyers can defend the current area and reclaim that resistance.
A clean break and hold above $0.5533 could bring the previous $0.5552 area into focus. If price loses the $0.5508 region, the bullish setup would need reassessment.
Trade Setup:
Entry Zone: $0.5510–$0.5522
Take Profit 1: $0.5533
Take Profit 2: $0.5552
Stop Loss: $0.5498
The structure is constructive, but confirmation remains important after a sharp move. Patience and disciplined risk management matter more than chasing momentum.
223
·
--
Bullish
$MANA — Price Action Setup
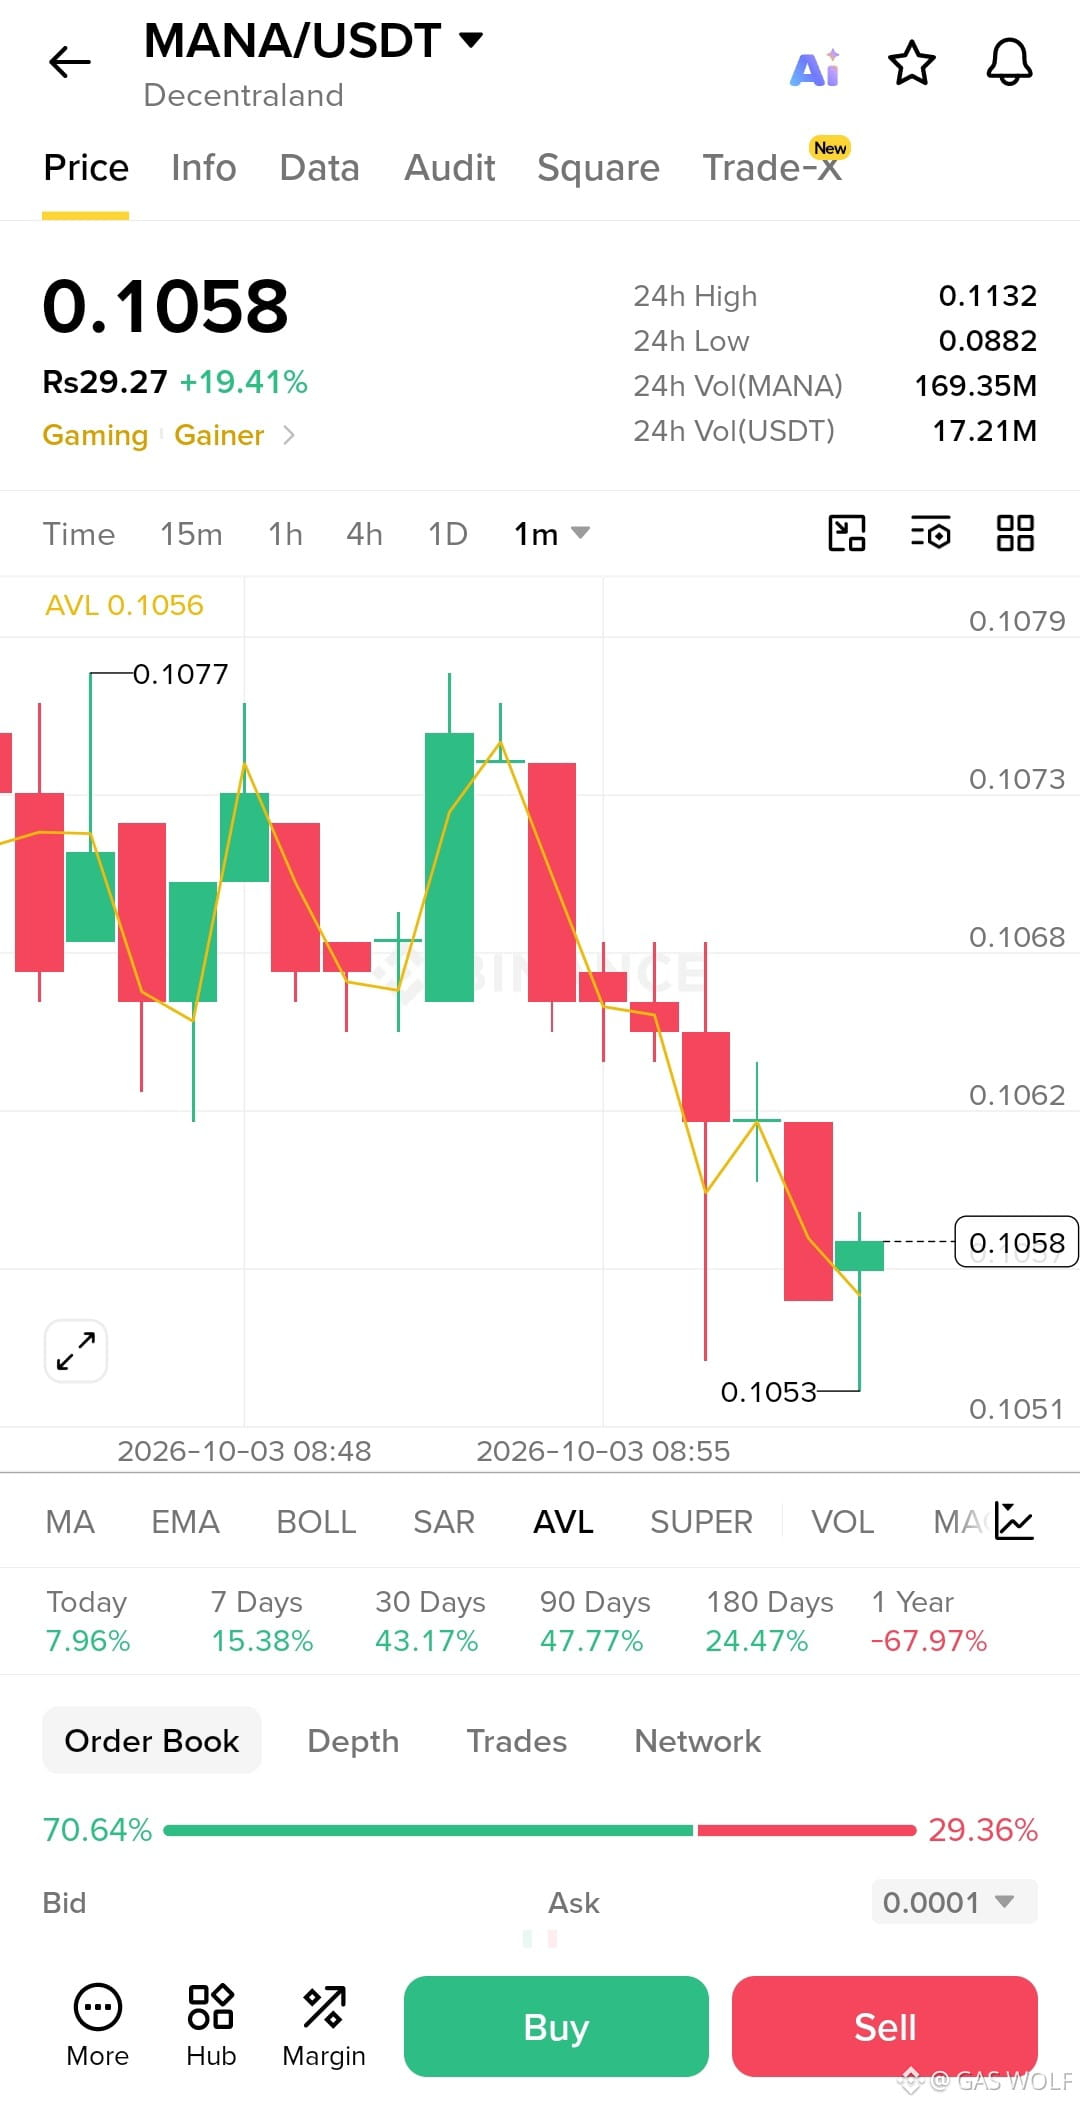
MANA/USDT is trading around $0.1058, sitting just above the $0.1053–$0.1058 support area after pulling back from the $0.1077 local high. This zone matters because buyers are attempting to stabilize price after the recent intraday decline.
The short-term structure is showing some selling pressure, but the strong bid presence in the order book suggests buyers are still active around the current area. My focus is on whether they can defend $0.1053 and push price back toward the nearby resistance levels.
A reclaim of $0.1062–$0.1068 would provide stronger confirmation of renewed momentum, while a move back above $0.1073 could bring the recent high into focus.
Trade Setup:
Entry Zone: $0.1055–$0.1059
Take Profit 1: $0.1068
Take Profit 2: $0.1077
Stop Loss: $0.1050
This zone looks important for the next move. The key will be confirmation rather than chasing the move, with disciplined risk management if volatility expands.
{spot}(MANAUSDT)
$MANA — Price Action Setup
MANA/USDT is trading around $0.1058, sitting just above the $0.1053–$0.1058 support area after pulling back from the $0.1077 local high. This zone matters because buyers are attempting to stabilize price after the recent intraday decline.
The short-term structure is showing some selling pressure, but the strong bid presence in the order book suggests buyers are still active around the current area. My focus is on whether they can defend $0.1053 and push price back toward the nearby resistance levels.
A reclaim of $0.1062–$0.1068 would provide stronger confirmation of renewed momentum, while a move back above $0.1073 could bring the recent high into focus.
Trade Setup:
Entry Zone: $0.1055–$0.1059
Take Profit 1: $0.1068
Take Profit 2: $0.1077
Stop Loss: $0.1050
This zone looks important for the next move. The key will be confirmation rather than chasing the move, with disciplined risk management if volatility expands.
MANA/USDT is trading around $0.1058, sitting just above the $0.1053–$0.1058 support area after pulling back from the $0.1077 local high. This zone matters because buyers are attempting to stabilize price after the recent intraday decline.
The short-term structure is showing some selling pressure, but the strong bid presence in the order book suggests buyers are still active around the current area. My focus is on whether they can defend $0.1053 and push price back toward the nearby resistance levels.
A reclaim of $0.1062–$0.1068 would provide stronger confirmation of renewed momentum, while a move back above $0.1073 could bring the recent high into focus.
Trade Setup:
Entry Zone: $0.1055–$0.1059
Take Profit 1: $0.1068
Take Profit 2: $0.1077
Stop Loss: $0.1050
This zone looks important for the next move. The key will be confirmation rather than chasing the move, with disciplined risk management if volatility expands.
95
·
--
Bullish
$NIGHT — Price Action Setup
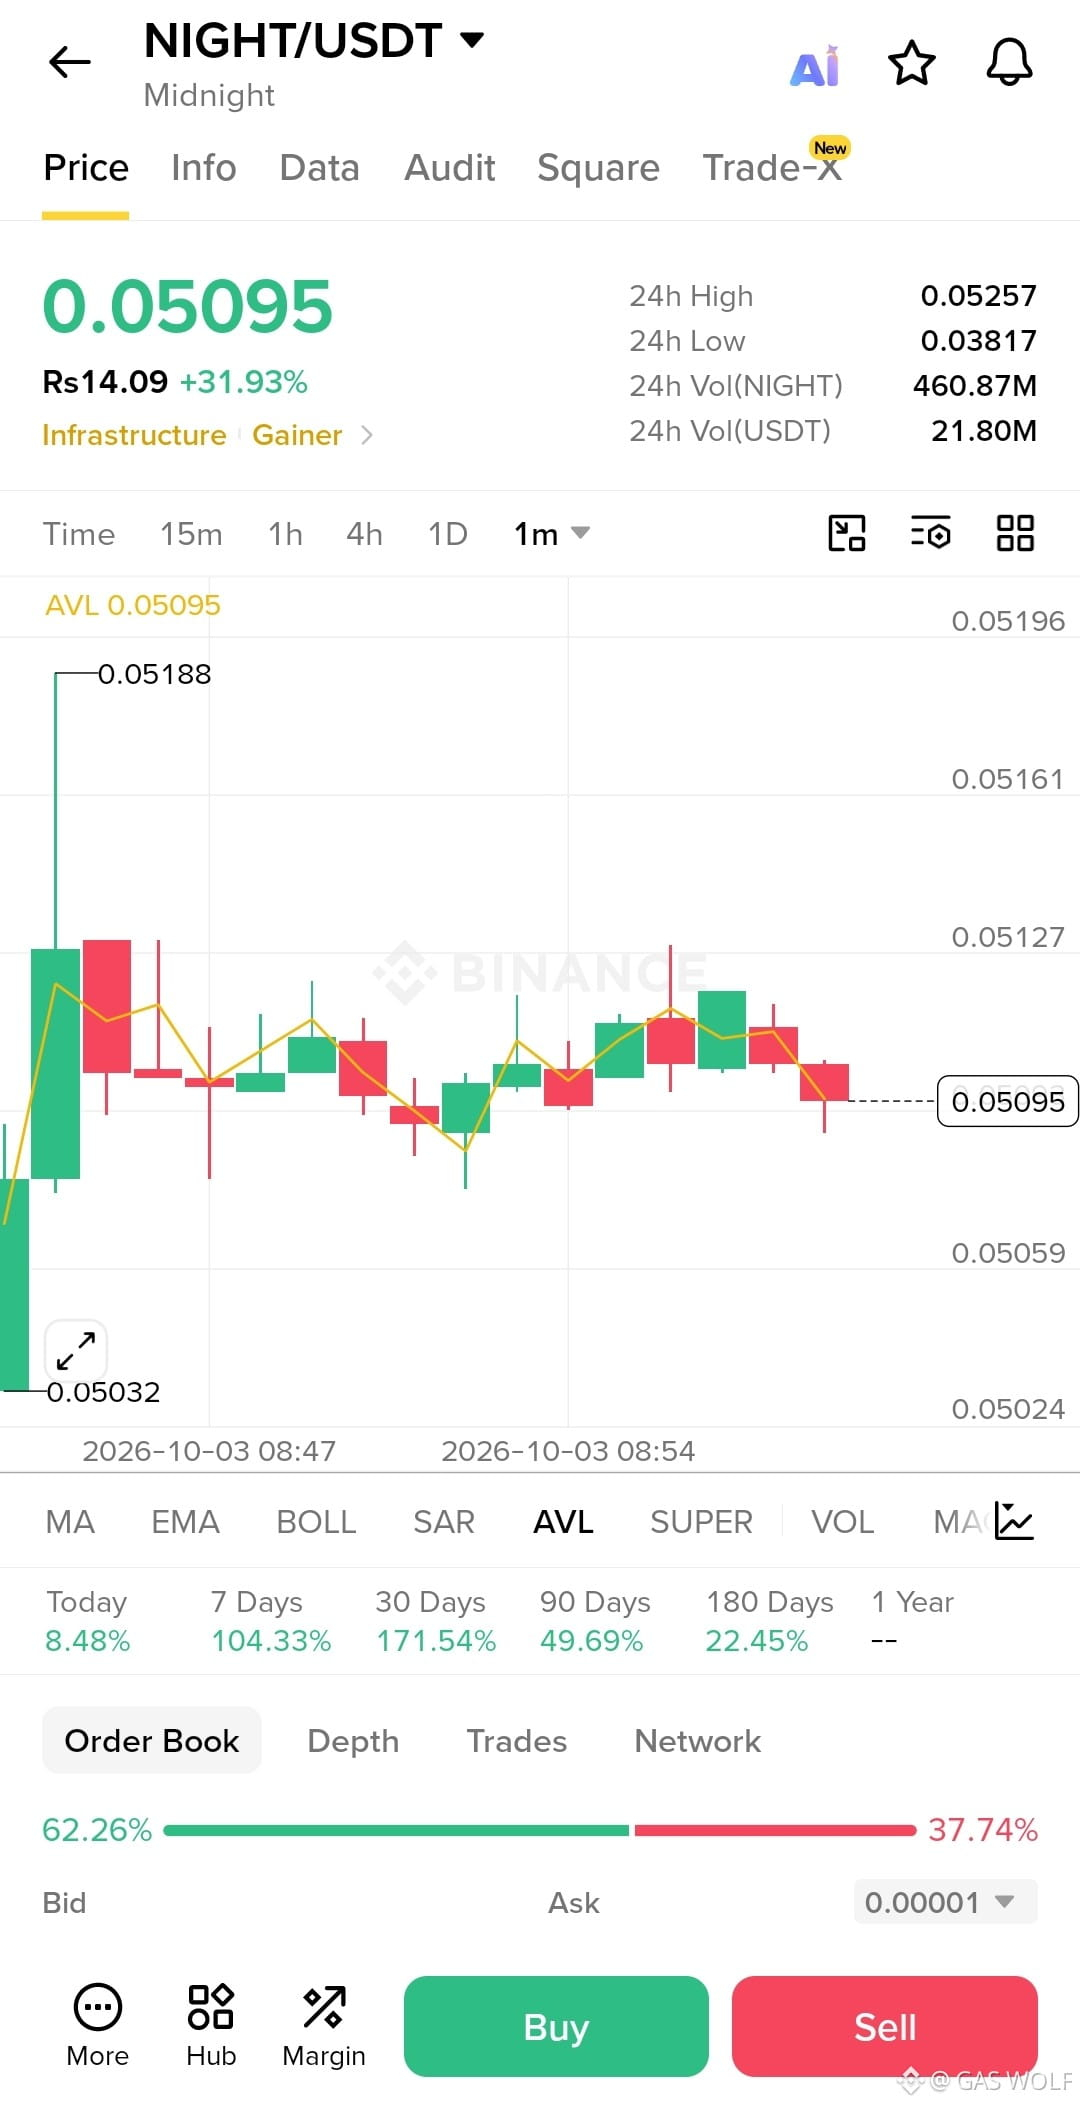
NIGHT/USDT is trading around $0.05095, consolidating after a sharp move higher from the $0.05032 area. This zone is important because price is holding above the recent base while remaining close to the $0.05127 short-term resistance.
Buyers appear to be defending the $0.0508–$0.0510 region, but the latest candles show some hesitation near resistance. My focus is on whether buyers can maintain this support and push price back through $0.05127.
A clean reclaim of $0.05127 could open the way toward the recent $0.05188 high. If support breaks instead, the bullish setup would lose strength and need reassessment.
Trade Setup:
Entry Zone: $0.05080–$0.05100
Take Profit 1: $0.05127
Take Profit 2: $0.05185
Stop Loss: $0.05035
The key will be confirmation rather than chasing the move. After a strong expansion, patience and disciplined risk management are especially important.
{spot}(NIGHTUSDT)
$NIGHT — Price Action Setup
NIGHT/USDT is trading around $0.05095, consolidating after a sharp move higher from the $0.05032 area. This zone is important because price is holding above the recent base while remaining close to the $0.05127 short-term resistance.
Buyers appear to be defending the $0.0508–$0.0510 region, but the latest candles show some hesitation near resistance. My focus is on whether buyers can maintain this support and push price back through $0.05127.
A clean reclaim of $0.05127 could open the way toward the recent $0.05188 high. If support breaks instead, the bullish setup would lose strength and need reassessment.
Trade Setup:
Entry Zone: $0.05080–$0.05100
Take Profit 1: $0.05127
Take Profit 2: $0.05185
Stop Loss: $0.05035
The key will be confirmation rather than chasing the move. After a strong expansion, patience and disciplined risk management are especially important.
NIGHT/USDT is trading around $0.05095, consolidating after a sharp move higher from the $0.05032 area. This zone is important because price is holding above the recent base while remaining close to the $0.05127 short-term resistance.
Buyers appear to be defending the $0.0508–$0.0510 region, but the latest candles show some hesitation near resistance. My focus is on whether buyers can maintain this support and push price back through $0.05127.
A clean reclaim of $0.05127 could open the way toward the recent $0.05188 high. If support breaks instead, the bullish setup would lose strength and need reassessment.
Trade Setup:
Entry Zone: $0.05080–$0.05100
Take Profit 1: $0.05127
Take Profit 2: $0.05185
Stop Loss: $0.05035
The key will be confirmation rather than chasing the move. After a strong expansion, patience and disciplined risk management are especially important.
106
·
--
Bullish
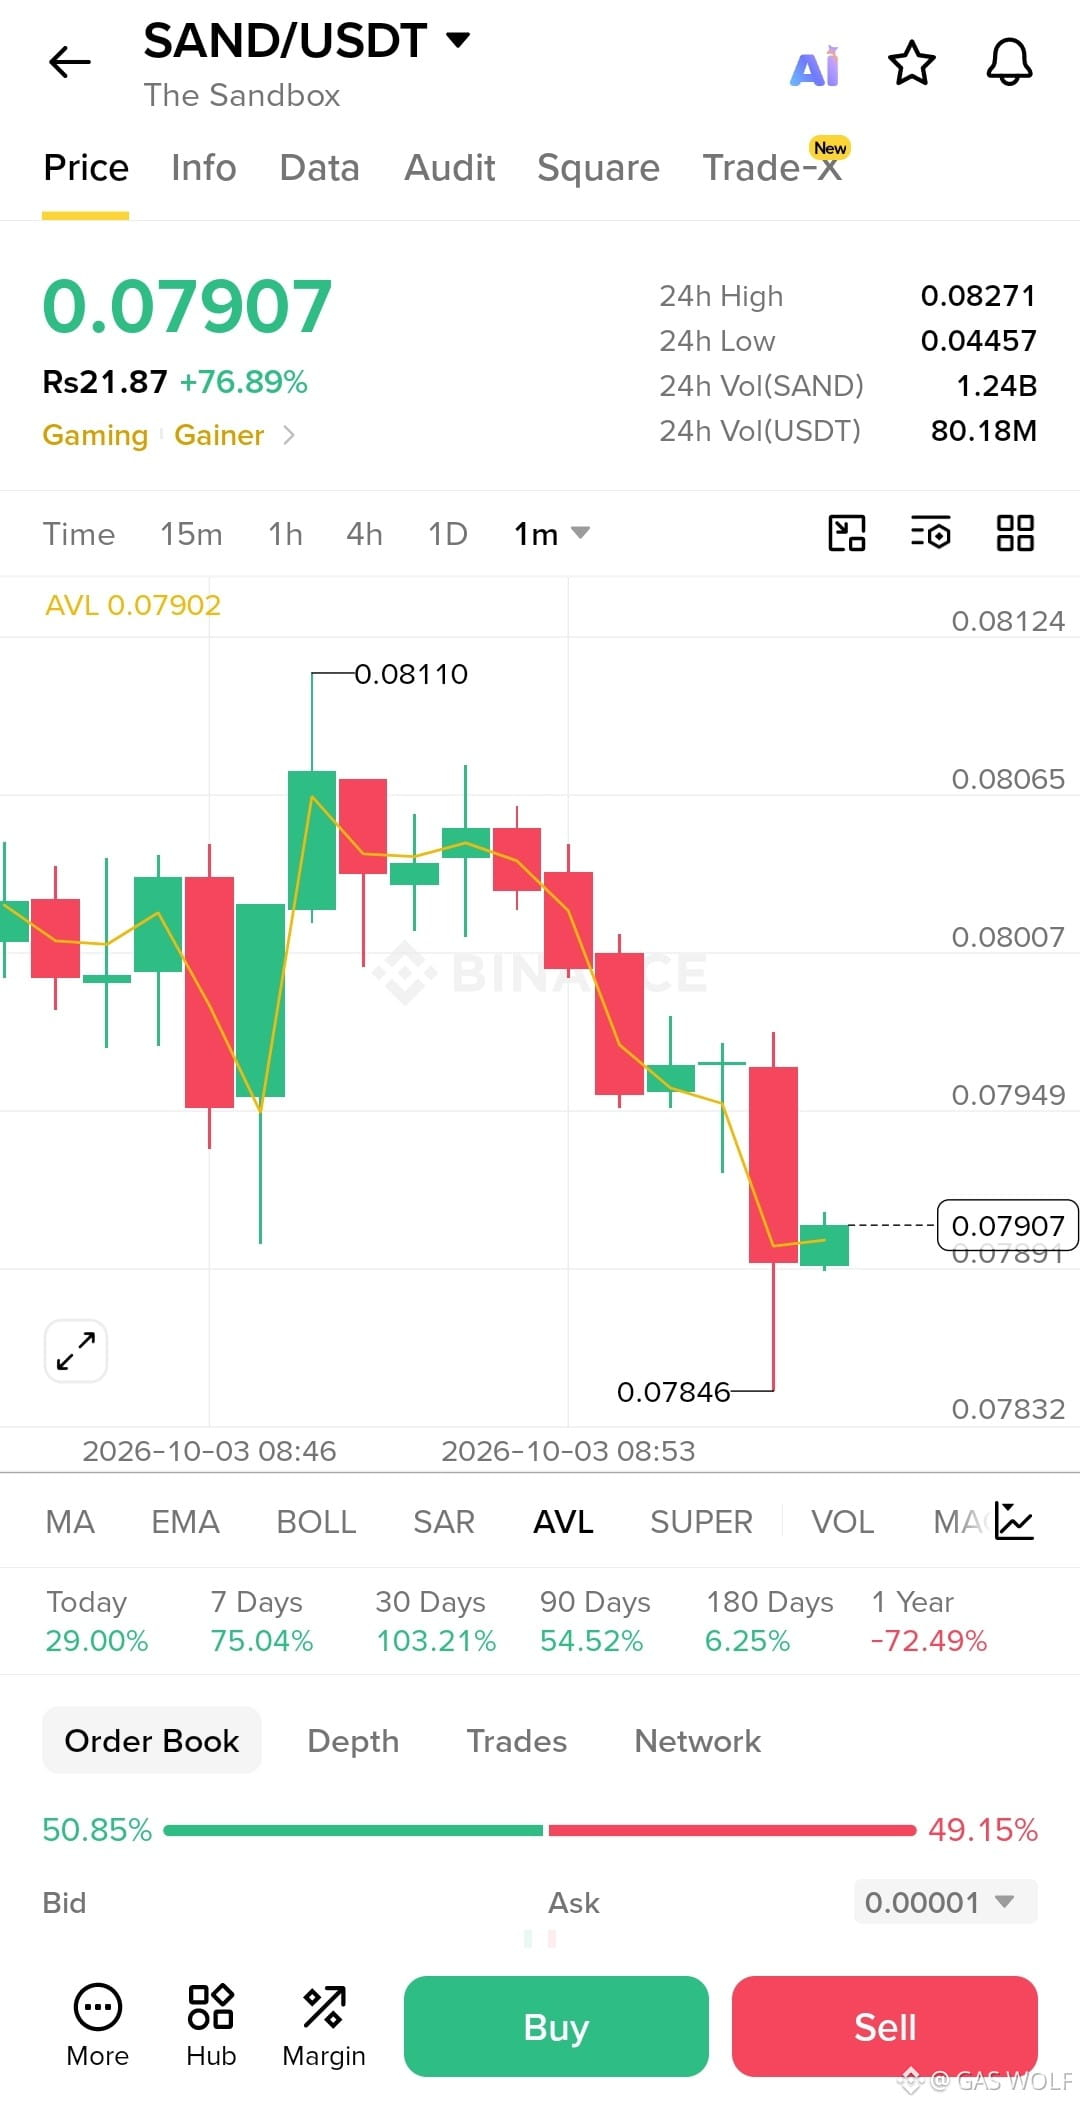
$SAND — Price Action Setup
SAND/USDT is trading around $0.0790, sitting near the $0.0788–$0.0791 area after a sharp intraday move. This zone is important because price is attempting to stabilize after pulling back from the $0.08110 local high.
Sellers have pushed price lower, but buyers are still trying to defend the $0.0785–$0.0790 region. My focus is on whether buyers can hold this area and rebuild momentum toward the recent highs.
A reclaim of $0.0800 would strengthen the short-term bullish structure, while a clean break above $0.0811 could bring the next upside leg into focus. If support fails, the setup would need to be reassessed.
Trade Setup:
Entry Zone: $0.0788–$0.0792
Take Profit 1: $0.0800
Take Profit 2: $0.0811
Stop Loss: $0.0783
The key will be confirmation rather than chasing the move. Patience, position sizing, and disciplined risk management matter, especially after such a strong price expansion.
{spot}(SANDUSDT)
$SAND — Price Action Setup
SAND/USDT is trading around $0.0790, sitting near the $0.0788–$0.0791 area after a sharp intraday move. This zone is important because price is attempting to stabilize after pulling back from the $0.08110 local high.
Sellers have pushed price lower, but buyers are still trying to defend the $0.0785–$0.0790 region. My focus is on whether buyers can hold this area and rebuild momentum toward the recent highs.
A reclaim of $0.0800 would strengthen the short-term bullish structure, while a clean break above $0.0811 could bring the next upside leg into focus. If support fails, the setup would need to be reassessed.
Trade Setup:
Entry Zone: $0.0788–$0.0792
Take Profit 1: $0.0800
Take Profit 2: $0.0811
Stop Loss: $0.0783
The key will be confirmation rather than chasing the move. Patience, position sizing, and disciplined risk management matter, especially after such a strong price expansion.
SAND/USDT is trading around $0.0790, sitting near the $0.0788–$0.0791 area after a sharp intraday move. This zone is important because price is attempting to stabilize after pulling back from the $0.08110 local high.
Sellers have pushed price lower, but buyers are still trying to defend the $0.0785–$0.0790 region. My focus is on whether buyers can hold this area and rebuild momentum toward the recent highs.
A reclaim of $0.0800 would strengthen the short-term bullish structure, while a clean break above $0.0811 could bring the next upside leg into focus. If support fails, the setup would need to be reassessed.
Trade Setup:
Entry Zone: $0.0788–$0.0792
Take Profit 1: $0.0800
Take Profit 2: $0.0811
Stop Loss: $0.0783
The key will be confirmation rather than chasing the move. Patience, position sizing, and disciplined risk management matter, especially after such a strong price expansion.
254
·
--
Bullish
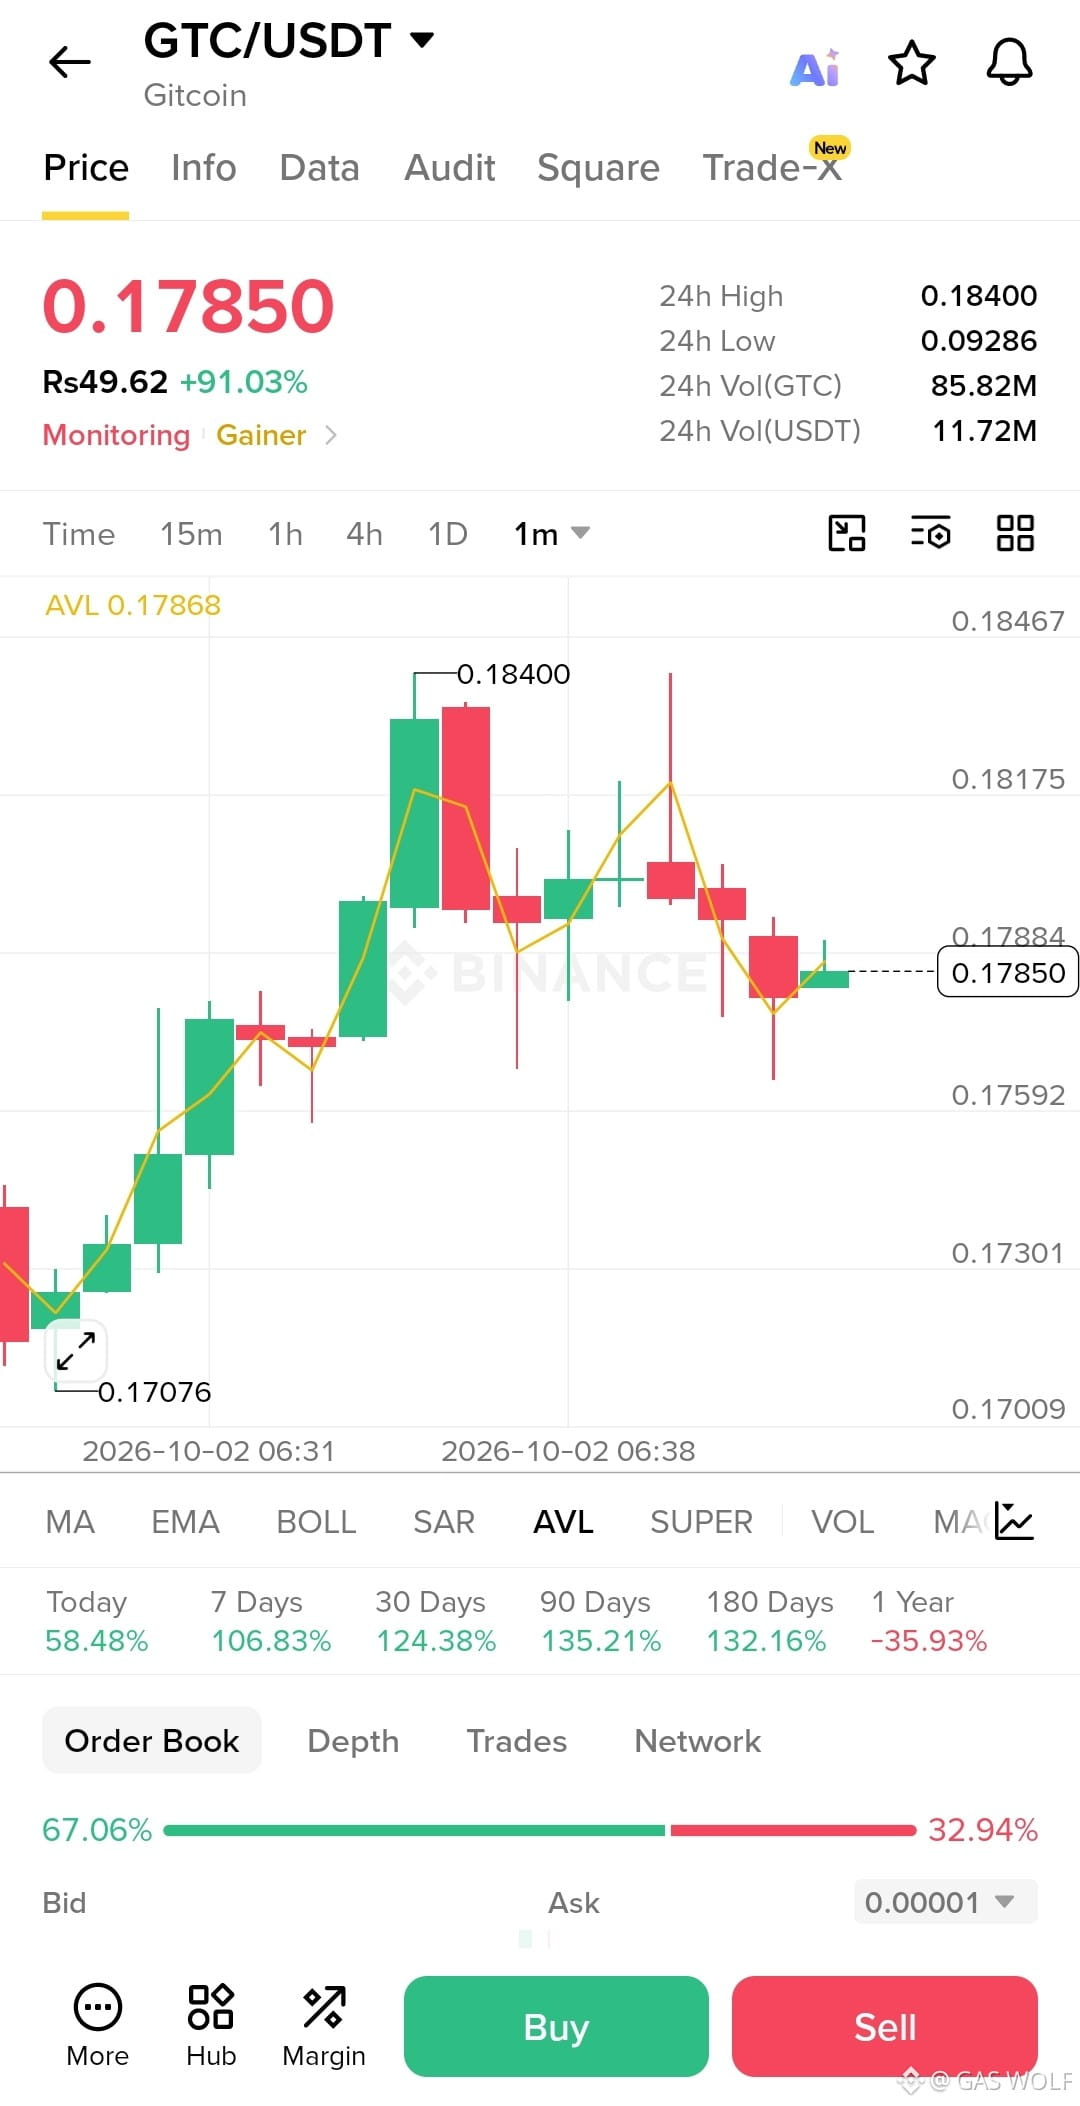
$GTC is trading around $0.1785 after a sharp move from the $0.17076 low and a test of the $0.18400 high. This zone is important because price is now consolidating just below the recent peak after a strong intraday advance.
On the 1-minute chart, buyers have managed to stabilize price around $0.1780–$0.1785 after the pullback. My focus is on whether this area can continue acting as short-term support. A reclaim of $0.1810–$0.1815 would strengthen the momentum structure and put the recent high back in focus.
If buyers regain control, the upside targets could come into play. A sustained move below $0.1760, however, would weaken the current setup and suggest that the pullback is extending.
Trade Setup:
Entry Zone: $0.1775–$0.1790
Take Profit 1: $0.1815
Take Profit 2: $0.1840
Stop Loss: $0.1755
The key will be confirmation rather than chasing the move. After such a strong run, patience and disciplined risk management are important, especially around volatile levels.
{spot}(GTCUSDT)
$GTC is trading around $0.1785 after a sharp move from the $0.17076 low and a test of the $0.18400 high. This zone is important because price is now consolidating just below the recent peak after a strong intraday advance.
On the 1-minute chart, buyers have managed to stabilize price around $0.1780–$0.1785 after the pullback. My focus is on whether this area can continue acting as short-term support. A reclaim of $0.1810–$0.1815 would strengthen the momentum structure and put the recent high back in focus.
If buyers regain control, the upside targets could come into play. A sustained move below $0.1760, however, would weaken the current setup and suggest that the pullback is extending.
Trade Setup:
Entry Zone: $0.1775–$0.1790
Take Profit 1: $0.1815
Take Profit 2: $0.1840
Stop Loss: $0.1755
The key will be confirmation rather than chasing the move. After such a strong run, patience and disciplined risk management are important, especially around volatile levels.
On the 1-minute chart, buyers have managed to stabilize price around $0.1780–$0.1785 after the pullback. My focus is on whether this area can continue acting as short-term support. A reclaim of $0.1810–$0.1815 would strengthen the momentum structure and put the recent high back in focus.
If buyers regain control, the upside targets could come into play. A sustained move below $0.1760, however, would weaken the current setup and suggest that the pullback is extending.
Trade Setup:
Entry Zone: $0.1775–$0.1790
Take Profit 1: $0.1815
Take Profit 2: $0.1840
Stop Loss: $0.1755
The key will be confirmation rather than chasing the move. After such a strong run, patience and disciplined risk management are important, especially around volatile levels.
1
266
·
--
Bullish
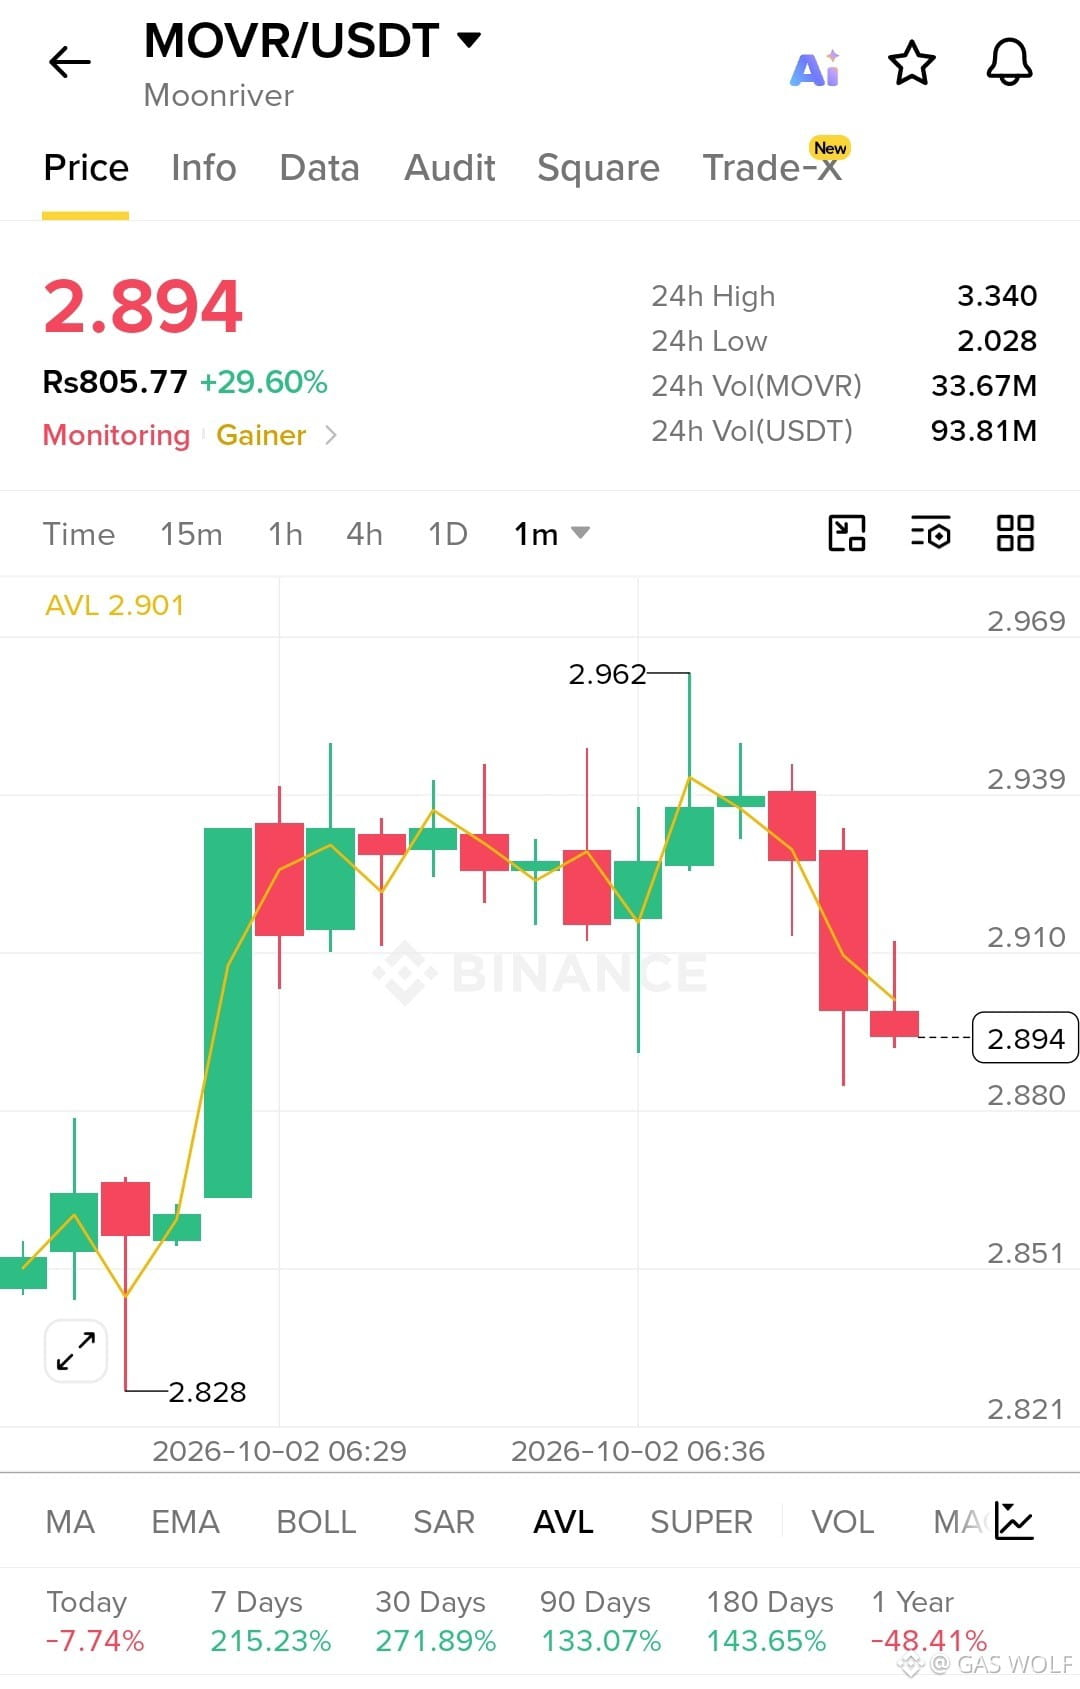
$MOVR is trading around $2.89 after pulling back from the $2.962 intraday high. This area is important because price is now testing the $2.88–$2.90 region after a strong move higher.
The 1-minute chart shows short-term selling pressure after rejection near $2.96, but buyers are still holding the recent breakout structure above the $2.88 area. My focus is on whether buyers can defend this zone and stabilize price before another attempt higher.
A reclaim of $2.91 could strengthen the setup, while a clean move back above $2.94 would provide stronger confirmation toward the recent high. If $2.88 fails, the bullish structure would need to be reassessed.
Trade Setup:
Entry Zone: $2.885–$2.905
Take Profit 1: $2.940
Take Profit 2: $2.960
Stop Loss: $2.850
The key will be confirmation rather than chasing the move. With volatility elevated, patience and disciplined risk management are especially important.
{spot}(MOVRUSDT)
$MOVR is trading around $2.89 after pulling back from the $2.962 intraday high. This area is important because price is now testing the $2.88–$2.90 region after a strong move higher.
The 1-minute chart shows short-term selling pressure after rejection near $2.96, but buyers are still holding the recent breakout structure above the $2.88 area. My focus is on whether buyers can defend this zone and stabilize price before another attempt higher.
A reclaim of $2.91 could strengthen the setup, while a clean move back above $2.94 would provide stronger confirmation toward the recent high. If $2.88 fails, the bullish structure would need to be reassessed.
Trade Setup:
Entry Zone: $2.885–$2.905
Take Profit 1: $2.940
Take Profit 2: $2.960
Stop Loss: $2.850
The key will be confirmation rather than chasing the move. With volatility elevated, patience and disciplined risk management are especially important.
The 1-minute chart shows short-term selling pressure after rejection near $2.96, but buyers are still holding the recent breakout structure above the $2.88 area. My focus is on whether buyers can defend this zone and stabilize price before another attempt higher.
A reclaim of $2.91 could strengthen the setup, while a clean move back above $2.94 would provide stronger confirmation toward the recent high. If $2.88 fails, the bullish structure would need to be reassessed.
Trade Setup:
Entry Zone: $2.885–$2.905
Take Profit 1: $2.940
Take Profit 2: $2.960
Stop Loss: $2.850
The key will be confirmation rather than chasing the move. With volatility elevated, patience and disciplined risk management are especially important.
54
·
--
Bullish
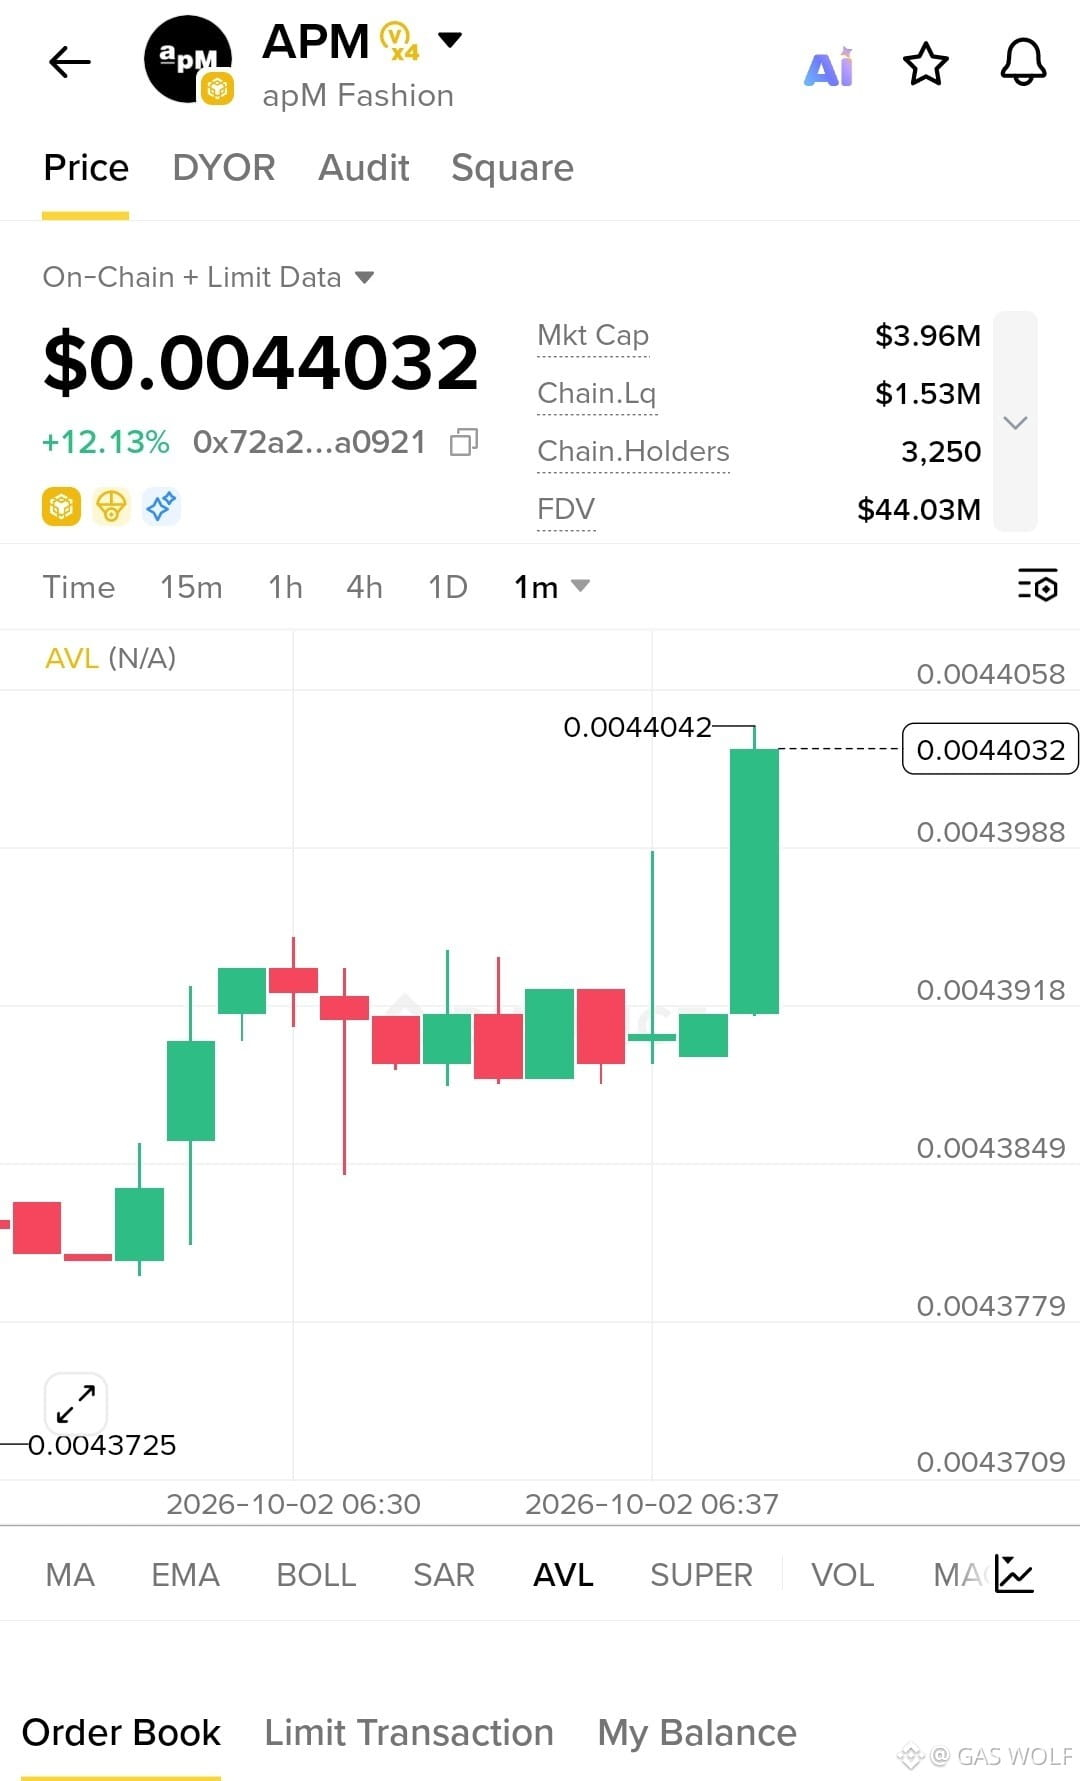
$APM is trading around $0.00440 after pushing up from the $0.00437 area. This zone is important because price is testing the recent intraday high around $0.004404, putting the market at a potential breakout point.
On the 1-minute chart, buyers have maintained control after a period of tight consolidation, with the latest candle pushing sharply toward the range high. My focus is on whether buyers can hold above the $0.00439 area and sustain pressure near $0.004404.
A clean break and hold above $0.004404 could open the way toward the next upside levels. If price gets rejected and falls back below $0.00439, the breakout setup would lose momentum.
Trade Setup:
Entry Zone: $0.004390–$0.004402
Take Profit 1: $0.004430
Take Profit 2: $0.004460
Stop Loss: $0.004370
The key will be confirmation rather than chasing the move. Short-term momentum can change quickly, so patience and disciplined risk management remain important.
{alpha}(560x72a22faa6a522c81a8f5d508381e18af3da0921e)
$APM is trading around $0.00440 after pushing up from the $0.00437 area. This zone is important because price is testing the recent intraday high around $0.004404, putting the market at a potential breakout point.
On the 1-minute chart, buyers have maintained control after a period of tight consolidation, with the latest candle pushing sharply toward the range high. My focus is on whether buyers can hold above the $0.00439 area and sustain pressure near $0.004404.
A clean break and hold above $0.004404 could open the way toward the next upside levels. If price gets rejected and falls back below $0.00439, the breakout setup would lose momentum.
Trade Setup:
Entry Zone: $0.004390–$0.004402
Take Profit 1: $0.004430
Take Profit 2: $0.004460
Stop Loss: $0.004370
The key will be confirmation rather than chasing the move. Short-term momentum can change quickly, so patience and disciplined risk management remain important.
On the 1-minute chart, buyers have maintained control after a period of tight consolidation, with the latest candle pushing sharply toward the range high. My focus is on whether buyers can hold above the $0.00439 area and sustain pressure near $0.004404.
A clean break and hold above $0.004404 could open the way toward the next upside levels. If price gets rejected and falls back below $0.00439, the breakout setup would lose momentum.
Trade Setup:
Entry Zone: $0.004390–$0.004402
Take Profit 1: $0.004430
Take Profit 2: $0.004460
Stop Loss: $0.004370
The key will be confirmation rather than chasing the move. Short-term momentum can change quickly, so patience and disciplined risk management remain important.
1
548
·
--
Bullish
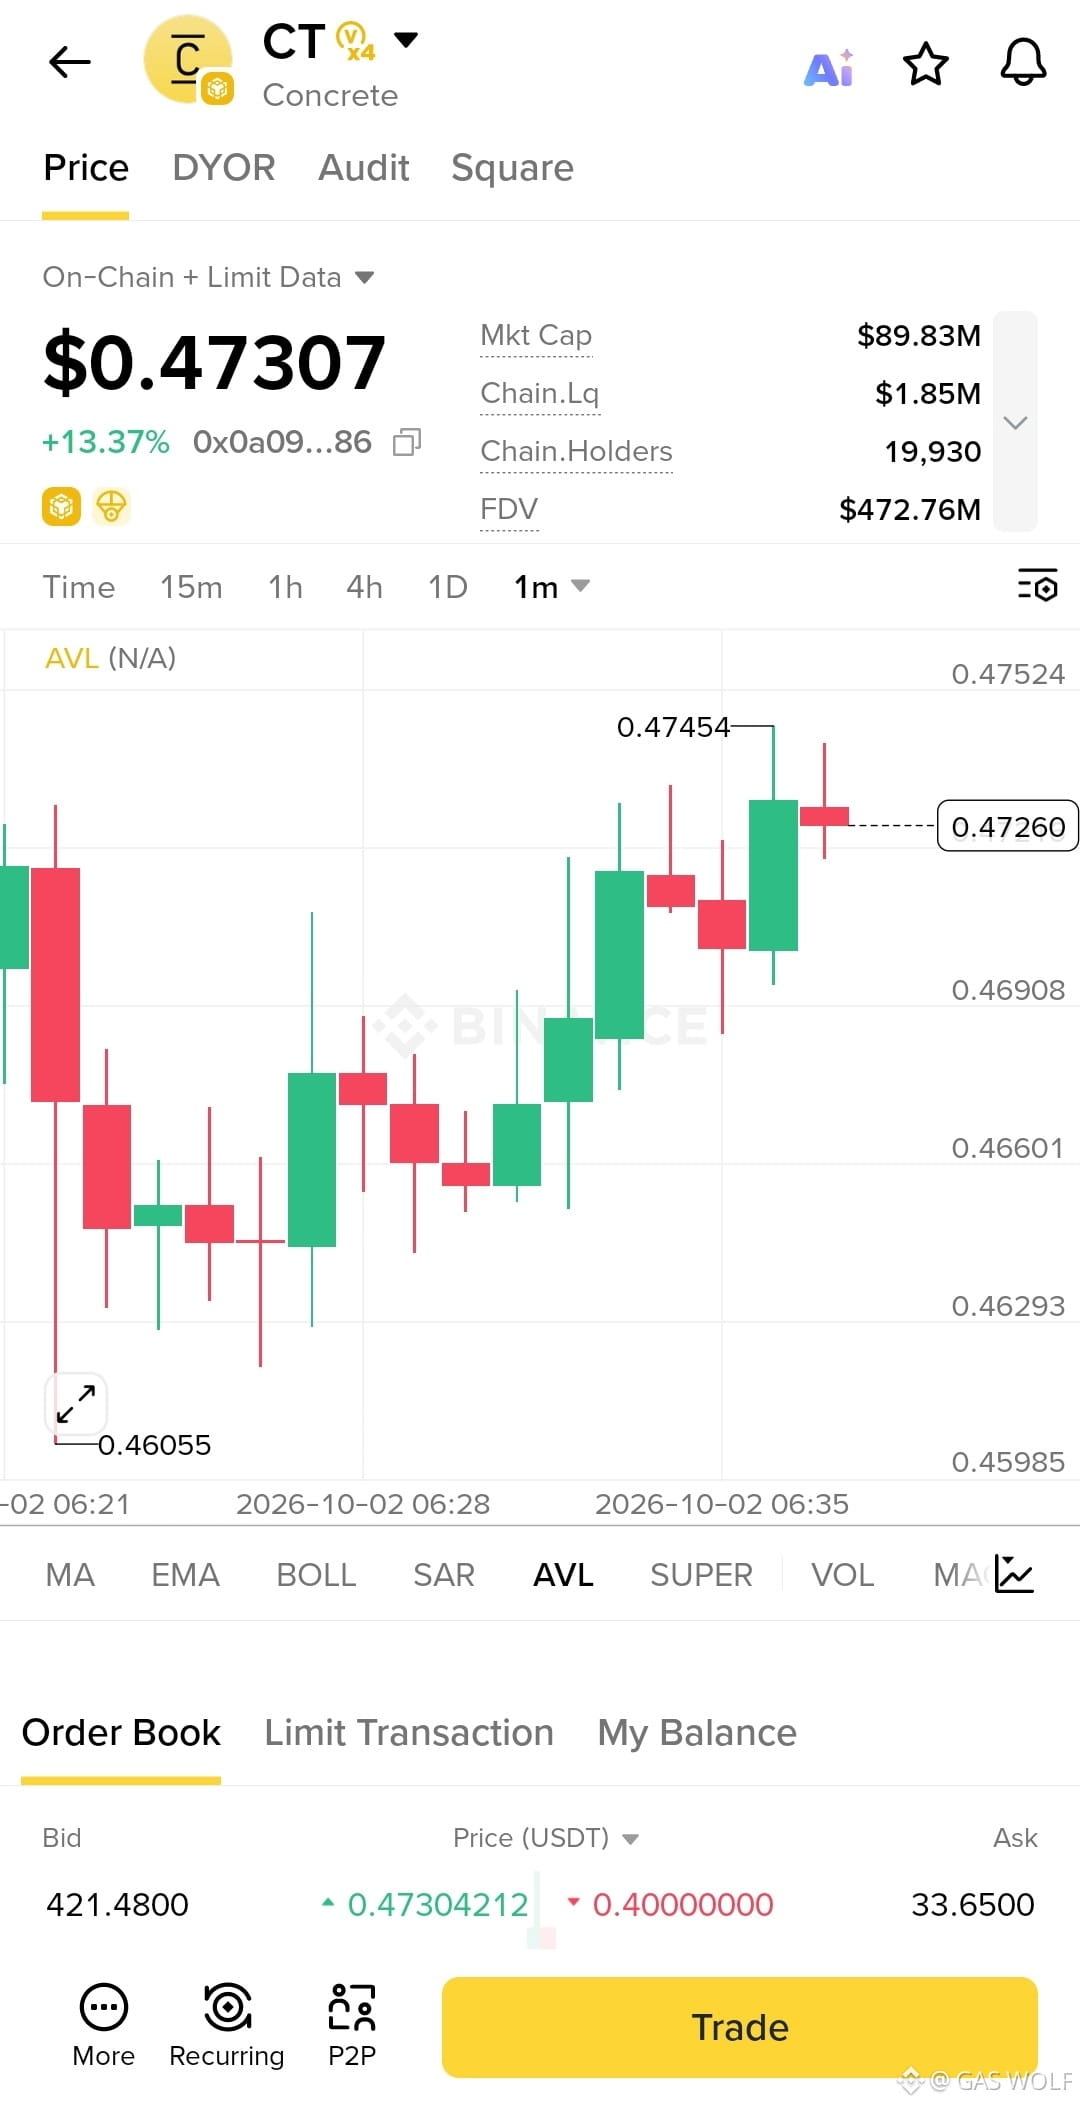
$CT is trading around the $0.472–$0.473 area after recovering strongly from the $0.46055 low. This zone is important because price is now holding near the recent $0.47454 high, where sellers could step in.
On the 1-minute chart, buyers have been pushing higher with a series of higher lows, while price continues to hold above the $0.469 area. My focus is on whether buyers can defend the current zone and make another attempt at the recent high.
A clean break and hold above $0.4745 could provide confirmation for further upside. If momentum continues, the next targets could come into play. On the other hand, losing the $0.469 area would weaken the short-term bullish structure.
Trade Setup:
Entry Zone: $0.4700–$0.4720
Take Profit 1: $0.4745
Take Profit 2: $0.4780
Stop Loss: $0.4660
The key will be confirmation rather than chasing the move. Patience, controlled risk, and avoiding emotional entries matter when trading short-term momentum.
{alpha}(560x0a092e544da31150b439a1aaa1a3a2214a867f46)
$CT is trading around the $0.472–$0.473 area after recovering strongly from the $0.46055 low. This zone is important because price is now holding near the recent $0.47454 high, where sellers could step in.
On the 1-minute chart, buyers have been pushing higher with a series of higher lows, while price continues to hold above the $0.469 area. My focus is on whether buyers can defend the current zone and make another attempt at the recent high.
A clean break and hold above $0.4745 could provide confirmation for further upside. If momentum continues, the next targets could come into play. On the other hand, losing the $0.469 area would weaken the short-term bullish structure.
Trade Setup:
Entry Zone: $0.4700–$0.4720
Take Profit 1: $0.4745
Take Profit 2: $0.4780
Stop Loss: $0.4660
The key will be confirmation rather than chasing the move. Patience, controlled risk, and avoiding emotional entries matter when trading short-term momentum.
On the 1-minute chart, buyers have been pushing higher with a series of higher lows, while price continues to hold above the $0.469 area. My focus is on whether buyers can defend the current zone and make another attempt at the recent high.
A clean break and hold above $0.4745 could provide confirmation for further upside. If momentum continues, the next targets could come into play. On the other hand, losing the $0.469 area would weaken the short-term bullish structure.
Trade Setup:
Entry Zone: $0.4700–$0.4720
Take Profit 1: $0.4745
Take Profit 2: $0.4780
Stop Loss: $0.4660
The key will be confirmation rather than chasing the move. Patience, controlled risk, and avoiding emotional entries matter when trading short-term momentum.
1
606
·
--
Bullish
I’ve been watching $MOVR after the reclaim of $2.00, and at first glance the chart looks pretty straightforward: strong momentum, expanding upside levels, and price holding above a psychologically important area.
The number that caught my attention is $2.00.
Reclaiming it matters because the market is now treating that level differently. Instead of rejecting below it, price is using the area as a potential base, with the current setup centered around $2.05–$2.20.
But then I looked at the move a little differently.
A breakout on the chart is one thing. Sustained demand is another.
The setup currently gives us a clean roadmap:
Entry Zone: $2.05–$2.20
EP: $2.15
TP1: $2.45
TP2: $2.70
TP3: $3.00
SL: $1.90
The interesting part is that $2.45 becomes the real test.
If MOVR reaches that level and simply gets rejected, the breakout could end up being more momentum-driven than structurally supported. But if price can reclaim $2.45, hold it, and continue attracting genuine spot demand, then the move starts looking much more convincing.
That’s where the chart and the underlying market behavior need to agree.
Then it clicked: I’m less interested in whether MOVR can print another green candle and more interested in whether buyers actually defend the levels they just reclaimed.
For now, $2.00 is the line I’m watching underneath and $2.45 is the confirmation above.
The real question: is this the beginning of sustained demand, or just a very convincing breakout before liquidity fades?
Confirmation over chasing. Risk management still matters.
{spot}(MOVRUSDT)
$CT
{alpha}(560x0a092e544da31150b439a1aaa1a3a2214a867f46)
$GLMR
{spot}(GLMRUSDT)
I’ve been watching $MOVR after the reclaim of $2.00, and at first glance the chart looks pretty straightforward: strong momentum, expanding upside levels, and price holding above a psychologically important area.
The number that caught my attention is $2.00.
Reclaiming it matters because the market is now treating that level differently. Instead of rejecting below it, price is using the area as a potential base, with the current setup centered around $2.05–$2.20.
But then I looked at the move a little differently.
A breakout on the chart is one thing. Sustained demand is another.
The setup currently gives us a clean roadmap:
Entry Zone: $2.05–$2.20
EP: $2.15
TP1: $2.45
TP2: $2.70
TP3: $3.00
SL: $1.90
The interesting part is that $2.45 becomes the real test.
If MOVR reaches that level and simply gets rejected, the breakout could end up being more momentum-driven than structurally supported. But if price can reclaim $2.45, hold it, and continue attracting genuine spot demand, then the move starts looking much more convincing.
That’s where the chart and the underlying market behavior need to agree.
Then it clicked: I’m less interested in whether MOVR can print another green candle and more interested in whether buyers actually defend the levels they just reclaimed.
For now, $2.00 is the line I’m watching underneath and $2.45 is the confirmation above.
The real question: is this the beginning of sustained demand, or just a very convincing breakout before liquidity fades?
Confirmation over chasing. Risk management still matters.
$CT
$GLMR
The number that caught my attention is $2.00.
Reclaiming it matters because the market is now treating that level differently. Instead of rejecting below it, price is using the area as a potential base, with the current setup centered around $2.05–$2.20.
But then I looked at the move a little differently.
A breakout on the chart is one thing. Sustained demand is another.
The setup currently gives us a clean roadmap:
Entry Zone: $2.05–$2.20
EP: $2.15
TP1: $2.45
TP2: $2.70
TP3: $3.00
SL: $1.90
The interesting part is that $2.45 becomes the real test.
If MOVR reaches that level and simply gets rejected, the breakout could end up being more momentum-driven than structurally supported. But if price can reclaim $2.45, hold it, and continue attracting genuine spot demand, then the move starts looking much more convincing.
That’s where the chart and the underlying market behavior need to agree.
Then it clicked: I’m less interested in whether MOVR can print another green candle and more interested in whether buyers actually defend the levels they just reclaimed.
For now, $2.00 is the line I’m watching underneath and $2.45 is the confirmation above.
The real question: is this the beginning of sustained demand, or just a very convincing breakout before liquidity fades?
Confirmation over chasing. Risk management still matters.
$CT
$GLMR
A) $2.50-$2.70
18%
B) $2.70-$3.00
18%
C) $3.00
43%
Pullback before another leg up
21%
33 votes • Voting closed
1
1
1.6k
·
--
Bullish
📊 $NMR — Price Action Setup
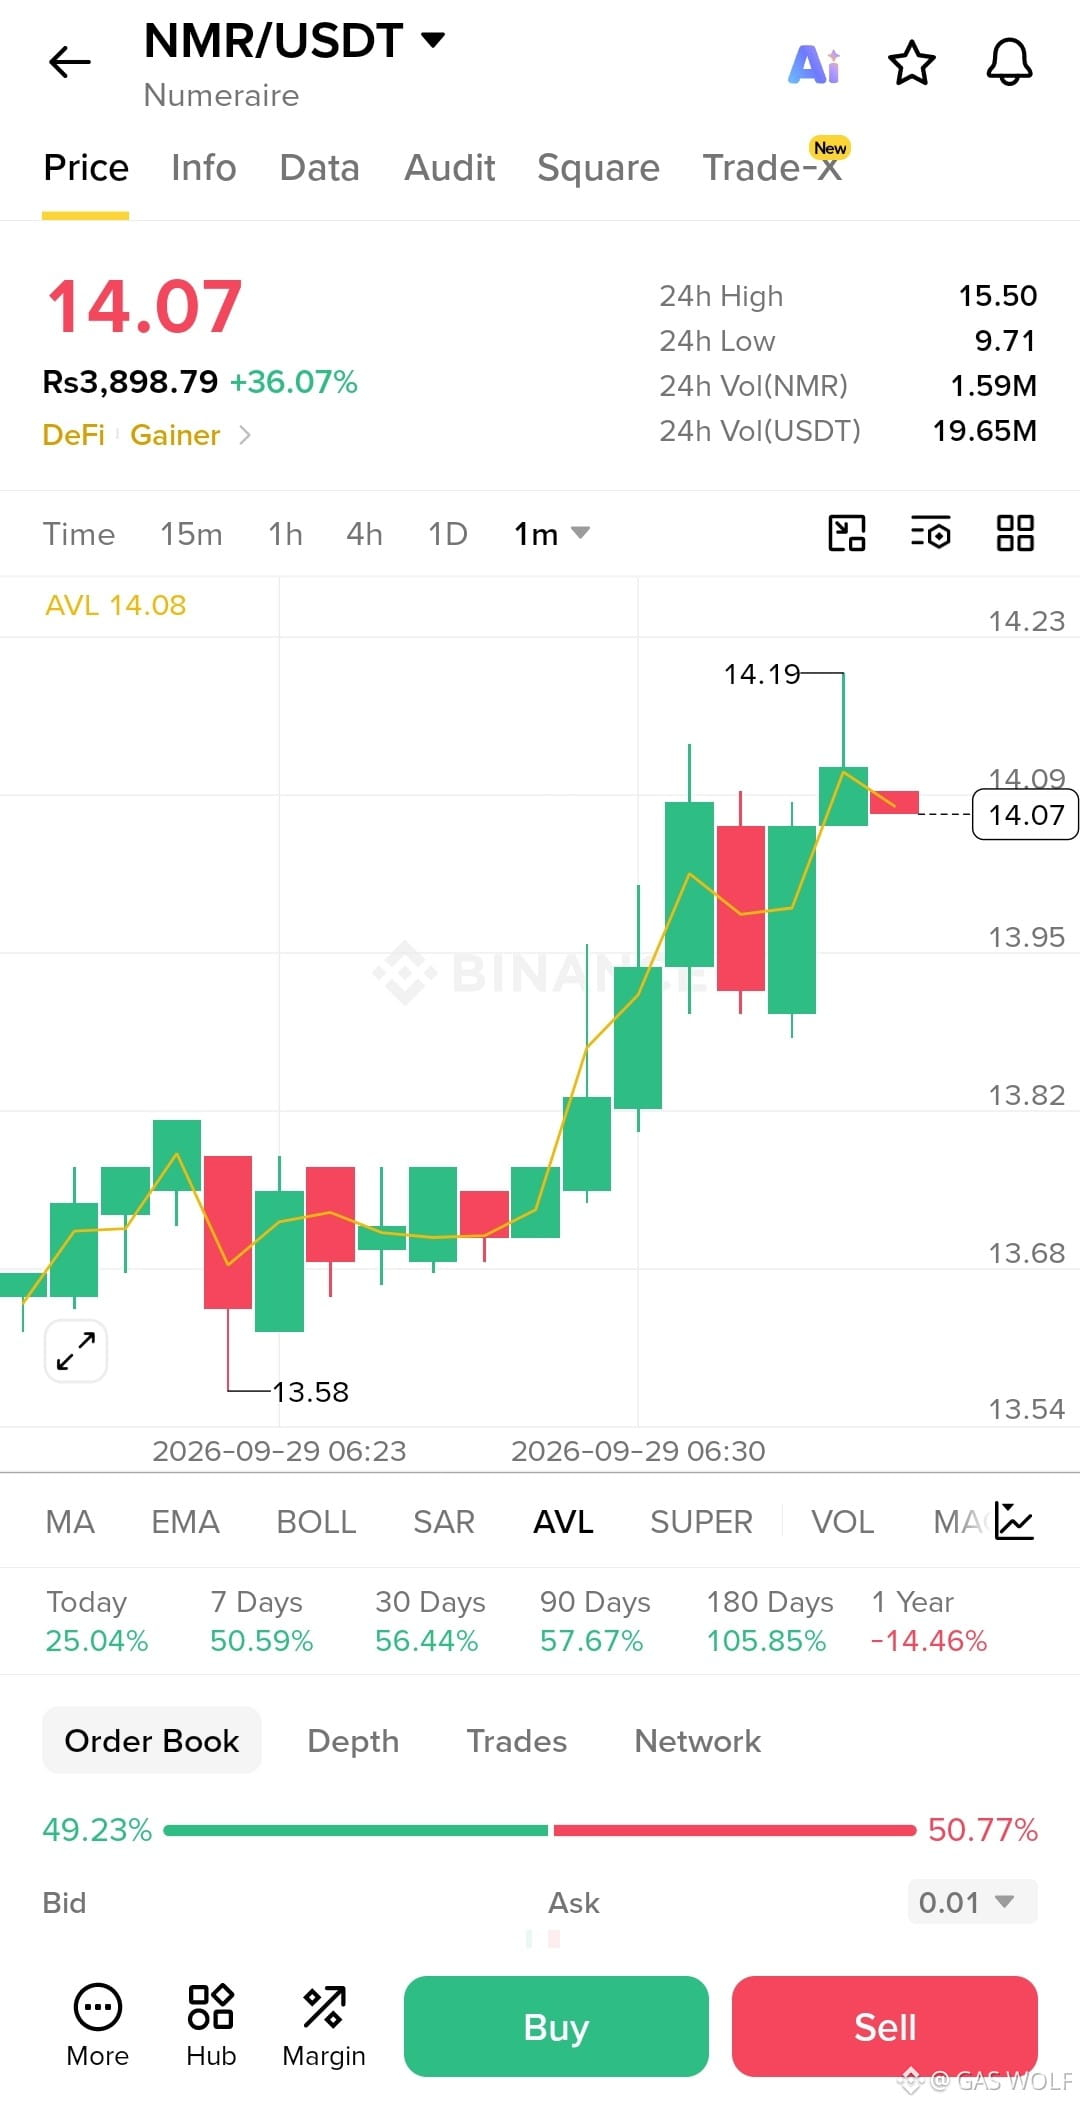
NMR/USDT is trading around $14.07, up roughly 36% in 24H, after recovering strongly from the $13.58 intraday low. This zone is important because price has pushed into the $14.19 local resistance after a sharp series of higher highs and higher lows.
On the 1-minute chart, buyers remain active, with price holding above the $14.00 area after breaking through the earlier $13.82–$13.95 range. However, the latest candle shows some rejection near $14.19, so confirmation is important before expecting another leg higher.
My focus is on whether buyers can defend $13.98–$14.05 and reclaim $14.19 with follow-through. A confirmed breakout could bring $14.35 and then $14.60 into focus. If $13.95 breaks decisively, the current short-term bullish structure could weaken.
Trade Setup:
Entry Zone: $14.00–$14.10
Take Profit 1: $14.35
Take Profit 2: $14.60
Stop Loss: $13.85
The key will be confirmation rather than chasing the move. With NMR already up sharply and trading near the intraday high, patience, position sizing, and disciplined risk management matter.
{spot}(NMRUSDT)
#UKFCAWinsCourtOrderToRecover851400Pounds #ChainlinkLaunchesCCIP2WithEnterpriseVerification #QNTFallsOver40%FromMorningHigh #USDTAdds845900HoldersInPast7Days #KospiFalls2.7%SamsungSKHynixDropOver5%
📊 $NMR — Price Action Setup
NMR/USDT is trading around $14.07, up roughly 36% in 24H, after recovering strongly from the $13.58 intraday low. This zone is important because price has pushed into the $14.19 local resistance after a sharp series of higher highs and higher lows.
On the 1-minute chart, buyers remain active, with price holding above the $14.00 area after breaking through the earlier $13.82–$13.95 range. However, the latest candle shows some rejection near $14.19, so confirmation is important before expecting another leg higher.
My focus is on whether buyers can defend $13.98–$14.05 and reclaim $14.19 with follow-through. A confirmed breakout could bring $14.35 and then $14.60 into focus. If $13.95 breaks decisively, the current short-term bullish structure could weaken.
Trade Setup:
Entry Zone: $14.00–$14.10
Take Profit 1: $14.35
Take Profit 2: $14.60
Stop Loss: $13.85
The key will be confirmation rather than chasing the move. With NMR already up sharply and trading near the intraday high, patience, position sizing, and disciplined risk management matter.
#UKFCAWinsCourtOrderToRecover851400Pounds #ChainlinkLaunchesCCIP2WithEnterpriseVerification #QNTFallsOver40%FromMorningHigh #USDTAdds845900HoldersInPast7Days #KospiFalls2.7%SamsungSKHynixDropOver5%
NMR/USDT is trading around $14.07, up roughly 36% in 24H, after recovering strongly from the $13.58 intraday low. This zone is important because price has pushed into the $14.19 local resistance after a sharp series of higher highs and higher lows.
On the 1-minute chart, buyers remain active, with price holding above the $14.00 area after breaking through the earlier $13.82–$13.95 range. However, the latest candle shows some rejection near $14.19, so confirmation is important before expecting another leg higher.
My focus is on whether buyers can defend $13.98–$14.05 and reclaim $14.19 with follow-through. A confirmed breakout could bring $14.35 and then $14.60 into focus. If $13.95 breaks decisively, the current short-term bullish structure could weaken.
Trade Setup:
Entry Zone: $14.00–$14.10
Take Profit 1: $14.35
Take Profit 2: $14.60
Stop Loss: $13.85
The key will be confirmation rather than chasing the move. With NMR already up sharply and trading near the intraday high, patience, position sizing, and disciplined risk management matter.
#UKFCAWinsCourtOrderToRecover851400Pounds #ChainlinkLaunchesCCIP2WithEnterpriseVerification #QNTFallsOver40%FromMorningHigh #USDTAdds845900HoldersInPast7Days #KospiFalls2.7%SamsungSKHynixDropOver5%
197
·
--
Bullish
📊 $AKE — Price Action Setup
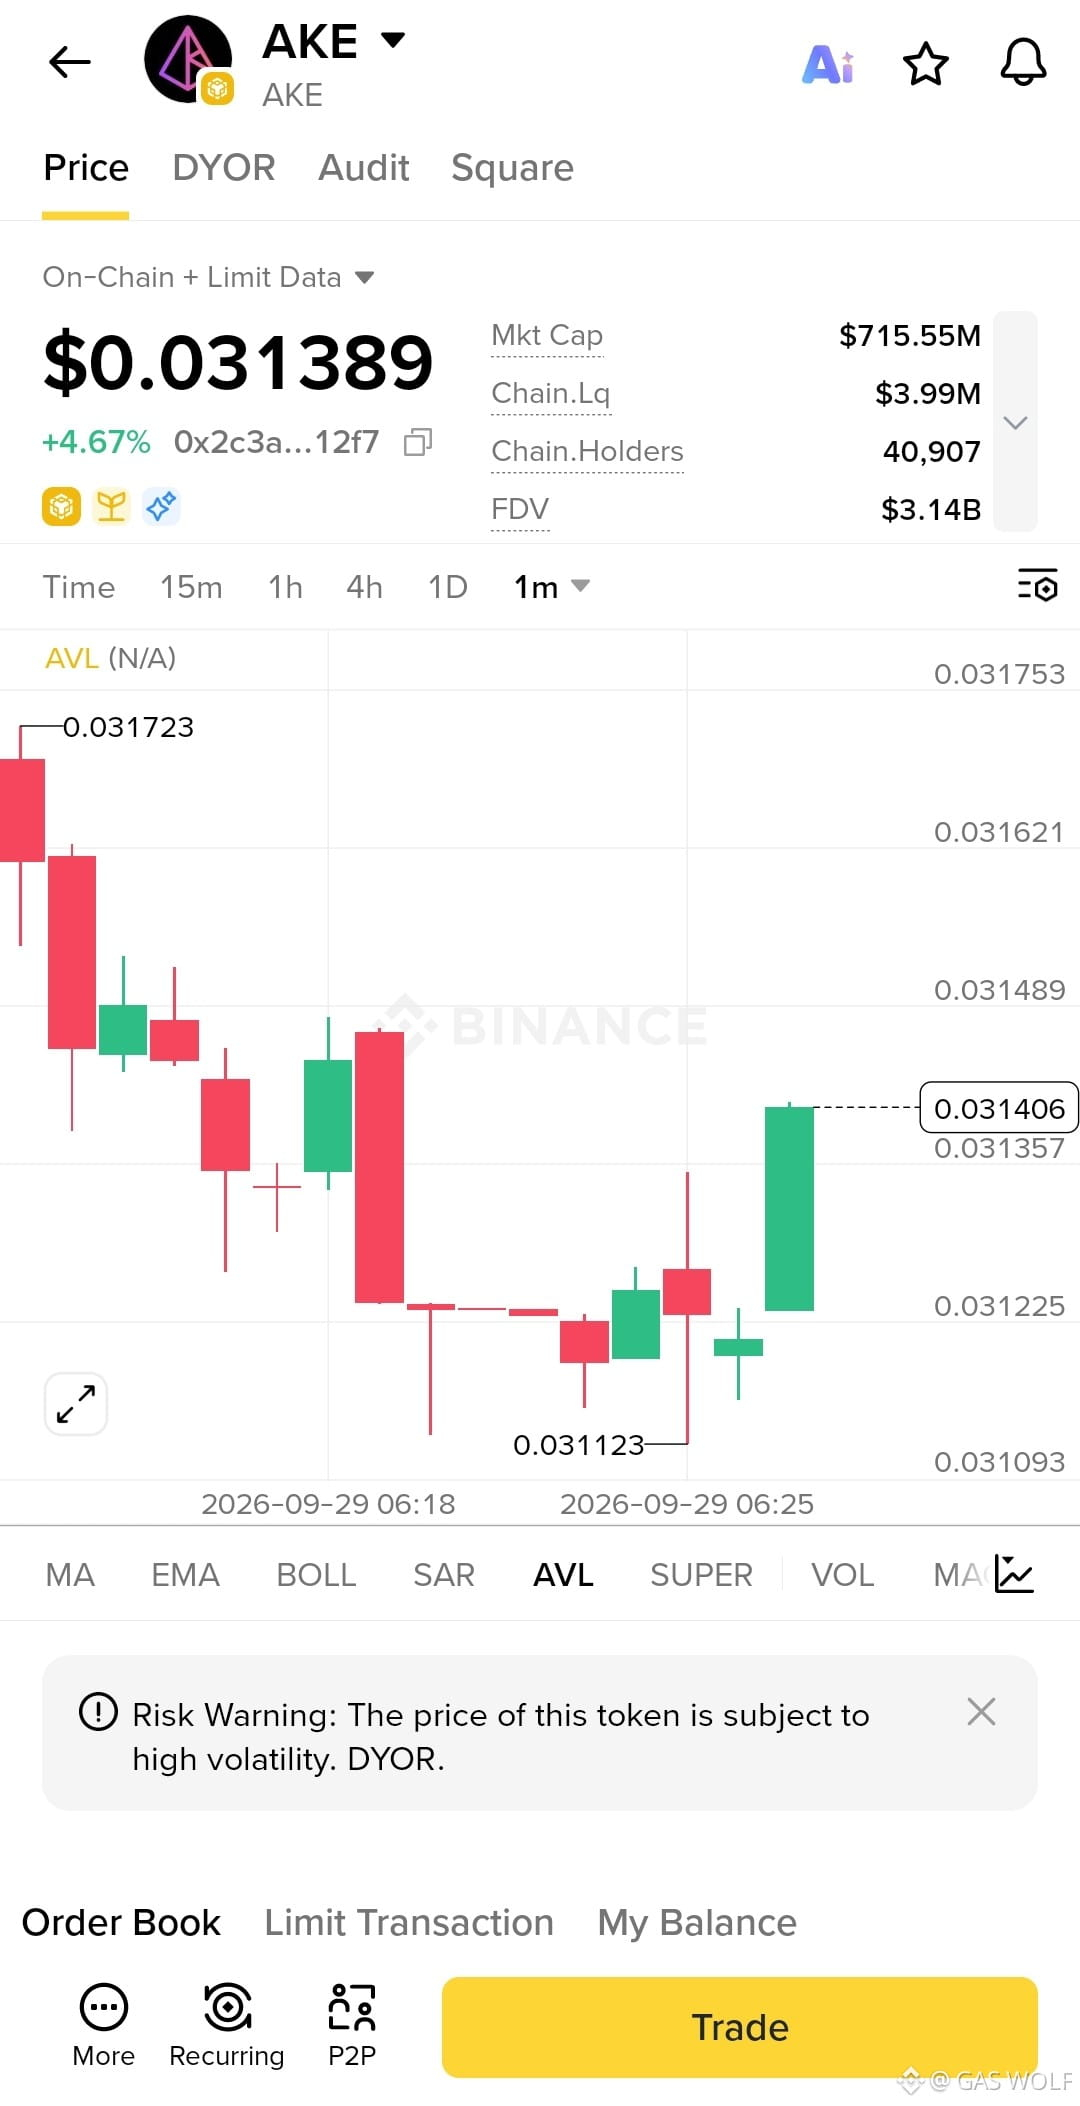
AKE is trading around $0.031389, up roughly 4.67%, after recovering from the $0.031123 low. This area is important because price has bounced sharply from the session low and is now testing the $0.03140–$0.03150 resistance zone.
On the 1-minute chart, buyers have stepped back in with a strong recovery candle, but the broader short-term structure is still recovering from the earlier decline. The key question is whether buyers can turn the recent resistance into support rather than seeing another rejection.
My focus is on whether buyers can defend $0.03125–$0.03135 and reclaim $0.03150 with follow-through. A confirmed breakout could bring $0.03175 and then $0.03200 into focus. If $0.03112 breaks decisively, the current recovery setup would weaken.
Trade Setup:
Entry Zone: $0.03125–$0.03140
Take Profit 1: $0.03175
Take Profit 2: $0.03200
Stop Loss: $0.03110
The key will be confirmation rather than chasing the move. With AKE showing elevated volatility and the chart itself warning of high risk, patience, position sizing, and disciplined risk management matter.
{future}(AKEUSDT)
#UKFCAWinsCourtOrderToRecover851400Pounds #ChainlinkLaunchesCCIP2WithEnterpriseVerification #QNTFallsOver40%FromMorningHigh #QNTFallsOver40%FromMorningHigh #KospiFalls2.7%SamsungSKHynixDropOver5%
📊 $AKE — Price Action Setup
AKE is trading around $0.031389, up roughly 4.67%, after recovering from the $0.031123 low. This area is important because price has bounced sharply from the session low and is now testing the $0.03140–$0.03150 resistance zone.
On the 1-minute chart, buyers have stepped back in with a strong recovery candle, but the broader short-term structure is still recovering from the earlier decline. The key question is whether buyers can turn the recent resistance into support rather than seeing another rejection.
My focus is on whether buyers can defend $0.03125–$0.03135 and reclaim $0.03150 with follow-through. A confirmed breakout could bring $0.03175 and then $0.03200 into focus. If $0.03112 breaks decisively, the current recovery setup would weaken.
Trade Setup:
Entry Zone: $0.03125–$0.03140
Take Profit 1: $0.03175
Take Profit 2: $0.03200
Stop Loss: $0.03110
The key will be confirmation rather than chasing the move. With AKE showing elevated volatility and the chart itself warning of high risk, patience, position sizing, and disciplined risk management matter.
#UKFCAWinsCourtOrderToRecover851400Pounds #ChainlinkLaunchesCCIP2WithEnterpriseVerification #QNTFallsOver40%FromMorningHigh #QNTFallsOver40%FromMorningHigh #KospiFalls2.7%SamsungSKHynixDropOver5%
AKE is trading around $0.031389, up roughly 4.67%, after recovering from the $0.031123 low. This area is important because price has bounced sharply from the session low and is now testing the $0.03140–$0.03150 resistance zone.
On the 1-minute chart, buyers have stepped back in with a strong recovery candle, but the broader short-term structure is still recovering from the earlier decline. The key question is whether buyers can turn the recent resistance into support rather than seeing another rejection.
My focus is on whether buyers can defend $0.03125–$0.03135 and reclaim $0.03150 with follow-through. A confirmed breakout could bring $0.03175 and then $0.03200 into focus. If $0.03112 breaks decisively, the current recovery setup would weaken.
Trade Setup:
Entry Zone: $0.03125–$0.03140
Take Profit 1: $0.03175
Take Profit 2: $0.03200
Stop Loss: $0.03110
The key will be confirmation rather than chasing the move. With AKE showing elevated volatility and the chart itself warning of high risk, patience, position sizing, and disciplined risk management matter.
#UKFCAWinsCourtOrderToRecover851400Pounds #ChainlinkLaunchesCCIP2WithEnterpriseVerification #QNTFallsOver40%FromMorningHigh #QNTFallsOver40%FromMorningHigh #KospiFalls2.7%SamsungSKHynixDropOver5%
376
·
--
Bullish
📊 $CASHCAT — Price Action Setup
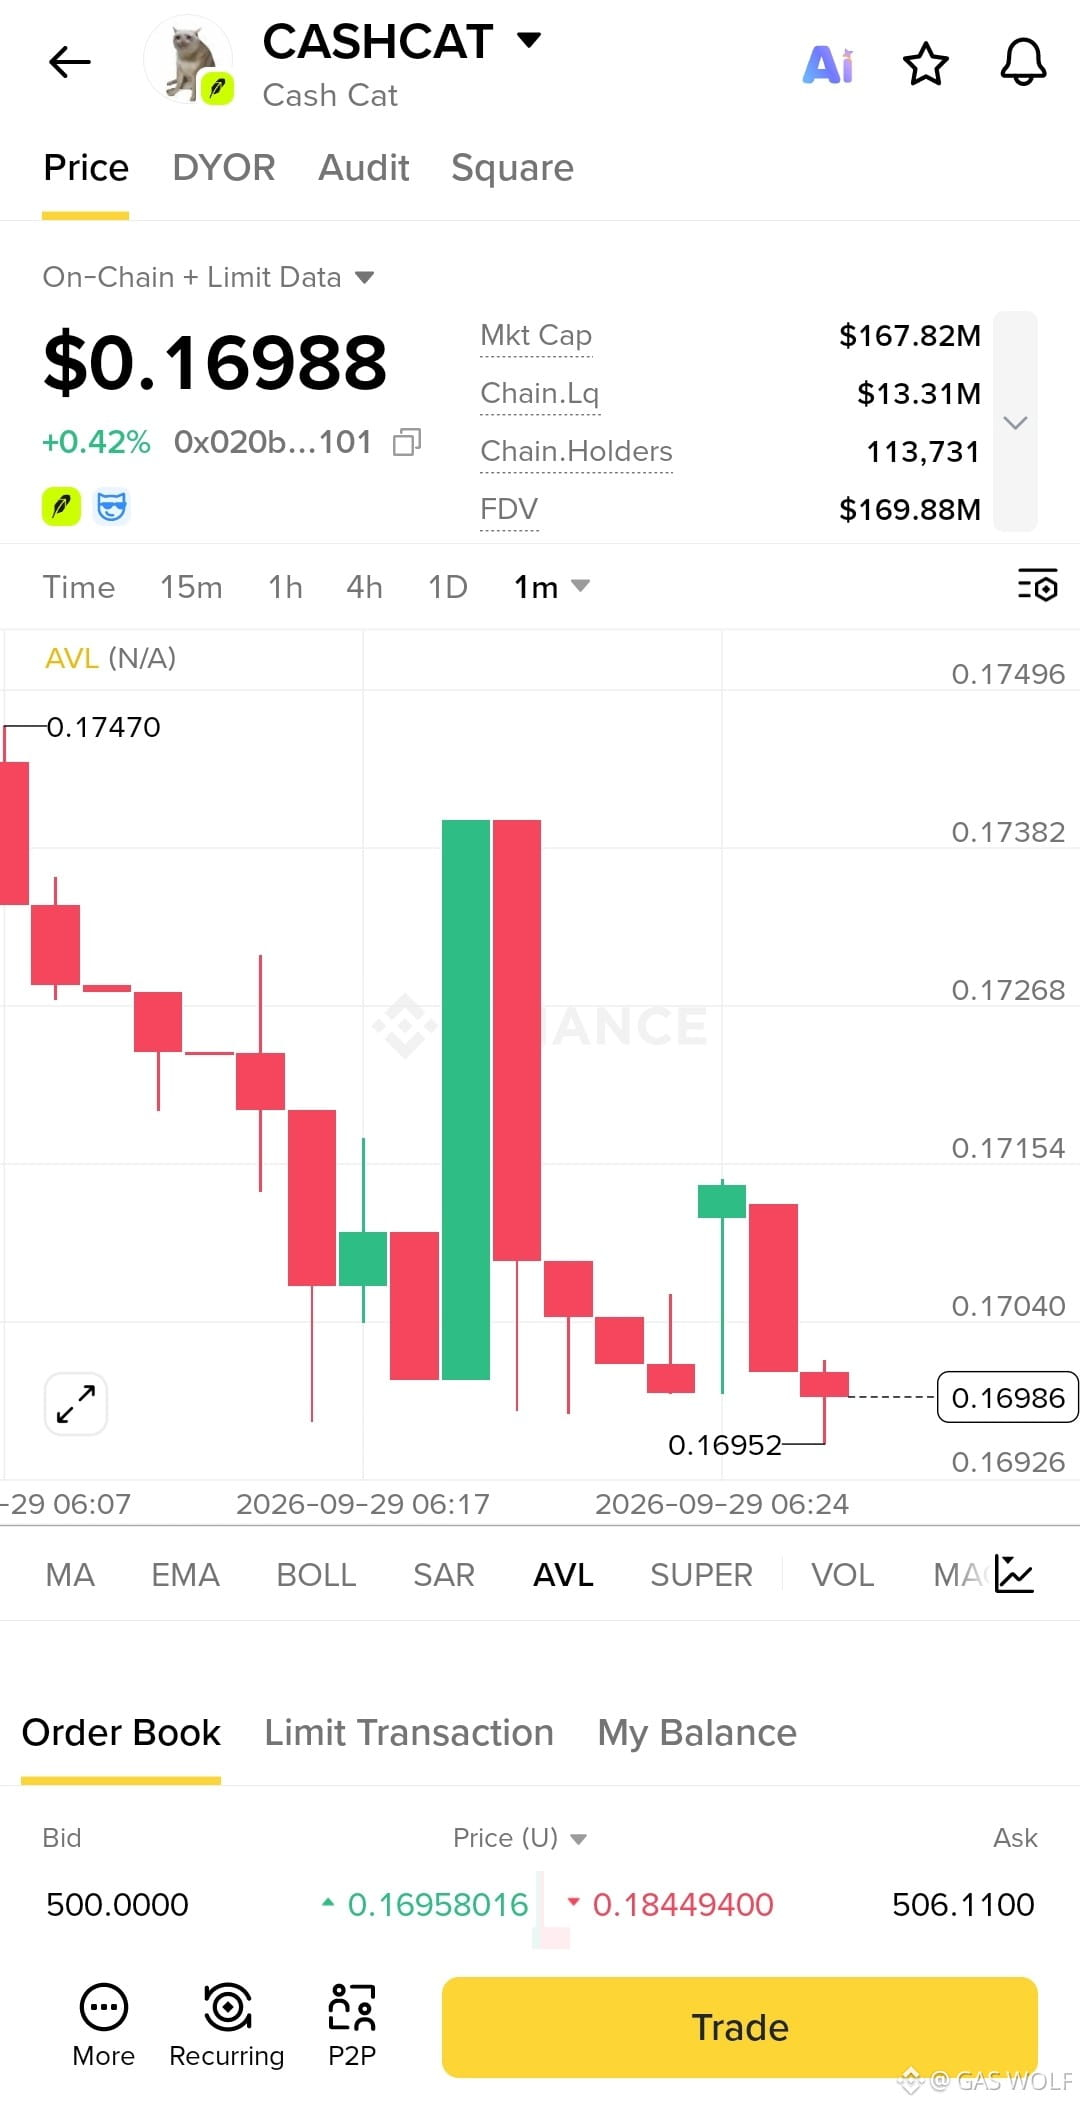
CASHCAT is trading around $0.16988, holding just above the recent $0.16952 low after failing to sustain the rebound toward $0.17382. This zone is important because price is sitting near the lower end of the current 1-minute range.
On the 1-minute chart, sellers remain active, with the latest candles returning toward $0.16950 after a sharp rejection from the $0.1738 area. Buyers need to defend this support and reclaim $0.17040–$0.17100 to show that the short-term structure is starting to recover.
My focus is on whether buyers can defend $0.16950–$0.16970 and push back above $0.17100 with follow-through. A confirmed recovery could bring $0.17270 and then $0.17380 into focus. If $0.16950 breaks decisively, the current recovery setup would be invalidated.
Trade Setup:
Entry Zone: $0.16960–$0.17000
Take Profit 1: $0.17270
Take Profit 2: $0.17380
Stop Loss: $0.16890
The key will be confirmation rather than chasing the move. With CASHCAT trading near fresh intraday lows and showing sharp volatility, patience, position sizing, and disciplined risk management matter.
{alpha}(46630x020bfc650a365f8bb26819deaabf3e21291018b4)
#UKFCAWinsCourtOrderToRecover851400Pounds #ChainlinkLaunchesCCIP2WithEnterpriseVerification #QNTFallsOver40%FromMorningHigh #USDTAdds845900HoldersInPast7Days #KospiFalls2.7%SamsungSKHynixDropOver5%
📊 $CASHCAT — Price Action Setup
CASHCAT is trading around $0.16988, holding just above the recent $0.16952 low after failing to sustain the rebound toward $0.17382. This zone is important because price is sitting near the lower end of the current 1-minute range.
On the 1-minute chart, sellers remain active, with the latest candles returning toward $0.16950 after a sharp rejection from the $0.1738 area. Buyers need to defend this support and reclaim $0.17040–$0.17100 to show that the short-term structure is starting to recover.
My focus is on whether buyers can defend $0.16950–$0.16970 and push back above $0.17100 with follow-through. A confirmed recovery could bring $0.17270 and then $0.17380 into focus. If $0.16950 breaks decisively, the current recovery setup would be invalidated.
Trade Setup:
Entry Zone: $0.16960–$0.17000
Take Profit 1: $0.17270
Take Profit 2: $0.17380
Stop Loss: $0.16890
The key will be confirmation rather than chasing the move. With CASHCAT trading near fresh intraday lows and showing sharp volatility, patience, position sizing, and disciplined risk management matter.
#UKFCAWinsCourtOrderToRecover851400Pounds #ChainlinkLaunchesCCIP2WithEnterpriseVerification #QNTFallsOver40%FromMorningHigh #USDTAdds845900HoldersInPast7Days #KospiFalls2.7%SamsungSKHynixDropOver5%
CASHCAT is trading around $0.16988, holding just above the recent $0.16952 low after failing to sustain the rebound toward $0.17382. This zone is important because price is sitting near the lower end of the current 1-minute range.
On the 1-minute chart, sellers remain active, with the latest candles returning toward $0.16950 after a sharp rejection from the $0.1738 area. Buyers need to defend this support and reclaim $0.17040–$0.17100 to show that the short-term structure is starting to recover.
My focus is on whether buyers can defend $0.16950–$0.16970 and push back above $0.17100 with follow-through. A confirmed recovery could bring $0.17270 and then $0.17380 into focus. If $0.16950 breaks decisively, the current recovery setup would be invalidated.
Trade Setup:
Entry Zone: $0.16960–$0.17000
Take Profit 1: $0.17270
Take Profit 2: $0.17380
Stop Loss: $0.16890
The key will be confirmation rather than chasing the move. With CASHCAT trading near fresh intraday lows and showing sharp volatility, patience, position sizing, and disciplined risk management matter.
#UKFCAWinsCourtOrderToRecover851400Pounds #ChainlinkLaunchesCCIP2WithEnterpriseVerification #QNTFallsOver40%FromMorningHigh #USDTAdds845900HoldersInPast7Days #KospiFalls2.7%SamsungSKHynixDropOver5%
182
·
--
Bullish
📊 $KII
{alpha}(560xeec6574eabba52bac3f0277f2cd5ac7e67197886)
# — Price Action Setup
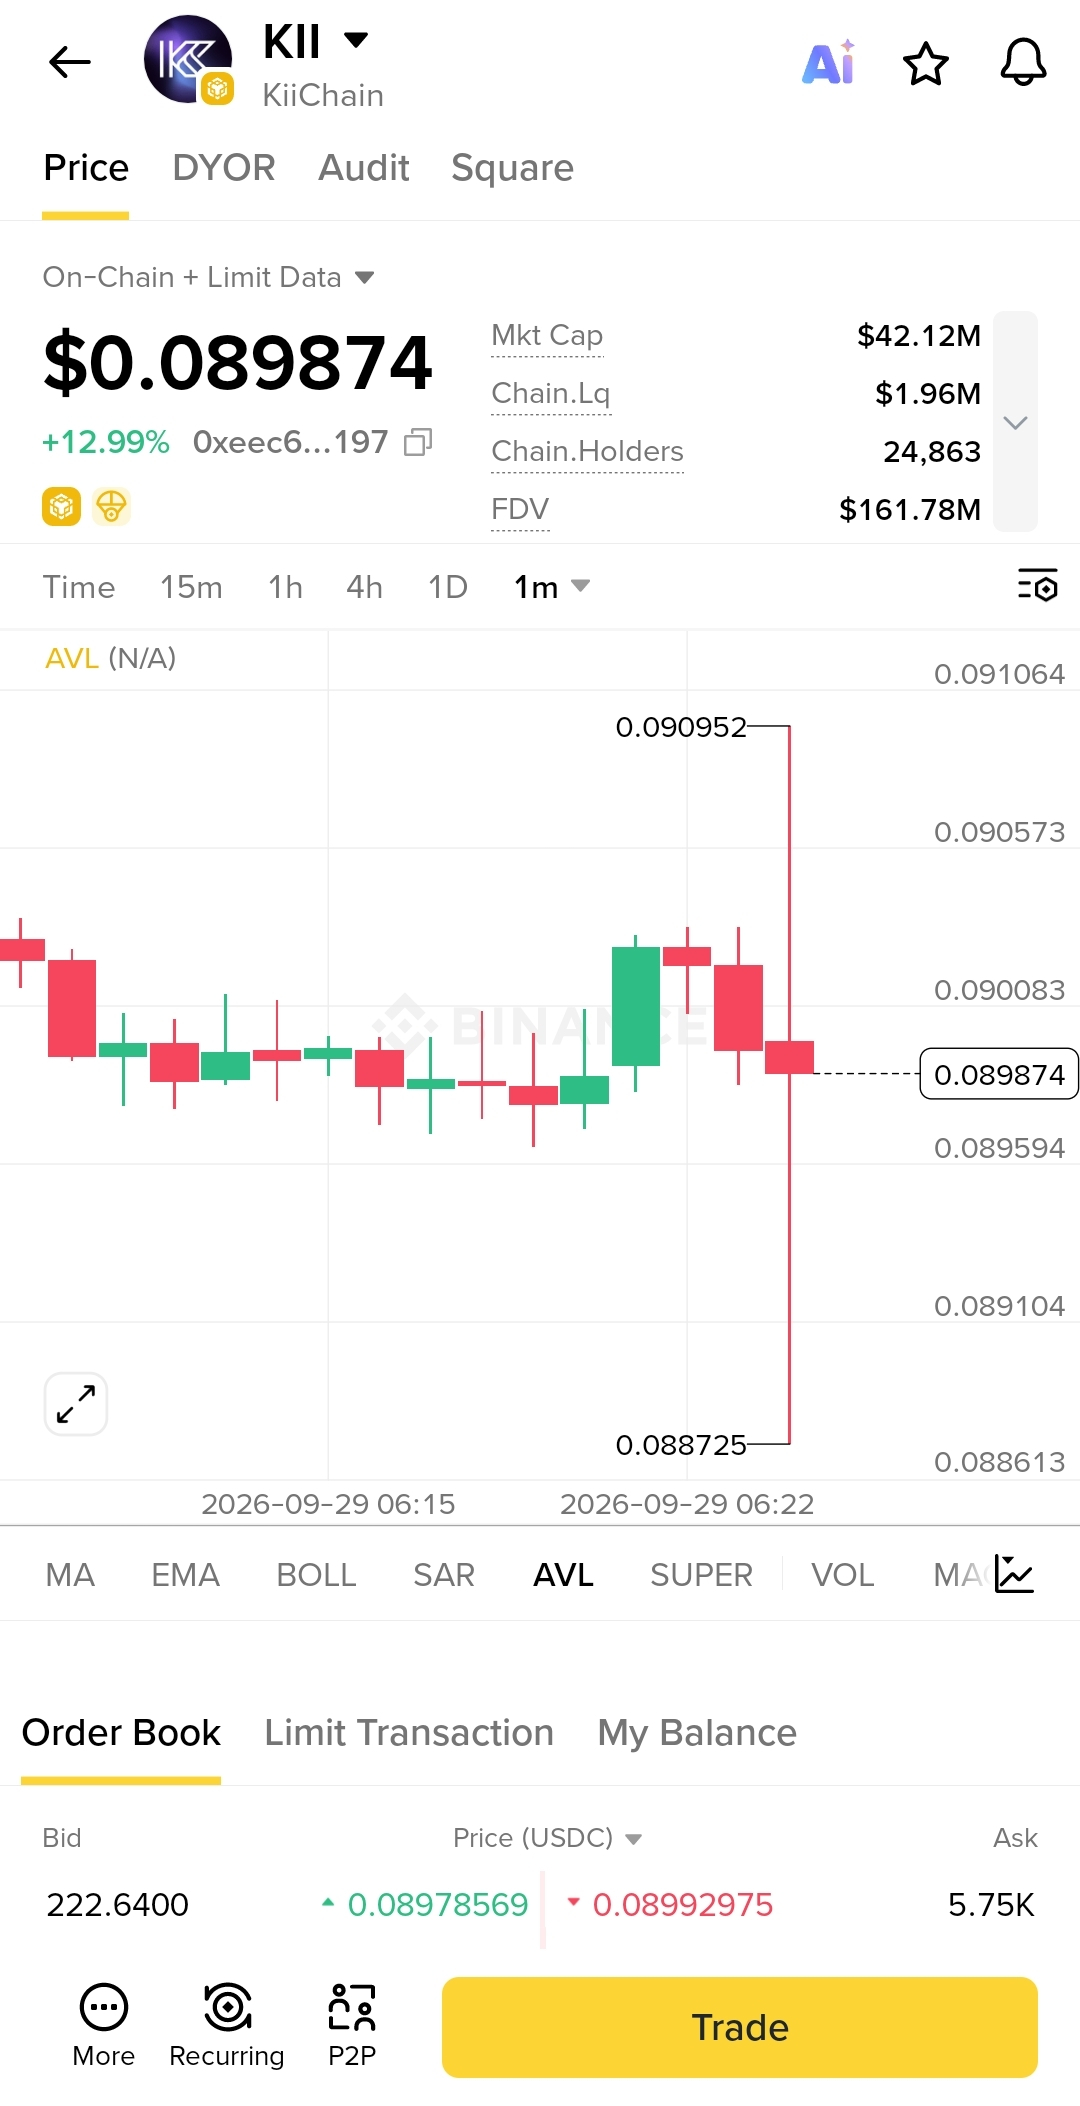
KII is trading around $0.08987, up roughly 13%, after a volatile move between the $0.08873 low and $0.09095 high. This zone is important because price is now consolidating near $0.09000 after testing both sides of the recent range.
On the 1-minute chart, price briefly pushed above $0.09057 before a sharp rejection, while the long lower wick toward $0.08873 shows buyers also stepped in aggressively at lower levels. The immediate battle is around $0.08960–$0.09000.
My focus is on whether buyers can defend $0.08960–$0.08980 and reclaim $0.09010–$0.09020 with follow-through. A confirmed recovery could bring $0.09095 and then $0.09150 into focus. If $0.08960 breaks decisively, the recent low around $0.08873 could come back into play.
Trade Setup:
Entry Zone: $0.08965–$0.08990
Take Profit 1: $0.09095
Take Profit 2: $0.09150
Stop Loss: $0.08910
The key will be confirmation rather than chasing the move. With KII showing sharp i#ChainlinkLaunchesCCIP2WithEnterpriseVerification #UKFCAWinsCourtOrderToRecover851400Pounds #QNTFallsOver40%FromMorningHigh #USDTAdds845900HoldersInPast7Days #KospiFalls2.7%SamsungSKHynixDropOver5% ntraminute volatility, patience, position sizing, and disciplined risk management matter.
📊 $KII
# — Price Action Setup
KII is trading around $0.08987, up roughly 13%, after a volatile move between the $0.08873 low and $0.09095 high. This zone is important because price is now consolidating near $0.09000 after testing both sides of the recent range.
On the 1-minute chart, price briefly pushed above $0.09057 before a sharp rejection, while the long lower wick toward $0.08873 shows buyers also stepped in aggressively at lower levels. The immediate battle is around $0.08960–$0.09000.
My focus is on whether buyers can defend $0.08960–$0.08980 and reclaim $0.09010–$0.09020 with follow-through. A confirmed recovery could bring $0.09095 and then $0.09150 into focus. If $0.08960 breaks decisively, the recent low around $0.08873 could come back into play.
Trade Setup:
Entry Zone: $0.08965–$0.08990
Take Profit 1: $0.09095
Take Profit 2: $0.09150
Stop Loss: $0.08910
The key will be confirmation rather than chasing the move. With KII showing sharp i#ChainlinkLaunchesCCIP2WithEnterpriseVerification #UKFCAWinsCourtOrderToRecover851400Pounds #QNTFallsOver40%FromMorningHigh #USDTAdds845900HoldersInPast7Days #KospiFalls2.7%SamsungSKHynixDropOver5% ntraminute volatility, patience, position sizing, and disciplined risk management matter.
# — Price Action Setup
KII is trading around $0.08987, up roughly 13%, after a volatile move between the $0.08873 low and $0.09095 high. This zone is important because price is now consolidating near $0.09000 after testing both sides of the recent range.
On the 1-minute chart, price briefly pushed above $0.09057 before a sharp rejection, while the long lower wick toward $0.08873 shows buyers also stepped in aggressively at lower levels. The immediate battle is around $0.08960–$0.09000.
My focus is on whether buyers can defend $0.08960–$0.08980 and reclaim $0.09010–$0.09020 with follow-through. A confirmed recovery could bring $0.09095 and then $0.09150 into focus. If $0.08960 breaks decisively, the recent low around $0.08873 could come back into play.
Trade Setup:
Entry Zone: $0.08965–$0.08990
Take Profit 1: $0.09095
Take Profit 2: $0.09150
Stop Loss: $0.08910
The key will be confirmation rather than chasing the move. With KII showing sharp i#ChainlinkLaunchesCCIP2WithEnterpriseVerification #UKFCAWinsCourtOrderToRecover851400Pounds #QNTFallsOver40%FromMorningHigh #USDTAdds845900HoldersInPast7Days #KospiFalls2.7%SamsungSKHynixDropOver5% ntraminute volatility, patience, position sizing, and disciplined risk management matter.
285
·
--
Bullish
📊 $XDP — Price Action Setup
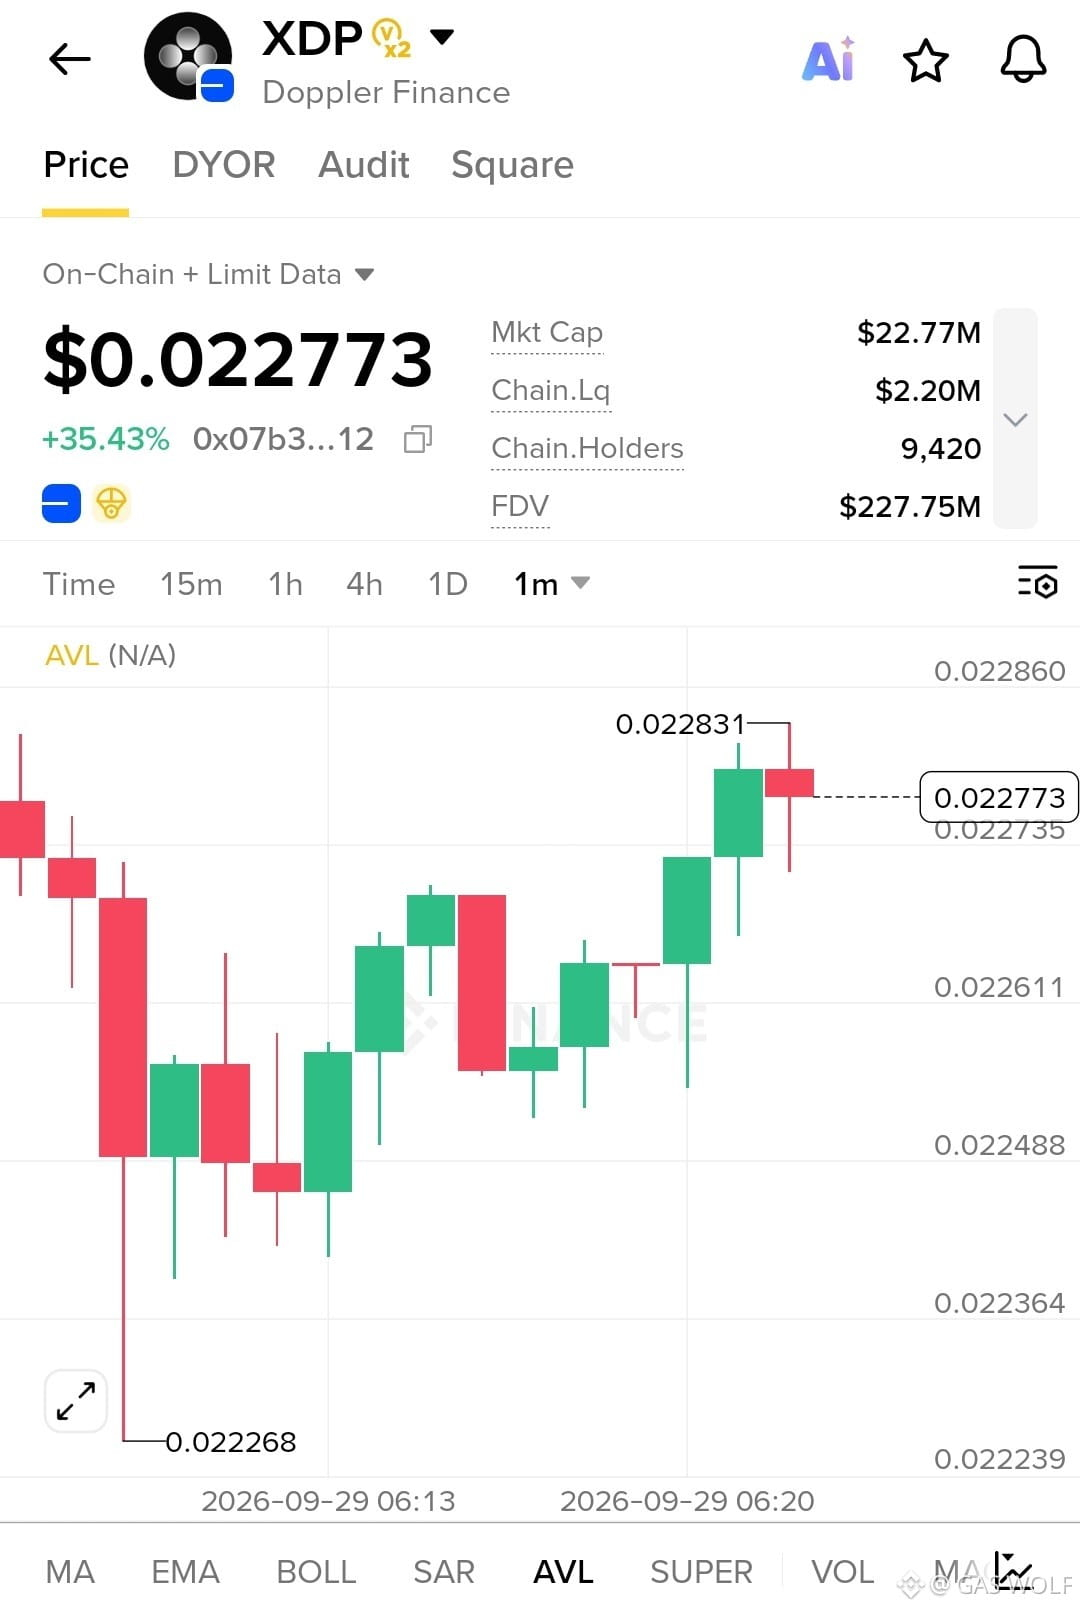
XDP is trading around $0.02277, up roughly 35%, after recovering from the $0.022268 low and pushing into the $0.022831 resistance area. This zone is important because price is now testing the recent local high after a strong intraday recovery.
On the 1-minute chart, buyers have taken short-term control, with a sequence of higher lows and higher highs developing from the session low. However, the latest candle shows some rejection near $0.02283, so confirmation is important before assuming another breakout.
My focus is on whether buyers can defend $0.02270–$0.02275 and reclaim $0.02283 with follow-through. A clean breakout could bring $0.02300 and $0.02320 into focus. If price loses $0.02260, the short-term bullish structure could weaken.
Trade Setup:
Entry Zone: $0.02265–$0.02275
Take Profit 1: $0.02300
Take Profit 2: $0.02320
Stop Loss: $0.02245
The key will be confirmation rather than chasing the move. After a sharp 35% move and with XDP trading near local highs, patience, position sizing, and disciplined risk management matter.
{alpha}(84530x07b3d902783c3c12b077508c3b5c00113d1291d0)
#UKFCAWinsCourtOrderToRecover851400Pounds #ChainlinkLaunchesCCIP2WithEnterpriseVerification #QNTFallsOver40%FromMorningHigh #USDTAdds845900HoldersInPast7Days #KospiFalls2.7%SamsungSKHynixDropOver5%
📊 $XDP — Price Action Setup
XDP is trading around $0.02277, up roughly 35%, after recovering from the $0.022268 low and pushing into the $0.022831 resistance area. This zone is important because price is now testing the recent local high after a strong intraday recovery.
On the 1-minute chart, buyers have taken short-term control, with a sequence of higher lows and higher highs developing from the session low. However, the latest candle shows some rejection near $0.02283, so confirmation is important before assuming another breakout.
My focus is on whether buyers can defend $0.02270–$0.02275 and reclaim $0.02283 with follow-through. A clean breakout could bring $0.02300 and $0.02320 into focus. If price loses $0.02260, the short-term bullish structure could weaken.
Trade Setup:
Entry Zone: $0.02265–$0.02275
Take Profit 1: $0.02300
Take Profit 2: $0.02320
Stop Loss: $0.02245
The key will be confirmation rather than chasing the move. After a sharp 35% move and with XDP trading near local highs, patience, position sizing, and disciplined risk management matter.
#UKFCAWinsCourtOrderToRecover851400Pounds #ChainlinkLaunchesCCIP2WithEnterpriseVerification #QNTFallsOver40%FromMorningHigh #USDTAdds845900HoldersInPast7Days #KospiFalls2.7%SamsungSKHynixDropOver5%
XDP is trading around $0.02277, up roughly 35%, after recovering from the $0.022268 low and pushing into the $0.022831 resistance area. This zone is important because price is now testing the recent local high after a strong intraday recovery.
On the 1-minute chart, buyers have taken short-term control, with a sequence of higher lows and higher highs developing from the session low. However, the latest candle shows some rejection near $0.02283, so confirmation is important before assuming another breakout.
My focus is on whether buyers can defend $0.02270–$0.02275 and reclaim $0.02283 with follow-through. A clean breakout could bring $0.02300 and $0.02320 into focus. If price loses $0.02260, the short-term bullish structure could weaken.
Trade Setup:
Entry Zone: $0.02265–$0.02275
Take Profit 1: $0.02300
Take Profit 2: $0.02320
Stop Loss: $0.02245
The key will be confirmation rather than chasing the move. After a sharp 35% move and with XDP trading near local highs, patience, position sizing, and disciplined risk management matter.
#UKFCAWinsCourtOrderToRecover851400Pounds #ChainlinkLaunchesCCIP2WithEnterpriseVerification #QNTFallsOver40%FromMorningHigh #USDTAdds845900HoldersInPast7Days #KospiFalls2.7%SamsungSKHynixDropOver5%
1
584
·
--
Bullish
I woke up to a futures board that looked almost too green to ignore.
PTB was pushing nearly +96%, ZETA around +72%, while $SAGA, $NEAR, $BTW and $NIL were also putting in aggressive moves.
At first glance, that looks like broad demand coming back into the market.
Then I looked at it differently.
A futures move tells me traders are willing to pay up for exposure. It does not automatically tell me that spot buyers, protocol activity, or organic demand are supporting the move underneath.
That distinction matters.
A token can move 70–100% because positioning changes faster than fundamentals. Leverage, thin liquidity and short covering can create a very convincing chart before the underlying activity has actually changed.
That’s the part I don’t want to confuse.
The interesting signal here isn’t simply that these names are pumping. It’s whether the move survives after the initial burst of positioning disappears.
Then it clicked: the real test isn’t the size of the green candle — it’s what happens after the candle.
If price holds while volume normalizes, spot demand remains active and users keep interacting with the underlying protocols, the move becomes much more interesting.
If activity fades while price depends on increasingly aggressive futures positioning, the headline percentage starts looking less informative.
So I’m not chasing the first move.
I’m watching what happens next: does real activity follow the price, or does the price run ahead of the fundamentals?
That’s the metric I care about now.
#XRPExchangeReservesHitSevenYearLow #BuffettStepsDownAsBerkshireChairman #BOJRaisesRatesTo31YearHigh #SaylorHintsStrategyBitcoinBuy #CanaryFilesSecondAmendmentForStakedSEIETF
$PTB
{alpha}(560x95c9b514566fbd224dc2037f5914eb8ab91c9201)
$ZETA
{alpha}(10xf091867ec603a6628ed83d274e835539d82e9cc8)
$SAGA
{future}(SAGAUSDT)
I woke up to a futures board that looked almost too green to ignore.
PTB was pushing nearly +96%, ZETA around +72%, while $SAGA , $NEAR, $BTW and $NIL were also putting in aggressive moves.
At first glance, that looks like broad demand coming back into the market.
Then I looked at it differently.
A futures move tells me traders are willing to pay up for exposure. It does not automatically tell me that spot buyers, protocol activity, or organic demand are supporting the move underneath.
That distinction matters.
A token can move 70–100% because positioning changes faster than fundamentals. Leverage, thin liquidity and short covering can create a very convincing chart before the underlying activity has actually changed.
That’s the part I don’t want to confuse.
The interesting signal here isn’t simply that these names are pumping. It’s whether the move survives after the initial burst of positioning disappears.
Then it clicked: the real test isn’t the size of the green candle — it’s what happens after the candle.
If price holds while volume normalizes, spot demand remains active and users keep interacting with the underlying protocols, the move becomes much more interesting.
If activity fades while price depends on increasingly aggressive futures positioning, the headline percentage starts looking less informative.
So I’m not chasing the first move.
I’m watching what happens next: does real activity follow the price, or does the price run ahead of the fundamentals?
That’s the metric I care about now.
#XRPExchangeReservesHitSevenYearLow #BuffettStepsDownAsBerkshireChairman #BOJRaisesRatesTo31YearHigh #SaylorHintsStrategyBitcoinBuy #CanaryFilesSecondAmendmentForStakedSEIETF
$PTB
$ZETA
$SAGA
PTB was pushing nearly +96%, ZETA around +72%, while $SAGA , $NEAR, $BTW and $NIL were also putting in aggressive moves.
At first glance, that looks like broad demand coming back into the market.
Then I looked at it differently.
A futures move tells me traders are willing to pay up for exposure. It does not automatically tell me that spot buyers, protocol activity, or organic demand are supporting the move underneath.
That distinction matters.
A token can move 70–100% because positioning changes faster than fundamentals. Leverage, thin liquidity and short covering can create a very convincing chart before the underlying activity has actually changed.
That’s the part I don’t want to confuse.
The interesting signal here isn’t simply that these names are pumping. It’s whether the move survives after the initial burst of positioning disappears.
Then it clicked: the real test isn’t the size of the green candle — it’s what happens after the candle.
If price holds while volume normalizes, spot demand remains active and users keep interacting with the underlying protocols, the move becomes much more interesting.
If activity fades while price depends on increasingly aggressive futures positioning, the headline percentage starts looking less informative.
So I’m not chasing the first move.
I’m watching what happens next: does real activity follow the price, or does the price run ahead of the fundamentals?
That’s the metric I care about now.
#XRPExchangeReservesHitSevenYearLow #BuffettStepsDownAsBerkshireChairman #BOJRaisesRatesTo31YearHigh #SaylorHintsStrategyBitcoinBuy #CanaryFilesSecondAmendmentForStakedSEIETF
$PTB
$ZETA
$SAGA
PTB💕
59%
ZETA💯
23%
NEAR💪
0%
SAGA👍
18%
34 votes • Voting closed
2
2.1k
·
--
Bullish
$ETH is trading around $2,450, with price attempting to recover after dropping into the $2,437 support area. This zone looks important for the next move, as buyers have reacted from the recent low and are trying to build short-term momentum.
The broader 15-minute structure remains under pressure, but the latest candles show buyers defending the rebound area. For the bullish scenario to develop, ETH needs to hold above the $2,440–$2,450 region and reclaim nearby resistance with solid momentum.
If buyers can maintain control, the upside targets could come into play. A break back below the recent $2,437 low would weaken the setup.
Trade Setup:
Entry Zone: $2,445–$2,452
Take Profit 1: $2,465
Take Profit 2: $2,480
Stop Loss: $2,432
The key will be confirmation rather than chasing the move. Keep risk controlled and wait for price action to validate the setup before entering.
{spot}(ETHUSDT)
$ETH is trading around $2,450, with price attempting to recover after dropping into the $2,437 support area. This zone looks important for the next move, as buyers have reacted from the recent low and are trying to build short-term momentum.
The broader 15-minute structure remains under pressure, but the latest candles show buyers defending the rebound area. For the bullish scenario to develop, ETH needs to hold above the $2,440–$2,450 region and reclaim nearby resistance with solid momentum.
If buyers can maintain control, the upside targets could come into play. A break back below the recent $2,437 low would weaken the setup.
Trade Setup:
Entry Zone: $2,445–$2,452
Take Profit 1: $2,465
Take Profit 2: $2,480
Stop Loss: $2,432
The key will be confirmation rather than chasing the move. Keep risk controlled and wait for price action to validate the setup before entering.
The broader 15-minute structure remains under pressure, but the latest candles show buyers defending the rebound area. For the bullish scenario to develop, ETH needs to hold above the $2,440–$2,450 region and reclaim nearby resistance with solid momentum.
If buyers can maintain control, the upside targets could come into play. A break back below the recent $2,437 low would weaken the setup.
Trade Setup:
Entry Zone: $2,445–$2,452
Take Profit 1: $2,465
Take Profit 2: $2,480
Stop Loss: $2,432
The key will be confirmation rather than chasing the move. Keep risk controlled and wait for price action to validate the setup before entering.
2
690
·
--
Bullish
$BTC Trade Setup
BTC is currently trading around the $76,450 area, after bouncing from the recent $76,265 support. This zone is important because buyers have stepped in after the sharp intraday drop, while the $76,500–$76,600 area is the first nearby resistance to reclaim.
Price action is showing a short-term recovery on the 15-minute chart, but buyers still need to prove they can hold above the current area and push through nearby resistance. My focus is on whether buyers can continue defending the recent rebound zone.
If momentum continues and BTC breaks cleanly above the local resistance, the upside targets could come into play. On the other hand, losing the recent swing low would weaken the setup.
Trade Setup:
Entry Zone: $76,400–$76,500
Take Profit 1: $76,650
Take Profit 2: $76,850
Stop Loss: $76,200
The key will be confirmation rather than chasing the move. Patience around the entry and disciplined risk management matter more than forcing a trade.
{spot}(BTCUSDT)
$BTC Trade Setup
BTC is currently trading around the $76,450 area, after bouncing from the recent $76,265 support. This zone is important because buyers have stepped in after the sharp intraday drop, while the $76,500–$76,600 area is the first nearby resistance to reclaim.
Price action is showing a short-term recovery on the 15-minute chart, but buyers still need to prove they can hold above the current area and push through nearby resistance. My focus is on whether buyers can continue defending the recent rebound zone.
If momentum continues and BTC breaks cleanly above the local resistance, the upside targets could come into play. On the other hand, losing the recent swing low would weaken the setup.
Trade Setup:
Entry Zone: $76,400–$76,500
Take Profit 1: $76,650
Take Profit 2: $76,850
Stop Loss: $76,200
The key will be confirmation rather than chasing the move. Patience around the entry and disciplined risk management matter more than forcing a trade.
BTC is currently trading around the $76,450 area, after bouncing from the recent $76,265 support. This zone is important because buyers have stepped in after the sharp intraday drop, while the $76,500–$76,600 area is the first nearby resistance to reclaim.
Price action is showing a short-term recovery on the 15-minute chart, but buyers still need to prove they can hold above the current area and push through nearby resistance. My focus is on whether buyers can continue defending the recent rebound zone.
If momentum continues and BTC breaks cleanly above the local resistance, the upside targets could come into play. On the other hand, losing the recent swing low would weaken the setup.
Trade Setup:
Entry Zone: $76,400–$76,500
Take Profit 1: $76,650
Take Profit 2: $76,850
Stop Loss: $76,200
The key will be confirmation rather than chasing the move. Patience around the entry and disciplined risk management matter more than forcing a trade.
1
59
·
--
Bullish
I spent more time digging into the Fed setup today, and the first thing that caught my attention was how much of the headline risk is already sitting in the price.
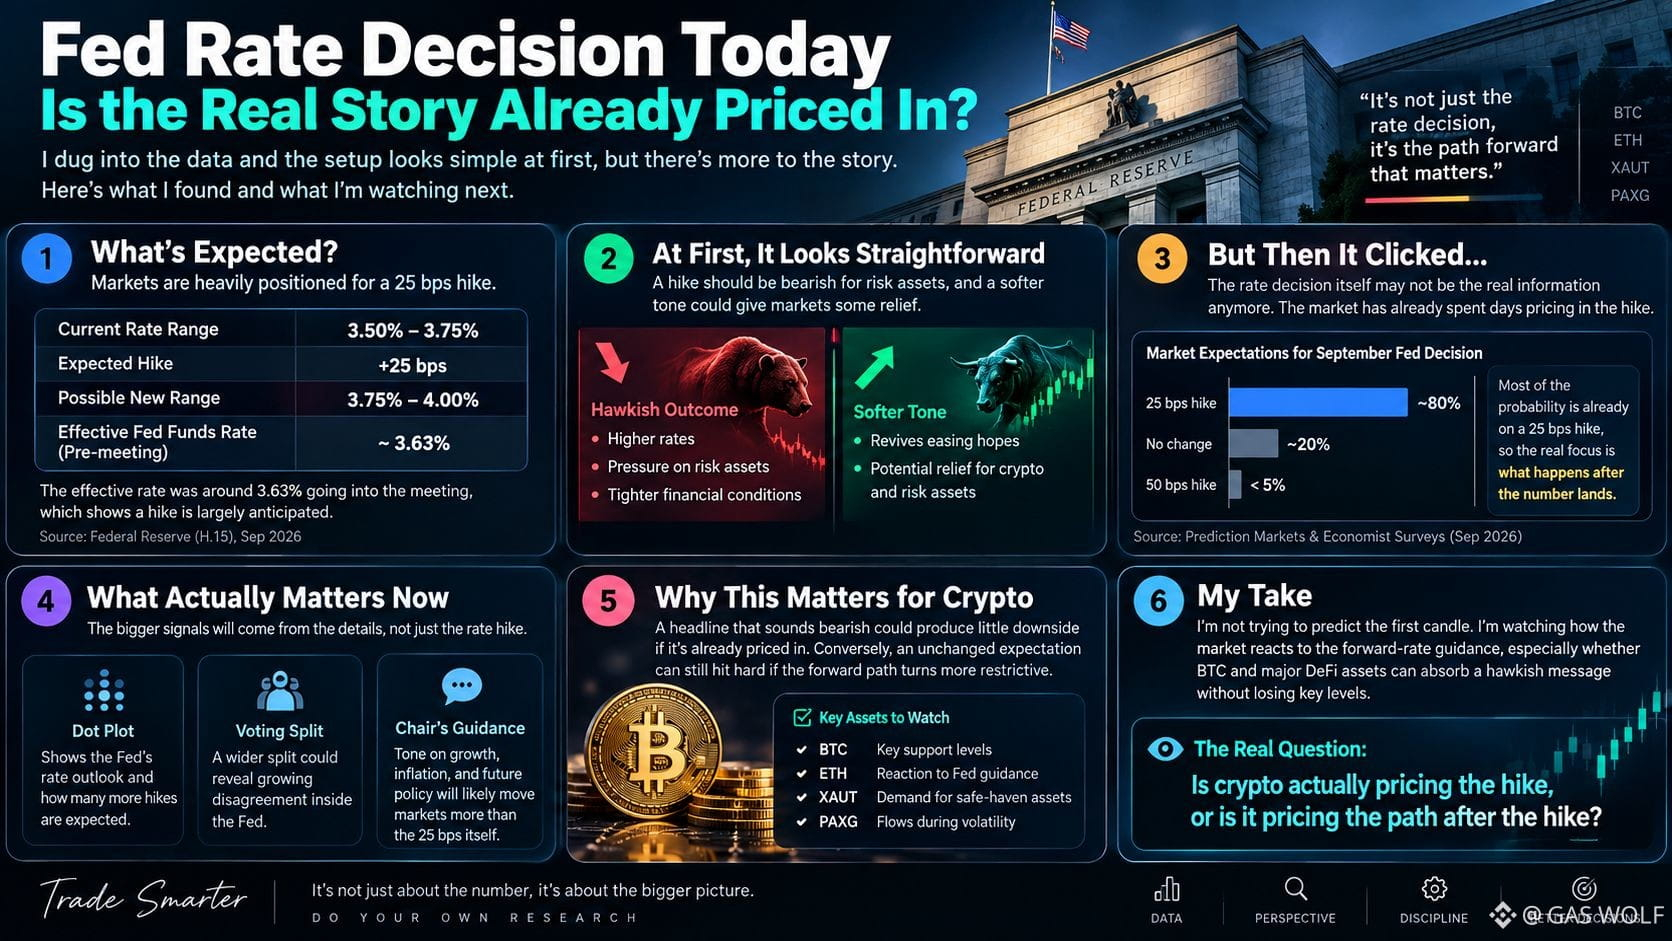
The market is heavily positioned around a 25 bps hike, which would move the target range from 3.50–3.75% to 3.75–4.00%. The interesting part is that the effective fed funds rate was still around 3.63% going into the meeting.
At first glance, that makes the setup look simple: hike = pressure on risk assets, softer guidance = relief.
But then it clicked.
The rate decision itself may not be the real information anymore. If the market has already spent days pricing a hike, the more important variable becomes what happens after the number lands.
That means watching the dot plot, the voting split, and the Chair’s guidance rather than treating “25 bps” as the entire event. Current reporting also points to that distinction: expectations have been concentrated around a hike, while economists have differed on the actual September outcome.
For crypto, this creates an interesting contradiction.
A headline that sounds bearish could produce little downside if positioning is already crowded around it. Conversely, a technically unchanged expectation can still hit hard if the forward path becomes more restrictive.
So I’m not trying to predict the first candle.
I’m watching the market’s reaction to the forward-rate guidance, especially whether BTC and major DeFi assets can absorb a hawkish message without losing key levels.
That reaction should tell us more than the 25 bps itself.
The real question: **is crypto actually pricing the hike, or is it pricing the path after the hike?**
$DGAI
{alpha}(560x10d4183389e99233db3cc981c43443ebd28ebd5e)
$SYN
{future}(SYNUSDT)
$BTC
{future}(BTCUSDT)
I spent more time digging into the Fed setup today, and the first thing that caught my attention was how much of the headline risk is already sitting in the price.
The market is heavily positioned around a 25 bps hike, which would move the target range from 3.50–3.75% to 3.75–4.00%. The interesting part is that the effective fed funds rate was still around 3.63% going into the meeting.
At first glance, that makes the setup look simple: hike = pressure on risk assets, softer guidance = relief.
But then it clicked.
The rate decision itself may not be the real information anymore. If the market has already spent days pricing a hike, the more important variable becomes what happens after the number lands.
That means watching the dot plot, the voting split, and the Chair’s guidance rather than treating “25 bps” as the entire event. Current reporting also points to that distinction: expectations have been concentrated around a hike, while economists have differed on the actual September outcome.
For crypto, this creates an interesting contradiction.
A headline that sounds bearish could produce little downside if positioning is already crowded around it. Conversely, a technically unchanged expectation can still hit hard if the forward path becomes more restrictive.
So I’m not trying to predict the first candle.
I’m watching the market’s reaction to the forward-rate guidance, especially whether BTC and major DeFi assets can absorb a hawkish message without losing key levels.
That reaction should tell us more than the 25 bps itself.
The real question: **is crypto actually pricing the hike, or is it pricing the path after the hike?**
$DGAI
$SYN
$BTC
The market is heavily positioned around a 25 bps hike, which would move the target range from 3.50–3.75% to 3.75–4.00%. The interesting part is that the effective fed funds rate was still around 3.63% going into the meeting.
At first glance, that makes the setup look simple: hike = pressure on risk assets, softer guidance = relief.
But then it clicked.
The rate decision itself may not be the real information anymore. If the market has already spent days pricing a hike, the more important variable becomes what happens after the number lands.
That means watching the dot plot, the voting split, and the Chair’s guidance rather than treating “25 bps” as the entire event. Current reporting also points to that distinction: expectations have been concentrated around a hike, while economists have differed on the actual September outcome.
For crypto, this creates an interesting contradiction.
A headline that sounds bearish could produce little downside if positioning is already crowded around it. Conversely, a technically unchanged expectation can still hit hard if the forward path becomes more restrictive.
So I’m not trying to predict the first candle.
I’m watching the market’s reaction to the forward-rate guidance, especially whether BTC and major DeFi assets can absorb a hawkish message without losing key levels.
That reaction should tell us more than the 25 bps itself.
The real question: **is crypto actually pricing the hike, or is it pricing the path after the hike?**
$DGAI
$SYN
$BTC
374
·
--
Bullish
CPI day always brings a different kind of tension to the market.
Everything can look calm for hours, and then one inflation number changes the entire conversation in minutes.
What makes this interesting is that the market is not only watching whether inflation goes up or down. The bigger question is whether the result comes in above or below expectations.
A softer CPI number could give markets more confidence that inflation is cooling. A hotter number could do the opposite and bring back concerns about interest rates staying higher for longer.
That’s why I’m not getting too excited about every small move before the release.
I’ve seen markets become noisy ahead of major economic data. Traders start positioning early, prices move back and forth, and everyone tries to guess what will happen next.
Then the actual number arrives.
The first reaction can be fast and messy, but the more important move is often what happens after the market has had time to understand the data.
For me, this is one of those moments where watching carefully makes more sense than forcing a prediction.
The numbers will tell one story.
The market’s reaction will tell another.
#CPIWatch #CPI #NFP #FedWatch
$NES
{alpha}(560x097acf27503753e77bca940277806156c5925b81)
$TFUEL
{spot}(TFUELUSDT)
$LAB
{alpha}(560x7ec43cf65f1663f820427c62a5780b8f2e25593a)
CPI day always brings a different kind of tension to the market.
Everything can look calm for hours, and then one inflation number changes the entire conversation in minutes.
What makes this interesting is that the market is not only watching whether inflation goes up or down. The bigger question is whether the result comes in above or below expectations.
A softer CPI number could give markets more confidence that inflation is cooling. A hotter number could do the opposite and bring back concerns about interest rates staying higher for longer.
That’s why I’m not getting too excited about every small move before the release.
I’ve seen markets become noisy ahead of major economic data. Traders start positioning early, prices move back and forth, and everyone tries to guess what will happen next.
Then the actual number arrives.
The first reaction can be fast and messy, but the more important move is often what happens after the market has had time to understand the data.
For me, this is one of those moments where watching carefully makes more sense than forcing a prediction.
The numbers will tell one story.
The market’s reaction will tell another.
#CPIWatch #CPI #NFP #FedWatch
$NES
$TFUEL
$LAB
Everything can look calm for hours, and then one inflation number changes the entire conversation in minutes.
What makes this interesting is that the market is not only watching whether inflation goes up or down. The bigger question is whether the result comes in above or below expectations.
A softer CPI number could give markets more confidence that inflation is cooling. A hotter number could do the opposite and bring back concerns about interest rates staying higher for longer.
That’s why I’m not getting too excited about every small move before the release.
I’ve seen markets become noisy ahead of major economic data. Traders start positioning early, prices move back and forth, and everyone tries to guess what will happen next.
Then the actual number arrives.
The first reaction can be fast and messy, but the more important move is often what happens after the market has had time to understand the data.
For me, this is one of those moments where watching carefully makes more sense than forcing a prediction.
The numbers will tell one story.
The market’s reaction will tell another.
#CPIWatch #CPI #NFP #FedWatch
$NES
$TFUEL
$LAB

1
2
389
Log in to explore more content
Join global crypto users on Binance Square
⚡️ Get latest and useful information about crypto.
💬 Trusted by the world’s largest crypto exchange.
👍 Discover real insights from verified creators.
Email / Phone number
Trending Topics
CerebrasSinksNearly20%OnReportNvidiaToPowerOpenAI
5 views
16 Discussing
$ATH
TREDE now 👆👆👆👆👆👆👆
Entry: 0.00630 – 0.00660
SL: 0.00590
TP1: 0.00695
TP2: 0.00715
TP3: 0.00740
TP4: 0.00780
#CerebrasSinksNearly20%OnReportNvidiaToPowerOpenAI #NFPWatch #BlastToGraduallyShutDownItsL2Network #Write2Earrn #BinanceSquareTalks $SAND
$ICP
Dipu panda
·0 Likes
·88 views
SECProposesCryptoCustodyRules
11,716 views
169 Discussing
SECApproves3xLongCryptoCommodityETPs
12,950 views
184 Discussing