
far cam
323 Posts

far cam
Report
Block User
Crypto Insights | Altcoins | Technical Analysis | Market Trends — No hype, just market observations. DYOR.
6 Following
8 Followers
26 Liked
Posts
·
--
Article
ACT DOWN 14.73%: CRITICAL SUPPORT UNDER PRESSURE — WILL BUYERS DEFEND $0.00976?ACT/USDT is facing significant selling pressure after dropping 14.73%, bringing its price close to the 24-hour low of $0.009762.
But the bigger question is not simply how far ACT has fallen. It is whether buyers can defend the current support area and build a meaningful recovery.
Based on the chart snapshot, ACT is showing mixed signals across different timeframes. Short-term momentum remains weak, while the daily chart still has some signs of a broader recovery structure.
Let's break down the important levels.
1. 15-Minute Chart: Short-Term Pressure Remains
MA(7): 0.009926MA(25): 0.010002MA(99): 0.011084Candle Volume: 5.12M ACTVolume MA(5): 7.69MVolume MA(10): 10.6M
The price is trading below all three moving averages, indicating short-term weakness.
Current candle volume is also below both volume averages. This suggests that recent trading activity is relatively weak, and buyers have not yet demonstrated strong recovery momentum.
Key observation: ACT needs to reclaim the $0.009926–$0.010002 area to improve its short-term structure.
2. 1-Hour Chart: Recovery Still Unconfirmed
MA(7): 0.009981MA(25): 0.011073MA(99): 0.009996Candle Volume: 32.6M ACTVolume MA(5): 58.9MVolume MA(10): 88.8M
The hourly chart also reflects selling pressure. Price remains below the displayed moving averages, while candle volume is significantly lower than both volume averages.
A move above $0.009981–$0.009996 could be an early improvement, but reclaiming the higher $0.011073 level would be a more meaningful development.
Key observation: A recovery needs stronger buying volume, not just a temporary price bounce.
3. 4-Hour Chart: A Critical Middle Ground
MA(7): 0.011044MA(25): 0.010012MA(99): 0.008844Candle Volume: 142M ACTVolume MA(5): 504MVolume MA(10): 693M
The 4-hour structure is mixed. ACT is below MA(7) and MA(25), showing that recent momentum has weakened. However, the price remains above MA(99) at $0.008844.
This longer moving average is an important reference point for the broader 4-hour structure.
Volume is also below both averages, suggesting that buyers have not yet returned with convincing strength.
Key observation: Holding above $0.008844 would help preserve an important support reference on this timeframe.
4. Daily Chart: Is the Bigger Picture Different?
MA(7): 0.009711MA(25): 0.009000MA(99): 0.010072Candle Volume: 2.52B ACTVolume MA(5): 2.04BVolume MA(10): 1.28B
The daily chart presents a different picture.
ACT remains above MA(7) and MA(25), which indicates that the broader recovery structure has not completely disappeared. However, it is still below MA(99) at $0.010072.
Daily candle volume is above both volume averages, showing substantial trading activity during the recent move.
The important question is whether this activity represents renewed buying interest or continued distribution. Price action around the moving averages may provide more clarity.
Key observation: A sustained move above $0.010072 would improve the daily structure.
Important Support and Resistance Levels
Support levels
$0.009762 — 24-hour low and immediate support reference$0.009711 — Daily MA(7)$0.009000 — Daily MA(25)$0.008844 — 4-hour MA(99)
Resistance levels
$0.009926–$0.010002 — Immediate recovery zone$0.010012–$0.010072 — Important moving-average resistance area$0.011044–$0.011073 — Higher resistance zone$0.012968 — 24-hour high
What Could Happen Next?
Bullish scenario: If buyers defend $0.009762 and push ACT above $0.01000 with stronger volume, the price could attempt to test the $0.010072 area and then higher resistance.
Bearish scenario: If ACT loses $0.009762 decisively, attention may shift toward $0.009711 and $0.009000. A deeper decline could bring the $0.008844 area into focus.
These are conditional scenarios, not guaranteed price targets.
Final Thoughts
ACT is at an important technical point. The 15-minute and 1-hour charts show clear short-term weakness, while the 4-hour chart remains mixed. The daily chart still holds above MA(7) and MA(25), but MA(99) remains overhead resistance.
For now, the $0.009762 support area and the $0.01000 recovery zone deserve close attention.
What do you think? Can ACT recover above $0.01000, or will sellers push it toward the next support levels?
Share your view below.
Disclaimer: This article is for educational and informational purposes only. It is based on the chart data provided and does not constitute financial advice. Always conduct your own research and manage risk carefully.
#ACT #ACTUSDT #CryptoAnalysis #TechnicalAnalysis #Altcoins #BinancePick
ACT DOWN 14.73%: CRITICAL SUPPORT UNDER PRESSURE — WILL BUYERS DEFEND $0.00976?
ACT/USDT is facing significant selling pressure after dropping 14.73%, bringing its price close to the 24-hour low of $0.009762.
But the bigger question is not simply how far ACT has fallen. It is whether buyers can defend the current support area and build a meaningful recovery.
Based on the chart snapshot, ACT is showing mixed signals across different timeframes. Short-term momentum remains weak, while the daily chart still has some signs of a broader recovery structure.
Let's break down the important levels.
1. 15-Minute Chart: Short-Term Pressure Remains
MA(7): 0.009926MA(25): 0.010002MA(99): 0.011084Candle Volume: 5.12M ACTVolume MA(5): 7.69MVolume MA(10): 10.6M
The price is trading below all three moving averages, indicating short-term weakness.
Current candle volume is also below both volume averages. This suggests that recent trading activity is relatively weak, and buyers have not yet demonstrated strong recovery momentum.
Key observation: ACT needs to reclaim the $0.009926–$0.010002 area to improve its short-term structure.
2. 1-Hour Chart: Recovery Still Unconfirmed
MA(7): 0.009981MA(25): 0.011073MA(99): 0.009996Candle Volume: 32.6M ACTVolume MA(5): 58.9MVolume MA(10): 88.8M
The hourly chart also reflects selling pressure. Price remains below the displayed moving averages, while candle volume is significantly lower than both volume averages.
A move above $0.009981–$0.009996 could be an early improvement, but reclaiming the higher $0.011073 level would be a more meaningful development.
Key observation: A recovery needs stronger buying volume, not just a temporary price bounce.
3. 4-Hour Chart: A Critical Middle Ground
MA(7): 0.011044MA(25): 0.010012MA(99): 0.008844Candle Volume: 142M ACTVolume MA(5): 504MVolume MA(10): 693M
The 4-hour structure is mixed. ACT is below MA(7) and MA(25), showing that recent momentum has weakened. However, the price remains above MA(99) at $0.008844.
This longer moving average is an important reference point for the broader 4-hour structure.
Volume is also below both averages, suggesting that buyers have not yet returned with convincing strength.
Key observation: Holding above $0.008844 would help preserve an important support reference on this timeframe.
4. Daily Chart: Is the Bigger Picture Different?
MA(7): 0.009711MA(25): 0.009000MA(99): 0.010072Candle Volume: 2.52B ACTVolume MA(5): 2.04BVolume MA(10): 1.28B
The daily chart presents a different picture.
ACT remains above MA(7) and MA(25), which indicates that the broader recovery structure has not completely disappeared. However, it is still below MA(99) at $0.010072.
Daily candle volume is above both volume averages, showing substantial trading activity during the recent move.
The important question is whether this activity represents renewed buying interest or continued distribution. Price action around the moving averages may provide more clarity.
Key observation: A sustained move above $0.010072 would improve the daily structure.
Important Support and Resistance Levels
Support levels
$0.009762 — 24-hour low and immediate support reference$0.009711 — Daily MA(7)$0.009000 — Daily MA(25)$0.008844 — 4-hour MA(99)
Resistance levels
$0.009926–$0.010002 — Immediate recovery zone$0.010012–$0.010072 — Important moving-average resistance area$0.011044–$0.011073 — Higher resistance zone$0.012968 — 24-hour high
What Could Happen Next?
Bullish scenario: If buyers defend $0.009762 and push ACT above $0.01000 with stronger volume, the price could attempt to test the $0.010072 area and then higher resistance.
Bearish scenario: If ACT loses $0.009762 decisively, attention may shift toward $0.009711 and $0.009000. A deeper decline could bring the $0.008844 area into focus.
These are conditional scenarios, not guaranteed price targets.
Final Thoughts
ACT is at an important technical point. The 15-minute and 1-hour charts show clear short-term weakness, while the 4-hour chart remains mixed. The daily chart still holds above MA(7) and MA(25), but MA(99) remains overhead resistance.
For now, the $0.009762 support area and the $0.01000 recovery zone deserve close attention.
What do you think? Can ACT recover above $0.01000, or will sellers push it toward the next support levels?
Share your view below.
Disclaimer: This article is for educational and informational purposes only. It is based on the chart data provided and does not constitute financial advice. Always conduct your own research and manage risk carefully.
#ACT #ACTUSDT #CryptoAnalysis #TechnicalAnalysis #Altcoins #BinancePick
But the bigger question is not simply how far ACT has fallen. It is whether buyers can defend the current support area and build a meaningful recovery.
Based on the chart snapshot, ACT is showing mixed signals across different timeframes. Short-term momentum remains weak, while the daily chart still has some signs of a broader recovery structure.
Let's break down the important levels.
1. 15-Minute Chart: Short-Term Pressure Remains
MA(7): 0.009926MA(25): 0.010002MA(99): 0.011084Candle Volume: 5.12M ACTVolume MA(5): 7.69MVolume MA(10): 10.6M
The price is trading below all three moving averages, indicating short-term weakness.
Current candle volume is also below both volume averages. This suggests that recent trading activity is relatively weak, and buyers have not yet demonstrated strong recovery momentum.
Key observation: ACT needs to reclaim the $0.009926–$0.010002 area to improve its short-term structure.
2. 1-Hour Chart: Recovery Still Unconfirmed
MA(7): 0.009981MA(25): 0.011073MA(99): 0.009996Candle Volume: 32.6M ACTVolume MA(5): 58.9MVolume MA(10): 88.8M
The hourly chart also reflects selling pressure. Price remains below the displayed moving averages, while candle volume is significantly lower than both volume averages.
A move above $0.009981–$0.009996 could be an early improvement, but reclaiming the higher $0.011073 level would be a more meaningful development.
Key observation: A recovery needs stronger buying volume, not just a temporary price bounce.
3. 4-Hour Chart: A Critical Middle Ground
MA(7): 0.011044MA(25): 0.010012MA(99): 0.008844Candle Volume: 142M ACTVolume MA(5): 504MVolume MA(10): 693M
The 4-hour structure is mixed. ACT is below MA(7) and MA(25), showing that recent momentum has weakened. However, the price remains above MA(99) at $0.008844.
This longer moving average is an important reference point for the broader 4-hour structure.
Volume is also below both averages, suggesting that buyers have not yet returned with convincing strength.
Key observation: Holding above $0.008844 would help preserve an important support reference on this timeframe.
4. Daily Chart: Is the Bigger Picture Different?
MA(7): 0.009711MA(25): 0.009000MA(99): 0.010072Candle Volume: 2.52B ACTVolume MA(5): 2.04BVolume MA(10): 1.28B
The daily chart presents a different picture.
ACT remains above MA(7) and MA(25), which indicates that the broader recovery structure has not completely disappeared. However, it is still below MA(99) at $0.010072.
Daily candle volume is above both volume averages, showing substantial trading activity during the recent move.
The important question is whether this activity represents renewed buying interest or continued distribution. Price action around the moving averages may provide more clarity.
Key observation: A sustained move above $0.010072 would improve the daily structure.
Important Support and Resistance Levels
Support levels
$0.009762 — 24-hour low and immediate support reference$0.009711 — Daily MA(7)$0.009000 — Daily MA(25)$0.008844 — 4-hour MA(99)
Resistance levels
$0.009926–$0.010002 — Immediate recovery zone$0.010012–$0.010072 — Important moving-average resistance area$0.011044–$0.011073 — Higher resistance zone$0.012968 — 24-hour high
What Could Happen Next?
Bullish scenario: If buyers defend $0.009762 and push ACT above $0.01000 with stronger volume, the price could attempt to test the $0.010072 area and then higher resistance.
Bearish scenario: If ACT loses $0.009762 decisively, attention may shift toward $0.009711 and $0.009000. A deeper decline could bring the $0.008844 area into focus.
These are conditional scenarios, not guaranteed price targets.
Final Thoughts
ACT is at an important technical point. The 15-minute and 1-hour charts show clear short-term weakness, while the 4-hour chart remains mixed. The daily chart still holds above MA(7) and MA(25), but MA(99) remains overhead resistance.
For now, the $0.009762 support area and the $0.01000 recovery zone deserve close attention.
What do you think? Can ACT recover above $0.01000, or will sellers push it toward the next support levels?
Share your view below.
Disclaimer: This article is for educational and informational purposes only. It is based on the chart data provided and does not constitute financial advice. Always conduct your own research and manage risk carefully.
#ACT #ACTUSDT #CryptoAnalysis #TechnicalAnalysis #Altcoins #BinancePick
48
·
--
Article
ICNT PRICE ANALYSIS: ALL 4 TIMEFRAMES REVEAL A BULLISH STRUCTURE — BUT CAN IT BREAK $0.3964?Impossible Cloud Network (ICNT) is showing impressive strength, gaining approximately 11.11% in 24 hours. But a closer look at all four chart timeframes reveals something important: the broader trend is bullish, while short-term volume still needs confirmation.
At the time of the Binance screenshots on November 8, 2026:
Price: $0.360224H Change: +11.11%24H High: $0.396424H Low: $0.305824H Volume: 303.59M ICNT24H Turnover: 107.50M USDT
Let's break down all four timeframes.
1️⃣ 15-MINUTE CHART — SHORT-TERM BUYER CONTROL
Moving Averages:
MA(7): $0.3596MA(25): $0.3552MA(99): $0.3370
ICNT is trading above all three moving averages, indicating a positive short-term structure.
However, the displayed candle volume is only 187K ICNT, compared with MA(5) at 732K and MA(10) at 944K.
Key observation: Buyers are maintaining the short-term structure, but volume is relatively weak. A stronger volume increase would make another upward move more convincing.
2️⃣ 1-HOUR CHART — BULLISH STRUCTURE REMAINS INTACT
Moving Averages:
MA(7): $0.3565MA(25): $0.3371MA(99): $0.2775
Price is above all three moving averages, with MA(7) above MA(25) and MA(99).
The displayed candle volume is 2.11M ICNT, while MA(5) is 5.18M and MA(10) is 15.9M.
Key observation: The hourly trend remains bullish, but the lower candle volume suggests that buyers should demonstrate stronger participation before a fresh breakout is trusted.
3️⃣ 4-HOUR CHART — STRONGER TREND, IMPORTANT CONFIRMATION AHEAD
Moving Averages:
MA(7): $0.3416MA(25): $0.2821MA(99): $0.2127
The 4H chart shows a strong bullish moving-average arrangement. Price is significantly above all three averages.
Displayed candle volume is 12.1M ICNT, compared with MA(5) at 56M and MA(10) at 56.5M.
Key observation: The broader 4H structure is strong, but the current candle's volume is below its averages. Traders should watch whether new buying activity supports the next move.
4️⃣ DAILY CHART — THE BIGGER BULLISH PICTURE
Moving Averages:
MA(7): $0.2624MA(25): $0.2060MA(99): $0.1327
The daily chart presents the strongest long-term bullish structure among these four timeframes. Price is trading well above all three moving averages.
Displayed daily candle volume is 280M ICNT, compared with MA(5) at 226M and MA(10) at 180M.
Key observation: Daily volume is above both averages, supporting the broader bullish picture. However, one strong daily snapshot does not guarantee continued upside.
🎯 KEY SUPPORT & RESISTANCE LEVELS
Resistance:
$0.3687 — nearby resistance area$0.3964 — recent 24H high$0.4021–$0.4120 — higher resistance zone
Support:
$0.3596–$0.3552 — immediate support$0.3416–$0.3370 — next support zone$0.3060–$0.3020 — deeper support area$0.2821 — important 4H MA(25) reference
🚀 WHAT COULD HAPPEN NEXT?
Bullish scenario: If ICNT holds its immediate support and breaks above $0.3964 with stronger volume and a confirmed candle close, the $0.4021–$0.4120 zone could become the next area to watch.
Bearish scenario: If price loses $0.3552, a pullback toward $0.3416–$0.3370 becomes possible. Further weakness could bring the $0.3060 area into focus.
💬 THE BIG QUESTION
All four timeframes show price above their respective MA(7), MA(25) and MA(99), but short-term volume remains weaker than its averages.
Will ICNT break $0.3964 and continue its rally, or will buyers need a correction before the next move?
Share your analysis in the comments!
Disclaimer: This article is for educational and informational purposes only, not financial advice. All prices, moving averages and volume readings are based on the Binance screenshots provided on November 8, 2026. Cryptocurrency markets are volatile. Always conduct your own research and manage risk.
#ICNT #ImpossibleCloudNetwork #CryptoAnalysis #TechnicalAnalysis #BinancePick
ICNT PRICE ANALYSIS: ALL 4 TIMEFRAMES REVEAL A BULLISH STRUCTURE — BUT CAN IT BREAK $0.3964?
Impossible Cloud Network (ICNT) is showing impressive strength, gaining approximately 11.11% in 24 hours. But a closer look at all four chart timeframes reveals something important: the broader trend is bullish, while short-term volume still needs confirmation.
At the time of the Binance screenshots on November 8, 2026:
Price: $0.360224H Change: +11.11%24H High: $0.396424H Low: $0.305824H Volume: 303.59M ICNT24H Turnover: 107.50M USDT
Let's break down all four timeframes.
1️⃣ 15-MINUTE CHART — SHORT-TERM BUYER CONTROL
Moving Averages:
MA(7): $0.3596MA(25): $0.3552MA(99): $0.3370
ICNT is trading above all three moving averages, indicating a positive short-term structure.
However, the displayed candle volume is only 187K ICNT, compared with MA(5) at 732K and MA(10) at 944K.
Key observation: Buyers are maintaining the short-term structure, but volume is relatively weak. A stronger volume increase would make another upward move more convincing.
2️⃣ 1-HOUR CHART — BULLISH STRUCTURE REMAINS INTACT
Moving Averages:
MA(7): $0.3565MA(25): $0.3371MA(99): $0.2775
Price is above all three moving averages, with MA(7) above MA(25) and MA(99).
The displayed candle volume is 2.11M ICNT, while MA(5) is 5.18M and MA(10) is 15.9M.
Key observation: The hourly trend remains bullish, but the lower candle volume suggests that buyers should demonstrate stronger participation before a fresh breakout is trusted.
3️⃣ 4-HOUR CHART — STRONGER TREND, IMPORTANT CONFIRMATION AHEAD
Moving Averages:
MA(7): $0.3416MA(25): $0.2821MA(99): $0.2127
The 4H chart shows a strong bullish moving-average arrangement. Price is significantly above all three averages.
Displayed candle volume is 12.1M ICNT, compared with MA(5) at 56M and MA(10) at 56.5M.
Key observation: The broader 4H structure is strong, but the current candle's volume is below its averages. Traders should watch whether new buying activity supports the next move.
4️⃣ DAILY CHART — THE BIGGER BULLISH PICTURE
Moving Averages:
MA(7): $0.2624MA(25): $0.2060MA(99): $0.1327
The daily chart presents the strongest long-term bullish structure among these four timeframes. Price is trading well above all three moving averages.
Displayed daily candle volume is 280M ICNT, compared with MA(5) at 226M and MA(10) at 180M.
Key observation: Daily volume is above both averages, supporting the broader bullish picture. However, one strong daily snapshot does not guarantee continued upside.
🎯 KEY SUPPORT & RESISTANCE LEVELS
Resistance:
$0.3687 — nearby resistance area$0.3964 — recent 24H high$0.4021–$0.4120 — higher resistance zone
Support:
$0.3596–$0.3552 — immediate support$0.3416–$0.3370 — next support zone$0.3060–$0.3020 — deeper support area$0.2821 — important 4H MA(25) reference
🚀 WHAT COULD HAPPEN NEXT?
Bullish scenario: If ICNT holds its immediate support and breaks above $0.3964 with stronger volume and a confirmed candle close, the $0.4021–$0.4120 zone could become the next area to watch.
Bearish scenario: If price loses $0.3552, a pullback toward $0.3416–$0.3370 becomes possible. Further weakness could bring the $0.3060 area into focus.
💬 THE BIG QUESTION
All four timeframes show price above their respective MA(7), MA(25) and MA(99), but short-term volume remains weaker than its averages.
Will ICNT break $0.3964 and continue its rally, or will buyers need a correction before the next move?
Share your analysis in the comments!
Disclaimer: This article is for educational and informational purposes only, not financial advice. All prices, moving averages and volume readings are based on the Binance screenshots provided on November 8, 2026. Cryptocurrency markets are volatile. Always conduct your own research and manage risk.
#ICNT #ImpossibleCloudNetwork #CryptoAnalysis #TechnicalAnalysis #BinancePick
At the time of the Binance screenshots on November 8, 2026:
Price: $0.360224H Change: +11.11%24H High: $0.396424H Low: $0.305824H Volume: 303.59M ICNT24H Turnover: 107.50M USDT
Let's break down all four timeframes.
1️⃣ 15-MINUTE CHART — SHORT-TERM BUYER CONTROL
Moving Averages:
MA(7): $0.3596MA(25): $0.3552MA(99): $0.3370
ICNT is trading above all three moving averages, indicating a positive short-term structure.
However, the displayed candle volume is only 187K ICNT, compared with MA(5) at 732K and MA(10) at 944K.
Key observation: Buyers are maintaining the short-term structure, but volume is relatively weak. A stronger volume increase would make another upward move more convincing.
2️⃣ 1-HOUR CHART — BULLISH STRUCTURE REMAINS INTACT
Moving Averages:
MA(7): $0.3565MA(25): $0.3371MA(99): $0.2775
Price is above all three moving averages, with MA(7) above MA(25) and MA(99).
The displayed candle volume is 2.11M ICNT, while MA(5) is 5.18M and MA(10) is 15.9M.
Key observation: The hourly trend remains bullish, but the lower candle volume suggests that buyers should demonstrate stronger participation before a fresh breakout is trusted.
3️⃣ 4-HOUR CHART — STRONGER TREND, IMPORTANT CONFIRMATION AHEAD
Moving Averages:
MA(7): $0.3416MA(25): $0.2821MA(99): $0.2127
The 4H chart shows a strong bullish moving-average arrangement. Price is significantly above all three averages.
Displayed candle volume is 12.1M ICNT, compared with MA(5) at 56M and MA(10) at 56.5M.
Key observation: The broader 4H structure is strong, but the current candle's volume is below its averages. Traders should watch whether new buying activity supports the next move.
4️⃣ DAILY CHART — THE BIGGER BULLISH PICTURE
Moving Averages:
MA(7): $0.2624MA(25): $0.2060MA(99): $0.1327
The daily chart presents the strongest long-term bullish structure among these four timeframes. Price is trading well above all three moving averages.
Displayed daily candle volume is 280M ICNT, compared with MA(5) at 226M and MA(10) at 180M.
Key observation: Daily volume is above both averages, supporting the broader bullish picture. However, one strong daily snapshot does not guarantee continued upside.
🎯 KEY SUPPORT & RESISTANCE LEVELS
Resistance:
$0.3687 — nearby resistance area$0.3964 — recent 24H high$0.4021–$0.4120 — higher resistance zone
Support:
$0.3596–$0.3552 — immediate support$0.3416–$0.3370 — next support zone$0.3060–$0.3020 — deeper support area$0.2821 — important 4H MA(25) reference
🚀 WHAT COULD HAPPEN NEXT?
Bullish scenario: If ICNT holds its immediate support and breaks above $0.3964 with stronger volume and a confirmed candle close, the $0.4021–$0.4120 zone could become the next area to watch.
Bearish scenario: If price loses $0.3552, a pullback toward $0.3416–$0.3370 becomes possible. Further weakness could bring the $0.3060 area into focus.
💬 THE BIG QUESTION
All four timeframes show price above their respective MA(7), MA(25) and MA(99), but short-term volume remains weaker than its averages.
Will ICNT break $0.3964 and continue its rally, or will buyers need a correction before the next move?
Share your analysis in the comments!
Disclaimer: This article is for educational and informational purposes only, not financial advice. All prices, moving averages and volume readings are based on the Binance screenshots provided on November 8, 2026. Cryptocurrency markets are volatile. Always conduct your own research and manage risk.
#ICNT #ImpossibleCloudNetwork #CryptoAnalysis #TechnicalAnalysis #BinancePick
41
·
--
Article
ARBITRUM (ARB): $0.1725 IS THE LEVEL TO WATCH — BREAKOUT OR ANOTHER REJECTION?Arbitrum (ARB) is showing short-term strength, but one important resistance level could decide its next move.
At the time of the chart screenshots, ARB was trading around $0.1696, up approximately 2.11% over 24 hours. Price was holding above several key moving averages on the 1H and 4H charts, suggesting that buyers currently have some short-term control.
But the bigger picture is not completely bullish yet.
🔍 What the 4 Timeframes Reveal
15-Minute Chart:
ARB is trading slightly below MA(7) at $0.1699, while remaining above MA(25) at $0.1692 and MA(99) at $0.1680. This suggests a small pause after the recent move upward.
1-Hour Chart:
Price is above all three moving averages:
MA(7): $0.1693MA(25): $0.1681MA(99): $0.1651
This is a positive short-term structure, although continued buying pressure is needed.
4-Hour Chart:
ARB is also holding above its key moving averages:
MA(7): $0.1685MA(25): $0.1650MA(99): $0.1657
However, the displayed 4H volume of 2.39M ARB is below its MA(5) and MA(10) volume averages. That means the move still needs stronger volume confirmation.
Daily Chart:
The daily picture is mixed. ARB is above MA(7) at $0.1624 and MA(99) at $0.1506, but remains below MA(25) at $0.1723. This makes the $0.1723–$0.1725 area especially important.
🎯 Key Levels Traders Should Watch
Resistance levels:
$0.1709 — recent 24H high$0.1723–$0.1725 — major resistance zone$0.1751 — next upside area to monitor
Support levels:
$0.1692–$0.1680 — immediate support zone$0.1657–$0.1650 — stronger support area$0.1624 — important daily reference level
🚀 What Could Happen Next?
If ARB breaks above $0.1725 with a strong candle close and rising volume, buyers may gain additional confidence and the $0.1751 area could come into focus.
But if price fails to clear resistance, a pullback toward $0.1692–$0.1680 or even $0.1657–$0.1650 cannot be ruled out.
The key is confirmation, not prediction.
💬 The Question for the Community
ARB is showing strength on the lower timeframes, but the daily chart still has resistance overhead.
Do you think ARB can break above $0.1725, or will sellers defend this level again?
Share your chart view below.
Disclaimer: This article is for educational and informational purposes only, not financial advice. The analysis is based on the chart screenshots provided and market conditions can change quickly. Always manage risk before making trading decisions.
#ARB #Arbitrum #CryptoAnalysis #TechnicalAnalysis #BinancePick
ARBITRUM (ARB): $0.1725 IS THE LEVEL TO WATCH — BREAKOUT OR ANOTHER REJECTION?
Arbitrum (ARB) is showing short-term strength, but one important resistance level could decide its next move.
At the time of the chart screenshots, ARB was trading around $0.1696, up approximately 2.11% over 24 hours. Price was holding above several key moving averages on the 1H and 4H charts, suggesting that buyers currently have some short-term control.
But the bigger picture is not completely bullish yet.
🔍 What the 4 Timeframes Reveal
15-Minute Chart:
ARB is trading slightly below MA(7) at $0.1699, while remaining above MA(25) at $0.1692 and MA(99) at $0.1680. This suggests a small pause after the recent move upward.
1-Hour Chart:
Price is above all three moving averages:
MA(7): $0.1693MA(25): $0.1681MA(99): $0.1651
This is a positive short-term structure, although continued buying pressure is needed.
4-Hour Chart:
ARB is also holding above its key moving averages:
MA(7): $0.1685MA(25): $0.1650MA(99): $0.1657
However, the displayed 4H volume of 2.39M ARB is below its MA(5) and MA(10) volume averages. That means the move still needs stronger volume confirmation.
Daily Chart:
The daily picture is mixed. ARB is above MA(7) at $0.1624 and MA(99) at $0.1506, but remains below MA(25) at $0.1723. This makes the $0.1723–$0.1725 area especially important.
🎯 Key Levels Traders Should Watch
Resistance levels:
$0.1709 — recent 24H high$0.1723–$0.1725 — major resistance zone$0.1751 — next upside area to monitor
Support levels:
$0.1692–$0.1680 — immediate support zone$0.1657–$0.1650 — stronger support area$0.1624 — important daily reference level
🚀 What Could Happen Next?
If ARB breaks above $0.1725 with a strong candle close and rising volume, buyers may gain additional confidence and the $0.1751 area could come into focus.
But if price fails to clear resistance, a pullback toward $0.1692–$0.1680 or even $0.1657–$0.1650 cannot be ruled out.
The key is confirmation, not prediction.
💬 The Question for the Community
ARB is showing strength on the lower timeframes, but the daily chart still has resistance overhead.
Do you think ARB can break above $0.1725, or will sellers defend this level again?
Share your chart view below.
Disclaimer: This article is for educational and informational purposes only, not financial advice. The analysis is based on the chart screenshots provided and market conditions can change quickly. Always manage risk before making trading decisions.
#ARB #Arbitrum #CryptoAnalysis #TechnicalAnalysis #BinancePick
At the time of the chart screenshots, ARB was trading around $0.1696, up approximately 2.11% over 24 hours. Price was holding above several key moving averages on the 1H and 4H charts, suggesting that buyers currently have some short-term control.
But the bigger picture is not completely bullish yet.
🔍 What the 4 Timeframes Reveal
15-Minute Chart:
ARB is trading slightly below MA(7) at $0.1699, while remaining above MA(25) at $0.1692 and MA(99) at $0.1680. This suggests a small pause after the recent move upward.
1-Hour Chart:
Price is above all three moving averages:
MA(7): $0.1693MA(25): $0.1681MA(99): $0.1651
This is a positive short-term structure, although continued buying pressure is needed.
4-Hour Chart:
ARB is also holding above its key moving averages:
MA(7): $0.1685MA(25): $0.1650MA(99): $0.1657
However, the displayed 4H volume of 2.39M ARB is below its MA(5) and MA(10) volume averages. That means the move still needs stronger volume confirmation.
Daily Chart:
The daily picture is mixed. ARB is above MA(7) at $0.1624 and MA(99) at $0.1506, but remains below MA(25) at $0.1723. This makes the $0.1723–$0.1725 area especially important.
🎯 Key Levels Traders Should Watch
Resistance levels:
$0.1709 — recent 24H high$0.1723–$0.1725 — major resistance zone$0.1751 — next upside area to monitor
Support levels:
$0.1692–$0.1680 — immediate support zone$0.1657–$0.1650 — stronger support area$0.1624 — important daily reference level
🚀 What Could Happen Next?
If ARB breaks above $0.1725 with a strong candle close and rising volume, buyers may gain additional confidence and the $0.1751 area could come into focus.
But if price fails to clear resistance, a pullback toward $0.1692–$0.1680 or even $0.1657–$0.1650 cannot be ruled out.
The key is confirmation, not prediction.
💬 The Question for the Community
ARB is showing strength on the lower timeframes, but the daily chart still has resistance overhead.
Do you think ARB can break above $0.1725, or will sellers defend this level again?
Share your chart view below.
Disclaimer: This article is for educational and informational purposes only, not financial advice. The analysis is based on the chart screenshots provided and market conditions can change quickly. Always manage risk before making trading decisions.
#ARB #Arbitrum #CryptoAnalysis #TechnicalAnalysis #BinancePick
2
3
1.1k
·
--
#BinancePick
🚨 NOT EVERY BREAKOUT IS REAL! DON'T GET TRAPPED!
A coin suddenly breaks above resistance.
Green candles appear. Trading volume starts rising. Everyone gets excited and rushes to enter.
But then… price reverses sharply.
Sound familiar?
This is why experienced traders don't chase every breakout.
Before entering, watch these 4 signals:
📊 Volume: Is buying activity actually increasing?
📈 Candle Close: Did price close above resistance, or was it just a temporary spike?
🔄 Retest: Can the old resistance hold as new support?
⚡ Market Structure: Are higher highs and higher lows forming?
Remember: A breakout without confirmation can quickly turn into a trap.
The smartest trade is not always the earliest entry. Sometimes, waiting is the real strategy.
💬 What's your breakout strategy?
1️⃣ Enter immediately
2️⃣ Wait for candle confirmation
3️⃣ Wait for a successful retest
Share your trading experience!
#BinancePick #CryptoTrading #Bitcoin #TechnicalAnalysis #BreakoutTrading #CryptoMarket
#BinancePick
🚨 NOT EVERY BREAKOUT IS REAL! DON'T GET TRAPPED!
A coin suddenly breaks above resistance.
Green candles appear. Trading volume starts rising. Everyone gets excited and rushes to enter.
But then… price reverses sharply.
Sound familiar?
This is why experienced traders don't chase every breakout.
Before entering, watch these 4 signals:
📊 Volume: Is buying activity actually increasing?
📈 Candle Close: Did price close above resistance, or was it just a temporary spike?
🔄 Retest: Can the old resistance hold as new support?
⚡ Market Structure: Are higher highs and higher lows forming?
Remember: A breakout without confirmation can quickly turn into a trap.
The smartest trade is not always the earliest entry. Sometimes, waiting is the real strategy.
💬 What's your breakout strategy?
1️⃣ Enter immediately
2️⃣ Wait for candle confirmation
3️⃣ Wait for a successful retest
Share your trading experience!
#BinancePick #CryptoTrading #Bitcoin #TechnicalAnalysis #BreakoutTrading #CryptoMarket
🚨 NOT EVERY BREAKOUT IS REAL! DON'T GET TRAPPED!
A coin suddenly breaks above resistance.
Green candles appear. Trading volume starts rising. Everyone gets excited and rushes to enter.
But then… price reverses sharply.
Sound familiar?
This is why experienced traders don't chase every breakout.
Before entering, watch these 4 signals:
📊 Volume: Is buying activity actually increasing?
📈 Candle Close: Did price close above resistance, or was it just a temporary spike?
🔄 Retest: Can the old resistance hold as new support?
⚡ Market Structure: Are higher highs and higher lows forming?
Remember: A breakout without confirmation can quickly turn into a trap.
The smartest trade is not always the earliest entry. Sometimes, waiting is the real strategy.
💬 What's your breakout strategy?
1️⃣ Enter immediately
2️⃣ Wait for candle confirmation
3️⃣ Wait for a successful retest
Share your trading experience!
#BinancePick #CryptoTrading #Bitcoin #TechnicalAnalysis #BreakoutTrading #CryptoMarket

87
·
--
Article
MET Up 17%: Is Another Breakout Coming or Is Profit-Taking Near?Meteora (MET) is attracting attention after gaining approximately 17.83% in the supplied Binance chart snapshot, with price trading around $0.3245.
But the bigger question is whether this rally has enough strength to continue.
What the Four Timeframes Reveal
15-Minute Chart:
MET is trading near its MA(7) at $0.3243, while MA(25) at $0.3129 and MA(99) at $0.2925 remain below price. Short-term momentum is positive, but the price is approaching resistance.
1-Hour Chart:
Price is above MA(7) at $0.3150, MA(25) at $0.2940 and MA(99) at $0.2835. This supports the bullish short-term structure.
4-Hour Chart:
The price remains above all three moving averages: MA(7) at $0.3002, MA(25) at $0.2856 and MA(99) at $0.2963. The broader structure remains constructive.
Daily Chart:
MET is above MA(7) at $0.2846, MA(25) at $0.3156 and MA(99) at $0.2625. However, MA(7) is still below MA(25), so the daily moving-average structure is not fully aligned.
Key Levels Traders Should Watch
Resistance:
$0.3299$0.3329–$0.3334
Support:
$0.3200–$0.3181$0.3156–$0.3129$0.3002
A convincing move above $0.3299–$0.3334 with stronger volume could open the door to further upside.
However, rejection from this zone could trigger profit-taking and a pullback towards the nearby support levels.
The Volume Factor
The reported 24-hour volume is approximately 16.92 million MET, equivalent to around $5.16 million USDT.
Daily volume is strong relative to its displayed averages, but the shorter-timeframe candle volumes are below their respective averages. Traders should watch for fresh buying participation before treating a breakout as confirmed.
Final View
MET currently has a constructive multi-timeframe structure, but its next move depends on how it reacts around the $0.3300–$0.3334 resistance zone.
Chasing a sharp rally without confirmation can be risky.
What do you think happens next?
MET breaks above $0.3334 and continues higher.Sellers defend resistance and price pulls back.MET consolidates before its next move.
Share your analysis in the comments.
#MET #Meteora #BinancePick #CryptoTrading #DeFi #TechnicalAnalysis
Disclaimer: This analysis is based on the supplied chart screenshots and is for educational purposes only. It is not financial advice.
MET Up 17%: Is Another Breakout Coming or Is Profit-Taking Near?
Meteora (MET) is attracting attention after gaining approximately 17.83% in the supplied Binance chart snapshot, with price trading around $0.3245.
But the bigger question is whether this rally has enough strength to continue.
What the Four Timeframes Reveal
15-Minute Chart:
MET is trading near its MA(7) at $0.3243, while MA(25) at $0.3129 and MA(99) at $0.2925 remain below price. Short-term momentum is positive, but the price is approaching resistance.
1-Hour Chart:
Price is above MA(7) at $0.3150, MA(25) at $0.2940 and MA(99) at $0.2835. This supports the bullish short-term structure.
4-Hour Chart:
The price remains above all three moving averages: MA(7) at $0.3002, MA(25) at $0.2856 and MA(99) at $0.2963. The broader structure remains constructive.
Daily Chart:
MET is above MA(7) at $0.2846, MA(25) at $0.3156 and MA(99) at $0.2625. However, MA(7) is still below MA(25), so the daily moving-average structure is not fully aligned.
Key Levels Traders Should Watch
Resistance:
$0.3299$0.3329–$0.3334
Support:
$0.3200–$0.3181$0.3156–$0.3129$0.3002
A convincing move above $0.3299–$0.3334 with stronger volume could open the door to further upside.
However, rejection from this zone could trigger profit-taking and a pullback towards the nearby support levels.
The Volume Factor
The reported 24-hour volume is approximately 16.92 million MET, equivalent to around $5.16 million USDT.
Daily volume is strong relative to its displayed averages, but the shorter-timeframe candle volumes are below their respective averages. Traders should watch for fresh buying participation before treating a breakout as confirmed.
Final View
MET currently has a constructive multi-timeframe structure, but its next move depends on how it reacts around the $0.3300–$0.3334 resistance zone.
Chasing a sharp rally without confirmation can be risky.
What do you think happens next?
MET breaks above $0.3334 and continues higher.Sellers defend resistance and price pulls back.MET consolidates before its next move.
Share your analysis in the comments.
#MET #Meteora #BinancePick #CryptoTrading #DeFi #TechnicalAnalysis
Disclaimer: This analysis is based on the supplied chart screenshots and is for educational purposes only. It is not financial advice.
But the bigger question is whether this rally has enough strength to continue.
What the Four Timeframes Reveal
15-Minute Chart:
MET is trading near its MA(7) at $0.3243, while MA(25) at $0.3129 and MA(99) at $0.2925 remain below price. Short-term momentum is positive, but the price is approaching resistance.
1-Hour Chart:
Price is above MA(7) at $0.3150, MA(25) at $0.2940 and MA(99) at $0.2835. This supports the bullish short-term structure.
4-Hour Chart:
The price remains above all three moving averages: MA(7) at $0.3002, MA(25) at $0.2856 and MA(99) at $0.2963. The broader structure remains constructive.
Daily Chart:
MET is above MA(7) at $0.2846, MA(25) at $0.3156 and MA(99) at $0.2625. However, MA(7) is still below MA(25), so the daily moving-average structure is not fully aligned.
Key Levels Traders Should Watch
Resistance:
$0.3299$0.3329–$0.3334
Support:
$0.3200–$0.3181$0.3156–$0.3129$0.3002
A convincing move above $0.3299–$0.3334 with stronger volume could open the door to further upside.
However, rejection from this zone could trigger profit-taking and a pullback towards the nearby support levels.
The Volume Factor
The reported 24-hour volume is approximately 16.92 million MET, equivalent to around $5.16 million USDT.
Daily volume is strong relative to its displayed averages, but the shorter-timeframe candle volumes are below their respective averages. Traders should watch for fresh buying participation before treating a breakout as confirmed.
Final View
MET currently has a constructive multi-timeframe structure, but its next move depends on how it reacts around the $0.3300–$0.3334 resistance zone.
Chasing a sharp rally without confirmation can be risky.
What do you think happens next?
MET breaks above $0.3334 and continues higher.Sellers defend resistance and price pulls back.MET consolidates before its next move.
Share your analysis in the comments.
#MET #Meteora #BinancePick #CryptoTrading #DeFi #TechnicalAnalysis
Disclaimer: This analysis is based on the supplied chart screenshots and is for educational purposes only. It is not financial advice.
206
·
--
#BinancePick
🐋 WHales ARE WATCHING. ARE RETAIL TRADERS READY?
In crypto, the biggest moves don't always begin with a loud announcement.
Sometimes, the clues appear quietly:
📊 Large wallet movements
📉 Sudden changes in trading volume
⚡ Unexpected liquidation spikes
🎯 Price reactions around key support and resistance levels
But here's the catch: A large transaction doesn't automatically mean a whale is buying or selling.
Smart traders look for confirmation instead of blindly following the crowd.
The real question is:
Are you watching what the market is doing, or just reacting to what everyone else is saying?
💬 What's your biggest trading signal?
1️⃣ Whale activity
2️⃣ Volume confirmation
3️⃣ Price action
4️⃣ Market sentiment
Let's hear your strategy!
#BinancePick #Bitcoin #BTC #WhaleActivity #CryptoTrading #MarketAnalysis
#BinancePick
🐋 WHales ARE WATCHING. ARE RETAIL TRADERS READY?
In crypto, the biggest moves don't always begin with a loud announcement.
Sometimes, the clues appear quietly:
📊 Large wallet movements
📉 Sudden changes in trading volume
⚡ Unexpected liquidation spikes
🎯 Price reactions around key support and resistance levels
But here's the catch: A large transaction doesn't automatically mean a whale is buying or selling.
Smart traders look for confirmation instead of blindly following the crowd.
The real question is:
Are you watching what the market is doing, or just reacting to what everyone else is saying?
💬 What's your biggest trading signal?
1️⃣ Whale activity
2️⃣ Volume confirmation
3️⃣ Price action
4️⃣ Market sentiment
Let's hear your strategy!
#BinancePick #Bitcoin #BTC #WhaleActivity #CryptoTrading #MarketAnalysis
🐋 WHales ARE WATCHING. ARE RETAIL TRADERS READY?
In crypto, the biggest moves don't always begin with a loud announcement.
Sometimes, the clues appear quietly:
📊 Large wallet movements
📉 Sudden changes in trading volume
⚡ Unexpected liquidation spikes
🎯 Price reactions around key support and resistance levels
But here's the catch: A large transaction doesn't automatically mean a whale is buying or selling.
Smart traders look for confirmation instead of blindly following the crowd.
The real question is:
Are you watching what the market is doing, or just reacting to what everyone else is saying?
💬 What's your biggest trading signal?
1️⃣ Whale activity
2️⃣ Volume confirmation
3️⃣ Price action
4️⃣ Market sentiment
Let's hear your strategy!
#BinancePick #Bitcoin #BTC #WhaleActivity #CryptoTrading #MarketAnalysis


2
·
--
🚨 $1.27 BILLION LIQUIDATED! WHO GOT CAUGHT IN THE CRYPTO CRASH?
Crypto traders just witnessed a brutal reminder of how quickly the market can turn.
Over $1.27 billion in leveraged positions were reportedly liquidated, with Long traders taking the biggest hit.
Here's what makes this situation important:
🔻 Bitcoin dropped towards $75,200.
🔻 Long positions accounted for the majority of liquidations.
🔻 Technology stocks also faced heavy selling pressure.
🔻 US economic data added another layer of uncertainty.
But the biggest question isn't just how much money was lost.
Was this a temporary shakeout, or could the market be preparing for another major move?
When billions in leveraged positions disappear, traders need to pay attention to liquidity, volume and key support levels.
💬 What do you think comes next?
1️⃣ A strong BTC recovery
2️⃣ Another leg down
3️⃣ Sideways consolidation before the next big move
Share your analysis below!
#BinancePick #Bitcoin #BTC #CryptoLiquidations #CryptoCrash #FuturesTrading #CryptoMarket
Disclaimer: Market figures are reported estimates and may vary by data provider. This is not financial advice.
🚨 $1.27 BILLION LIQUIDATED! WHO GOT CAUGHT IN THE CRYPTO CRASH?
Crypto traders just witnessed a brutal reminder of how quickly the market can turn.
Over $1.27 billion in leveraged positions were reportedly liquidated, with Long traders taking the biggest hit.
Here's what makes this situation important:
🔻 Bitcoin dropped towards $75,200.
🔻 Long positions accounted for the majority of liquidations.
🔻 Technology stocks also faced heavy selling pressure.
🔻 US economic data added another layer of uncertainty.
But the biggest question isn't just how much money was lost.
Was this a temporary shakeout, or could the market be preparing for another major move?
When billions in leveraged positions disappear, traders need to pay attention to liquidity, volume and key support levels.
💬 What do you think comes next?
1️⃣ A strong BTC recovery
2️⃣ Another leg down
3️⃣ Sideways consolidation before the next big move
Share your analysis below!
#BinancePick #Bitcoin #BTC #CryptoLiquidations #CryptoCrash #FuturesTrading #CryptoMarket
Disclaimer: Market figures are reported estimates and may vary by data provider. This is not financial advice.
Crypto traders just witnessed a brutal reminder of how quickly the market can turn.
Over $1.27 billion in leveraged positions were reportedly liquidated, with Long traders taking the biggest hit.
Here's what makes this situation important:
🔻 Bitcoin dropped towards $75,200.
🔻 Long positions accounted for the majority of liquidations.
🔻 Technology stocks also faced heavy selling pressure.
🔻 US economic data added another layer of uncertainty.
But the biggest question isn't just how much money was lost.
Was this a temporary shakeout, or could the market be preparing for another major move?
When billions in leveraged positions disappear, traders need to pay attention to liquidity, volume and key support levels.
💬 What do you think comes next?
1️⃣ A strong BTC recovery
2️⃣ Another leg down
3️⃣ Sideways consolidation before the next big move
Share your analysis below!
#BinancePick #Bitcoin #BTC #CryptoLiquidations #CryptoCrash #FuturesTrading #CryptoMarket
Disclaimer: Market figures are reported estimates and may vary by data provider. This is not financial advice.

50
·
--
#BinancePick
🚨 ONE WRONG MOVE CAN WIPE OUT DAYS OF PROFITS!
In crypto futures, the biggest danger isn't always choosing the wrong direction.
Sometimes, it's using too much leverage.
A trade can look perfect, the entry can be accurate, and the market can move in your favour — but without proper risk management, one sudden reversal can change everything.
Here's what smart traders never ignore:
📌 Leverage magnifies both profits and losses.
📌 Stop-loss is part of the strategy, not an option.
📌 Position size matters more than excitement.
📌 Protecting capital keeps you in the game.
Remember: The goal isn't to win every trade. It's to survive long enough to catch the right opportunities.
💬 What's more important in futures trading?
1️⃣ Finding the perfect entry
2️⃣ Managing risk
3️⃣ Controlling emotions
What's your answer?
#BinancePick #CryptoTrading #FuturesTrading #RiskManagement #Bitcoin
#BinancePick
🚨 ONE WRONG MOVE CAN WIPE OUT DAYS OF PROFITS!
In crypto futures, the biggest danger isn't always choosing the wrong direction.
Sometimes, it's using too much leverage.
A trade can look perfect, the entry can be accurate, and the market can move in your favour — but without proper risk management, one sudden reversal can change everything.
Here's what smart traders never ignore:
📌 Leverage magnifies both profits and losses.
📌 Stop-loss is part of the strategy, not an option.
📌 Position size matters more than excitement.
📌 Protecting capital keeps you in the game.
Remember: The goal isn't to win every trade. It's to survive long enough to catch the right opportunities.
💬 What's more important in futures trading?
1️⃣ Finding the perfect entry
2️⃣ Managing risk
3️⃣ Controlling emotions
What's your answer?
#BinancePick #CryptoTrading #FuturesTrading #RiskManagement #Bitcoin
🚨 ONE WRONG MOVE CAN WIPE OUT DAYS OF PROFITS!
In crypto futures, the biggest danger isn't always choosing the wrong direction.
Sometimes, it's using too much leverage.
A trade can look perfect, the entry can be accurate, and the market can move in your favour — but without proper risk management, one sudden reversal can change everything.
Here's what smart traders never ignore:
📌 Leverage magnifies both profits and losses.
📌 Stop-loss is part of the strategy, not an option.
📌 Position size matters more than excitement.
📌 Protecting capital keeps you in the game.
Remember: The goal isn't to win every trade. It's to survive long enough to catch the right opportunities.
💬 What's more important in futures trading?
1️⃣ Finding the perfect entry
2️⃣ Managing risk
3️⃣ Controlling emotions
What's your answer?
#BinancePick #CryptoTrading #FuturesTrading #RiskManagement #Bitcoin


48
·
--
🚨 A $123,000 BTC LONG LOSS! Will This Trader Hold or Fold?
One massive Bitcoin long position is catching traders' attention.
📊 Position Breakdown:
Trader: @marvtrader
Pair: BTCUSDT Perpetual
Position: 3X Long
Entry Price: $115,218.73
Price at screenshot: $76,186.70
Unrealized PNL: -$123,341.21
Reported PNL: -153.72%
This position was opened on October 28, 2025.
Bitcoin has moved significantly below the entry price, leaving this trader with a huge unrealized loss.
But here's the big question:
Is this a test of patience, or a warning about the risks of holding leveraged positions for too long?
Some traders believe in DCA and long-term conviction. Others believe protecting capital matters more than waiting for recovery.
💬 What would you do in this situation?
1️⃣ Hold the position
2️⃣ Reduce exposure
3️⃣ Close and protect remaining capital
Let's hear your perspective.
#BinancePick #BTC #Bitcoin #BigLong #FuturesTrading #CryptoTrading
Disclaimer: This is a third-party position snapshot, not financial advice. Figures may change.
🚨 A $123,000 BTC LONG LOSS! Will This Trader Hold or Fold?
One massive Bitcoin long position is catching traders' attention.
📊 Position Breakdown:
Trader: @marvtrader
Pair: BTCUSDT Perpetual
Position: 3X Long
Entry Price: $115,218.73
Price at screenshot: $76,186.70
Unrealized PNL: -$123,341.21
Reported PNL: -153.72%
This position was opened on October 28, 2025.
Bitcoin has moved significantly below the entry price, leaving this trader with a huge unrealized loss.
But here's the big question:
Is this a test of patience, or a warning about the risks of holding leveraged positions for too long?
Some traders believe in DCA and long-term conviction. Others believe protecting capital matters more than waiting for recovery.
💬 What would you do in this situation?
1️⃣ Hold the position
2️⃣ Reduce exposure
3️⃣ Close and protect remaining capital
Let's hear your perspective.
#BinancePick #BTC #Bitcoin #BigLong #FuturesTrading #CryptoTrading
Disclaimer: This is a third-party position snapshot, not financial advice. Figures may change.
One massive Bitcoin long position is catching traders' attention.
📊 Position Breakdown:
Trader: @marvtrader
Pair: BTCUSDT Perpetual
Position: 3X Long
Entry Price: $115,218.73
Price at screenshot: $76,186.70
Unrealized PNL: -$123,341.21
Reported PNL: -153.72%
This position was opened on October 28, 2025.
Bitcoin has moved significantly below the entry price, leaving this trader with a huge unrealized loss.
But here's the big question:
Is this a test of patience, or a warning about the risks of holding leveraged positions for too long?
Some traders believe in DCA and long-term conviction. Others believe protecting capital matters more than waiting for recovery.
💬 What would you do in this situation?
1️⃣ Hold the position
2️⃣ Reduce exposure
3️⃣ Close and protect remaining capital
Let's hear your perspective.
#BinancePick #BTC #Bitcoin #BigLong #FuturesTrading #CryptoTrading
Disclaimer: This is a third-party position snapshot, not financial advice. Figures may change.

62
·
--
🚨 4,259 BTC MOVED! Is Trump Media Preparing for a Major Bitcoin Sale?
A wallet linked to Trump Media ($DJT) has transferred approximately 4,259 BTC — worth around $342 million — to Crypto.com, according to on-chain data.
But here's what makes this move particularly interesting:
🔹 The Bitcoin came from wallets labelled as 2028 Convertible Notes Collateral.
🔹 The transfer represents roughly 30% of the company's previously disclosed Bitcoin holdings.
🔹 November 30 is an important date: holders of Trump Media's convertible notes may demand cash repayment of up to approximately $1 billion.
So, is the company preparing to sell Bitcoin to meet its financial obligations?
Not necessarily.
A transfer to Crypto.com does NOT automatically mean a sale. The company has described similar previous transfers as custody or trading-management moves.
The real question is what happens next.
Will these BTC remain in custody, move to another wallet, or eventually enter the market?
For Bitcoin traders, this is a development worth watching — but not a confirmed sell signal.
💬 What's your take?
1️⃣ Possible BTC sell-off
2️⃣ Routine custody transfer
3️⃣ A move connected to upcoming debt obligations
Share your view below.
#BinancePick #Bitcoin #BTC #TrumpMedia #CryptoNews #OnChainData #CryptoMarket
Disclaimer: This post is for educational and informational purposes only, not financial advice.
🚨 4,259 BTC MOVED! Is Trump Media Preparing for a Major Bitcoin Sale?
A wallet linked to Trump Media ($DJT) has transferred approximately 4,259 BTC — worth around $342 million — to Crypto.com, according to on-chain data.
But here's what makes this move particularly interesting:
🔹 The Bitcoin came from wallets labelled as 2028 Convertible Notes Collateral.
🔹 The transfer represents roughly 30% of the company's previously disclosed Bitcoin holdings.
🔹 November 30 is an important date: holders of Trump Media's convertible notes may demand cash repayment of up to approximately $1 billion.
So, is the company preparing to sell Bitcoin to meet its financial obligations?
Not necessarily.
A transfer to Crypto.com does NOT automatically mean a sale. The company has described similar previous transfers as custody or trading-management moves.
The real question is what happens next.
Will these BTC remain in custody, move to another wallet, or eventually enter the market?
For Bitcoin traders, this is a development worth watching — but not a confirmed sell signal.
💬 What's your take?
1️⃣ Possible BTC sell-off
2️⃣ Routine custody transfer
3️⃣ A move connected to upcoming debt obligations
Share your view below.
#BinancePick #Bitcoin #BTC #TrumpMedia #CryptoNews #OnChainData #CryptoMarket
Disclaimer: This post is for educational and informational purposes only, not financial advice.
A wallet linked to Trump Media ($DJT) has transferred approximately 4,259 BTC — worth around $342 million — to Crypto.com, according to on-chain data.
But here's what makes this move particularly interesting:
🔹 The Bitcoin came from wallets labelled as 2028 Convertible Notes Collateral.
🔹 The transfer represents roughly 30% of the company's previously disclosed Bitcoin holdings.
🔹 November 30 is an important date: holders of Trump Media's convertible notes may demand cash repayment of up to approximately $1 billion.
So, is the company preparing to sell Bitcoin to meet its financial obligations?
Not necessarily.
A transfer to Crypto.com does NOT automatically mean a sale. The company has described similar previous transfers as custody or trading-management moves.
The real question is what happens next.
Will these BTC remain in custody, move to another wallet, or eventually enter the market?
For Bitcoin traders, this is a development worth watching — but not a confirmed sell signal.
💬 What's your take?
1️⃣ Possible BTC sell-off
2️⃣ Routine custody transfer
3️⃣ A move connected to upcoming debt obligations
Share your view below.
#BinancePick #Bitcoin #BTC #TrumpMedia #CryptoNews #OnChainData #CryptoMarket
Disclaimer: This post is for educational and informational purposes only, not financial advice.

48
·
--
Article
SOLANA AT $90: IS THIS THE BOTTOM — OR IS ANOTHER DROP COMING?SOL has lost nearly 7% in 24 hours. Buyers are trying to defend the $88 zone, but the bigger charts are still sending warning signals.
Solana is facing a critical technical moment.
At the time of the supplied Binance screenshots, SOL/USDT was trading around $90.03, down approximately 6.98% over 24 hours.
Its 24-hour high was $96.97, while its low stood at $88.30.
But the interesting part is not just the decline.
The real question is whether the recent price action represents the beginning of a recovery — or merely a temporary bounce inside a larger downtrend.
Let's examine all four timeframes.
🔍 1. THE 15-MINUTE CHART: BUYERS ARE TRYING TO FIGHT BACK
SOL is trading slightly above its short-term moving averages:
MA(7): $89.96MA(25): $89.63MA(99): $91.27
Price near $90.03 is showing some short-term stabilization.
However, the MA(99) near $91.27 remains an important resistance area.
What this means: Short-term buyers are showing some activity, but SOL needs stronger buying pressure to challenge the higher resistance zone.
⚠️ 2. THE 1-HOUR CHART: RECOVERY STILL NEEDS CONFIRMATION
The hourly chart looks more cautious:
MA(7): $89.67MA(25): $91.23MA(99): $93.03
SOL is above MA(7), but remains below MA(25) and MA(99).
This suggests that the short-term bounce has not yet changed the broader hourly structure.
A sustained move above $91.23 could be an early improvement. Reclaiming $93.03 would be a stronger signal.
🔴 3. THE 4-HOUR CHART: SELLERS STILL HAVE THE ADVANTAGE
The four-hour chart shows:
MA(7): $90.81MA(25): $92.82MA(99): $98.66
Price is below all three moving averages.
This is an important warning.
The $90.81–$92.82 area could become a resistance zone if SOL attempts to recover.
A stronger recovery would require price to reclaim these averages with convincing volume.
📉 4. THE DAILY CHART: THE BIGGER TREND REMAINS UNDER PRESSURE
The daily chart is particularly important for traders looking beyond short-term fluctuations.
MA(7): $92.83MA(25): $100.16MA(99): $99.37
SOL is trading below all three moving averages.
This indicates that the daily structure remains weak.
The $99–$100 area could become a major recovery hurdle if buyers regain control.
🎯 IMPORTANT SOL PRICE LEVELS
Support zones to watch:
$88.30 — recent 24-hour low.$87.80 — nearby lower chart reference.$86.52 — another downside reference from the supplied charts.
Resistance zones to watch:
$90.81 — 4H MA(7).$91.23–$91.27 — hourly and 15-minute resistance.$92.82–$93.03 — stronger moving-average resistance.$96.97 — recent 24-hour high.$98.66–$100.16 — major higher-timeframe moving-average zone.
These are technical reference levels, not guaranteed turning points.
🐂 BULLISH SCENARIO: CAN SOL RECLAIM $93?
If buyers defend the $88.30 area and SOL moves above $91.23–$93.03 with stronger volume, the market could attempt a recovery toward $96.97.
A sustained move above that level would improve the short-term picture.
🐻 BEARISH SCENARIO: WHAT IF $88.30 BREAKS?
If SOL loses $88.30 and fails to recover it, traders may watch $87.80 and $86.52 as the next downside reference areas.
A breakdown accompanied by increasing selling volume would make the bearish scenario more concerning.
📊 THE VOLUME SIGNAL
The supplied 24-hour statistics show:
SOL volume: 2.77 million SOL.USDT volume: approximately $252.10 million.
A price recovery supported by stronger buying volume would be more convincing than a low-volume bounce.
THE BIG QUESTION: IS SOLANA READY TO REBOUND?
The 15-minute chart is showing early stabilization, but the 1H, 4H and daily charts remain below important moving averages.
That creates an interesting battle between short-term buyers and the broader bearish structure.
What do you think comes next?
A) SOL recovers toward $97.
B) SOL breaks below $88.30.
C) SOL consolidates around $88–$93 before choosing a direction.
Share your analysis in the comments. Let's see what other traders are watching!
Disclaimer: This analysis is based on the Binance screenshots supplied on November 6, 2026. Prices and indicators may change. The levels are technical observations, not financial advice or guaranteed predictions. Always manage risk and do your own research.
#Solana #SOL #SOLUSDT #CryptoAnalysis #TechnicalAnalysis #Bitcoin #Altcoins #CryptoTrading #BinanceSquare
SOLANA AT $90: IS THIS THE BOTTOM — OR IS ANOTHER DROP COMING?
SOL has lost nearly 7% in 24 hours. Buyers are trying to defend the $88 zone, but the bigger charts are still sending warning signals.
Solana is facing a critical technical moment.
At the time of the supplied Binance screenshots, SOL/USDT was trading around $90.03, down approximately 6.98% over 24 hours.
Its 24-hour high was $96.97, while its low stood at $88.30.
But the interesting part is not just the decline.
The real question is whether the recent price action represents the beginning of a recovery — or merely a temporary bounce inside a larger downtrend.
Let's examine all four timeframes.
🔍 1. THE 15-MINUTE CHART: BUYERS ARE TRYING TO FIGHT BACK
SOL is trading slightly above its short-term moving averages:
MA(7): $89.96MA(25): $89.63MA(99): $91.27
Price near $90.03 is showing some short-term stabilization.
However, the MA(99) near $91.27 remains an important resistance area.
What this means: Short-term buyers are showing some activity, but SOL needs stronger buying pressure to challenge the higher resistance zone.
⚠️ 2. THE 1-HOUR CHART: RECOVERY STILL NEEDS CONFIRMATION
The hourly chart looks more cautious:
MA(7): $89.67MA(25): $91.23MA(99): $93.03
SOL is above MA(7), but remains below MA(25) and MA(99).
This suggests that the short-term bounce has not yet changed the broader hourly structure.
A sustained move above $91.23 could be an early improvement. Reclaiming $93.03 would be a stronger signal.
🔴 3. THE 4-HOUR CHART: SELLERS STILL HAVE THE ADVANTAGE
The four-hour chart shows:
MA(7): $90.81MA(25): $92.82MA(99): $98.66
Price is below all three moving averages.
This is an important warning.
The $90.81–$92.82 area could become a resistance zone if SOL attempts to recover.
A stronger recovery would require price to reclaim these averages with convincing volume.
📉 4. THE DAILY CHART: THE BIGGER TREND REMAINS UNDER PRESSURE
The daily chart is particularly important for traders looking beyond short-term fluctuations.
MA(7): $92.83MA(25): $100.16MA(99): $99.37
SOL is trading below all three moving averages.
This indicates that the daily structure remains weak.
The $99–$100 area could become a major recovery hurdle if buyers regain control.
🎯 IMPORTANT SOL PRICE LEVELS
Support zones to watch:
$88.30 — recent 24-hour low.$87.80 — nearby lower chart reference.$86.52 — another downside reference from the supplied charts.
Resistance zones to watch:
$90.81 — 4H MA(7).$91.23–$91.27 — hourly and 15-minute resistance.$92.82–$93.03 — stronger moving-average resistance.$96.97 — recent 24-hour high.$98.66–$100.16 — major higher-timeframe moving-average zone.
These are technical reference levels, not guaranteed turning points.
🐂 BULLISH SCENARIO: CAN SOL RECLAIM $93?
If buyers defend the $88.30 area and SOL moves above $91.23–$93.03 with stronger volume, the market could attempt a recovery toward $96.97.
A sustained move above that level would improve the short-term picture.
🐻 BEARISH SCENARIO: WHAT IF $88.30 BREAKS?
If SOL loses $88.30 and fails to recover it, traders may watch $87.80 and $86.52 as the next downside reference areas.
A breakdown accompanied by increasing selling volume would make the bearish scenario more concerning.
📊 THE VOLUME SIGNAL
The supplied 24-hour statistics show:
SOL volume: 2.77 million SOL.USDT volume: approximately $252.10 million.
A price recovery supported by stronger buying volume would be more convincing than a low-volume bounce.
THE BIG QUESTION: IS SOLANA READY TO REBOUND?
The 15-minute chart is showing early stabilization, but the 1H, 4H and daily charts remain below important moving averages.
That creates an interesting battle between short-term buyers and the broader bearish structure.
What do you think comes next?
A) SOL recovers toward $97.
B) SOL breaks below $88.30.
C) SOL consolidates around $88–$93 before choosing a direction.
Share your analysis in the comments. Let's see what other traders are watching!
Disclaimer: This analysis is based on the Binance screenshots supplied on November 6, 2026. Prices and indicators may change. The levels are technical observations, not financial advice or guaranteed predictions. Always manage risk and do your own research.
#Solana #SOL #SOLUSDT #CryptoAnalysis #TechnicalAnalysis #Bitcoin #Altcoins #CryptoTrading #BinanceSquare
Solana is facing a critical technical moment.
At the time of the supplied Binance screenshots, SOL/USDT was trading around $90.03, down approximately 6.98% over 24 hours.
Its 24-hour high was $96.97, while its low stood at $88.30.
But the interesting part is not just the decline.
The real question is whether the recent price action represents the beginning of a recovery — or merely a temporary bounce inside a larger downtrend.
Let's examine all four timeframes.
🔍 1. THE 15-MINUTE CHART: BUYERS ARE TRYING TO FIGHT BACK
SOL is trading slightly above its short-term moving averages:
MA(7): $89.96MA(25): $89.63MA(99): $91.27
Price near $90.03 is showing some short-term stabilization.
However, the MA(99) near $91.27 remains an important resistance area.
What this means: Short-term buyers are showing some activity, but SOL needs stronger buying pressure to challenge the higher resistance zone.
⚠️ 2. THE 1-HOUR CHART: RECOVERY STILL NEEDS CONFIRMATION
The hourly chart looks more cautious:
MA(7): $89.67MA(25): $91.23MA(99): $93.03
SOL is above MA(7), but remains below MA(25) and MA(99).
This suggests that the short-term bounce has not yet changed the broader hourly structure.
A sustained move above $91.23 could be an early improvement. Reclaiming $93.03 would be a stronger signal.
🔴 3. THE 4-HOUR CHART: SELLERS STILL HAVE THE ADVANTAGE
The four-hour chart shows:
MA(7): $90.81MA(25): $92.82MA(99): $98.66
Price is below all three moving averages.
This is an important warning.
The $90.81–$92.82 area could become a resistance zone if SOL attempts to recover.
A stronger recovery would require price to reclaim these averages with convincing volume.
📉 4. THE DAILY CHART: THE BIGGER TREND REMAINS UNDER PRESSURE
The daily chart is particularly important for traders looking beyond short-term fluctuations.
MA(7): $92.83MA(25): $100.16MA(99): $99.37
SOL is trading below all three moving averages.
This indicates that the daily structure remains weak.
The $99–$100 area could become a major recovery hurdle if buyers regain control.
🎯 IMPORTANT SOL PRICE LEVELS
Support zones to watch:
$88.30 — recent 24-hour low.$87.80 — nearby lower chart reference.$86.52 — another downside reference from the supplied charts.
Resistance zones to watch:
$90.81 — 4H MA(7).$91.23–$91.27 — hourly and 15-minute resistance.$92.82–$93.03 — stronger moving-average resistance.$96.97 — recent 24-hour high.$98.66–$100.16 — major higher-timeframe moving-average zone.
These are technical reference levels, not guaranteed turning points.
🐂 BULLISH SCENARIO: CAN SOL RECLAIM $93?
If buyers defend the $88.30 area and SOL moves above $91.23–$93.03 with stronger volume, the market could attempt a recovery toward $96.97.
A sustained move above that level would improve the short-term picture.
🐻 BEARISH SCENARIO: WHAT IF $88.30 BREAKS?
If SOL loses $88.30 and fails to recover it, traders may watch $87.80 and $86.52 as the next downside reference areas.
A breakdown accompanied by increasing selling volume would make the bearish scenario more concerning.
📊 THE VOLUME SIGNAL
The supplied 24-hour statistics show:
SOL volume: 2.77 million SOL.USDT volume: approximately $252.10 million.
A price recovery supported by stronger buying volume would be more convincing than a low-volume bounce.
THE BIG QUESTION: IS SOLANA READY TO REBOUND?
The 15-minute chart is showing early stabilization, but the 1H, 4H and daily charts remain below important moving averages.
That creates an interesting battle between short-term buyers and the broader bearish structure.
What do you think comes next?
A) SOL recovers toward $97.
B) SOL breaks below $88.30.
C) SOL consolidates around $88–$93 before choosing a direction.
Share your analysis in the comments. Let's see what other traders are watching!
Disclaimer: This analysis is based on the Binance screenshots supplied on November 6, 2026. Prices and indicators may change. The levels are technical observations, not financial advice or guaranteed predictions. Always manage risk and do your own research.
#Solana #SOL #SOLUSDT #CryptoAnalysis #TechnicalAnalysis #Bitcoin #Altcoins #CryptoTrading #BinanceSquare
90
·
--

Article
$6.34 BILLION BINANCE HACK! BUT HERE'S WHAT THE HACKERS DIDN'T EXPECT…A sophisticated cyberattack. A fake job interview. Billions in affected crypto assets. And one major question: Who actually paid the price?
The crypto world was shaken on October 29, 2026, when Binance experienced one of the most significant security incidents in crypto history.
Approximately $6.34 BILLION in digital assets were impacted.
But the most surprising part of this story isn't just the size of the attack.
It's how the attack happened — and how Binance responded to protect its users.
Let's break it down.
🚨 1. THE ATTACK STARTED WITH A FAKE JOB INTERVIEW!
According to Binance's preliminary investigation, this wasn't a simple hacking attempt.
The attackers reportedly spent months preparing their operation.
Their methods included:
Malicious software disguised as legitimate AI development tools.Fake recruitment campaigns targeting Binance employees.Fraudulent job interviews designed to build trust.Compromised employee devices and stolen credentials.Unauthorized access to internal wallet-signing operations.
The attackers reportedly used a fake technical assignment to compromise an engineer's work computer.
They later exploited internal access to initiate unauthorized crypto transactions.
The FBI attributed the attack to North Korea-linked cybercriminal group TraderTraitor. North Korea has denied involvement.
Think about that for a moment: a fake job opportunity reportedly became part of a multibillion-dollar crypto security incident.
💰 2. WHICH CRYPTO ASSETS WERE AFFECTED?
Binance's preliminary report identified unauthorized transfers involving several major cryptocurrencies:
XRP: Approximately 233.46 million XRP.SOL: Approximately 970,500 SOL.OP: Approximately 44.2 million OP.BTC: Approximately 18,270 BTC.ETH: Approximately 2,961.9 ETH in the final reported unauthorized transfer.
These movements occurred across multiple blockchain networks.
The scale and speed of the attack demonstrated how sophisticated cyber threats can target even major crypto platforms.
🛡️ 3. BINANCE'S RESPONSE: THE PART TRADERS SHOULD NOTICE
Now comes the most important part of this story.
Instead of passing the financial impact of the incident on to customers, Binance publicly committed to absorbing the losses itself.
According to Binance's November 3 update:
Approximately $6.34 billion in digital assets were affected.Approximately $2.85 billion had been frozen or intercepted.98% of affected token assets had been replenished.Binance had reserved more than 100% of the funds needed to cover the financial impact.The company was purchasing the remaining less-liquid assets.
Binance also said that customers would not bear the financial impact of the stolen funds.
This is an important commitment.
For traders, confidence in an exchange is not built only through trading volume, new listings or market features. It also depends on how the platform responds when something goes seriously wrong.
👏 4. WHY BINANCE DESERVES RECOGNITION FOR ITS RESPONSE
No exchange is immune to sophisticated cyberattacks.
And a security breach of this scale should never be treated as a small matter.
However, Binance's decision to take responsibility for the financial impact rather than leave customers to absorb the loss deserves recognition.
The company also reported several security improvements:
Rebuilding affected systems.Replacing compromised devices.Strengthening wallet-service risk controls.Improving AI-based behavioral anomaly detection.Working with law enforcement and blockchain security partners.Bringing in independent cybersecurity experts for further review.
Binance also said it would continue replenishing its Secure Asset Fund for Users (SAFU).
A security incident tests an exchange. Its response determines how it addresses the trust placed in it by its users.
🔍 5. WHAT DOES THIS INCIDENT MEAN FOR THE FUTURE OF CRYPTO?
This incident raises three important lessons for the entire industry:
First: Employee security is just as important as wallet security.
Second: Social engineering can be more dangerous than many people realize. Even a convincing job interview can become a security threat.
Third: Exchanges need transparent security policies, strong reserves and a clear plan for protecting customers when incidents happen.
The crypto industry cannot grow sustainably without stronger security and user confidence.
💬 THE BIG QUESTION FOR BINANCE TRADERS
Imagine an exchange suffers a multibillion-dollar security incident.
Would you judge it only by the fact that the attack happened — or also by how it responds, protects customers and takes responsibility?
Binance has stated that users will not bear the financial impact of this incident, and it reported that 98% of affected assets had already been replenished by November 3.
Do you think Binance's response has strengthened your confidence in the platform?
Share your honest opinion below.
Let's discuss security, accountability and the future of crypto.
Disclaimer: This article is for educational and informational purposes only. Figures and recovery updates are based on Binance's preliminary statements and published reporting available as of November 3, 2026. The investigation and independent review are ongoing. This is not financial advice.
#Binance #BinanceSecurity #CryptoSecurity #Bitcoin #Ethereum #XRP #Solana #CryptoNews #Blockchain #SAFU #BinanceSquare
$6.34 BILLION BINANCE HACK! BUT HERE'S WHAT THE HACKERS DIDN'T EXPECT…
A sophisticated cyberattack. A fake job interview. Billions in affected crypto assets. And one major question: Who actually paid the price?
The crypto world was shaken on October 29, 2026, when Binance experienced one of the most significant security incidents in crypto history.
Approximately $6.34 BILLION in digital assets were impacted.
But the most surprising part of this story isn't just the size of the attack.
It's how the attack happened — and how Binance responded to protect its users.
Let's break it down.
🚨 1. THE ATTACK STARTED WITH A FAKE JOB INTERVIEW!
According to Binance's preliminary investigation, this wasn't a simple hacking attempt.
The attackers reportedly spent months preparing their operation.
Their methods included:
Malicious software disguised as legitimate AI development tools.Fake recruitment campaigns targeting Binance employees.Fraudulent job interviews designed to build trust.Compromised employee devices and stolen credentials.Unauthorized access to internal wallet-signing operations.
The attackers reportedly used a fake technical assignment to compromise an engineer's work computer.
They later exploited internal access to initiate unauthorized crypto transactions.
The FBI attributed the attack to North Korea-linked cybercriminal group TraderTraitor. North Korea has denied involvement.
Think about that for a moment: a fake job opportunity reportedly became part of a multibillion-dollar crypto security incident.
💰 2. WHICH CRYPTO ASSETS WERE AFFECTED?
Binance's preliminary report identified unauthorized transfers involving several major cryptocurrencies:
XRP: Approximately 233.46 million XRP.SOL: Approximately 970,500 SOL.OP: Approximately 44.2 million OP.BTC: Approximately 18,270 BTC.ETH: Approximately 2,961.9 ETH in the final reported unauthorized transfer.
These movements occurred across multiple blockchain networks.
The scale and speed of the attack demonstrated how sophisticated cyber threats can target even major crypto platforms.
🛡️ 3. BINANCE'S RESPONSE: THE PART TRADERS SHOULD NOTICE
Now comes the most important part of this story.
Instead of passing the financial impact of the incident on to customers, Binance publicly committed to absorbing the losses itself.
According to Binance's November 3 update:
Approximately $6.34 billion in digital assets were affected.Approximately $2.85 billion had been frozen or intercepted.98% of affected token assets had been replenished.Binance had reserved more than 100% of the funds needed to cover the financial impact.The company was purchasing the remaining less-liquid assets.
Binance also said that customers would not bear the financial impact of the stolen funds.
This is an important commitment.
For traders, confidence in an exchange is not built only through trading volume, new listings or market features. It also depends on how the platform responds when something goes seriously wrong.
👏 4. WHY BINANCE DESERVES RECOGNITION FOR ITS RESPONSE
No exchange is immune to sophisticated cyberattacks.
And a security breach of this scale should never be treated as a small matter.
However, Binance's decision to take responsibility for the financial impact rather than leave customers to absorb the loss deserves recognition.
The company also reported several security improvements:
Rebuilding affected systems.Replacing compromised devices.Strengthening wallet-service risk controls.Improving AI-based behavioral anomaly detection.Working with law enforcement and blockchain security partners.Bringing in independent cybersecurity experts for further review.
Binance also said it would continue replenishing its Secure Asset Fund for Users (SAFU).
A security incident tests an exchange. Its response determines how it addresses the trust placed in it by its users.
🔍 5. WHAT DOES THIS INCIDENT MEAN FOR THE FUTURE OF CRYPTO?
This incident raises three important lessons for the entire industry:
First: Employee security is just as important as wallet security.
Second: Social engineering can be more dangerous than many people realize. Even a convincing job interview can become a security threat.
Third: Exchanges need transparent security policies, strong reserves and a clear plan for protecting customers when incidents happen.
The crypto industry cannot grow sustainably without stronger security and user confidence.
💬 THE BIG QUESTION FOR BINANCE TRADERS
Imagine an exchange suffers a multibillion-dollar security incident.
Would you judge it only by the fact that the attack happened — or also by how it responds, protects customers and takes responsibility?
Binance has stated that users will not bear the financial impact of this incident, and it reported that 98% of affected assets had already been replenished by November 3.
Do you think Binance's response has strengthened your confidence in the platform?
Share your honest opinion below.
Let's discuss security, accountability and the future of crypto.
Disclaimer: This article is for educational and informational purposes only. Figures and recovery updates are based on Binance's preliminary statements and published reporting available as of November 3, 2026. The investigation and independent review are ongoing. This is not financial advice.
#Binance #BinanceSecurity #CryptoSecurity #Bitcoin #Ethereum #XRP #Solana #CryptoNews #Blockchain #SAFU #BinanceSquare
The crypto world was shaken on October 29, 2026, when Binance experienced one of the most significant security incidents in crypto history.
Approximately $6.34 BILLION in digital assets were impacted.
But the most surprising part of this story isn't just the size of the attack.
It's how the attack happened — and how Binance responded to protect its users.
Let's break it down.
🚨 1. THE ATTACK STARTED WITH A FAKE JOB INTERVIEW!
According to Binance's preliminary investigation, this wasn't a simple hacking attempt.
The attackers reportedly spent months preparing their operation.
Their methods included:
Malicious software disguised as legitimate AI development tools.Fake recruitment campaigns targeting Binance employees.Fraudulent job interviews designed to build trust.Compromised employee devices and stolen credentials.Unauthorized access to internal wallet-signing operations.
The attackers reportedly used a fake technical assignment to compromise an engineer's work computer.
They later exploited internal access to initiate unauthorized crypto transactions.
The FBI attributed the attack to North Korea-linked cybercriminal group TraderTraitor. North Korea has denied involvement.
Think about that for a moment: a fake job opportunity reportedly became part of a multibillion-dollar crypto security incident.
💰 2. WHICH CRYPTO ASSETS WERE AFFECTED?
Binance's preliminary report identified unauthorized transfers involving several major cryptocurrencies:
XRP: Approximately 233.46 million XRP.SOL: Approximately 970,500 SOL.OP: Approximately 44.2 million OP.BTC: Approximately 18,270 BTC.ETH: Approximately 2,961.9 ETH in the final reported unauthorized transfer.
These movements occurred across multiple blockchain networks.
The scale and speed of the attack demonstrated how sophisticated cyber threats can target even major crypto platforms.
🛡️ 3. BINANCE'S RESPONSE: THE PART TRADERS SHOULD NOTICE
Now comes the most important part of this story.
Instead of passing the financial impact of the incident on to customers, Binance publicly committed to absorbing the losses itself.
According to Binance's November 3 update:
Approximately $6.34 billion in digital assets were affected.Approximately $2.85 billion had been frozen or intercepted.98% of affected token assets had been replenished.Binance had reserved more than 100% of the funds needed to cover the financial impact.The company was purchasing the remaining less-liquid assets.
Binance also said that customers would not bear the financial impact of the stolen funds.
This is an important commitment.
For traders, confidence in an exchange is not built only through trading volume, new listings or market features. It also depends on how the platform responds when something goes seriously wrong.
👏 4. WHY BINANCE DESERVES RECOGNITION FOR ITS RESPONSE
No exchange is immune to sophisticated cyberattacks.
And a security breach of this scale should never be treated as a small matter.
However, Binance's decision to take responsibility for the financial impact rather than leave customers to absorb the loss deserves recognition.
The company also reported several security improvements:
Rebuilding affected systems.Replacing compromised devices.Strengthening wallet-service risk controls.Improving AI-based behavioral anomaly detection.Working with law enforcement and blockchain security partners.Bringing in independent cybersecurity experts for further review.
Binance also said it would continue replenishing its Secure Asset Fund for Users (SAFU).
A security incident tests an exchange. Its response determines how it addresses the trust placed in it by its users.
🔍 5. WHAT DOES THIS INCIDENT MEAN FOR THE FUTURE OF CRYPTO?
This incident raises three important lessons for the entire industry:
First: Employee security is just as important as wallet security.
Second: Social engineering can be more dangerous than many people realize. Even a convincing job interview can become a security threat.
Third: Exchanges need transparent security policies, strong reserves and a clear plan for protecting customers when incidents happen.
The crypto industry cannot grow sustainably without stronger security and user confidence.
💬 THE BIG QUESTION FOR BINANCE TRADERS
Imagine an exchange suffers a multibillion-dollar security incident.
Would you judge it only by the fact that the attack happened — or also by how it responds, protects customers and takes responsibility?
Binance has stated that users will not bear the financial impact of this incident, and it reported that 98% of affected assets had already been replenished by November 3.
Do you think Binance's response has strengthened your confidence in the platform?
Share your honest opinion below.
Let's discuss security, accountability and the future of crypto.
Disclaimer: This article is for educational and informational purposes only. Figures and recovery updates are based on Binance's preliminary statements and published reporting available as of November 3, 2026. The investigation and independent review are ongoing. This is not financial advice.
#Binance #BinanceSecurity #CryptoSecurity #Bitcoin #Ethereum #XRP #Solana #CryptoNews #Blockchain #SAFU #BinanceSquare
196
·
--
Article
🚨 WALL STREET IS BLEEDING… AND CRYPTO IS FEELING THE PAIN! BTC, ETH, XRP & SOL UNDER PRESSUREIs the crypto crash really about crypto — or is something much bigger happening in global markets?
A major risk-off wave is hitting financial markets, and crypto traders are watching closely.
According to the Binance News report dated November 5, 2026, the Nasdaq 100 plunged approximately 6%, while the S&P 500 dropped 3.7%.
But here's what makes this situation particularly interesting:
The technology-stock sell-off is happening alongside a sharp decline in major cryptocurrencies, raising an important question about the connection between Wall Street and the crypto market.
🔴 THE FOUR CRYPTO GIANTS UNDER PRESSURE
Let's look at the major coins traders should be watching.
1. BITCOIN (BTC) — THE MARKET'S BIGGEST SIGNAL
Bitcoin dropped approximately 5.5% to $75,737 in the reported market snapshot.
BTC remains the most important market indicator because its direction can influence sentiment across the wider crypto market.
What traders should watch:
Whether BTC can stabilize after the sharp decline.Whether buyers return with stronger spot-market volume.Whether the recent low holds or breaks.
2. ETHEREUM (ETH) — SELLING PRESSURE DEEPENS
Ethereum fell approximately 6.9% to $2,249.55 in the same report.
ETH's weakness is important because it can reflect broader risk appetite across the altcoin market.
Key question: Can ETH recover independently, or will it continue following Bitcoin's direction?
3. XRP — CAN IT HOLD UP UNDER MARKET PRESSURE?
XRP was also hit in the earlier market snapshot, showing an approximate decline of 4.95%.
During broad market sell-offs, even coins with strong communities and individual catalysts can face selling pressure.
Watch for: Stabilization, renewed buying volume and whether XRP can recover its lost levels.
4. SOLANA (SOL) — ANOTHER MAJOR COIN TO WATCH
SOL recorded an approximate decline of 6.20% in the earlier snapshot.
Solana's next move could provide another clue about whether traders are avoiding risk across major altcoins or beginning to buy the dip.
Watch for: A recovery supported by genuine buying activity rather than a temporary bounce.
Note: BTC and ETH figures above come from the November 5 Binance News snapshot. XRP and SOL percentages are from the earlier market snapshot. These are not necessarily simultaneous prices or returns.
⚠️ WHAT IS HAPPENING ON WALL STREET?
The technology sector is facing a major shake-up.
According to the report:
Nasdaq 100: Down approximately 6%.NVIDIA (NVDA): Fell sharply, with the report citing an 8% decline; its displayed market ticker later showed a larger loss.Tesla (TSLA): Fell around 11% in the report.Qualcomm (QCOM): Under pressure.Arm (ARM): Under pressure after its outlook disappointed investors.S&P 500: Down approximately 3.7%.
The report also highlighted concerns about AI spending, funding requirements and possible tighter regulation.
This matters because investors often reduce exposure to riskier assets when confidence in technology and growth stocks weakens.
Crypto can become part of that wider risk-off move.
💥 THE $870M+ LIQUIDATION QUESTION
Earlier market reports highlighted nearly $880M–$896M in leveraged crypto positions liquidated within four hours.
Why does this matter?
When leveraged traders cannot maintain the required margin, their positions can be automatically closed.
That forced selling can intensify an existing market decline.
But remember: liquidation figures do not prove that the market has reached its bottom.
🔍 THREE THINGS TRADERS SHOULD WATCH NEXT
1. Bitcoin's next move: Does BTC reclaim lost ground or continue lower?
2. Altcoin strength: Can ETH, XRP and SOL stabilize even if market sentiment remains weak?
3. Wall Street recovery: If technology stocks recover, will crypto sentiment improve too?
THE BIG QUESTION
Is this a temporary panic caused by the technology-stock sell-off and excessive leverage — or are global markets entering a deeper risk-off phase?
Which coin do you think will show the strongest recovery first?
🔸 BTC
🔸 ETH
🔸 XRP
🔸 SOL
Share your view in the comments. Let's discuss what the market is actually showing.
Disclaimer: This article is for educational and informational purposes only. Market prices and percentage changes are based on the supplied news snapshots and may vary across exchanges and reporting times. This is not financial advice. Always do your own research.
#Bitcoin #BTC #Ethereum #ETH #XRP #Solana #SOL #CryptoMarket #Nasdaq #NVIDIA #Tesla #AIStocks #CryptoNews #BinanceSquare
🚨 WALL STREET IS BLEEDING… AND CRYPTO IS FEELING THE PAIN! BTC, ETH, XRP & SOL UNDER PRESSURE
Is the crypto crash really about crypto — or is something much bigger happening in global markets?
A major risk-off wave is hitting financial markets, and crypto traders are watching closely.
According to the Binance News report dated November 5, 2026, the Nasdaq 100 plunged approximately 6%, while the S&P 500 dropped 3.7%.
But here's what makes this situation particularly interesting:
The technology-stock sell-off is happening alongside a sharp decline in major cryptocurrencies, raising an important question about the connection between Wall Street and the crypto market.
🔴 THE FOUR CRYPTO GIANTS UNDER PRESSURE
Let's look at the major coins traders should be watching.
1. BITCOIN (BTC) — THE MARKET'S BIGGEST SIGNAL
Bitcoin dropped approximately 5.5% to $75,737 in the reported market snapshot.
BTC remains the most important market indicator because its direction can influence sentiment across the wider crypto market.
What traders should watch:
Whether BTC can stabilize after the sharp decline.Whether buyers return with stronger spot-market volume.Whether the recent low holds or breaks.
2. ETHEREUM (ETH) — SELLING PRESSURE DEEPENS
Ethereum fell approximately 6.9% to $2,249.55 in the same report.
ETH's weakness is important because it can reflect broader risk appetite across the altcoin market.
Key question: Can ETH recover independently, or will it continue following Bitcoin's direction?
3. XRP — CAN IT HOLD UP UNDER MARKET PRESSURE?
XRP was also hit in the earlier market snapshot, showing an approximate decline of 4.95%.
During broad market sell-offs, even coins with strong communities and individual catalysts can face selling pressure.
Watch for: Stabilization, renewed buying volume and whether XRP can recover its lost levels.
4. SOLANA (SOL) — ANOTHER MAJOR COIN TO WATCH
SOL recorded an approximate decline of 6.20% in the earlier snapshot.
Solana's next move could provide another clue about whether traders are avoiding risk across major altcoins or beginning to buy the dip.
Watch for: A recovery supported by genuine buying activity rather than a temporary bounce.
Note: BTC and ETH figures above come from the November 5 Binance News snapshot. XRP and SOL percentages are from the earlier market snapshot. These are not necessarily simultaneous prices or returns.
⚠️ WHAT IS HAPPENING ON WALL STREET?
The technology sector is facing a major shake-up.
According to the report:
Nasdaq 100: Down approximately 6%.NVIDIA (NVDA): Fell sharply, with the report citing an 8% decline; its displayed market ticker later showed a larger loss.Tesla (TSLA): Fell around 11% in the report.Qualcomm (QCOM): Under pressure.Arm (ARM): Under pressure after its outlook disappointed investors.S&P 500: Down approximately 3.7%.
The report also highlighted concerns about AI spending, funding requirements and possible tighter regulation.
This matters because investors often reduce exposure to riskier assets when confidence in technology and growth stocks weakens.
Crypto can become part of that wider risk-off move.
💥 THE $870M+ LIQUIDATION QUESTION
Earlier market reports highlighted nearly $880M–$896M in leveraged crypto positions liquidated within four hours.
Why does this matter?
When leveraged traders cannot maintain the required margin, their positions can be automatically closed.
That forced selling can intensify an existing market decline.
But remember: liquidation figures do not prove that the market has reached its bottom.
🔍 THREE THINGS TRADERS SHOULD WATCH NEXT
1. Bitcoin's next move: Does BTC reclaim lost ground or continue lower?
2. Altcoin strength: Can ETH, XRP and SOL stabilize even if market sentiment remains weak?
3. Wall Street recovery: If technology stocks recover, will crypto sentiment improve too?
THE BIG QUESTION
Is this a temporary panic caused by the technology-stock sell-off and excessive leverage — or are global markets entering a deeper risk-off phase?
Which coin do you think will show the strongest recovery first?
🔸 BTC
🔸 ETH
🔸 XRP
🔸 SOL
Share your view in the comments. Let's discuss what the market is actually showing.
Disclaimer: This article is for educational and informational purposes only. Market prices and percentage changes are based on the supplied news snapshots and may vary across exchanges and reporting times. This is not financial advice. Always do your own research.
#Bitcoin #BTC #Ethereum #ETH #XRP #Solana #SOL #CryptoMarket #Nasdaq #NVIDIA #Tesla #AIStocks #CryptoNews #BinanceSquare
A major risk-off wave is hitting financial markets, and crypto traders are watching closely.
According to the Binance News report dated November 5, 2026, the Nasdaq 100 plunged approximately 6%, while the S&P 500 dropped 3.7%.
But here's what makes this situation particularly interesting:
The technology-stock sell-off is happening alongside a sharp decline in major cryptocurrencies, raising an important question about the connection between Wall Street and the crypto market.
🔴 THE FOUR CRYPTO GIANTS UNDER PRESSURE
Let's look at the major coins traders should be watching.
1. BITCOIN (BTC) — THE MARKET'S BIGGEST SIGNAL
Bitcoin dropped approximately 5.5% to $75,737 in the reported market snapshot.
BTC remains the most important market indicator because its direction can influence sentiment across the wider crypto market.
What traders should watch:
Whether BTC can stabilize after the sharp decline.Whether buyers return with stronger spot-market volume.Whether the recent low holds or breaks.
2. ETHEREUM (ETH) — SELLING PRESSURE DEEPENS
Ethereum fell approximately 6.9% to $2,249.55 in the same report.
ETH's weakness is important because it can reflect broader risk appetite across the altcoin market.
Key question: Can ETH recover independently, or will it continue following Bitcoin's direction?
3. XRP — CAN IT HOLD UP UNDER MARKET PRESSURE?
XRP was also hit in the earlier market snapshot, showing an approximate decline of 4.95%.
During broad market sell-offs, even coins with strong communities and individual catalysts can face selling pressure.
Watch for: Stabilization, renewed buying volume and whether XRP can recover its lost levels.
4. SOLANA (SOL) — ANOTHER MAJOR COIN TO WATCH
SOL recorded an approximate decline of 6.20% in the earlier snapshot.
Solana's next move could provide another clue about whether traders are avoiding risk across major altcoins or beginning to buy the dip.
Watch for: A recovery supported by genuine buying activity rather than a temporary bounce.
Note: BTC and ETH figures above come from the November 5 Binance News snapshot. XRP and SOL percentages are from the earlier market snapshot. These are not necessarily simultaneous prices or returns.
⚠️ WHAT IS HAPPENING ON WALL STREET?
The technology sector is facing a major shake-up.
According to the report:
Nasdaq 100: Down approximately 6%.NVIDIA (NVDA): Fell sharply, with the report citing an 8% decline; its displayed market ticker later showed a larger loss.Tesla (TSLA): Fell around 11% in the report.Qualcomm (QCOM): Under pressure.Arm (ARM): Under pressure after its outlook disappointed investors.S&P 500: Down approximately 3.7%.
The report also highlighted concerns about AI spending, funding requirements and possible tighter regulation.
This matters because investors often reduce exposure to riskier assets when confidence in technology and growth stocks weakens.
Crypto can become part of that wider risk-off move.
💥 THE $870M+ LIQUIDATION QUESTION
Earlier market reports highlighted nearly $880M–$896M in leveraged crypto positions liquidated within four hours.
Why does this matter?
When leveraged traders cannot maintain the required margin, their positions can be automatically closed.
That forced selling can intensify an existing market decline.
But remember: liquidation figures do not prove that the market has reached its bottom.
🔍 THREE THINGS TRADERS SHOULD WATCH NEXT
1. Bitcoin's next move: Does BTC reclaim lost ground or continue lower?
2. Altcoin strength: Can ETH, XRP and SOL stabilize even if market sentiment remains weak?
3. Wall Street recovery: If technology stocks recover, will crypto sentiment improve too?
THE BIG QUESTION
Is this a temporary panic caused by the technology-stock sell-off and excessive leverage — or are global markets entering a deeper risk-off phase?
Which coin do you think will show the strongest recovery first?
🔸 BTC
🔸 ETH
🔸 XRP
🔸 SOL
Share your view in the comments. Let's discuss what the market is actually showing.
Disclaimer: This article is for educational and informational purposes only. Market prices and percentage changes are based on the supplied news snapshots and may vary across exchanges and reporting times. This is not financial advice. Always do your own research.
#Bitcoin #BTC #Ethereum #ETH #XRP #Solana #SOL #CryptoMarket #Nasdaq #NVIDIA #Tesla #AIStocks #CryptoNews #BinanceSquare
248
·
--
🚨 WAIT… WHAT IF THE BIGGEST CRYPTO OPPORTUNITY APPEARS RIGHT AFTER THE BIGGEST LIQUIDATION?
Nearly $900 MILLION in leveraged positions wiped out in just 4 hours.
Bitcoin and major altcoins took a hit. Thousands of traders may have been caught on the wrong side of the move.
But there's something many traders might be overlooking…
When the market wipes out excessive leverage, what happens NEXT can be more important than the crash itself.
Is smart money preparing for a recovery… or is another shakeout coming?
I'm watching 3 signals that could reveal the market's next move. 👀
One question for traders:
Are you watching for a bounce, or preparing for another drop?
👇 Drop your view. Let's see who reads the market correctly.
#BinancePick #Bitcoin #CryptoMarket #BTC #Altcoins #Liquidation
🚨 WAIT… WHAT IF THE BIGGEST CRYPTO OPPORTUNITY APPEARS RIGHT AFTER THE BIGGEST LIQUIDATION?
Nearly $900 MILLION in leveraged positions wiped out in just 4 hours.
Bitcoin and major altcoins took a hit. Thousands of traders may have been caught on the wrong side of the move.
But there's something many traders might be overlooking…
When the market wipes out excessive leverage, what happens NEXT can be more important than the crash itself.
Is smart money preparing for a recovery… or is another shakeout coming?
I'm watching 3 signals that could reveal the market's next move. 👀
One question for traders:
Are you watching for a bounce, or preparing for another drop?
👇 Drop your view. Let's see who reads the market correctly.
#BinancePick #Bitcoin #CryptoMarket #BTC #Altcoins #Liquidation
Nearly $900 MILLION in leveraged positions wiped out in just 4 hours.
Bitcoin and major altcoins took a hit. Thousands of traders may have been caught on the wrong side of the move.
But there's something many traders might be overlooking…
When the market wipes out excessive leverage, what happens NEXT can be more important than the crash itself.
Is smart money preparing for a recovery… or is another shakeout coming?
I'm watching 3 signals that could reveal the market's next move. 👀
One question for traders:
Are you watching for a bounce, or preparing for another drop?
👇 Drop your view. Let's see who reads the market correctly.
#BinancePick #Bitcoin #CryptoMarket #BTC #Altcoins #Liquidation
56
·
--
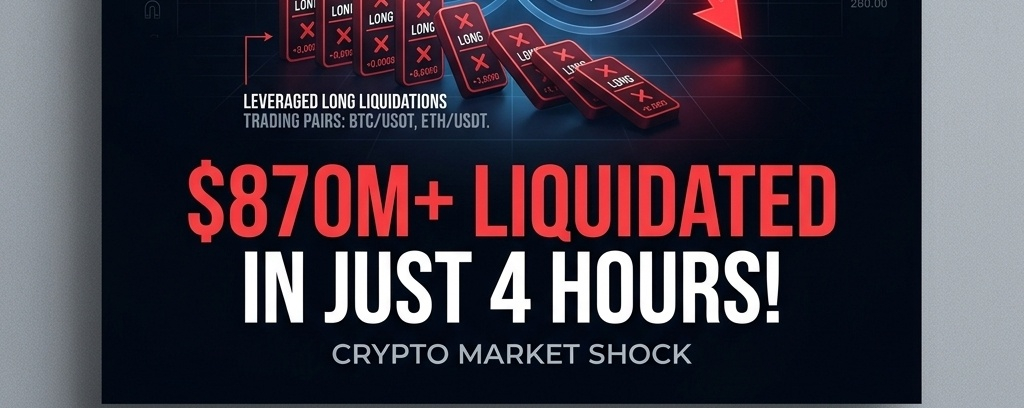
Article
$$870 MILLION LIQUIDATED IN JUST 4 HOURS! WHAT JUST HAPPENED TO CRYPTO?Crypto traders have just witnessed a brutal market shake-up.
Bitcoin, Ethereum, XRP and Solana came under heavy selling pressure, while leveraged positions worth nearly $900 million were liquidated in just four hours, according to market reports.
But here's the bigger question:
Was this simply a market correction, or did excessive leverage turn a price drop into a much bigger liquidation event?
THE NUMBERS BEHIND THE CRASH
Recent market reports highlighted:
BTC: Approximately 5.85% declineETH: Approximately 7.45% declineXRP: Approximately 4.95% declineSOL: Approximately 6.20% decline
The most striking figure was the liquidation wave:
Nearly $880M–$896M in positions liquidated within four hours, according to different reports.More than $1 billion in liquidations reported over a 24-hour period.Long positions accounted for the majority of reported liquidations.
These figures show how quickly leveraged traders can be affected when prices move sharply against their positions.
WHY DID THE SELLING BECOME SO AGGRESSIVE?
One important factor was pressure across broader financial markets, including technology stocks.
When risk appetite weakens, crypto can face additional selling pressure.
Leverage makes the situation more complicated.
When traders use borrowed exposure, even a relatively small price move can trigger forced liquidation. Those liquidations can add further selling pressure, creating a chain reaction.
WHAT SHOULD TRADERS WATCH NOW?
Rather than immediately assuming the market has reached its bottom, traders should monitor three important signals:
1. Bitcoin's recovery
Can BTC reclaim important short-term resistance levels and hold above them?
2. Liquidation pressure
Are forced liquidations slowing down, or is excessive leverage still being flushed out?
3. Volume and market participation
A recovery supported by stronger spot-market buying would be more meaningful than a temporary bounce driven mainly by short-term trading.
IS THIS A BUYING OPPORTUNITY OR A WARNING?
A major liquidation event does not automatically mean the market has bottomed.
Sometimes it clears excessive leverage before a recovery. In other situations, it is followed by another leg lower.
The next price reaction and volume confirmation will be important.
LET'S DISCUSS
What do you think happened?
A) The market is flushing out overleveraged traders before recovering.
B) This is the beginning of a deeper correction.
C) The market needs more time before showing a clear direction.
Share your view below. Let's discuss the data, not just the fear.
Disclaimer: This article is for educational purposes only. Liquidation figures and market percentages can vary by source and reporting window. This is not financial advice. Always manage risk and do your own research.
#Bitcoin #Ethereum #CryptoCrash #Liquidations #CryptoMarket #BTC #ETH #BinanceSquare #CryptoAnalysis
$$870 MILLION LIQUIDATED IN JUST 4 HOURS! WHAT JUST HAPPENED TO CRYPTO?
Crypto traders have just witnessed a brutal market shake-up.
Bitcoin, Ethereum, XRP and Solana came under heavy selling pressure, while leveraged positions worth nearly $900 million were liquidated in just four hours, according to market reports.
But here's the bigger question:
Was this simply a market correction, or did excessive leverage turn a price drop into a much bigger liquidation event?
THE NUMBERS BEHIND THE CRASH
Recent market reports highlighted:
BTC: Approximately 5.85% declineETH: Approximately 7.45% declineXRP: Approximately 4.95% declineSOL: Approximately 6.20% decline
The most striking figure was the liquidation wave:
Nearly $880M–$896M in positions liquidated within four hours, according to different reports.More than $1 billion in liquidations reported over a 24-hour period.Long positions accounted for the majority of reported liquidations.
These figures show how quickly leveraged traders can be affected when prices move sharply against their positions.
WHY DID THE SELLING BECOME SO AGGRESSIVE?
One important factor was pressure across broader financial markets, including technology stocks.
When risk appetite weakens, crypto can face additional selling pressure.
Leverage makes the situation more complicated.
When traders use borrowed exposure, even a relatively small price move can trigger forced liquidation. Those liquidations can add further selling pressure, creating a chain reaction.
WHAT SHOULD TRADERS WATCH NOW?
Rather than immediately assuming the market has reached its bottom, traders should monitor three important signals:
1. Bitcoin's recovery
Can BTC reclaim important short-term resistance levels and hold above them?
2. Liquidation pressure
Are forced liquidations slowing down, or is excessive leverage still being flushed out?
3. Volume and market participation
A recovery supported by stronger spot-market buying would be more meaningful than a temporary bounce driven mainly by short-term trading.
IS THIS A BUYING OPPORTUNITY OR A WARNING?
A major liquidation event does not automatically mean the market has bottomed.
Sometimes it clears excessive leverage before a recovery. In other situations, it is followed by another leg lower.
The next price reaction and volume confirmation will be important.
LET'S DISCUSS
What do you think happened?
A) The market is flushing out overleveraged traders before recovering.
B) This is the beginning of a deeper correction.
C) The market needs more time before showing a clear direction.
Share your view below. Let's discuss the data, not just the fear.
Disclaimer: This article is for educational purposes only. Liquidation figures and market percentages can vary by source and reporting window. This is not financial advice. Always manage risk and do your own research.
#Bitcoin #Ethereum #CryptoCrash #Liquidations #CryptoMarket #BTC #ETH #BinanceSquare #CryptoAnalysis
Bitcoin, Ethereum, XRP and Solana came under heavy selling pressure, while leveraged positions worth nearly $900 million were liquidated in just four hours, according to market reports.
But here's the bigger question:
Was this simply a market correction, or did excessive leverage turn a price drop into a much bigger liquidation event?
THE NUMBERS BEHIND THE CRASH
Recent market reports highlighted:
BTC: Approximately 5.85% declineETH: Approximately 7.45% declineXRP: Approximately 4.95% declineSOL: Approximately 6.20% decline
The most striking figure was the liquidation wave:
Nearly $880M–$896M in positions liquidated within four hours, according to different reports.More than $1 billion in liquidations reported over a 24-hour period.Long positions accounted for the majority of reported liquidations.
These figures show how quickly leveraged traders can be affected when prices move sharply against their positions.
WHY DID THE SELLING BECOME SO AGGRESSIVE?
One important factor was pressure across broader financial markets, including technology stocks.
When risk appetite weakens, crypto can face additional selling pressure.
Leverage makes the situation more complicated.
When traders use borrowed exposure, even a relatively small price move can trigger forced liquidation. Those liquidations can add further selling pressure, creating a chain reaction.
WHAT SHOULD TRADERS WATCH NOW?
Rather than immediately assuming the market has reached its bottom, traders should monitor three important signals:
1. Bitcoin's recovery
Can BTC reclaim important short-term resistance levels and hold above them?
2. Liquidation pressure
Are forced liquidations slowing down, or is excessive leverage still being flushed out?
3. Volume and market participation
A recovery supported by stronger spot-market buying would be more meaningful than a temporary bounce driven mainly by short-term trading.
IS THIS A BUYING OPPORTUNITY OR A WARNING?
A major liquidation event does not automatically mean the market has bottomed.
Sometimes it clears excessive leverage before a recovery. In other situations, it is followed by another leg lower.
The next price reaction and volume confirmation will be important.
LET'S DISCUSS
What do you think happened?
A) The market is flushing out overleveraged traders before recovering.
B) This is the beginning of a deeper correction.
C) The market needs more time before showing a clear direction.
Share your view below. Let's discuss the data, not just the fear.
Disclaimer: This article is for educational purposes only. Liquidation figures and market percentages can vary by source and reporting window. This is not financial advice. Always manage risk and do your own research.
#Bitcoin #Ethereum #CryptoCrash #Liquidations #CryptoMarket #BTC #ETH #BinanceSquare #CryptoAnalysis
187
·
--
Article
ON Rallies 12%: Is Orochi Network Preparing for Another Breakout?Orochi Network (ON) is attracting attention after a strong 24-hour move. But is this the beginning of another upward leg, or could the rally face resistance?
At the time of the supplied Binance Futures screenshots, ON was trading around $0.1701, up approximately 12.35% over 24 hours.
Its reported 24-hour range was $0.1500–$0.2028, with trading volume near $79.67 million USDT.
Let's examine all four timeframes.
1. 15-Minute Chart: Momentum Needs Confirmation
MA(7): $0.1685MA(25): $0.1718MA(99): $0.1671
Price is above MA(7) and MA(99), but remains below MA(25). This shows short-term hesitation after the recent move.
2. 1-Hour Chart: Buyers Have the Advantage
MA(7): $0.1695MA(25): $0.1680MA(99): $0.1658
All three moving averages are below the current price. The short-term structure remains constructive, although a sustained move above nearby resistance is still needed.
3. 4-Hour Chart: Recovery Structure Looks Stronger
MA(7): $0.16816MA(25): $0.16517MA(99): $0.15501
The price is above all three moving averages, supporting the recovery trend on this timeframe.
4. Daily Chart: The Bigger Challenge
MA(7): $0.17640MA(25): $0.14643MA(99): $0.19671
The current price is below both MA(7) and MA(99), but above MA(25).
This is an important distinction: the daily chart does not yet confirm a full bullish reversal. The $0.1764 and $0.1967 areas could become significant tests for buyers.
Key Levels to Watch
Resistance:
$0.1764–$0.1804$0.1930–$0.1967$0.2028
Support:
$0.1680$0.1650$0.1550
Two Possible Scenarios
Bullish scenario: A strong move above $0.1804, supported by increasing volume, could open the way toward $0.1930–$0.1967. A break above that zone would make the $0.2028 high an important level to watch.
Bearish scenario: Failure to hold $0.1650 could weaken the recovery and bring $0.1550 back into focus.
What Should Traders Watch Now?
ON has encouraging 1H and 4H structures, but the daily chart still shows overhead resistance. Volume confirmation will matter more than the percentage gain alone.
Can ON reclaim $0.1804 and challenge the daily MA(99), or will sellers stop the rally?
What is your view?
Disclaimer: This analysis is educational and based on the supplied Binance Futures chart snapshots. It is not financial advice. Always manage risk and do your own research.
#ON #OrochiNetwork #Binance #BinanceFutures #CryptoAnalysis #TechnicalAnalysis #BinancePick
ON Rallies 12%: Is Orochi Network Preparing for Another Breakout?
Orochi Network (ON) is attracting attention after a strong 24-hour move. But is this the beginning of another upward leg, or could the rally face resistance?
At the time of the supplied Binance Futures screenshots, ON was trading around $0.1701, up approximately 12.35% over 24 hours.
Its reported 24-hour range was $0.1500–$0.2028, with trading volume near $79.67 million USDT.
Let's examine all four timeframes.
1. 15-Minute Chart: Momentum Needs Confirmation
MA(7): $0.1685MA(25): $0.1718MA(99): $0.1671
Price is above MA(7) and MA(99), but remains below MA(25). This shows short-term hesitation after the recent move.
2. 1-Hour Chart: Buyers Have the Advantage
MA(7): $0.1695MA(25): $0.1680MA(99): $0.1658
All three moving averages are below the current price. The short-term structure remains constructive, although a sustained move above nearby resistance is still needed.
3. 4-Hour Chart: Recovery Structure Looks Stronger
MA(7): $0.16816MA(25): $0.16517MA(99): $0.15501
The price is above all three moving averages, supporting the recovery trend on this timeframe.
4. Daily Chart: The Bigger Challenge
MA(7): $0.17640MA(25): $0.14643MA(99): $0.19671
The current price is below both MA(7) and MA(99), but above MA(25).
This is an important distinction: the daily chart does not yet confirm a full bullish reversal. The $0.1764 and $0.1967 areas could become significant tests for buyers.
Key Levels to Watch
Resistance:
$0.1764–$0.1804$0.1930–$0.1967$0.2028
Support:
$0.1680$0.1650$0.1550
Two Possible Scenarios
Bullish scenario: A strong move above $0.1804, supported by increasing volume, could open the way toward $0.1930–$0.1967. A break above that zone would make the $0.2028 high an important level to watch.
Bearish scenario: Failure to hold $0.1650 could weaken the recovery and bring $0.1550 back into focus.
What Should Traders Watch Now?
ON has encouraging 1H and 4H structures, but the daily chart still shows overhead resistance. Volume confirmation will matter more than the percentage gain alone.
Can ON reclaim $0.1804 and challenge the daily MA(99), or will sellers stop the rally?
What is your view?
Disclaimer: This analysis is educational and based on the supplied Binance Futures chart snapshots. It is not financial advice. Always manage risk and do your own research.
#ON #OrochiNetwork #Binance #BinanceFutures #CryptoAnalysis #TechnicalAnalysis #BinancePick
At the time of the supplied Binance Futures screenshots, ON was trading around $0.1701, up approximately 12.35% over 24 hours.
Its reported 24-hour range was $0.1500–$0.2028, with trading volume near $79.67 million USDT.
Let's examine all four timeframes.
1. 15-Minute Chart: Momentum Needs Confirmation
MA(7): $0.1685MA(25): $0.1718MA(99): $0.1671
Price is above MA(7) and MA(99), but remains below MA(25). This shows short-term hesitation after the recent move.
2. 1-Hour Chart: Buyers Have the Advantage
MA(7): $0.1695MA(25): $0.1680MA(99): $0.1658
All three moving averages are below the current price. The short-term structure remains constructive, although a sustained move above nearby resistance is still needed.
3. 4-Hour Chart: Recovery Structure Looks Stronger
MA(7): $0.16816MA(25): $0.16517MA(99): $0.15501
The price is above all three moving averages, supporting the recovery trend on this timeframe.
4. Daily Chart: The Bigger Challenge
MA(7): $0.17640MA(25): $0.14643MA(99): $0.19671
The current price is below both MA(7) and MA(99), but above MA(25).
This is an important distinction: the daily chart does not yet confirm a full bullish reversal. The $0.1764 and $0.1967 areas could become significant tests for buyers.
Key Levels to Watch
Resistance:
$0.1764–$0.1804$0.1930–$0.1967$0.2028
Support:
$0.1680$0.1650$0.1550
Two Possible Scenarios
Bullish scenario: A strong move above $0.1804, supported by increasing volume, could open the way toward $0.1930–$0.1967. A break above that zone would make the $0.2028 high an important level to watch.
Bearish scenario: Failure to hold $0.1650 could weaken the recovery and bring $0.1550 back into focus.
What Should Traders Watch Now?
ON has encouraging 1H and 4H structures, but the daily chart still shows overhead resistance. Volume confirmation will matter more than the percentage gain alone.
Can ON reclaim $0.1804 and challenge the daily MA(99), or will sellers stop the rally?
What is your view?
Disclaimer: This analysis is educational and based on the supplied Binance Futures chart snapshots. It is not financial advice. Always manage risk and do your own research.
#ON #OrochiNetwork #Binance #BinanceFutures #CryptoAnalysis #TechnicalAnalysis #BinancePick
224
·
--
Article
LIT Is Approaching $3.53: Breakout Ahead or Another Rejection?Lighter (LIT) is showing positive momentum, but the next resistance zone could decide whether this move has enough strength to continue.
At the time of the supplied Binance Futures screenshots, LIT was trading around $3.47, up approximately 3.2% over 24 hours. Its 24-hour range was $3.2231–$3.5287, with trading volume of approximately $103.85 million in USDT.
But what are the charts really telling us?
1. 15-Minute Chart: Short-Term Momentum
MA(7): $3.4706MA(25): $3.4004MA(99): $3.4063
Price is slightly below MA(7), while remaining above MA(25) and MA(99). This suggests that the immediate momentum is still positive, but the short-term move is showing some hesitation.
2. 1-Hour Chart: Buyers Have an Advantage
MA(7): $3.3995MA(25): $3.4077MA(99): $3.2719
LIT is trading above all three moving averages. The price structure remains constructive, although MA(7) is still slightly below MA(25).
3. 4-Hour Chart: Recovery Structure
MA(7): $3.4185MA(25): $3.2809MA(99): $3.1860
Price is above all three moving averages, with a positive MA arrangement. This supports the recovery structure, but resistance overhead still needs to be cleared.
4. Daily Chart: A Major Test
MA(7): $3.1873MA(25): $3.1752MA(99): $3.4730
The price is sitting almost exactly at the daily MA(99). This is an important test. A sustained move above this level could improve the broader outlook, while rejection may bring renewed selling pressure.
Key Levels to Watch
Resistance:
$3.5287 — recent 24-hour high$3.5714–$3.5889 — next resistance zone$3.6160 — higher upside level to monitor
Support:
$3.40–$3.42 — nearby support area$3.32 — next support$3.2231 — recent 24-hour low
What Could Happen Next?
Bullish scenario: If LIT breaks above $3.5287 and holds that level with stronger volume, the $3.57–$3.59 zone could become the next area to watch.
Bearish scenario: If price fails to hold above $3.40–$3.42, a pullback toward $3.32 or even $3.2231 cannot be ruled out.
One important detail: volume on the shorter timeframes was below the displayed volume averages. That means a breakout still needs stronger participation for confirmation.
The Real Question
LIT has a constructive 1H and 4H structure, but the daily MA(99) and the $3.53 resistance are serious tests.
Will buyers push LIT above $3.53, or will sellers defend this zone again?
Share your chart view in the comments.
Disclaimer: This article is for educational and informational purposes only, based on the supplied chart snapshots. It is not financial advice. Always manage risk and do your own research.
#LIT #Lighter #Binance #BinanceFutures #CryptoAnalysis #TechnicalAnalysis #BinancePick
LIT Is Approaching $3.53: Breakout Ahead or Another Rejection?
Lighter (LIT) is showing positive momentum, but the next resistance zone could decide whether this move has enough strength to continue.
At the time of the supplied Binance Futures screenshots, LIT was trading around $3.47, up approximately 3.2% over 24 hours. Its 24-hour range was $3.2231–$3.5287, with trading volume of approximately $103.85 million in USDT.
But what are the charts really telling us?
1. 15-Minute Chart: Short-Term Momentum
MA(7): $3.4706MA(25): $3.4004MA(99): $3.4063
Price is slightly below MA(7), while remaining above MA(25) and MA(99). This suggests that the immediate momentum is still positive, but the short-term move is showing some hesitation.
2. 1-Hour Chart: Buyers Have an Advantage
MA(7): $3.3995MA(25): $3.4077MA(99): $3.2719
LIT is trading above all three moving averages. The price structure remains constructive, although MA(7) is still slightly below MA(25).
3. 4-Hour Chart: Recovery Structure
MA(7): $3.4185MA(25): $3.2809MA(99): $3.1860
Price is above all three moving averages, with a positive MA arrangement. This supports the recovery structure, but resistance overhead still needs to be cleared.
4. Daily Chart: A Major Test
MA(7): $3.1873MA(25): $3.1752MA(99): $3.4730
The price is sitting almost exactly at the daily MA(99). This is an important test. A sustained move above this level could improve the broader outlook, while rejection may bring renewed selling pressure.
Key Levels to Watch
Resistance:
$3.5287 — recent 24-hour high$3.5714–$3.5889 — next resistance zone$3.6160 — higher upside level to monitor
Support:
$3.40–$3.42 — nearby support area$3.32 — next support$3.2231 — recent 24-hour low
What Could Happen Next?
Bullish scenario: If LIT breaks above $3.5287 and holds that level with stronger volume, the $3.57–$3.59 zone could become the next area to watch.
Bearish scenario: If price fails to hold above $3.40–$3.42, a pullback toward $3.32 or even $3.2231 cannot be ruled out.
One important detail: volume on the shorter timeframes was below the displayed volume averages. That means a breakout still needs stronger participation for confirmation.
The Real Question
LIT has a constructive 1H and 4H structure, but the daily MA(99) and the $3.53 resistance are serious tests.
Will buyers push LIT above $3.53, or will sellers defend this zone again?
Share your chart view in the comments.
Disclaimer: This article is for educational and informational purposes only, based on the supplied chart snapshots. It is not financial advice. Always manage risk and do your own research.
#LIT #Lighter #Binance #BinanceFutures #CryptoAnalysis #TechnicalAnalysis #BinancePick
At the time of the supplied Binance Futures screenshots, LIT was trading around $3.47, up approximately 3.2% over 24 hours. Its 24-hour range was $3.2231–$3.5287, with trading volume of approximately $103.85 million in USDT.
But what are the charts really telling us?
1. 15-Minute Chart: Short-Term Momentum
MA(7): $3.4706MA(25): $3.4004MA(99): $3.4063
Price is slightly below MA(7), while remaining above MA(25) and MA(99). This suggests that the immediate momentum is still positive, but the short-term move is showing some hesitation.
2. 1-Hour Chart: Buyers Have an Advantage
MA(7): $3.3995MA(25): $3.4077MA(99): $3.2719
LIT is trading above all three moving averages. The price structure remains constructive, although MA(7) is still slightly below MA(25).
3. 4-Hour Chart: Recovery Structure
MA(7): $3.4185MA(25): $3.2809MA(99): $3.1860
Price is above all three moving averages, with a positive MA arrangement. This supports the recovery structure, but resistance overhead still needs to be cleared.
4. Daily Chart: A Major Test
MA(7): $3.1873MA(25): $3.1752MA(99): $3.4730
The price is sitting almost exactly at the daily MA(99). This is an important test. A sustained move above this level could improve the broader outlook, while rejection may bring renewed selling pressure.
Key Levels to Watch
Resistance:
$3.5287 — recent 24-hour high$3.5714–$3.5889 — next resistance zone$3.6160 — higher upside level to monitor
Support:
$3.40–$3.42 — nearby support area$3.32 — next support$3.2231 — recent 24-hour low
What Could Happen Next?
Bullish scenario: If LIT breaks above $3.5287 and holds that level with stronger volume, the $3.57–$3.59 zone could become the next area to watch.
Bearish scenario: If price fails to hold above $3.40–$3.42, a pullback toward $3.32 or even $3.2231 cannot be ruled out.
One important detail: volume on the shorter timeframes was below the displayed volume averages. That means a breakout still needs stronger participation for confirmation.
The Real Question
LIT has a constructive 1H and 4H structure, but the daily MA(99) and the $3.53 resistance are serious tests.
Will buyers push LIT above $3.53, or will sellers defend this zone again?
Share your chart view in the comments.
Disclaimer: This article is for educational and informational purposes only, based on the supplied chart snapshots. It is not financial advice. Always manage risk and do your own research.
#LIT #Lighter #Binance #BinanceFutures #CryptoAnalysis #TechnicalAnalysis #BinancePick
200
·
--
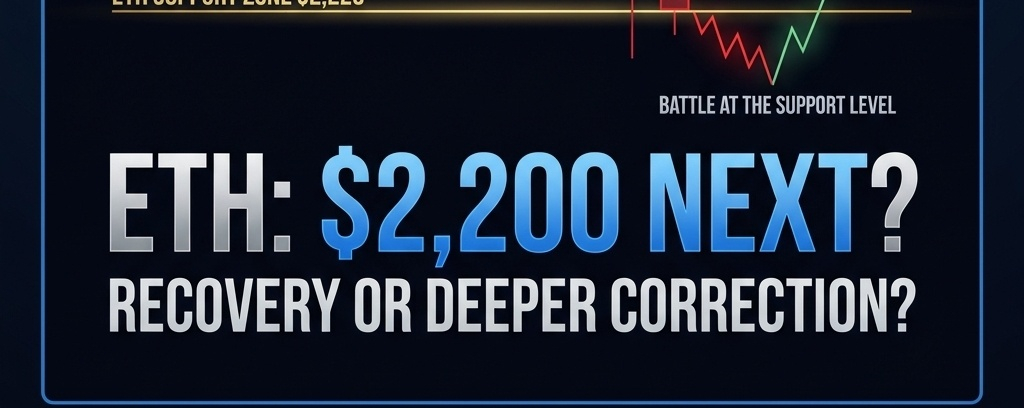
Article
ETH Drops Below $2,250: Is Ethereum Heading for Another Major Test?Ethereum is facing renewed selling pressure.
At the time of the provided Binance chart screenshots, ETH was trading near $2,247.50, down approximately 6.75% in 24 hours.
The bigger concern is that weakness is visible across all four major timeframes: 15-minute, 1-hour, 4-hour and daily.
But does this correction create another opportunity for buyers, or should traders prepare for further downside?
1. 15-Minute Chart: Short-Term Buyers Under Pressure
Moving averages:
MA7: $2,255.80MA25: $2,278.48MA99: $2,384.66
ETH is trading below all three moving averages. Even a short-term recovery needs to reclaim the $2,255–$2,278 area before momentum can improve.
2. 1-Hour Chart: Bearish Structure Continues
Moving averages:
MA7: $2,268.58MA25: $2,377.45MA99: $2,312.30
The price remains below all three averages, suggesting sellers still have the advantage.
A recovery above $2,268 would be an early sign of stabilization, while $2,312–$2,377 remains a more important resistance region.
3. 4-Hour Chart: A Critical Technical Test
Moving averages:
MA7: $2,349.77MA25: $2,309.56MA99: $2,335.39
ETH is significantly below all three moving averages.
This is an important warning because the 4-hour structure has weakened. Buyers need to reclaim the $2,310–$2,350 region to improve the outlook.
4. Daily Chart: The Bigger Trend Needs Repair
Moving averages:
MA7: $2,282.34MA25: $2,364.24MA99: $2,366.20
The daily chart also shows ETH below all three moving averages.
This suggests that the current weakness is not limited to a few short-term candles. A stronger recovery will require buyers to reclaim important daily resistance levels.
Key ETH Levels to Watch
Support zones:
$2,236–$2,226$2,174$2,144
Resistance zones:
$2,255–$2,278$2,309–$2,366$2,384
A sustained break below $2,226 could expose the lower support levels.
On the other hand, reclaiming $2,278 and then $2,310 with stronger buying volume could indicate an improving recovery attempt.
What Should ETH Traders Watch Now?
The four-timeframe picture currently favors caution.
A falling price does not automatically mean it is time to buy, and a recovery candle does not automatically confirm a reversal.
The next important development is whether buyers can defend the $2,226 area and reclaim short-term moving averages.
Community question:
Is ETH preparing for a recovery, or could $2,200 become the next major test?
Are you watching for a bounce or waiting for stronger confirmation?
Share your analysis below.
Disclaimer: This article is based on the Binance chart screenshots provided, not live market data. It is for educational purposes only and is not financial advice. Cryptocurrency trading involves significant risk.
#Ethereum #ETH #BinancePick #CryptoAnalysis #Bitcoin #Altcoins #TrendingTopic #farcamcrypto #TechnicalAnalysiss
ETH Drops Below $2,250: Is Ethereum Heading for Another Major Test?
Ethereum is facing renewed selling pressure.
At the time of the provided Binance chart screenshots, ETH was trading near $2,247.50, down approximately 6.75% in 24 hours.
The bigger concern is that weakness is visible across all four major timeframes: 15-minute, 1-hour, 4-hour and daily.
But does this correction create another opportunity for buyers, or should traders prepare for further downside?
1. 15-Minute Chart: Short-Term Buyers Under Pressure
Moving averages:
MA7: $2,255.80MA25: $2,278.48MA99: $2,384.66
ETH is trading below all three moving averages. Even a short-term recovery needs to reclaim the $2,255–$2,278 area before momentum can improve.
2. 1-Hour Chart: Bearish Structure Continues
Moving averages:
MA7: $2,268.58MA25: $2,377.45MA99: $2,312.30
The price remains below all three averages, suggesting sellers still have the advantage.
A recovery above $2,268 would be an early sign of stabilization, while $2,312–$2,377 remains a more important resistance region.
3. 4-Hour Chart: A Critical Technical Test
Moving averages:
MA7: $2,349.77MA25: $2,309.56MA99: $2,335.39
ETH is significantly below all three moving averages.
This is an important warning because the 4-hour structure has weakened. Buyers need to reclaim the $2,310–$2,350 region to improve the outlook.
4. Daily Chart: The Bigger Trend Needs Repair
Moving averages:
MA7: $2,282.34MA25: $2,364.24MA99: $2,366.20
The daily chart also shows ETH below all three moving averages.
This suggests that the current weakness is not limited to a few short-term candles. A stronger recovery will require buyers to reclaim important daily resistance levels.
Key ETH Levels to Watch
Support zones:
$2,236–$2,226$2,174$2,144
Resistance zones:
$2,255–$2,278$2,309–$2,366$2,384
A sustained break below $2,226 could expose the lower support levels.
On the other hand, reclaiming $2,278 and then $2,310 with stronger buying volume could indicate an improving recovery attempt.
What Should ETH Traders Watch Now?
The four-timeframe picture currently favors caution.
A falling price does not automatically mean it is time to buy, and a recovery candle does not automatically confirm a reversal.
The next important development is whether buyers can defend the $2,226 area and reclaim short-term moving averages.
Community question:
Is ETH preparing for a recovery, or could $2,200 become the next major test?
Are you watching for a bounce or waiting for stronger confirmation?
Share your analysis below.
Disclaimer: This article is based on the Binance chart screenshots provided, not live market data. It is for educational purposes only and is not financial advice. Cryptocurrency trading involves significant risk.
#Ethereum #ETH #BinancePick #CryptoAnalysis #Bitcoin #Altcoins #TrendingTopic #farcamcrypto #TechnicalAnalysiss
At the time of the provided Binance chart screenshots, ETH was trading near $2,247.50, down approximately 6.75% in 24 hours.
The bigger concern is that weakness is visible across all four major timeframes: 15-minute, 1-hour, 4-hour and daily.
But does this correction create another opportunity for buyers, or should traders prepare for further downside?
1. 15-Minute Chart: Short-Term Buyers Under Pressure
Moving averages:
MA7: $2,255.80MA25: $2,278.48MA99: $2,384.66
ETH is trading below all three moving averages. Even a short-term recovery needs to reclaim the $2,255–$2,278 area before momentum can improve.
2. 1-Hour Chart: Bearish Structure Continues
Moving averages:
MA7: $2,268.58MA25: $2,377.45MA99: $2,312.30
The price remains below all three averages, suggesting sellers still have the advantage.
A recovery above $2,268 would be an early sign of stabilization, while $2,312–$2,377 remains a more important resistance region.
3. 4-Hour Chart: A Critical Technical Test
Moving averages:
MA7: $2,349.77MA25: $2,309.56MA99: $2,335.39
ETH is significantly below all three moving averages.
This is an important warning because the 4-hour structure has weakened. Buyers need to reclaim the $2,310–$2,350 region to improve the outlook.
4. Daily Chart: The Bigger Trend Needs Repair
Moving averages:
MA7: $2,282.34MA25: $2,364.24MA99: $2,366.20
The daily chart also shows ETH below all three moving averages.
This suggests that the current weakness is not limited to a few short-term candles. A stronger recovery will require buyers to reclaim important daily resistance levels.
Key ETH Levels to Watch
Support zones:
$2,236–$2,226$2,174$2,144
Resistance zones:
$2,255–$2,278$2,309–$2,366$2,384
A sustained break below $2,226 could expose the lower support levels.
On the other hand, reclaiming $2,278 and then $2,310 with stronger buying volume could indicate an improving recovery attempt.
What Should ETH Traders Watch Now?
The four-timeframe picture currently favors caution.
A falling price does not automatically mean it is time to buy, and a recovery candle does not automatically confirm a reversal.
The next important development is whether buyers can defend the $2,226 area and reclaim short-term moving averages.
Community question:
Is ETH preparing for a recovery, or could $2,200 become the next major test?
Are you watching for a bounce or waiting for stronger confirmation?
Share your analysis below.
Disclaimer: This article is based on the Binance chart screenshots provided, not live market data. It is for educational purposes only and is not financial advice. Cryptocurrency trading involves significant risk.
#Ethereum #ETH #BinancePick #CryptoAnalysis #Bitcoin #Altcoins #TrendingTopic #farcamcrypto #TechnicalAnalysiss
63
·
--
#BinancePick
🚨 THE BIGGEST TRADING MISTAKE? ENTERING TOO EARLY!
The market doesn't reward impatience. It rewards those who know when to wait.
A coin pumps 15% — everyone starts chasing it.
A coin drops 10% — everyone starts panicking.
But smart traders ask three questions first:
📊 Is the volume supporting the move?
📈 Is the trend actually confirmed?
🎯 Where is the invalidation level?
Sometimes the best trade is not entering at all.
Here's my question for Binance traders:
What's more important in today's market?
1️⃣ Catching a breakout early
2️⃣ Waiting for confirmation
3️⃣ Protecting capital and avoiding bad entries
Drop your answer below. Let's see how the community thinks!
#BinancePick #CryptoTrading #Bitcoin #Altcoins #TradingStrategy #MarketAnalysis
#BinancePick
🚨 THE BIGGEST TRADING MISTAKE? ENTERING TOO EARLY!
The market doesn't reward impatience. It rewards those who know when to wait.
A coin pumps 15% — everyone starts chasing it.
A coin drops 10% — everyone starts panicking.
But smart traders ask three questions first:
📊 Is the volume supporting the move?
📈 Is the trend actually confirmed?
🎯 Where is the invalidation level?
Sometimes the best trade is not entering at all.
Here's my question for Binance traders:
What's more important in today's market?
1️⃣ Catching a breakout early
2️⃣ Waiting for confirmation
3️⃣ Protecting capital and avoiding bad entries
Drop your answer below. Let's see how the community thinks!
#BinancePick #CryptoTrading #Bitcoin #Altcoins #TradingStrategy #MarketAnalysis
🚨 THE BIGGEST TRADING MISTAKE? ENTERING TOO EARLY!
The market doesn't reward impatience. It rewards those who know when to wait.
A coin pumps 15% — everyone starts chasing it.
A coin drops 10% — everyone starts panicking.
But smart traders ask three questions first:
📊 Is the volume supporting the move?
📈 Is the trend actually confirmed?
🎯 Where is the invalidation level?
Sometimes the best trade is not entering at all.
Here's my question for Binance traders:
What's more important in today's market?
1️⃣ Catching a breakout early
2️⃣ Waiting for confirmation
3️⃣ Protecting capital and avoiding bad entries
Drop your answer below. Let's see how the community thinks!
#BinancePick #CryptoTrading #Bitcoin #Altcoins #TradingStrategy #MarketAnalysis


112
·
--
Article
ICNT Down 10%: Is the Rally Losing Strength or Preparing for Another Move?Impossible Cloud Network (ICNT) is attracting attention after a powerful price rally, but the latest correction has raised an important question: are buyers taking a break, or are sellers gaining control?
At the time of the provided screenshots, ICNT was trading around $0.2064, down approximately 10.07% over 24 hours, after reaching a high of $0.2532.
Let's examine all four timeframes.
15-Minute Chart: Buyers Attempt to Stabilize
Moving averages:
MA7: $0.2058MA25: $0.2063MA99: $0.2201
The price is hovering around MA7 and MA25 but remains below MA99. This indicates a possible short-term stabilization attempt, although a stronger recovery signal is still missing.
1-Hour Chart: Recovery Faces Resistance
Moving averages:
MA7: $0.2058MA25: $0.2196MA99: $0.1908
ICNT is trading below MA25, showing that the short-term trend remains under pressure.
The $0.2196 area is an important level to reclaim. Until then, any upward move could face selling pressure.
4-Hour Chart: The Correction Needs Attention
Moving averages:
MA7: $0.2177MA25: $0.1924MA99: $0.1882
The current price is below MA7 but above MA25 and MA99.
This suggests that the broader 4-hour structure has not completely broken down, although momentum has weakened significantly following the recent rally.
Daily Chart: The Bigger Picture
The daily moving averages show:
MA7: $0.2177MA25: $0.1924MA99: $0.1882
ICNT remains above its longer daily moving averages, which keeps the broader structure relatively constructive.
However, a recovery above the short-term moving average is needed before stronger bullish momentum can be considered.
Volume: An Important Warning
The screenshots show substantial trading activity, with approximately 422.45 million ICNT and $95.57 million in USDT traded over 24 hours.
The displayed volume averages also show that recent volume has been fluctuating significantly. A convincing recovery should ideally come with increasing buying volume, not just a price bounce.
Key Levels to Watch
Resistance
$0.2120$0.2177–$0.2201$0.2380$0.2532
Support
$0.2000$0.1964$0.1908–$0.1882
A sustained move above $0.2200 with stronger volume could improve the bullish outlook.
On the downside, losing $0.1964 could expose the $0.1908–$0.1882 support area.
The Question Every ICNT Trader Should Be Asking
After reaching $0.2532, ICNT has pulled back sharply.
Is this correction creating another opportunity for buyers, or is the market warning traders to be more cautious?
Would you wait for a confirmed recovery above $0.22, or watch the $0.1964 support first?
Share your thoughts.
Disclaimer: This analysis is based on the supplied Binance chart screenshots and is for educational purposes only. It is not financial advice. Cryptocurrency trading involves significant risk.
#ICNT #ImpossibleCloudNetwork #BinancePick #CryptoAnalysis #TechnicalAnalysis #altcoins #farcamcrypto
ICNT Down 10%: Is the Rally Losing Strength or Preparing for Another Move?
Impossible Cloud Network (ICNT) is attracting attention after a powerful price rally, but the latest correction has raised an important question: are buyers taking a break, or are sellers gaining control?
At the time of the provided screenshots, ICNT was trading around $0.2064, down approximately 10.07% over 24 hours, after reaching a high of $0.2532.
Let's examine all four timeframes.
15-Minute Chart: Buyers Attempt to Stabilize
Moving averages:
MA7: $0.2058MA25: $0.2063MA99: $0.2201
The price is hovering around MA7 and MA25 but remains below MA99. This indicates a possible short-term stabilization attempt, although a stronger recovery signal is still missing.
1-Hour Chart: Recovery Faces Resistance
Moving averages:
MA7: $0.2058MA25: $0.2196MA99: $0.1908
ICNT is trading below MA25, showing that the short-term trend remains under pressure.
The $0.2196 area is an important level to reclaim. Until then, any upward move could face selling pressure.
4-Hour Chart: The Correction Needs Attention
Moving averages:
MA7: $0.2177MA25: $0.1924MA99: $0.1882
The current price is below MA7 but above MA25 and MA99.
This suggests that the broader 4-hour structure has not completely broken down, although momentum has weakened significantly following the recent rally.
Daily Chart: The Bigger Picture
The daily moving averages show:
MA7: $0.2177MA25: $0.1924MA99: $0.1882
ICNT remains above its longer daily moving averages, which keeps the broader structure relatively constructive.
However, a recovery above the short-term moving average is needed before stronger bullish momentum can be considered.
Volume: An Important Warning
The screenshots show substantial trading activity, with approximately 422.45 million ICNT and $95.57 million in USDT traded over 24 hours.
The displayed volume averages also show that recent volume has been fluctuating significantly. A convincing recovery should ideally come with increasing buying volume, not just a price bounce.
Key Levels to Watch
Resistance
$0.2120$0.2177–$0.2201$0.2380$0.2532
Support
$0.2000$0.1964$0.1908–$0.1882
A sustained move above $0.2200 with stronger volume could improve the bullish outlook.
On the downside, losing $0.1964 could expose the $0.1908–$0.1882 support area.
The Question Every ICNT Trader Should Be Asking
After reaching $0.2532, ICNT has pulled back sharply.
Is this correction creating another opportunity for buyers, or is the market warning traders to be more cautious?
Would you wait for a confirmed recovery above $0.22, or watch the $0.1964 support first?
Share your thoughts.
Disclaimer: This analysis is based on the supplied Binance chart screenshots and is for educational purposes only. It is not financial advice. Cryptocurrency trading involves significant risk.
#ICNT #ImpossibleCloudNetwork #BinancePick #CryptoAnalysis #TechnicalAnalysis #altcoins #farcamcrypto
At the time of the provided screenshots, ICNT was trading around $0.2064, down approximately 10.07% over 24 hours, after reaching a high of $0.2532.
Let's examine all four timeframes.
15-Minute Chart: Buyers Attempt to Stabilize
Moving averages:
MA7: $0.2058MA25: $0.2063MA99: $0.2201
The price is hovering around MA7 and MA25 but remains below MA99. This indicates a possible short-term stabilization attempt, although a stronger recovery signal is still missing.
1-Hour Chart: Recovery Faces Resistance
Moving averages:
MA7: $0.2058MA25: $0.2196MA99: $0.1908
ICNT is trading below MA25, showing that the short-term trend remains under pressure.
The $0.2196 area is an important level to reclaim. Until then, any upward move could face selling pressure.
4-Hour Chart: The Correction Needs Attention
Moving averages:
MA7: $0.2177MA25: $0.1924MA99: $0.1882
The current price is below MA7 but above MA25 and MA99.
This suggests that the broader 4-hour structure has not completely broken down, although momentum has weakened significantly following the recent rally.
Daily Chart: The Bigger Picture
The daily moving averages show:
MA7: $0.2177MA25: $0.1924MA99: $0.1882
ICNT remains above its longer daily moving averages, which keeps the broader structure relatively constructive.
However, a recovery above the short-term moving average is needed before stronger bullish momentum can be considered.
Volume: An Important Warning
The screenshots show substantial trading activity, with approximately 422.45 million ICNT and $95.57 million in USDT traded over 24 hours.
The displayed volume averages also show that recent volume has been fluctuating significantly. A convincing recovery should ideally come with increasing buying volume, not just a price bounce.
Key Levels to Watch
Resistance
$0.2120$0.2177–$0.2201$0.2380$0.2532
Support
$0.2000$0.1964$0.1908–$0.1882
A sustained move above $0.2200 with stronger volume could improve the bullish outlook.
On the downside, losing $0.1964 could expose the $0.1908–$0.1882 support area.
The Question Every ICNT Trader Should Be Asking
After reaching $0.2532, ICNT has pulled back sharply.
Is this correction creating another opportunity for buyers, or is the market warning traders to be more cautious?
Would you wait for a confirmed recovery above $0.22, or watch the $0.1964 support first?
Share your thoughts.
Disclaimer: This analysis is based on the supplied Binance chart screenshots and is for educational purposes only. It is not financial advice. Cryptocurrency trading involves significant risk.
#ICNT #ImpossibleCloudNetwork #BinancePick #CryptoAnalysis #TechnicalAnalysis #altcoins #farcamcrypto
277
Log in to explore more content
Join global crypto users on Binance Square
⚡️ Get latest and useful information about crypto.
💬 Trusted by the world’s largest crypto exchange.
👍 Discover real insights from verified creators.
Email / Phone number