
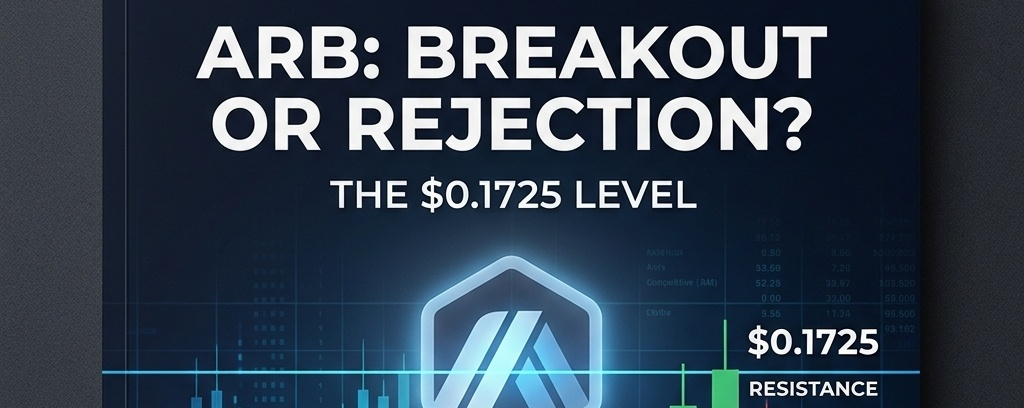

Arbitrum (ARB) is showing short-term strength, but one important resistance level could decide its next move.
At the time of the chart screenshots, ARB was trading around $0.1696, up approximately 2.11% over 24 hours. Price was holding above several key moving averages on the 1H and 4H charts, suggesting that buyers currently have some short-term control.
But the bigger picture is not completely bullish yet.
🔍 What the 4 Timeframes Reveal
15-Minute Chart:
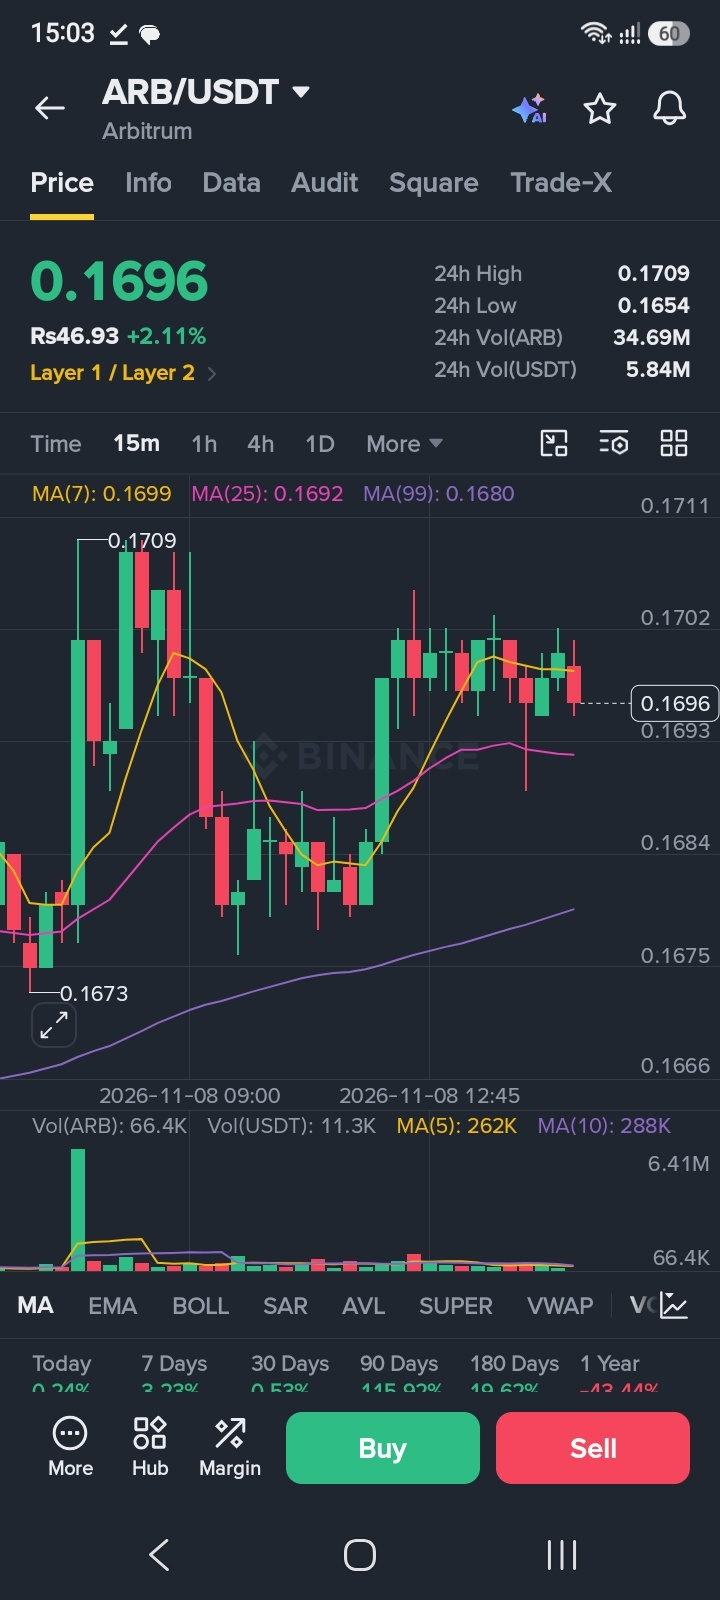
ARB is trading slightly below MA(7) at $0.1699, while remaining above MA(25) at $0.1692 and MA(99) at $0.1680. This suggests a small pause after the recent move upward.
1-Hour Chart:
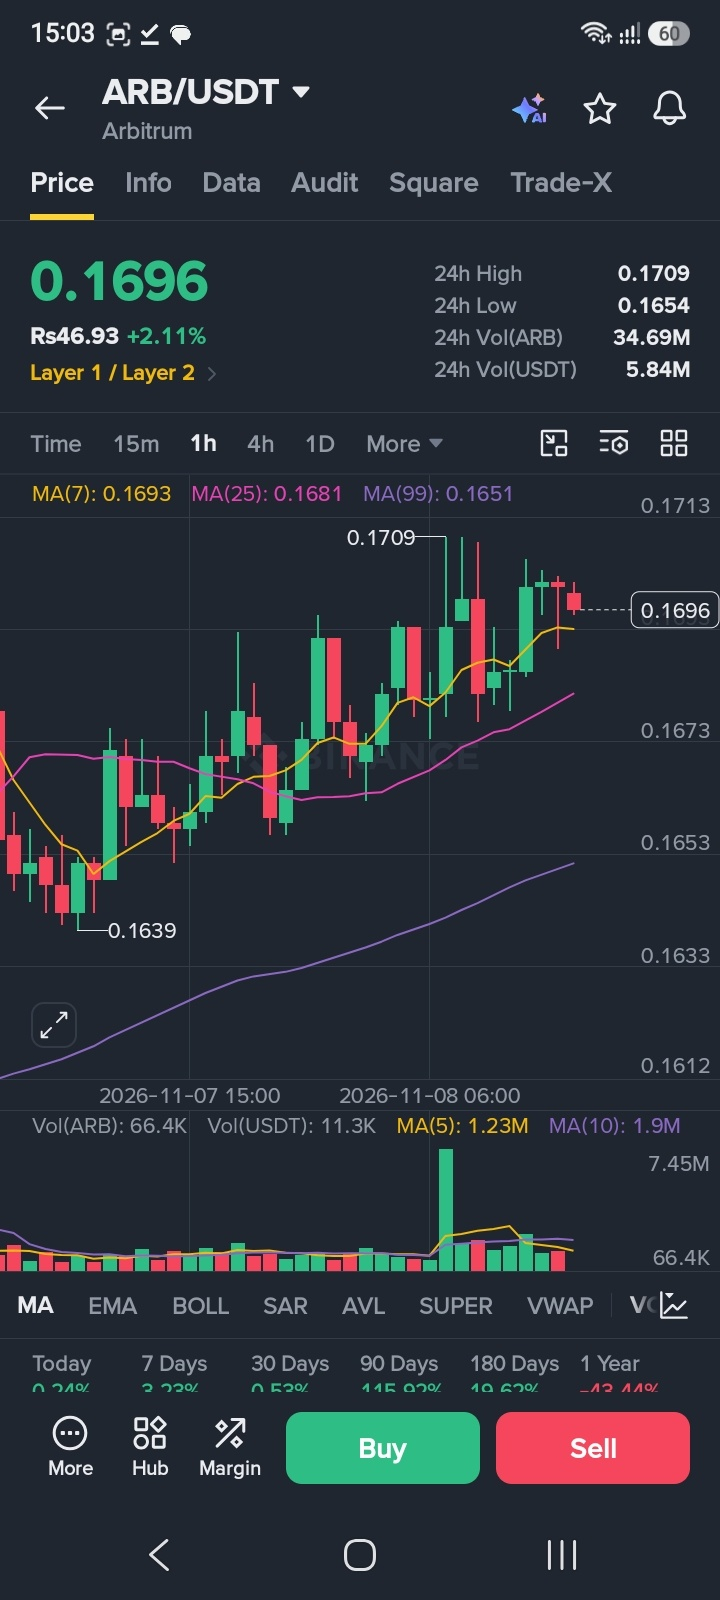
Price is above all three moving averages:
MA(7): $0.1693
MA(25): $0.1681
MA(99): $0.1651
This is a positive short-term structure, although continued buying pressure is needed.
4-Hour Chart:
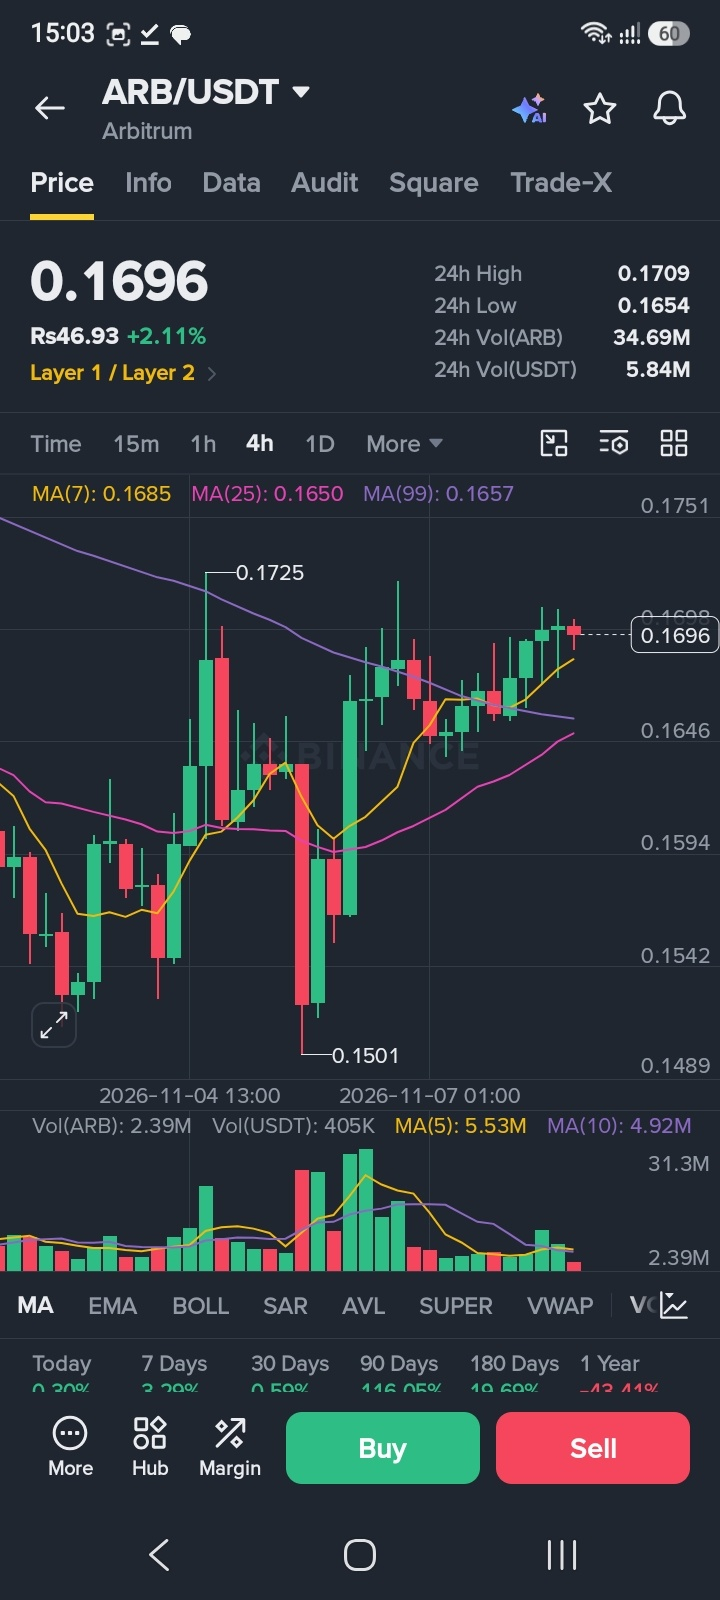
ARB is also holding above its key moving averages:
MA(7): $0.1685
MA(25): $0.1650
MA(99): $0.1657
However, the displayed 4H volume of 2.39M ARB is below its MA(5) and MA(10) volume averages. That means the move still needs stronger volume confirmation.
Daily Chart:
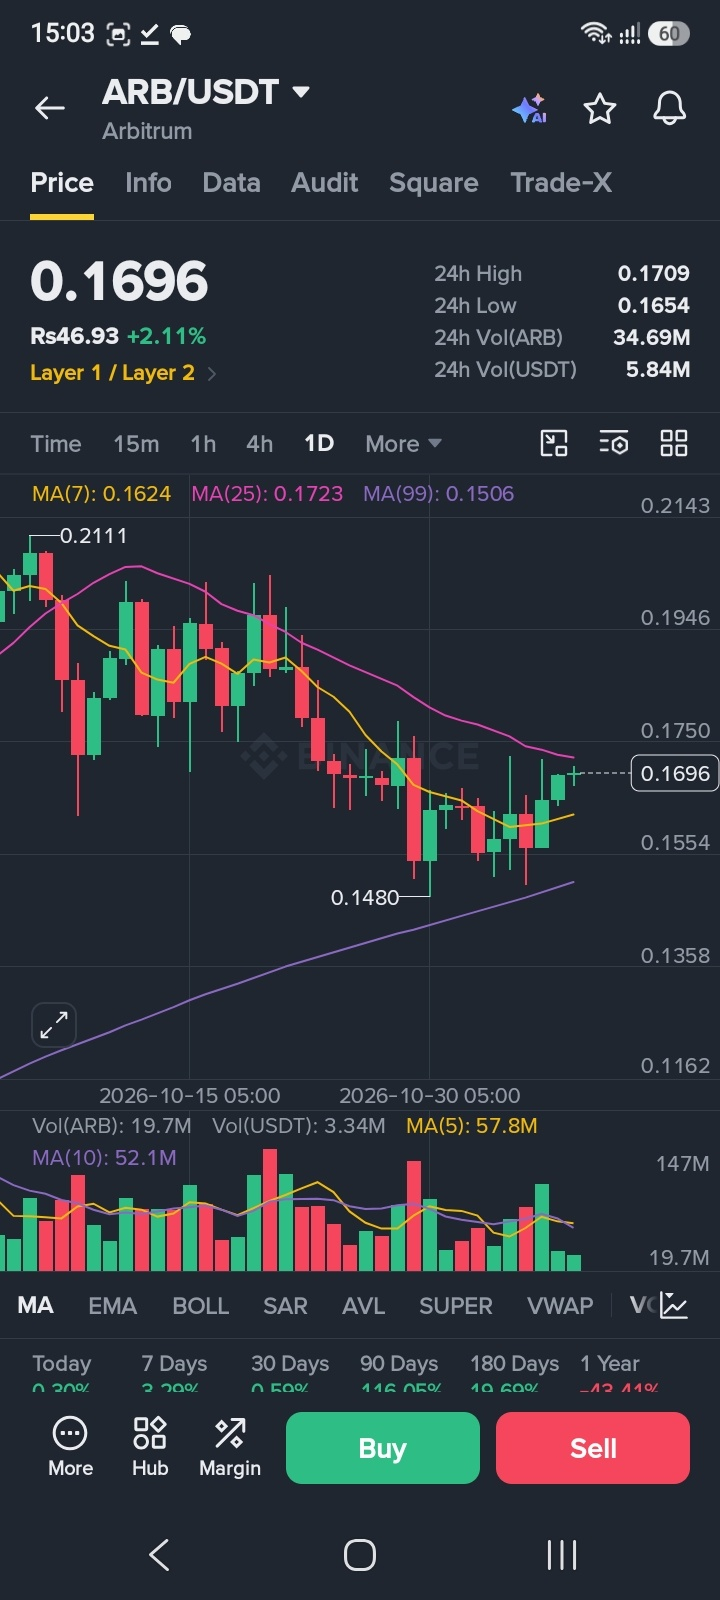
The daily picture is mixed. ARB is above MA(7) at $0.1624 and MA(99) at $0.1506, but remains below MA(25) at $0.1723. This makes the $0.1723–$0.1725 area especially important.
🎯 Key Levels Traders Should Watch
Resistance levels:
$0.1709 — recent 24H high
$0.1723–$0.1725 — major resistance zone
$0.1751 — next upside area to monitor
Support levels:
$0.1692–$0.1680 — immediate support zone
$0.1657–$0.1650 — stronger support area
$0.1624 — important daily reference level
🚀 What Could Happen Next?
If ARB breaks above $0.1725 with a strong candle close and rising volume, buyers may gain additional confidence and the $0.1751 area could come into focus.
But if price fails to clear resistance, a pullback toward $0.1692–$0.1680 or even $0.1657–$0.1650 cannot be ruled out.
The key is confirmation, not prediction.
💬 The Question for the Community
ARB is showing strength on the lower timeframes, but the daily chart still has resistance overhead.
Do you think ARB can break above $0.1725, or will sellers defend this level again?
Share your chart view below.
Disclaimer: This article is for educational and informational purposes only, not financial advice. The analysis is based on the chart screenshots provided and market conditions can change quickly. Always manage risk before making trading decisions.
#ARB #Arbitrum #CryptoAnalysis #TechnicalAnalysis #BinancePick