

Nayad
21.4k Posts

Nayad
Report
Block User
Open Trade
Frequent Trader
1.6 Years
1.4K+ Following
431 Followers
2.2K+ Liked
Posts
Portfolio
All
Quotes
·
--
🚨 CRASH EN $NKE 🚨
PATRÓN BURJ KHALIFA 🔥👀‼️
WHAT'S HAPPENING WITH NIKE?
NIKE has just hit new lows of more than 13 YEARS after posting results that cast doubt on the company’s recovery.
📉 NIKE BRAND: -4% in currency-adjusted revenue
📉 CONVERSE: -28%
📉 TOTAL REVENUE: $11.21B vs. $11.3B expected
⚠️ BUT MOST IMPORTANT IS WHAT’S IN THE GUIDANCE:
Nike now expects its fiscal-year revenue to fall in the high single-digit range.
It also projects EPS of between $1.15 and $1.35, far below the $1.67 the market expected.
And this comes after the stock has already lost more than 40% in 2026.
WHAT’S HURTING NIKE?
🇨🇳 CHINA
The company continues to face heavy pressure in China—one of its most important markets—against local competitors and shifting consumer preferences.
👟 PRODUCTS
The new launches still aren’t generating the momentum the market was expecting.
📉 DEMAND
Demand for sports products remains under pressure in several regions, and the recovery is taking much longer than expected.
💰 MARGINS
Nike is also dealing with profitability pressure as it tries to reduce inventory, control costs, and rebuild margins.
The market was looking for clear signs of recovery.
For now, the results show that recovery is still far from being straightforward.
$NKE is entering a zone that hasn’t been seen in more than a decade.
AND NOW ALL EYES ARE ON ONE QUESTION:
CAN NIKE TURN THIS AROUND?
OR
ARE WE SEEING A MUCH DEEPER DOWNTURN PROCESS?
👀 EYES ON $NKE
🚨 CRASH EN $NKE 🚨
PATRÓN BURJ KHALIFA 🔥👀‼️
WHAT'S HAPPENING WITH NIKE?
NIKE has just hit new lows of more than 13 YEARS after posting results that cast doubt on the company’s recovery.
📉 NIKE BRAND: -4% in currency-adjusted revenue
📉 CONVERSE: -28%
📉 TOTAL REVENUE: $11.21B vs. $11.3B expected
⚠️ BUT MOST IMPORTANT IS WHAT’S IN THE GUIDANCE:
Nike now expects its fiscal-year revenue to fall in the high single-digit range.
It also projects EPS of between $1.15 and $1.35, far below the $1.67 the market expected.
And this comes after the stock has already lost more than 40% in 2026.
WHAT’S HURTING NIKE?
🇨🇳 CHINA
The company continues to face heavy pressure in China—one of its most important markets—against local competitors and shifting consumer preferences.
👟 PRODUCTS
The new launches still aren’t generating the momentum the market was expecting.
📉 DEMAND
Demand for sports products remains under pressure in several regions, and the recovery is taking much longer than expected.
💰 MARGINS
Nike is also dealing with profitability pressure as it tries to reduce inventory, control costs, and rebuild margins.
The market was looking for clear signs of recovery.
For now, the results show that recovery is still far from being straightforward.
$NKE is entering a zone that hasn’t been seen in more than a decade.
AND NOW ALL EYES ARE ON ONE QUESTION:
CAN NIKE TURN THIS AROUND?
OR
ARE WE SEEING A MUCH DEEPER DOWNTURN PROCESS?
👀 EYES ON $NKE
PATRÓN BURJ KHALIFA 🔥👀‼️
WHAT'S HAPPENING WITH NIKE?
NIKE has just hit new lows of more than 13 YEARS after posting results that cast doubt on the company’s recovery.
📉 NIKE BRAND: -4% in currency-adjusted revenue
📉 CONVERSE: -28%
📉 TOTAL REVENUE: $11.21B vs. $11.3B expected
⚠️ BUT MOST IMPORTANT IS WHAT’S IN THE GUIDANCE:
Nike now expects its fiscal-year revenue to fall in the high single-digit range.
It also projects EPS of between $1.15 and $1.35, far below the $1.67 the market expected.
And this comes after the stock has already lost more than 40% in 2026.
WHAT’S HURTING NIKE?
🇨🇳 CHINA
The company continues to face heavy pressure in China—one of its most important markets—against local competitors and shifting consumer preferences.
👟 PRODUCTS
The new launches still aren’t generating the momentum the market was expecting.
📉 DEMAND
Demand for sports products remains under pressure in several regions, and the recovery is taking much longer than expected.
💰 MARGINS
Nike is also dealing with profitability pressure as it tries to reduce inventory, control costs, and rebuild margins.
The market was looking for clear signs of recovery.
For now, the results show that recovery is still far from being straightforward.
$NKE is entering a zone that hasn’t been seen in more than a decade.
AND NOW ALL EYES ARE ON ONE QUESTION:
CAN NIKE TURN THIS AROUND?
OR
ARE WE SEEING A MUCH DEEPER DOWNTURN PROCESS?
👀 EYES ON $NKE

104
·
--
URGENT: 🇺🇸 The SEC has just proposed allowing investment funds to hold their own cryptocurrency and offer more crypto products. $BTC
{spot}(BTCUSDT)
URGENT: 🇺🇸 The SEC has just proposed allowing investment funds to hold their own cryptocurrency and offer more crypto products. $BTC
16
·
--
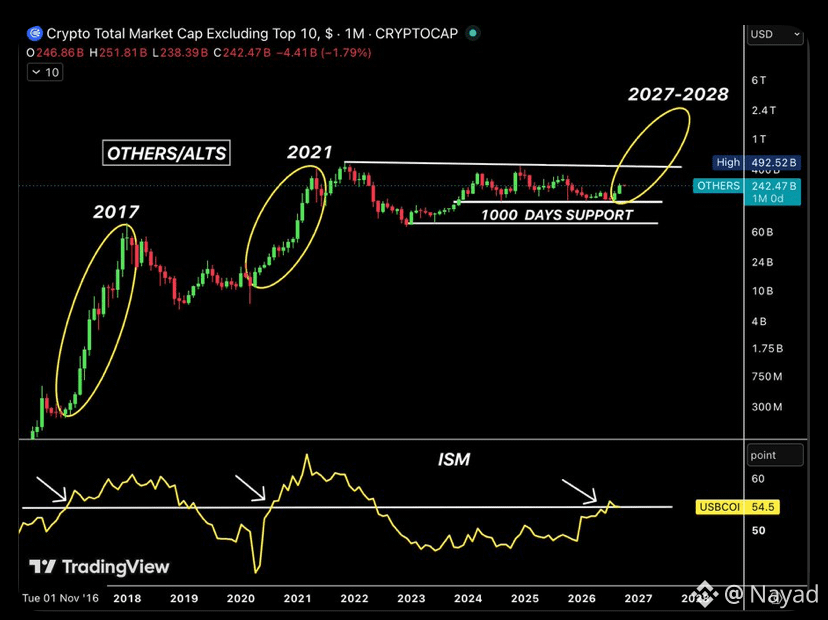
The ISM has just reached the level that triggered the last two Bull Runs in Crypto.
2017: The ISM broke above 55 (peaking at 60.8); Altcoins exploded +15,000%, led by Ethereum’s rally from $8 to $1,400.
2021: The ISM hit its highest level since 1983 at 64.7; The total crypto market capitalization surpassed $1 Trillion for the first time in history.
2025: The ISM averaged 48.9. Altcoins remained dead despite BTC and ETH reaching all-time highs.
2026: The ISM finally holds above 54 after 2 years, setting the liquidity conditions for the next bull cycle.
A PMI above 50 means manufacturing production is expanding. Since early 2026, the ISM has stayed consistently above this line, meaning businesses are profitable and real economic activity is accelerating.
When manufacturing growth holds steady or climbs toward 60, it triggers a spillover of bank liquidity. Once traditional markets absorb what they can, that excess cash directly spills over into high-risk, high-reward assets like crypto.
This is what drove the parabolic runs of 2017 and 2021.
By comparison, in 2025 the ISM averaged 48.9 below the benchmark. Strong ETF flows pushed BTC and ETH to record highs, but because the broader economy stalled, zero liquidity reached the altcoins.
A strong ISM report today won’t lift altcoins overnight, but if this economic momentum continues to build, it sets the stage for another bull cycle similar to the last one.
$BTC
{spot}(BTCUSDT)
The ISM has just reached the level that triggered the last two Bull Runs in Crypto.
2017: The ISM broke above 55 (peaking at 60.8); Altcoins exploded +15,000%, led by Ethereum’s rally from $8 to $1,400.
2021: The ISM hit its highest level since 1983 at 64.7; The total crypto market capitalization surpassed $1 Trillion for the first time in history.
2025: The ISM averaged 48.9. Altcoins remained dead despite BTC and ETH reaching all-time highs.
2026: The ISM finally holds above 54 after 2 years, setting the liquidity conditions for the next bull cycle.
A PMI above 50 means manufacturing production is expanding. Since early 2026, the ISM has stayed consistently above this line, meaning businesses are profitable and real economic activity is accelerating.
When manufacturing growth holds steady or climbs toward 60, it triggers a spillover of bank liquidity. Once traditional markets absorb what they can, that excess cash directly spills over into high-risk, high-reward assets like crypto.
This is what drove the parabolic runs of 2017 and 2021.
By comparison, in 2025 the ISM averaged 48.9 below the benchmark. Strong ETF flows pushed BTC and ETH to record highs, but because the broader economy stalled, zero liquidity reached the altcoins.
A strong ISM report today won’t lift altcoins overnight, but if this economic momentum continues to build, it sets the stage for another bull cycle similar to the last one.
$BTC
2017: The ISM broke above 55 (peaking at 60.8); Altcoins exploded +15,000%, led by Ethereum’s rally from $8 to $1,400.
2021: The ISM hit its highest level since 1983 at 64.7; The total crypto market capitalization surpassed $1 Trillion for the first time in history.
2025: The ISM averaged 48.9. Altcoins remained dead despite BTC and ETH reaching all-time highs.
2026: The ISM finally holds above 54 after 2 years, setting the liquidity conditions for the next bull cycle.
A PMI above 50 means manufacturing production is expanding. Since early 2026, the ISM has stayed consistently above this line, meaning businesses are profitable and real economic activity is accelerating.
When manufacturing growth holds steady or climbs toward 60, it triggers a spillover of bank liquidity. Once traditional markets absorb what they can, that excess cash directly spills over into high-risk, high-reward assets like crypto.
This is what drove the parabolic runs of 2017 and 2021.
By comparison, in 2025 the ISM averaged 48.9 below the benchmark. Strong ETF flows pushed BTC and ETH to record highs, but because the broader economy stalled, zero liquidity reached the altcoins.
A strong ISM report today won’t lift altcoins overnight, but if this economic momentum continues to build, it sets the stage for another bull cycle similar to the last one.
$BTC
169
·
--
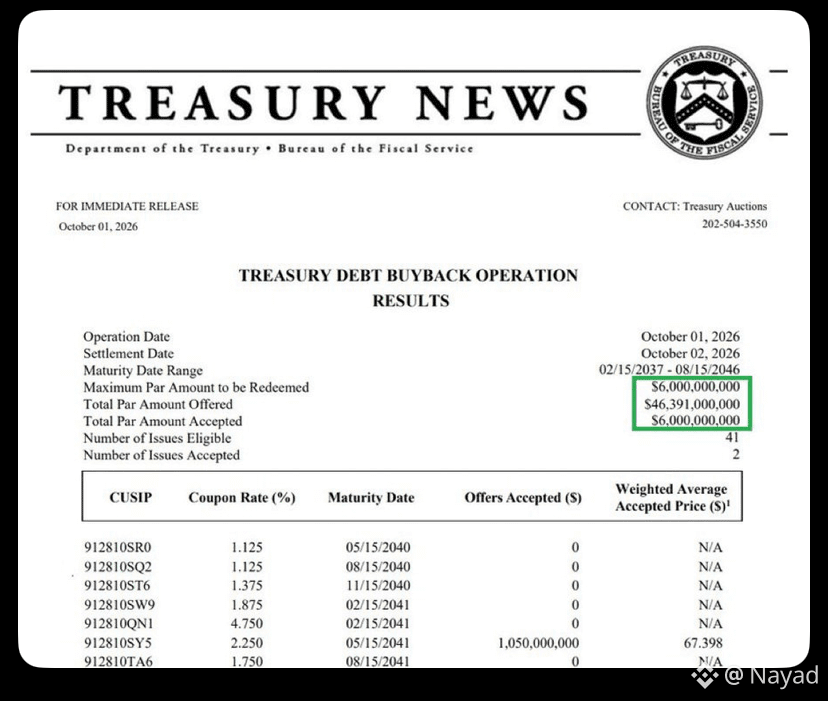
💥LATEST BREAKING: The U.S. Treasury has just repurchased $6 billion of its own debt.
$BTC
Bullish for #Bitcoin. 🚀
{spot}(BTCUSDT)
💥LATEST BREAKING: The U.S. Treasury has just repurchased $6 billion of its own debt.
$BTC
Bullish for #Bitcoin. 🚀
$BTC
Bullish for #Bitcoin. 🚀
33
·
--
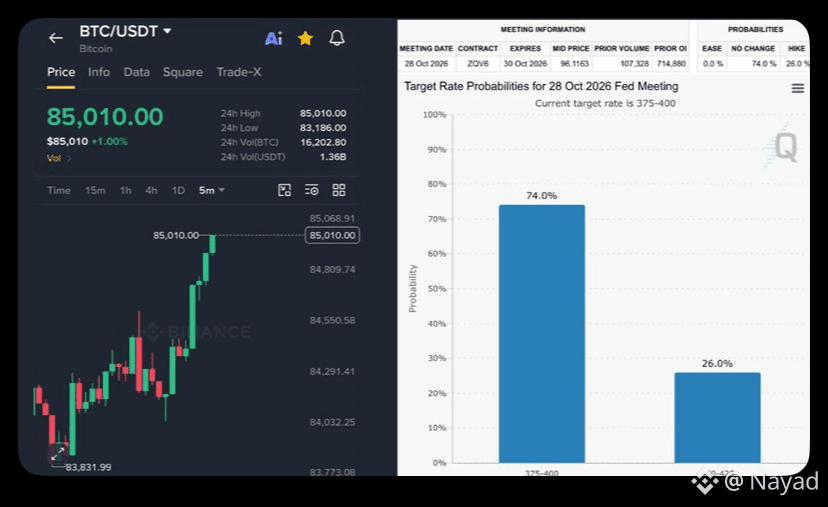
URGENT: Bitcoin has just broken $85,000 as the odds of a Fed rate hike fell from 70% to 26% on signs of a pause.
Bullish for cryptocurrencies. 🚀
$BTC
{spot}(BTCUSDT)
URGENT: Bitcoin has just broken $85,000 as the odds of a Fed rate hike fell from 70% to 26% on signs of a pause.
Bullish for cryptocurrencies. 🚀
$BTC
Bullish for cryptocurrencies. 🚀
$BTC
34
·
--
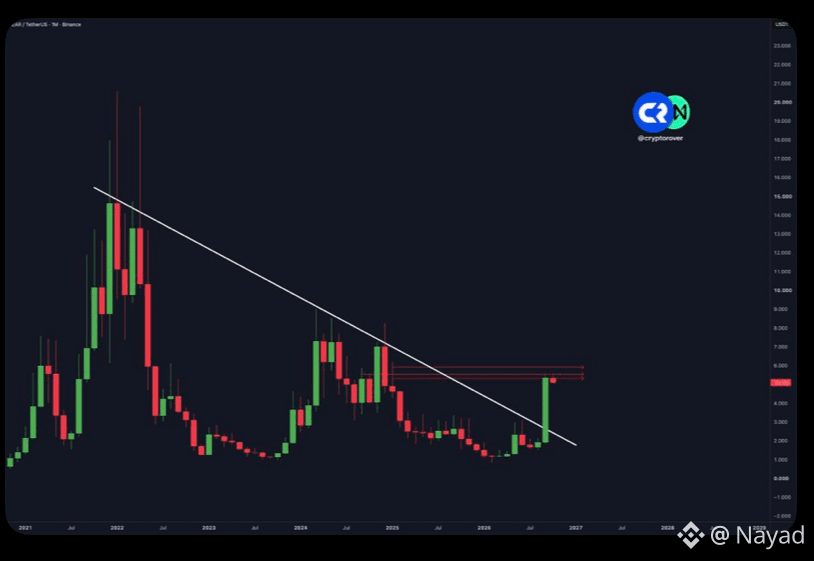
WARNING TO $NEAR HOLDERS!
$NEAR has just confirmed a monthly candle break from its 5-year downtrend.
Things are about to get WILD. 🚀
{spot}(NEARUSDT)
WARNING TO $NEAR HOLDERS!
$NEAR has just confirmed a monthly candle break from its 5-year downtrend.
Things are about to get WILD. 🚀
$NEAR has just confirmed a monthly candle break from its 5-year downtrend.
Things are about to get WILD. 🚀
1
1
830
·
--
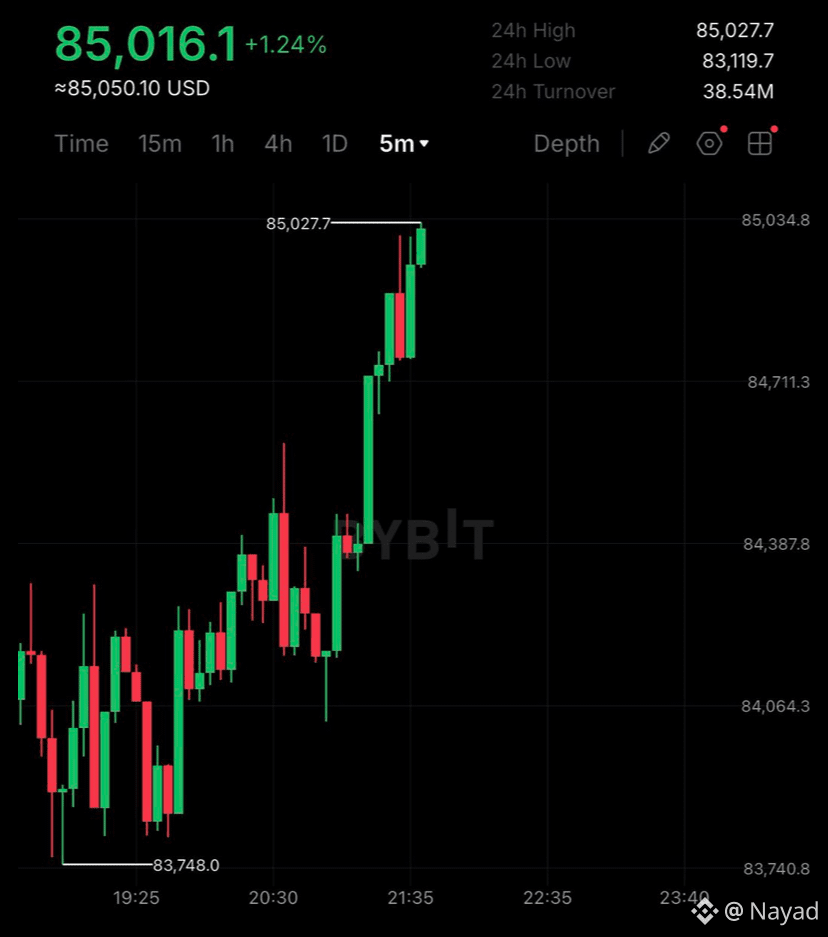
THE BITCOIN IS GOING UP AGAIN: $85,000!
$BTC #BTC
THE BITCOIN IS GOING UP AGAIN: $85,000!
$BTC #BTC
$BTC #BTC
29
·
--
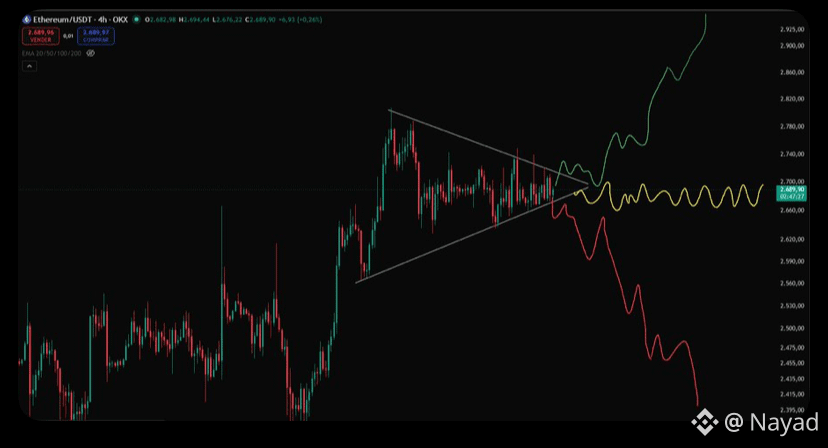
🤔🤔If you had to choose a path for #Ethereum right now, what would you choose?
🟢 Green, breaks to the upside.
🔴 Red, breaks to the downside.
🟡 Yellow, final price 2,700$. 🤝
$ETH
{spot}(ETHUSDT)
🤔🤔If you had to choose a path for #Ethereum right now, what would you choose?
🟢 Green, breaks to the upside.
🔴 Red, breaks to the downside.
🟡 Yellow, final price 2,700$. 🤝
$ETH
🟢 Green, breaks to the upside.
🔴 Red, breaks to the downside.
🟡 Yellow, final price 2,700$. 🤝
$ETH
1
23
·
--
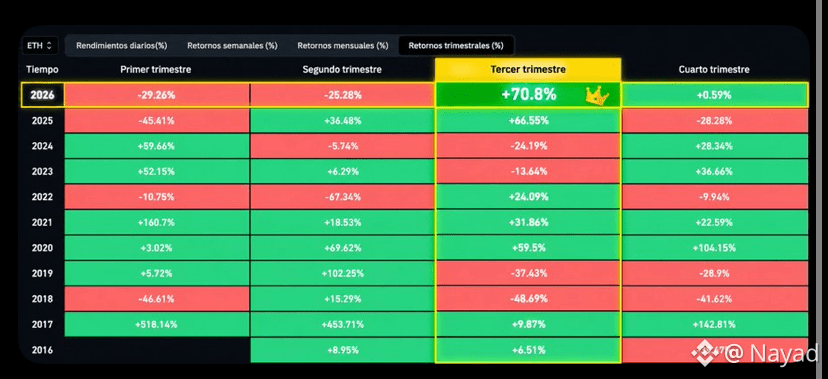
🚨 ETHEREUM JUST MADE HISTORY
Ethereum closed Q3 2026 with a gain of +70.8%, becoming the best third quarter of the entire history shown. 🔥
It surpassed 2025's +66.55% and 2020's +59.5%.
And the fact is even more interesting: $ETH came from two consecutive negative quarters.
Q1: -29.26%
Q2: -25.28%
Q3: +70.8% 🚀
{spot}(ETHUSDT)
🚨 ETHEREUM JUST MADE HISTORY
Ethereum closed Q3 2026 with a gain of +70.8%, becoming the best third quarter of the entire history shown. 🔥
It surpassed 2025's +66.55% and 2020's +59.5%.
And the fact is even more interesting: $ETH came from two consecutive negative quarters.
Q1: -29.26%
Q2: -25.28%
Q3: +70.8% 🚀
Ethereum closed Q3 2026 with a gain of +70.8%, becoming the best third quarter of the entire history shown. 🔥
It surpassed 2025's +66.55% and 2020's +59.5%.
And the fact is even more interesting: $ETH came from two consecutive negative quarters.
Q1: -29.26%
Q2: -25.28%
Q3: +70.8% 🚀
1
590
·
--
Bullish
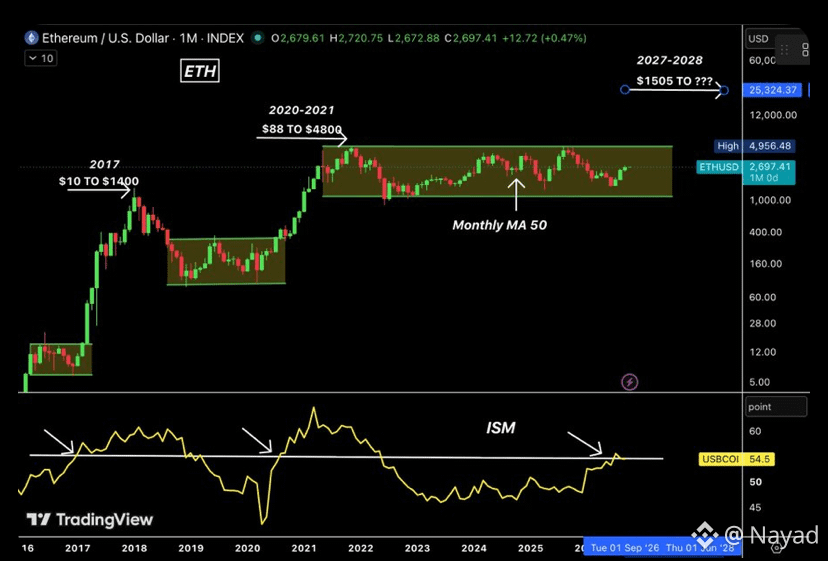
ETHEREUM STILL WAITING FOR ITS MOST IMPORTANT BULLISH SIGNAL.
2017: ISM broke above 56, and then ETH surged from $10 to $1,400.
2020 to 2021: ISM broke above 56, and then ETH surged from $88 to $4,800.
Today, ISM reached 54.5, slightly below the forecast of 54.8 and the previous one of 54.6.
So the setup is still alive, but 56 remains the key level that triggered the parabolic phase in the last 2 cycles.
ETH is currently around $2,695, sitting at the monthly MA 50.
If ISM continues moving up toward 60 in the coming months, we could see another massive cycle for ETH and altcoins in 2027 to 2028.#eth $ETH
{spot}(ETHUSDT)
ETHEREUM STILL WAITING FOR ITS MOST IMPORTANT BULLISH SIGNAL.
2017: ISM broke above 56, and then ETH surged from $10 to $1,400.
2020 to 2021: ISM broke above 56, and then ETH surged from $88 to $4,800.
Today, ISM reached 54.5, slightly below the forecast of 54.8 and the previous one of 54.6.
So the setup is still alive, but 56 remains the key level that triggered the parabolic phase in the last 2 cycles.
ETH is currently around $2,695, sitting at the monthly MA 50.
If ISM continues moving up toward 60 in the coming months, we could see another massive cycle for ETH and altcoins in 2027 to 2028.#eth $ETH
2017: ISM broke above 56, and then ETH surged from $10 to $1,400.
2020 to 2021: ISM broke above 56, and then ETH surged from $88 to $4,800.
Today, ISM reached 54.5, slightly below the forecast of 54.8 and the previous one of 54.6.
So the setup is still alive, but 56 remains the key level that triggered the parabolic phase in the last 2 cycles.
ETH is currently around $2,695, sitting at the monthly MA 50.
If ISM continues moving up toward 60 in the coming months, we could see another massive cycle for ETH and altcoins in 2027 to 2028.#eth $ETH
3
255
·
--
Bullish
LAST HOUR: $50 BILLION MILL COINBASE HAS JUST SAID THEY EXPECT THAT #bitcoin WILL REACH $300,000 BY 2030
"CERTAINLY WE ARE GOING TO GO MUCH HIGHER FROM HERE"
LET THE BULL RUN BEGIN 🚀
$BTC
{spot}(BTCUSDT)
LAST HOUR: $50 BILLION MILL COINBASE HAS JUST SAID THEY EXPECT THAT #bitcoin WILL REACH $300,000 BY 2030
"CERTAINLY WE ARE GOING TO GO MUCH HIGHER FROM HERE"
LET THE BULL RUN BEGIN 🚀
$BTC
"CERTAINLY WE ARE GOING TO GO MUCH HIGHER FROM HERE"
LET THE BULL RUN BEGIN 🚀
$BTC

1
1
80
·
--
BREAKING NEWS: The global investment bank Citi says that #Bitcoin will reach $113,000 in the next year 🚀$BTC
{spot}(BTCUSDT)
BREAKING NEWS: The global investment bank Citi says that #Bitcoin will reach $113,000 in the next year 🚀$BTC

1
33
·
--
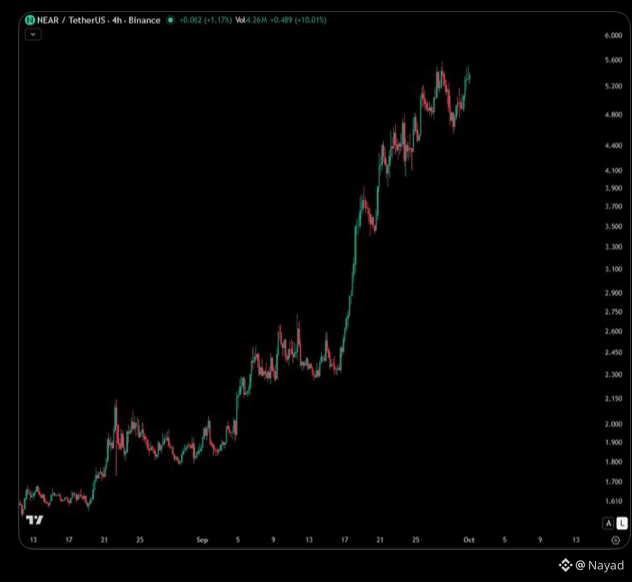
Can someone explain it to me as if I were 9 years old why $NEAR has gone up by 250% in the last 6 weeks?
{spot}(NEARUSDT)
Can someone explain it to me as if I were 9 years old why $NEAR has gone up by 250% in the last 6 weeks?
1
1
177
·
--
🚨 CARDANO | PETROBRAS TESTS ITS BLOCKCHAIN
The Brazilian state-owned oil giant Petrobras is testing the Cardano blockchain to track certificates linked to green fuels.
The initiative uses $ADA to help prevent double-counting of sustainable aviation fuel (SAF) credits and improve traceability of renewable diesel throughout its supply chain.
A new blockchain use case applied to industrial and energy processes
🚨 CARDANO | PETROBRAS TESTS ITS BLOCKCHAIN
The Brazilian state-owned oil giant Petrobras is testing the Cardano blockchain to track certificates linked to green fuels.
The initiative uses $ADA to help prevent double-counting of sustainable aviation fuel (SAF) credits and improve traceability of renewable diesel throughout its supply chain.
A new blockchain use case applied to industrial and energy processes
The Brazilian state-owned oil giant Petrobras is testing the Cardano blockchain to track certificates linked to green fuels.
The initiative uses $ADA to help prevent double-counting of sustainable aviation fuel (SAF) credits and improve traceability of renewable diesel throughout its supply chain.
A new blockchain use case applied to industrial and energy processes
113
·
--
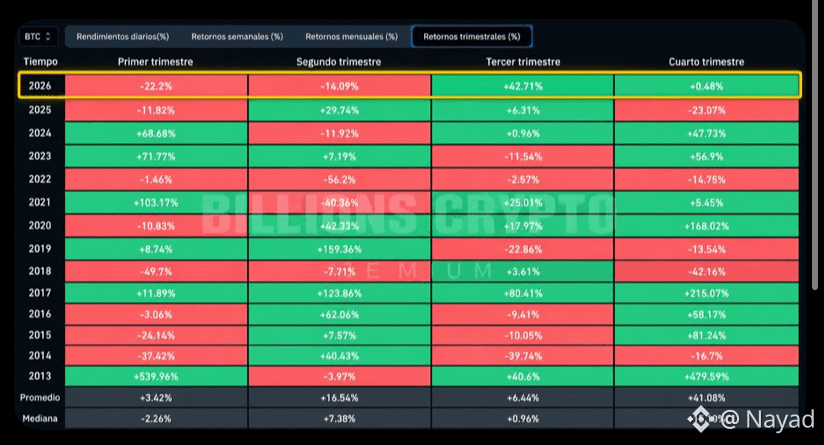
📊 BITCOIN | THIS IS HOW THE THIRD QUARTER ENDED
$BTC closed Q3 2026 with an increase of +42.71%, after two consecutive negative quarters.
🔴 Q1 → -22.20%
🔴 Q2 → -14.09%
🟢 Q3 → +42.71%
And there’s one standout detail: since 2013, this was the second-best recorded third quarter for Bitcoin.
🥇 2017 → +80.41%
🥈 2026 → +42.71%
🥉 2013 → +40.60%
Also, the historical average for Q3 is only +6.44%.
An exceptional third quarter for Bitcoin, far above its historical behavior.
{spot}(BTCUSDT)
📊 BITCOIN | THIS IS HOW THE THIRD QUARTER ENDED
$BTC closed Q3 2026 with an increase of +42.71%, after two consecutive negative quarters.
🔴 Q1 → -22.20%
🔴 Q2 → -14.09%
🟢 Q3 → +42.71%
And there’s one standout detail: since 2013, this was the second-best recorded third quarter for Bitcoin.
🥇 2017 → +80.41%
🥈 2026 → +42.71%
🥉 2013 → +40.60%
Also, the historical average for Q3 is only +6.44%.
An exceptional third quarter for Bitcoin, far above its historical behavior.
$BTC closed Q3 2026 with an increase of +42.71%, after two consecutive negative quarters.
🔴 Q1 → -22.20%
🔴 Q2 → -14.09%
🟢 Q3 → +42.71%
And there’s one standout detail: since 2013, this was the second-best recorded third quarter for Bitcoin.
🥇 2017 → +80.41%
🥈 2026 → +42.71%
🥉 2013 → +40.60%
Also, the historical average for Q3 is only +6.44%.
An exceptional third quarter for Bitcoin, far above its historical behavior.
1
57
·
--
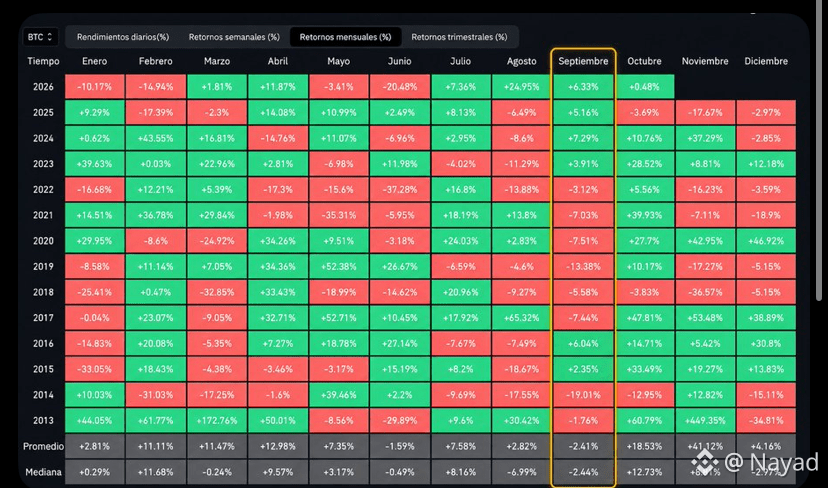
📊 BITCOIN | THIS IS HOW SEPTEMBER ENDED
$BTC September 2026 closed up +6.33%, cutting short the strong recovery from August, which had ended with +24.95%.
Comparing September with other years:
🟢 2026: +6.33%
🟢 2024: +7.29%
🟢 2023: +3.91%
🟢 2016: +6.04%
🔴 2025: +5.16%
🔴 2022: -3.12%
🔴 2021: -7.03%
🔴 2020: -7.51%
An interesting fact: historically, September has been a weak month for Bitcoin. In the table, the historical average is -2.41% and the median is -2.44%.
{spot}(BTCUSDT)
📊 BITCOIN | THIS IS HOW SEPTEMBER ENDED
$BTC September 2026 closed up +6.33%, cutting short the strong recovery from August, which had ended with +24.95%.
Comparing September with other years:
🟢 2026: +6.33%
🟢 2024: +7.29%
🟢 2023: +3.91%
🟢 2016: +6.04%
🔴 2025: +5.16%
🔴 2022: -3.12%
🔴 2021: -7.03%
🔴 2020: -7.51%
An interesting fact: historically, September has been a weak month for Bitcoin. In the table, the historical average is -2.41% and the median is -2.44%.
$BTC September 2026 closed up +6.33%, cutting short the strong recovery from August, which had ended with +24.95%.
Comparing September with other years:
🟢 2026: +6.33%
🟢 2024: +7.29%
🟢 2023: +3.91%
🟢 2016: +6.04%
🔴 2025: +5.16%
🔴 2022: -3.12%
🔴 2021: -7.03%
🔴 2020: -7.51%
An interesting fact: historically, September has been a weak month for Bitcoin. In the table, the historical average is -2.41% and the median is -2.44%.
1
208
·
--
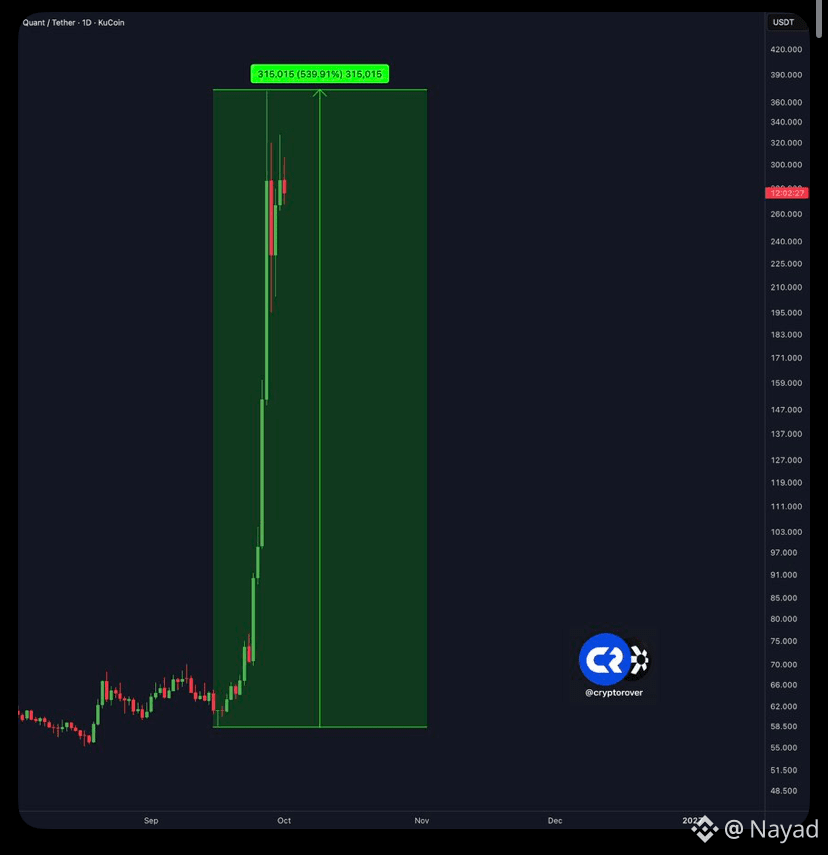
If you had bought $10,000 in $QNT just 15 days ago, you would now have approximately $64,000.
Let that sink in.
$10,000 → $64,000 in just TWO WEEKS.
If you had bought $10,000 in $QNT just 15 days ago, you would now have approximately $64,000.
Let that sink in.
$10,000 → $64,000 in just TWO WEEKS.
Let that sink in.
$10,000 → $64,000 in just TWO WEEKS.
3
2
1.2k
·
--
🚨 IMPORTANT
🇺🇸 THE U.S. ISM PMI HAS JUST BEEN OFFICIALLY RELEASED:
FORECAST: 55.0
ACTUAL: 54.5
📉 THE FIGURE COMES IN BELOW EXPECTATIONS AND REACHES ITS LOWEST LEVEL OF THE PAST 3 MONTHS.
THIS POINTS TO A SLOWDOWN IN BUSINESS ACTIVITY AND ADDS PRESSURE ON THE MARKETS.
👀 ALL EYES ON THE REACTION OF $BTC , $ETH AND THE REST OF THE MARKET.
{spot}(ETHUSDT)
{spot}(BTCUSDT)
🚨 IMPORTANT
🇺🇸 THE U.S. ISM PMI HAS JUST BEEN OFFICIALLY RELEASED:
FORECAST: 55.0
ACTUAL: 54.5
📉 THE FIGURE COMES IN BELOW EXPECTATIONS AND REACHES ITS LOWEST LEVEL OF THE PAST 3 MONTHS.
THIS POINTS TO A SLOWDOWN IN BUSINESS ACTIVITY AND ADDS PRESSURE ON THE MARKETS.
👀 ALL EYES ON THE REACTION OF $BTC , $ETH AND THE REST OF THE MARKET.
🇺🇸 THE U.S. ISM PMI HAS JUST BEEN OFFICIALLY RELEASED:
FORECAST: 55.0
ACTUAL: 54.5
📉 THE FIGURE COMES IN BELOW EXPECTATIONS AND REACHES ITS LOWEST LEVEL OF THE PAST 3 MONTHS.
THIS POINTS TO A SLOWDOWN IN BUSINESS ACTIVITY AND ADDS PRESSURE ON THE MARKETS.
👀 ALL EYES ON THE REACTION OF $BTC , $ETH AND THE REST OF THE MARKET.

1
170
·
--
Verified
🚨 THE U.S. ECONOMY IS STILL STRONG, AND THIS WILL CONFUSE THE FED.
The latest U.S. ISM PMI data has just been released, and it came in at 54.5.
This is the ninth consecutive month above 52, showing that the U.S. economy is in an expansion phase.
A strong ISM reading also implies higher inflation expectations, and that’s not what the Fed wants.
So this leaves them with two options.
Keep rates unchanged and simply wait.
But doing so will push yields higher, because the market knows that inflation won’t go away anytime soon.
Raise rates to push inflation down.
But doing so will paralyze economic growth and bring even greater challenges.
This means one thing is clear: the Fed no longer has an easy path ahead.$ETH $NVDAB
🚨 THE U.S. ECONOMY IS STILL STRONG, AND THIS WILL CONFUSE THE FED.
The latest U.S. ISM PMI data has just been released, and it came in at 54.5.
This is the ninth consecutive month above 52, showing that the U.S. economy is in an expansion phase.
A strong ISM reading also implies higher inflation expectations, and that’s not what the Fed wants.
So this leaves them with two options.
Keep rates unchanged and simply wait.
But doing so will push yields higher, because the market knows that inflation won’t go away anytime soon.
Raise rates to push inflation down.
But doing so will paralyze economic growth and bring even greater challenges.
This means one thing is clear: the Fed no longer has an easy path ahead.$ETH $NVDAB
The latest U.S. ISM PMI data has just been released, and it came in at 54.5.
This is the ninth consecutive month above 52, showing that the U.S. economy is in an expansion phase.
A strong ISM reading also implies higher inflation expectations, and that’s not what the Fed wants.
So this leaves them with two options.
Keep rates unchanged and simply wait.
But doing so will push yields higher, because the market knows that inflation won’t go away anytime soon.
Raise rates to push inflation down.
But doing so will paralyze economic growth and bring even greater challenges.
This means one thing is clear: the Fed no longer has an easy path ahead.$ETH $NVDAB

2
324
·
--
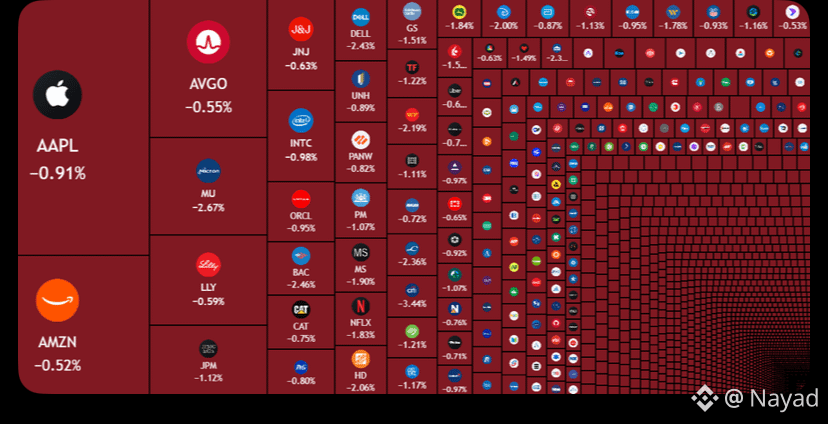
💥$550 billion wiped off the US stock market in just 25 minutes, while the ISM PMI fell to a 3-month low.
$BTC $ETH $SOL
💥$550 billion wiped off the US stock market in just 25 minutes, while the ISM PMI fell to a 3-month low.
$BTC $ETH $SOL
$BTC $ETH $SOL
1
36
Log in to explore more content
Join global crypto users on Binance Square
⚡️ Get latest and useful information about crypto.
💬 Trusted by the world’s largest crypto exchange.
👍 Discover real insights from verified creators.
Email / Phone number
Trending Topics
NEARFallsToAround$4.70Down14%
376 views
9 Discussing
🚨 $NEAR — FROM ETF HYPE TO A 14% SLAP IN THE FACE.
NEAR has dropped toward $4.70, giving back a big chunk of its recent run after briefly trading above $5.50. The selloff also came as NEAR Intents disclosed a security incident tied to its cross-chain infrastructure, with reported losses around $3.8M. The underlying NEAR blockchain itself was not reported as compromised.
Here’s the part traders should care about:
$4.69–$4.74 is now the key support zone.
Hold it, and this could simply be a violent retest after the September breakout.
Lose it?
The next downside references sit closer to $4.58, then ~$4.30.
And the irony?
The new Bitwise NEAR ETF was still seeing positive inflows around launch week.
So this isn’t a simple “nobody wants NEAR” story.
It’s a battle between:
fresh institutional access
vs.
post-rally profit-taking + security fear.
$NEAR doesn’t need hype right now. It needs $4.70 to hold. 👀
#NEARFallsToAround$4.70Down14% #EvernorthPlansNasdaqListingOct8 #SECProposesCryptoCustodyFramework #IMFApproves$139MDisbursementToElSalvador #AnthropicTargetsIPOAsSoonAsMidNovember
KimHotbae
·0 Likes
·200 views
EthereumFoundationLaunchesZkAPIOnMainnet
0 views
1 Discussing
EvernorthPlansNasdaqListingOct8
491 views
39 Discussing