

Cyrus Crypto LATAM
801 Posts

Cyrus Crypto LATAM
Report
Block User
📊 Noticias, análisis y predicciones del mercado cripto. Seguimiento diario de BTC, ETH, BNB, SOL y las AltCoins más relevantes.
5 Following
117 Followers
251 Liked
Posts
$XRP defends USD $1.49 as ETFs accumulate tokens: analysis for September 29, 2026
#xrp closes the session on September 29, 2026 at USD $1.49, with a marginal drop of 0.07% that hides an intense struggle between institutional accumulation via ETFs and Ripple’s monthly unlocks. With volume 26% above its 30-day average and the MACD turning negative, Ripple’s token is at a technical crossroads between USD $1.47 and USD $1.55, which will define its direction over the coming weeks.
XRP’s story defends USD $1.51 while whales and ETFs push against the resistance of USD $1.60 directly explains the price rejection at USD $1.51 during this session: that level matches the 7-day SMA and the 23.6% Fibonacci retracement, making it a natural technical sell point for short-term traders.
The market capitalization of USD $93.98 MMD places XRP among the sector’s large assets, with a daily volume/market-cap ratio of 4.95%, well above the 3.92% average—signaling robust liquidity and active institutional interest.
Recommendation: HOLD. Methodology: counting the available signals, 3 out of 6 favor buying (RSI at 55.1 above the bullish threshold of 50; price above the SMA-30, SMA-50, SMA-90 and SMA-200; 90-day return of +40.48%; elevated relative volume of 4.95%), while 3 favor caution (MACD with a negative histogram, price below the SMA-5/SMA-7 and the SMA-10, weekly retracement of 9.33%). The technical tie is resolved in favor of maintaining existing positions without adding in the USD $1.49 zone, since the price is trading below the intraday VWAP and against resistance at USD $1.51–$1.55.
Short term: trade the range with entries near USD $1.47 and take profits at USD $1.55, with a stop-loss at USD $1.455 (approximate risk of 1%).
XRP is experiencing a healthy consolidation within a bullish medium-term trend.
{future}(XRPUSDT)
$XRP defends USD $1.49 as ETFs accumulate tokens: analysis for September 29, 2026
#xrp closes the session on September 29, 2026 at USD $1.49, with a marginal drop of 0.07% that hides an intense struggle between institutional accumulation via ETFs and Ripple’s monthly unlocks. With volume 26% above its 30-day average and the MACD turning negative, Ripple’s token is at a technical crossroads between USD $1.47 and USD $1.55, which will define its direction over the coming weeks.
XRP’s story defends USD $1.51 while whales and ETFs push against the resistance of USD $1.60 directly explains the price rejection at USD $1.51 during this session: that level matches the 7-day SMA and the 23.6% Fibonacci retracement, making it a natural technical sell point for short-term traders.
The market capitalization of USD $93.98 MMD places XRP among the sector’s large assets, with a daily volume/market-cap ratio of 4.95%, well above the 3.92% average—signaling robust liquidity and active institutional interest.
Recommendation: HOLD. Methodology: counting the available signals, 3 out of 6 favor buying (RSI at 55.1 above the bullish threshold of 50; price above the SMA-30, SMA-50, SMA-90 and SMA-200; 90-day return of +40.48%; elevated relative volume of 4.95%), while 3 favor caution (MACD with a negative histogram, price below the SMA-5/SMA-7 and the SMA-10, weekly retracement of 9.33%). The technical tie is resolved in favor of maintaining existing positions without adding in the USD $1.49 zone, since the price is trading below the intraday VWAP and against resistance at USD $1.51–$1.55.
Short term: trade the range with entries near USD $1.47 and take profits at USD $1.55, with a stop-loss at USD $1.455 (approximate risk of 1%).
XRP is experiencing a healthy consolidation within a bullish medium-term trend.
#xrp closes the session on September 29, 2026 at USD $1.49, with a marginal drop of 0.07% that hides an intense struggle between institutional accumulation via ETFs and Ripple’s monthly unlocks. With volume 26% above its 30-day average and the MACD turning negative, Ripple’s token is at a technical crossroads between USD $1.47 and USD $1.55, which will define its direction over the coming weeks.
XRP’s story defends USD $1.51 while whales and ETFs push against the resistance of USD $1.60 directly explains the price rejection at USD $1.51 during this session: that level matches the 7-day SMA and the 23.6% Fibonacci retracement, making it a natural technical sell point for short-term traders.
The market capitalization of USD $93.98 MMD places XRP among the sector’s large assets, with a daily volume/market-cap ratio of 4.95%, well above the 3.92% average—signaling robust liquidity and active institutional interest.
Recommendation: HOLD. Methodology: counting the available signals, 3 out of 6 favor buying (RSI at 55.1 above the bullish threshold of 50; price above the SMA-30, SMA-50, SMA-90 and SMA-200; 90-day return of +40.48%; elevated relative volume of 4.95%), while 3 favor caution (MACD with a negative histogram, price below the SMA-5/SMA-7 and the SMA-10, weekly retracement of 9.33%). The technical tie is resolved in favor of maintaining existing positions without adding in the USD $1.49 zone, since the price is trading below the intraday VWAP and against resistance at USD $1.51–$1.55.
Short term: trade the range with entries near USD $1.47 and take profits at USD $1.55, with a stop-loss at USD $1.455 (approximate risk of 1%).
XRP is experiencing a healthy consolidation within a bullish medium-term trend.

1
207
$HYPE cae slips by 4.44% in 24 hours as fears grow over token unlocks
#hype retreats by 4.44% in 24 hours to USD $86.11, pressured by institutional sell signals, declining volume, and the shadow of a massive token unlock. Technical analysis shows a weakened short-term trend but an intact medium-term structure: price remains above the SMA-50 and the SMA-200.
The 4.44% drop is largely explained by sell-side supply pressure. Market reports highlight that around 700 million HYPE tokens are outside the circulating supply due to unlocks, triggering dilution warnings among analysts.
#Hyperliquid is the decentralized perpetual contract exchange with the highest volume in the sector, featuring direct monetization through trading fees reflected in the token’s performance. Adoption growth is the foundation of the valuation: HYPE has multiplied its price by 9.7 over two years (+871.55%) and adds +90.78% over 52 weeks—performance only comparable to the best acts of the DeFi cycle.
Recommendation: HOLD for existing positions.
Explicit methodology: out of five technical signals evaluated, two are bullish (price above SMA-30, SMA-50 and SMA-200; RSI neutral with no oversold condition), two are bearish (MACD with a negative histogram, price below SMA-7 and SMA-15) and one is neutral (stochastic at 43.5). The weighting factor is structural uncertainty about the 700 million tokens outside the supply, which penalizes the risk of buying before clarity.
Short term (days–weeks): trade within the range between USD $85.76 and USD $88.93. Buy only on a confirmed bounce above USD $86.90 (Fibonacci 23.6%), with a stop-loss below USD $85.00 and take-profit at USD $90.51. Maximum risk per trade: 1–2% of capital given a daily ATR of 4.9%.
HYPE is undergoing a short-term correction within a broader bullish trend, driven by unlock pressure and whale selling—not by a deterioration in fundamentals.
{future}(HYPEUSDT)
$HYPE cae slips by 4.44% in 24 hours as fears grow over token unlocks
#hype retreats by 4.44% in 24 hours to USD $86.11, pressured by institutional sell signals, declining volume, and the shadow of a massive token unlock. Technical analysis shows a weakened short-term trend but an intact medium-term structure: price remains above the SMA-50 and the SMA-200.
The 4.44% drop is largely explained by sell-side supply pressure. Market reports highlight that around 700 million HYPE tokens are outside the circulating supply due to unlocks, triggering dilution warnings among analysts.
#Hyperliquid is the decentralized perpetual contract exchange with the highest volume in the sector, featuring direct monetization through trading fees reflected in the token’s performance. Adoption growth is the foundation of the valuation: HYPE has multiplied its price by 9.7 over two years (+871.55%) and adds +90.78% over 52 weeks—performance only comparable to the best acts of the DeFi cycle.
Recommendation: HOLD for existing positions.
Explicit methodology: out of five technical signals evaluated, two are bullish (price above SMA-30, SMA-50 and SMA-200; RSI neutral with no oversold condition), two are bearish (MACD with a negative histogram, price below SMA-7 and SMA-15) and one is neutral (stochastic at 43.5). The weighting factor is structural uncertainty about the 700 million tokens outside the supply, which penalizes the risk of buying before clarity.
Short term (days–weeks): trade within the range between USD $85.76 and USD $88.93. Buy only on a confirmed bounce above USD $86.90 (Fibonacci 23.6%), with a stop-loss below USD $85.00 and take-profit at USD $90.51. Maximum risk per trade: 1–2% of capital given a daily ATR of 4.9%.
HYPE is undergoing a short-term correction within a broader bullish trend, driven by unlock pressure and whale selling—not by a deterioration in fundamentals.
#hype retreats by 4.44% in 24 hours to USD $86.11, pressured by institutional sell signals, declining volume, and the shadow of a massive token unlock. Technical analysis shows a weakened short-term trend but an intact medium-term structure: price remains above the SMA-50 and the SMA-200.
The 4.44% drop is largely explained by sell-side supply pressure. Market reports highlight that around 700 million HYPE tokens are outside the circulating supply due to unlocks, triggering dilution warnings among analysts.
#Hyperliquid is the decentralized perpetual contract exchange with the highest volume in the sector, featuring direct monetization through trading fees reflected in the token’s performance. Adoption growth is the foundation of the valuation: HYPE has multiplied its price by 9.7 over two years (+871.55%) and adds +90.78% over 52 weeks—performance only comparable to the best acts of the DeFi cycle.
Recommendation: HOLD for existing positions.
Explicit methodology: out of five technical signals evaluated, two are bullish (price above SMA-30, SMA-50 and SMA-200; RSI neutral with no oversold condition), two are bearish (MACD with a negative histogram, price below SMA-7 and SMA-15) and one is neutral (stochastic at 43.5). The weighting factor is structural uncertainty about the 700 million tokens outside the supply, which penalizes the risk of buying before clarity.
Short term (days–weeks): trade within the range between USD $85.76 and USD $88.93. Buy only on a confirmed bounce above USD $86.90 (Fibonacci 23.6%), with a stop-loss below USD $85.00 and take-profit at USD $90.51. Maximum risk per trade: 1–2% of capital given a daily ATR of 4.9%.
HYPE is undergoing a short-term correction within a broader bullish trend, driven by unlock pressure and whale selling—not by a deterioration in fundamentals.

481
#zec $ZEC seplunges 11% this September 29, 2026 and reverses its parabolic rally
ZEC falls 11.01%, the largest pullback among the major cryptocurrencies of the day, after a rally of nearly 70% in 30 days. The contraction of open interest, liquidations of long positions, and an unfavorable macro backdrop pressure the asset, although the debut of its European ETP and the privacy narrative keep the structural thesis intact.
A correction of leveraged positions after a parabolic rally. As we reported, ZEC drops 10.92% after its parabolic rally: profit-taking and a contraction of open interest; open interest fell faster than price, signaling that longs were closed rather than new shorts being opened.
#zcash is the most mature zero-knowledge proof privacy protocol in the market, and its utility lies in verifiable encrypted (shielded) transactions. Shielded activity reached a four-year high this week, according to CryptoSlate, an on-chain indicator of real adoption beyond price speculation.
Recommendation: HOLD.
Explicit methodology: out of five signals assessed, two favor selling and three favor holding. In favor of holding: the broader uptrend structure remains bullish (price is 18% above the 30-day SMA and 142% above the 200-day SMA), the RSI at 54.2 is not in extreme oversold territory, and price is holding the 23.6% Fibonacci retracement with increasing volume, indicating real participation rather than illiquid panic. In favor of selling: the MACD has turned bearish and open interest has contracted by 10%, a sign of leverage exiting the market.
Short term: aggressive traders can trade the USD $1,363–$1,453 range, with a stop-loss below USD $1,340 and take-profit near the VWAP (USD $1,434) or the 15-day SMA (USD $1,460.71).
ZEC’s 11% drop is, based on the available evidence, a profit-taking and deleveraging correction following a 69.80% rally over 30 days.
{future}(ZECUSDT)
#zec $ZEC seplunges 11% this September 29, 2026 and reverses its parabolic rally
ZEC falls 11.01%, the largest pullback among the major cryptocurrencies of the day, after a rally of nearly 70% in 30 days. The contraction of open interest, liquidations of long positions, and an unfavorable macro backdrop pressure the asset, although the debut of its European ETP and the privacy narrative keep the structural thesis intact.
A correction of leveraged positions after a parabolic rally. As we reported, ZEC drops 10.92% after its parabolic rally: profit-taking and a contraction of open interest; open interest fell faster than price, signaling that longs were closed rather than new shorts being opened.
#zcash is the most mature zero-knowledge proof privacy protocol in the market, and its utility lies in verifiable encrypted (shielded) transactions. Shielded activity reached a four-year high this week, according to CryptoSlate, an on-chain indicator of real adoption beyond price speculation.
Recommendation: HOLD.
Explicit methodology: out of five signals assessed, two favor selling and three favor holding. In favor of holding: the broader uptrend structure remains bullish (price is 18% above the 30-day SMA and 142% above the 200-day SMA), the RSI at 54.2 is not in extreme oversold territory, and price is holding the 23.6% Fibonacci retracement with increasing volume, indicating real participation rather than illiquid panic. In favor of selling: the MACD has turned bearish and open interest has contracted by 10%, a sign of leverage exiting the market.
Short term: aggressive traders can trade the USD $1,363–$1,453 range, with a stop-loss below USD $1,340 and take-profit near the VWAP (USD $1,434) or the 15-day SMA (USD $1,460.71).
ZEC’s 11% drop is, based on the available evidence, a profit-taking and deleveraging correction following a 69.80% rally over 30 days.
ZEC falls 11.01%, the largest pullback among the major cryptocurrencies of the day, after a rally of nearly 70% in 30 days. The contraction of open interest, liquidations of long positions, and an unfavorable macro backdrop pressure the asset, although the debut of its European ETP and the privacy narrative keep the structural thesis intact.
A correction of leveraged positions after a parabolic rally. As we reported, ZEC drops 10.92% after its parabolic rally: profit-taking and a contraction of open interest; open interest fell faster than price, signaling that longs were closed rather than new shorts being opened.
#zcash is the most mature zero-knowledge proof privacy protocol in the market, and its utility lies in verifiable encrypted (shielded) transactions. Shielded activity reached a four-year high this week, according to CryptoSlate, an on-chain indicator of real adoption beyond price speculation.
Recommendation: HOLD.
Explicit methodology: out of five signals assessed, two favor selling and three favor holding. In favor of holding: the broader uptrend structure remains bullish (price is 18% above the 30-day SMA and 142% above the 200-day SMA), the RSI at 54.2 is not in extreme oversold territory, and price is holding the 23.6% Fibonacci retracement with increasing volume, indicating real participation rather than illiquid panic. In favor of selling: the MACD has turned bearish and open interest has contracted by 10%, a sign of leverage exiting the market.
Short term: aggressive traders can trade the USD $1,363–$1,453 range, with a stop-loss below USD $1,340 and take-profit near the VWAP (USD $1,434) or the 15-day SMA (USD $1,460.71).
ZEC’s 11% drop is, based on the available evidence, a profit-taking and deleveraging correction following a 69.80% rally over 30 days.

286
AAVE surges 10.90% and breaks its range: does recovery toward USD $170 begin?
#AAVE $AAVE surprised the market with a 10.90% jump in 24 hours, supported by volume that doubled its 30-day average and signals of token burning and institutional accumulation, according to sector reports. This analysis breaks down price action, critical technical levels, and actionable strategies for each investor profile.
The 10.90% surge is primarily driven by a confirmed catalyst from market sources: CoinMarketCap reports indicate that AAVE rose up to 25% in the current context amid signs of token burning, buybacks supported by a favorable regulatory framework with the SEC, and whale accumulation—within the Aavenomics 3.0 narrative and the DeFi credit layer.
Aave is the leading decentralized lending protocol, and its current narrative is framed as a DeFi credit layer for RWAs and institutional markets. Governance also evaluated the closure of six V3 markets and the deactivation of 50 low-utilization reserves after LlamaRisk’s risk assessment—an operational discipline signal that protects collateral quality.
Recommendation: HOLD with staggered buys on pullbacks.
Methodology applied across five signals: bullish MACD (in favor), price vs. SMA-10/20/50 (in favor), relative volume 102% over average (in favor), RSI 69.0 with stochastic 97.5 in overbought territory (against), and %B 104.8 with price outside the Bollinger band (against). Result: 3/5 technical signals in favor, with exceptional volume confirmation.
The mixed signal prevents recommending aggressive opening at resistance.
Short term: buy retests of USD $151.91–$154.77 with a loss limit at $144.50 and take-profit at $167.70; after a breakout with volume, use a dynamic stop and a target of $185
AAVE executed a high-conviction technical breakout with doubled volume and a fundamental catalyst that distinguishes this move from a simple speculative rally.
{future}(AAVEUSDT)
AAVE surges 10.90% and breaks its range: does recovery toward USD $170 begin?
#AAVE $AAVE surprised the market with a 10.90% jump in 24 hours, supported by volume that doubled its 30-day average and signals of token burning and institutional accumulation, according to sector reports. This analysis breaks down price action, critical technical levels, and actionable strategies for each investor profile.
The 10.90% surge is primarily driven by a confirmed catalyst from market sources: CoinMarketCap reports indicate that AAVE rose up to 25% in the current context amid signs of token burning, buybacks supported by a favorable regulatory framework with the SEC, and whale accumulation—within the Aavenomics 3.0 narrative and the DeFi credit layer.
Aave is the leading decentralized lending protocol, and its current narrative is framed as a DeFi credit layer for RWAs and institutional markets. Governance also evaluated the closure of six V3 markets and the deactivation of 50 low-utilization reserves after LlamaRisk’s risk assessment—an operational discipline signal that protects collateral quality.
Recommendation: HOLD with staggered buys on pullbacks.
Methodology applied across five signals: bullish MACD (in favor), price vs. SMA-10/20/50 (in favor), relative volume 102% over average (in favor), RSI 69.0 with stochastic 97.5 in overbought territory (against), and %B 104.8 with price outside the Bollinger band (against). Result: 3/5 technical signals in favor, with exceptional volume confirmation.
The mixed signal prevents recommending aggressive opening at resistance.
Short term: buy retests of USD $151.91–$154.77 with a loss limit at $144.50 and take-profit at $167.70; after a breakout with volume, use a dynamic stop and a target of $185
AAVE executed a high-conviction technical breakout with doubled volume and a fundamental catalyst that distinguishes this move from a simple speculative rally.
#AAVE $AAVE surprised the market with a 10.90% jump in 24 hours, supported by volume that doubled its 30-day average and signals of token burning and institutional accumulation, according to sector reports. This analysis breaks down price action, critical technical levels, and actionable strategies for each investor profile.
The 10.90% surge is primarily driven by a confirmed catalyst from market sources: CoinMarketCap reports indicate that AAVE rose up to 25% in the current context amid signs of token burning, buybacks supported by a favorable regulatory framework with the SEC, and whale accumulation—within the Aavenomics 3.0 narrative and the DeFi credit layer.
Aave is the leading decentralized lending protocol, and its current narrative is framed as a DeFi credit layer for RWAs and institutional markets. Governance also evaluated the closure of six V3 markets and the deactivation of 50 low-utilization reserves after LlamaRisk’s risk assessment—an operational discipline signal that protects collateral quality.
Recommendation: HOLD with staggered buys on pullbacks.
Methodology applied across five signals: bullish MACD (in favor), price vs. SMA-10/20/50 (in favor), relative volume 102% over average (in favor), RSI 69.0 with stochastic 97.5 in overbought territory (against), and %B 104.8 with price outside the Bollinger band (against). Result: 3/5 technical signals in favor, with exceptional volume confirmation.
The mixed signal prevents recommending aggressive opening at resistance.
Short term: buy retests of USD $151.91–$154.77 with a loss limit at $144.50 and take-profit at $167.70; after a breakout with volume, use a dynamic stop and a target of $185
AAVE executed a high-conviction technical breakout with doubled volume and a fundamental catalyst that distinguishes this move from a simple speculative rally.

114
#bitcoin $BTC sustains USD $84,000 with slight progress this September 29
Backed by volumes above their average and a notable flow of institutional buying. However, a mildly bearish MACD, the absence of fresh leverage, and resistance at USD $87.331 point to a finely balanced market: the medium-term bullish thesis remains intact, requiring patience and strict risk management.
The move over the last 72 hours—up 1.27% yesterday and up 0.90% today, after an intraday low of USD $83,012.36—has a confirmed catalyst from sources: institutional demand.
BTC’s valuation rests on three verifiable pillars in the current data. First, structural demand: Strategy with 847,666 BTC, Strive with 27,462 BTC, and Spark’s $210 million credit infrastructure create a buffer for absorbing supply that has historically softened corrections.
Methodology applied: scoring five technical signals and one flow signal.
In favor:
(1) price above the SMA-30, SMA-50, and SMA-90;
(2) RSI at 62.3 with healthy momentum;
(3) daily volume 12.15% above average with price in positive territory;
(4) Bollinger %B at 73.4 with no extreme overbought;
(5) 90-day return of +38.62% confirming a foundational trend.
Against:
(1) MACD with histogram at -21.37;
(2) weekly loss of 3.35% and price marginally below the SMA-7.
With four out of seven signals in favor, high spot participation, and a confirmed institutional catalyst, the recommendation is HOLD (AGUANTAR) existing positions—without aggressive buying at current prices due to the consolidation risk suggested by the MACD.
For the short term: trade the USD $80,900–84,300 range, buy near the SMA-20 (USD $80,941.56) with a stop-loss below USD $79,500 and take profits at USD $86,500–87,000.
The market of #BTC is going through a trend reconstruction phase after the 33.23% discount from the October 2025 high.
{future}(BTCUSDT)
#bitcoin $BTC sustains USD $84,000 with slight progress this September 29
Backed by volumes above their average and a notable flow of institutional buying. However, a mildly bearish MACD, the absence of fresh leverage, and resistance at USD $87.331 point to a finely balanced market: the medium-term bullish thesis remains intact, requiring patience and strict risk management.
The move over the last 72 hours—up 1.27% yesterday and up 0.90% today, after an intraday low of USD $83,012.36—has a confirmed catalyst from sources: institutional demand.
BTC’s valuation rests on three verifiable pillars in the current data. First, structural demand: Strategy with 847,666 BTC, Strive with 27,462 BTC, and Spark’s $210 million credit infrastructure create a buffer for absorbing supply that has historically softened corrections.
Methodology applied: scoring five technical signals and one flow signal.
In favor:
(1) price above the SMA-30, SMA-50, and SMA-90;
(2) RSI at 62.3 with healthy momentum;
(3) daily volume 12.15% above average with price in positive territory;
(4) Bollinger %B at 73.4 with no extreme overbought;
(5) 90-day return of +38.62% confirming a foundational trend.
Against:
(1) MACD with histogram at -21.37;
(2) weekly loss of 3.35% and price marginally below the SMA-7.
With four out of seven signals in favor, high spot participation, and a confirmed institutional catalyst, the recommendation is HOLD (AGUANTAR) existing positions—without aggressive buying at current prices due to the consolidation risk suggested by the MACD.
For the short term: trade the USD $80,900–84,300 range, buy near the SMA-20 (USD $80,941.56) with a stop-loss below USD $79,500 and take profits at USD $86,500–87,000.
The market of #BTC is going through a trend reconstruction phase after the 33.23% discount from the October 2025 high.
Backed by volumes above their average and a notable flow of institutional buying. However, a mildly bearish MACD, the absence of fresh leverage, and resistance at USD $87.331 point to a finely balanced market: the medium-term bullish thesis remains intact, requiring patience and strict risk management.
The move over the last 72 hours—up 1.27% yesterday and up 0.90% today, after an intraday low of USD $83,012.36—has a confirmed catalyst from sources: institutional demand.
BTC’s valuation rests on three verifiable pillars in the current data. First, structural demand: Strategy with 847,666 BTC, Strive with 27,462 BTC, and Spark’s $210 million credit infrastructure create a buffer for absorbing supply that has historically softened corrections.
Methodology applied: scoring five technical signals and one flow signal.
In favor:
(1) price above the SMA-30, SMA-50, and SMA-90;
(2) RSI at 62.3 with healthy momentum;
(3) daily volume 12.15% above average with price in positive territory;
(4) Bollinger %B at 73.4 with no extreme overbought;
(5) 90-day return of +38.62% confirming a foundational trend.
Against:
(1) MACD with histogram at -21.37;
(2) weekly loss of 3.35% and price marginally below the SMA-7.
With four out of seven signals in favor, high spot participation, and a confirmed institutional catalyst, the recommendation is HOLD (AGUANTAR) existing positions—without aggressive buying at current prices due to the consolidation risk suggested by the MACD.
For the short term: trade the USD $80,900–84,300 range, buy near the SMA-20 (USD $80,941.56) with a stop-loss below USD $79,500 and take profits at USD $86,500–87,000.
The market of #BTC is going through a trend reconstruction phase after the 33.23% discount from the October 2025 high.

151
$XRP accumulate strength under USD $1,60 resistance, and investors are watching Ripple’s unlock
#xrp trades near USD $1,51 after gaining 2% over the past 24 hours, with trading volume 20% above its 30-day average. Whale accumulation, institutional buying via an ETF, and a recently bullish MACD fuel a constructive outlook, even as resistance at USD $1,60, Ripple’s scheduled monthly unlock on October 1, and Evernorth’s vote pose risks that investors can’t ignore.
XRP ETFs have accumulated 1.180 billion tokens ahead of Ripple’s monthly unlock, suggesting asset managers are absorbing supply in advance—an approach that implies expectations of a post-event revaluation.
XRP keeps its core utility as a liquidity asset for cross-border payments within the Ripple ecosystem, and the demand visible today isn’t driven by retail speculation; rather, it comes from regulated vehicles: the ETFs holding 1.180 billion tokens in custody represent a structural demand base that doesn’t disappear with day-to-day volatility.
Recommendation: HOLD, with staggered buys only on pullbacks. Methodology applied across five signals:
(1) trend, favorable, with price above the SMA-15, SMA-30, SMA-50, SMA-90, and SMA-200;
(2) momentum, favorable, with MACD just crossing upward and RSI at 56.2 with room;
(3) volume, favorable, with 4.43 MMD—20% above average;
(4) resistance structure, neutral, since USD $1,60 continues to cap the price despite whale accumulation;
(5) supply risk, unfavorable, due to Ripple’s monthly unlock and the Evernorth risk. Result: 3 out of 5 signals are in favor.
Short term: trade the USD $1,47–1,55 range. Enter on a pullback to USD $1,47–1,48, set a stop-loss below USD $1,45, and take profit at USD $1,55.
XRP shows a medium-term bullish trend setup with short-term momentum just activated and verifiable institutional demand.
{future}(XRPUSDT)
$XRP accumulate strength under USD $1,60 resistance, and investors are watching Ripple’s unlock
#xrp trades near USD $1,51 after gaining 2% over the past 24 hours, with trading volume 20% above its 30-day average. Whale accumulation, institutional buying via an ETF, and a recently bullish MACD fuel a constructive outlook, even as resistance at USD $1,60, Ripple’s scheduled monthly unlock on October 1, and Evernorth’s vote pose risks that investors can’t ignore.
XRP ETFs have accumulated 1.180 billion tokens ahead of Ripple’s monthly unlock, suggesting asset managers are absorbing supply in advance—an approach that implies expectations of a post-event revaluation.
XRP keeps its core utility as a liquidity asset for cross-border payments within the Ripple ecosystem, and the demand visible today isn’t driven by retail speculation; rather, it comes from regulated vehicles: the ETFs holding 1.180 billion tokens in custody represent a structural demand base that doesn’t disappear with day-to-day volatility.
Recommendation: HOLD, with staggered buys only on pullbacks. Methodology applied across five signals:
(1) trend, favorable, with price above the SMA-15, SMA-30, SMA-50, SMA-90, and SMA-200;
(2) momentum, favorable, with MACD just crossing upward and RSI at 56.2 with room;
(3) volume, favorable, with 4.43 MMD—20% above average;
(4) resistance structure, neutral, since USD $1,60 continues to cap the price despite whale accumulation;
(5) supply risk, unfavorable, due to Ripple’s monthly unlock and the Evernorth risk. Result: 3 out of 5 signals are in favor.
Short term: trade the USD $1,47–1,55 range. Enter on a pullback to USD $1,47–1,48, set a stop-loss below USD $1,45, and take profit at USD $1,55.
XRP shows a medium-term bullish trend setup with short-term momentum just activated and verifiable institutional demand.
#xrp trades near USD $1,51 after gaining 2% over the past 24 hours, with trading volume 20% above its 30-day average. Whale accumulation, institutional buying via an ETF, and a recently bullish MACD fuel a constructive outlook, even as resistance at USD $1,60, Ripple’s scheduled monthly unlock on October 1, and Evernorth’s vote pose risks that investors can’t ignore.
XRP ETFs have accumulated 1.180 billion tokens ahead of Ripple’s monthly unlock, suggesting asset managers are absorbing supply in advance—an approach that implies expectations of a post-event revaluation.
XRP keeps its core utility as a liquidity asset for cross-border payments within the Ripple ecosystem, and the demand visible today isn’t driven by retail speculation; rather, it comes from regulated vehicles: the ETFs holding 1.180 billion tokens in custody represent a structural demand base that doesn’t disappear with day-to-day volatility.
Recommendation: HOLD, with staggered buys only on pullbacks. Methodology applied across five signals:
(1) trend, favorable, with price above the SMA-15, SMA-30, SMA-50, SMA-90, and SMA-200;
(2) momentum, favorable, with MACD just crossing upward and RSI at 56.2 with room;
(3) volume, favorable, with 4.43 MMD—20% above average;
(4) resistance structure, neutral, since USD $1,60 continues to cap the price despite whale accumulation;
(5) supply risk, unfavorable, due to Ripple’s monthly unlock and the Evernorth risk. Result: 3 out of 5 signals are in favor.
Short term: trade the USD $1,47–1,55 range. Enter on a pullback to USD $1,47–1,48, set a stop-loss below USD $1,45, and take profit at USD $1,55.
XRP shows a medium-term bullish trend setup with short-term momentum just activated and verifiable institutional demand.

1
1
786
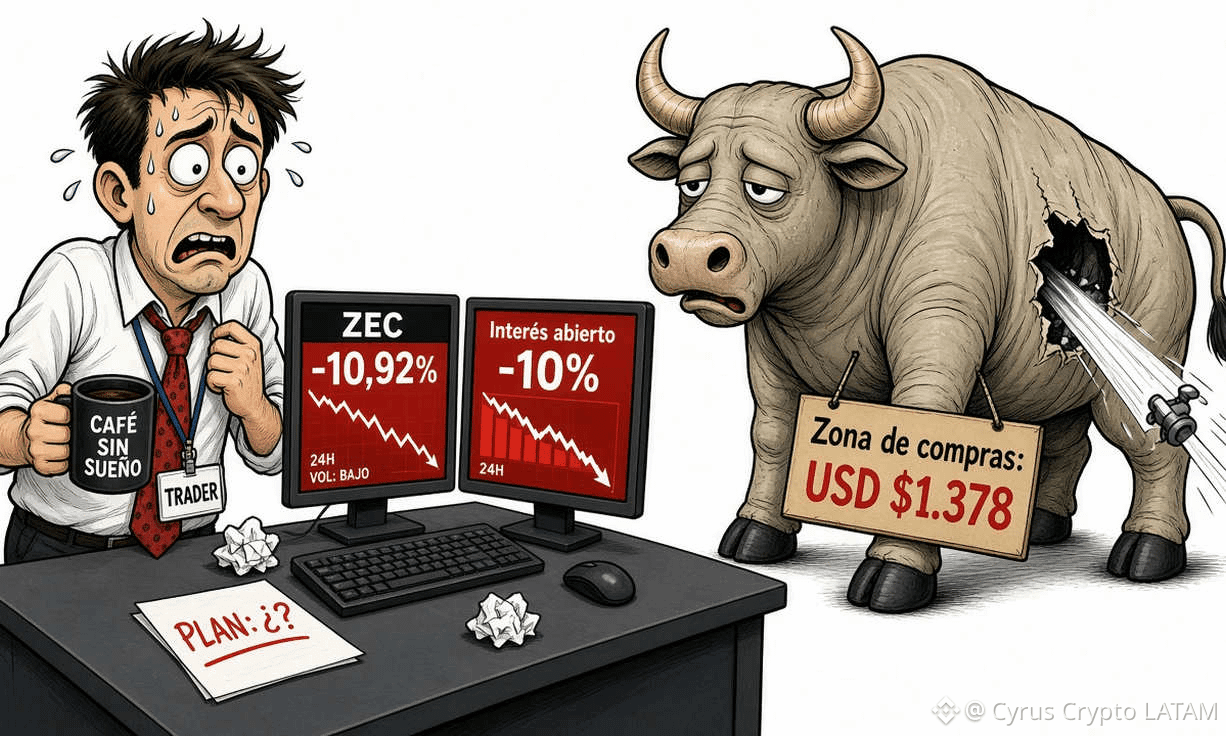
$ZEC cae after its parabolic rally: profit-taking and a contraction in open interest
#zec recedes 10.92% in 24 hours to USD $1,456.43 after touching intraday highs of USD $1,593.72, pointing to profit-taking following a parabolic rally of 75.95% over 30 days.
CoinMarketCap’s analysis explicitly attributes the asset’s drop to profit-taking after the recent parabolic rise, and the technical evidence is consistent: ZEC gained +27.14% in 14 days and +75.95% in 30 days, building a huge base of buyers in profit who are now taking gains.
Its core utility—value transfer with verifiable confidentiality—is unique among large-cap assets, and recent evidence of shielded activity at four-year highs suggests real adoption of privacy functionality is growing, not just speculation about price.
Recommendation: HOLD (AGUANTAR) with staggered partial buys only in the support zone.
Explicit methodology, 3 out of 6 signals in favor of holding:
(1) RSI at 58.1 neutral-bullish after the pullback, in favor;
(2) structure of the longer SMA (30/50/90/200 days) entirely bullish, in favor;
(3) open interest falling 10% with not-elevated volume, indicative of distribution rather than capitulation, in favor;
(4) MACD turned bearish with histogram -12.54, against buying right now;
(5) price 5.80% below intraday VWAP with declining highs, against;
(6) failed opening at USD $1,634.64 that leaves buyers trapped above, against near-term aggressiveness.
Short term (days to weeks): experienced traders can trade the range USD $1,380 – USD $1,600. Partial buy at USD $1,385 – $1,400 with a loss limit below USD $1,355
ZEC is going through its first serious correction after a parabolic rally of +75.95% over 30 days, catalyzed by the debut of the European ETP and cooled by profit-taking and deleveraging in derivatives.
{future}(ZECUSDT)
$ZEC cae after its parabolic rally: profit-taking and a contraction in open interest
#zec recedes 10.92% in 24 hours to USD $1,456.43 after touching intraday highs of USD $1,593.72, pointing to profit-taking following a parabolic rally of 75.95% over 30 days.
CoinMarketCap’s analysis explicitly attributes the asset’s drop to profit-taking after the recent parabolic rise, and the technical evidence is consistent: ZEC gained +27.14% in 14 days and +75.95% in 30 days, building a huge base of buyers in profit who are now taking gains.
Its core utility—value transfer with verifiable confidentiality—is unique among large-cap assets, and recent evidence of shielded activity at four-year highs suggests real adoption of privacy functionality is growing, not just speculation about price.
Recommendation: HOLD (AGUANTAR) with staggered partial buys only in the support zone.
Explicit methodology, 3 out of 6 signals in favor of holding:
(1) RSI at 58.1 neutral-bullish after the pullback, in favor;
(2) structure of the longer SMA (30/50/90/200 days) entirely bullish, in favor;
(3) open interest falling 10% with not-elevated volume, indicative of distribution rather than capitulation, in favor;
(4) MACD turned bearish with histogram -12.54, against buying right now;
(5) price 5.80% below intraday VWAP with declining highs, against;
(6) failed opening at USD $1,634.64 that leaves buyers trapped above, against near-term aggressiveness.
Short term (days to weeks): experienced traders can trade the range USD $1,380 – USD $1,600. Partial buy at USD $1,385 – $1,400 with a loss limit below USD $1,355
ZEC is going through its first serious correction after a parabolic rally of +75.95% over 30 days, catalyzed by the debut of the European ETP and cooled by profit-taking and deleveraging in derivatives.
#zec recedes 10.92% in 24 hours to USD $1,456.43 after touching intraday highs of USD $1,593.72, pointing to profit-taking following a parabolic rally of 75.95% over 30 days.
CoinMarketCap’s analysis explicitly attributes the asset’s drop to profit-taking after the recent parabolic rise, and the technical evidence is consistent: ZEC gained +27.14% in 14 days and +75.95% in 30 days, building a huge base of buyers in profit who are now taking gains.
Its core utility—value transfer with verifiable confidentiality—is unique among large-cap assets, and recent evidence of shielded activity at four-year highs suggests real adoption of privacy functionality is growing, not just speculation about price.
Recommendation: HOLD (AGUANTAR) with staggered partial buys only in the support zone.
Explicit methodology, 3 out of 6 signals in favor of holding:
(1) RSI at 58.1 neutral-bullish after the pullback, in favor;
(2) structure of the longer SMA (30/50/90/200 days) entirely bullish, in favor;
(3) open interest falling 10% with not-elevated volume, indicative of distribution rather than capitulation, in favor;
(4) MACD turned bearish with histogram -12.54, against buying right now;
(5) price 5.80% below intraday VWAP with declining highs, against;
(6) failed opening at USD $1,634.64 that leaves buyers trapped above, against near-term aggressiveness.
Short term (days to weeks): experienced traders can trade the range USD $1,380 – USD $1,600. Partial buy at USD $1,385 – $1,400 with a loss limit below USD $1,355
ZEC is going through its first serious correction after a parabolic rally of +75.95% over 30 days, catalyzed by the debut of the European ETP and cooled by profit-taking and deleveraging in derivatives.
1
617
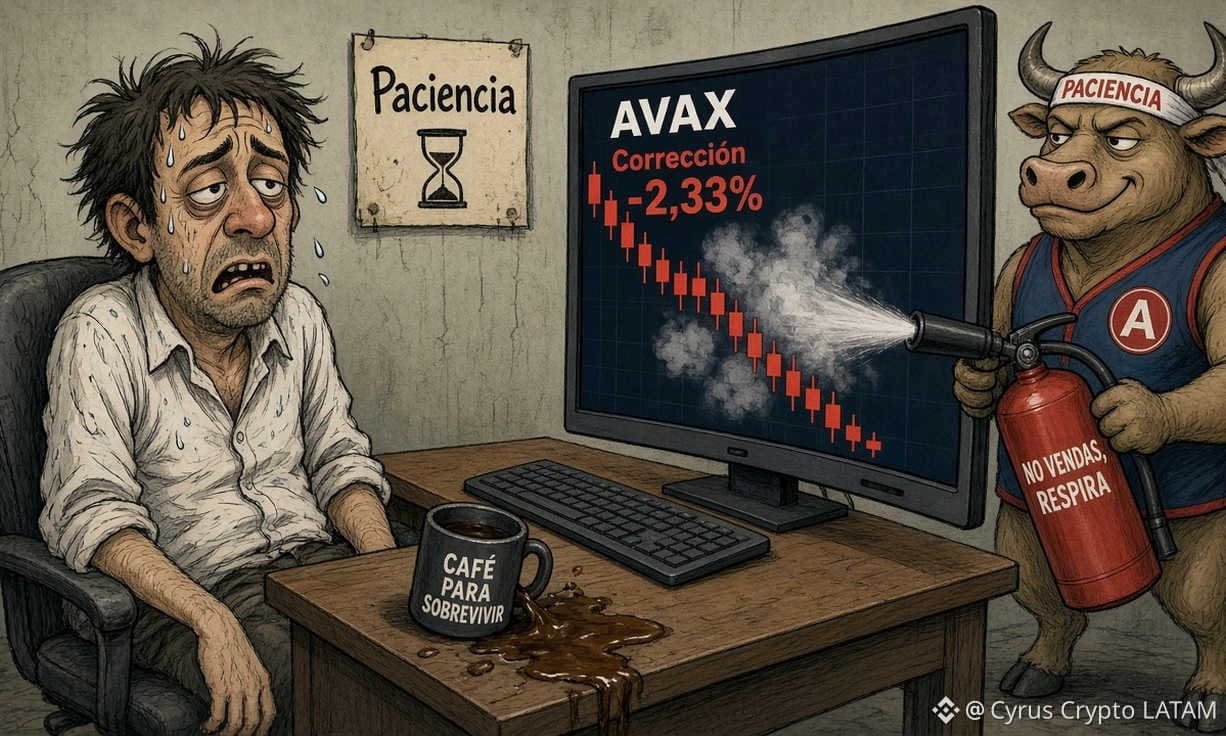
$AVAX retreats 2.33% and tests buyers
#Avalanche drops 2.33% over the last 24 hours to USD $10.43, slowing the momentum that had led it to gain more than 43% over the month. The pullback is occurring with volume above the 30-day average, suggesting partial distribution rather than a market selloff.
The 2.33% cut in 24 hours, and the 3.79% drop over 7 days, contrasts with the monthly performance and calls for separating noise from signal. The most relevant context is that AVAX had climbed to USD $11.23 yesterday, expanding a daily range of USD $0.59, and today slipped to a low of USD $10.17 before stabilizing near the 23.6% Fibonacci level of the 90-day range (USD $10.41).
Avalanche is a Layer 1 proof-of-stake network built for smart contracts, institutional finance, and asset tokenization. With a market cap of USD $4.62 billion, it sits in a competitive segment where it competes for institutional adoption against networks with higher activity rates.
Recommendation: HOLD for existing positions, with staggered buying only if the price holds USD $10.17–$10.41 with volume confirmation.
The applied methodology weighs five signals: trend structure (bullish, 4 out of 5 moving averages surpassed), MACD (bullish), RSI (neutral-positive at 64.6), intraday price action (bearish, below SMA-5/10 and VWAP), and volume (elevated, with no confirmed direction). The tally is 2/5 clear buy signals, 1/5 sell signals, and 2/5 neutral—insufficient for a fresh full entry, but enough to avoid liquidating positions while the medium-term structure remains intact.
Short term: wait for bounce confirmation at USD $10.17–$10.41, or for a close above USD $10.67 to enter. Stop-loss under USD $10.10 and take-profit at USD $11.20. Avoid chasing the price below the intraday VWAP.
For now, AVAX’s correction looks like a temperature check episode within a 90-day uptrend that lifted the price by more than 55%.
{future}(AVAXUSDT)
$AVAX retreats 2.33% and tests buyers
#Avalanche drops 2.33% over the last 24 hours to USD $10.43, slowing the momentum that had led it to gain more than 43% over the month. The pullback is occurring with volume above the 30-day average, suggesting partial distribution rather than a market selloff.
The 2.33% cut in 24 hours, and the 3.79% drop over 7 days, contrasts with the monthly performance and calls for separating noise from signal. The most relevant context is that AVAX had climbed to USD $11.23 yesterday, expanding a daily range of USD $0.59, and today slipped to a low of USD $10.17 before stabilizing near the 23.6% Fibonacci level of the 90-day range (USD $10.41).
Avalanche is a Layer 1 proof-of-stake network built for smart contracts, institutional finance, and asset tokenization. With a market cap of USD $4.62 billion, it sits in a competitive segment where it competes for institutional adoption against networks with higher activity rates.
Recommendation: HOLD for existing positions, with staggered buying only if the price holds USD $10.17–$10.41 with volume confirmation.
The applied methodology weighs five signals: trend structure (bullish, 4 out of 5 moving averages surpassed), MACD (bullish), RSI (neutral-positive at 64.6), intraday price action (bearish, below SMA-5/10 and VWAP), and volume (elevated, with no confirmed direction). The tally is 2/5 clear buy signals, 1/5 sell signals, and 2/5 neutral—insufficient for a fresh full entry, but enough to avoid liquidating positions while the medium-term structure remains intact.
Short term: wait for bounce confirmation at USD $10.17–$10.41, or for a close above USD $10.67 to enter. Stop-loss under USD $10.10 and take-profit at USD $11.20. Avoid chasing the price below the intraday VWAP.
For now, AVAX’s correction looks like a temperature check episode within a 90-day uptrend that lifted the price by more than 55%.
#Avalanche drops 2.33% over the last 24 hours to USD $10.43, slowing the momentum that had led it to gain more than 43% over the month. The pullback is occurring with volume above the 30-day average, suggesting partial distribution rather than a market selloff.
The 2.33% cut in 24 hours, and the 3.79% drop over 7 days, contrasts with the monthly performance and calls for separating noise from signal. The most relevant context is that AVAX had climbed to USD $11.23 yesterday, expanding a daily range of USD $0.59, and today slipped to a low of USD $10.17 before stabilizing near the 23.6% Fibonacci level of the 90-day range (USD $10.41).
Avalanche is a Layer 1 proof-of-stake network built for smart contracts, institutional finance, and asset tokenization. With a market cap of USD $4.62 billion, it sits in a competitive segment where it competes for institutional adoption against networks with higher activity rates.
Recommendation: HOLD for existing positions, with staggered buying only if the price holds USD $10.17–$10.41 with volume confirmation.
The applied methodology weighs five signals: trend structure (bullish, 4 out of 5 moving averages surpassed), MACD (bullish), RSI (neutral-positive at 64.6), intraday price action (bearish, below SMA-5/10 and VWAP), and volume (elevated, with no confirmed direction). The tally is 2/5 clear buy signals, 1/5 sell signals, and 2/5 neutral—insufficient for a fresh full entry, but enough to avoid liquidating positions while the medium-term structure remains intact.
Short term: wait for bounce confirmation at USD $10.17–$10.41, or for a close above USD $10.67 to enter. Stop-loss under USD $10.10 and take-profit at USD $11.20. Avoid chasing the price below the intraday VWAP.
For now, AVAX’s correction looks like a temperature check episode within a 90-day uptrend that lifted the price by more than 55%.
306
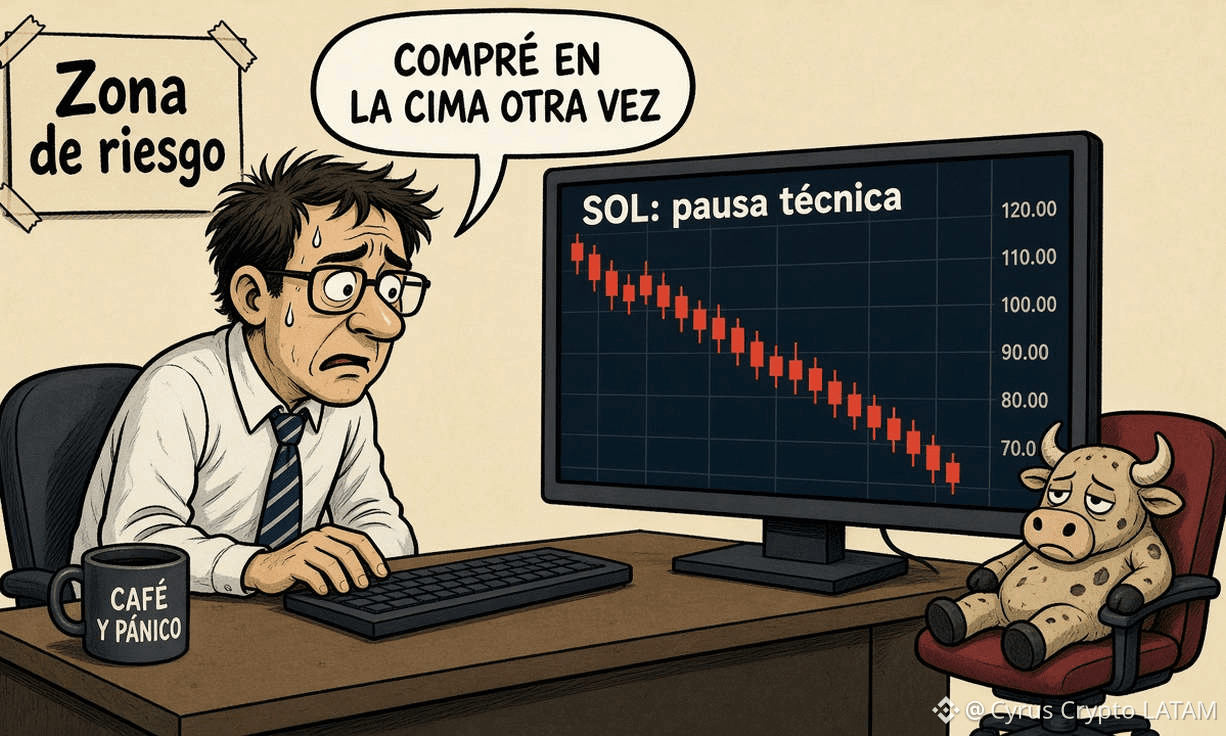
#solana $SOL retrocedes 1.40% and tests its bullish structure this September 28
Solana retreats 1.40% to USD $118.49 in a day of profit-taking after weeks of strong bullish momentum, although the medium-term technical structure remains intact: price is still above all its major moving averages, and SOL ETFs continue to capture record inflows.
Market evidence supports it: SOL reached USD $124 on September 27 after rising 68% in two months, and today it moves away from the 90-day high of USD $124.58, with a price trading 1.47% below the intraday VWAP of USD $120.26—signaling that sellers dominated the session.
Solana maintains a market capitalization of USD $69.65 billion, placing it among the sector’s highest-cap assets, with a price 59.61% below its all-time high of USD $293.41 on January 19, 2025. That discount versus the ATH, combined with a 56.80% return over 90 days, points to an asset in a valuation rebuilding phase after a deep bearish cycle.
Recommendation: HOLD, with staggered buys only on pullbacks to defined support levels.
Methodology: out of five signals evaluated, three support further upside and two advise caution. In favor: trend aligned across all SMAs (bullish), MACD with a positive histogram (bullish), and confirmed institutional flows via ETFs (bullish). Against: stochastic at 78.5 near overbought (caution) and price below the intraday VWAP with short-term selling pressure (caution). Elevated volume, up 8.47% over average, validates interest without confirming aggressive distribution.
Short term: wait for tests of USD $118.35 (SMA-7) or USD $116.75 (SMA-10), using reaction candles to enter; stop-loss below USD $111.05 and partial profit-taking at USD $124.58.
Solana is going through a digestive pause within a three-month uptrend, with institutional catalysts still active and downside macro risks.
{future}(SOLUSDT)
#solana $SOL retrocedes 1.40% and tests its bullish structure this September 28
Solana retreats 1.40% to USD $118.49 in a day of profit-taking after weeks of strong bullish momentum, although the medium-term technical structure remains intact: price is still above all its major moving averages, and SOL ETFs continue to capture record inflows.
Market evidence supports it: SOL reached USD $124 on September 27 after rising 68% in two months, and today it moves away from the 90-day high of USD $124.58, with a price trading 1.47% below the intraday VWAP of USD $120.26—signaling that sellers dominated the session.
Solana maintains a market capitalization of USD $69.65 billion, placing it among the sector’s highest-cap assets, with a price 59.61% below its all-time high of USD $293.41 on January 19, 2025. That discount versus the ATH, combined with a 56.80% return over 90 days, points to an asset in a valuation rebuilding phase after a deep bearish cycle.
Recommendation: HOLD, with staggered buys only on pullbacks to defined support levels.
Methodology: out of five signals evaluated, three support further upside and two advise caution. In favor: trend aligned across all SMAs (bullish), MACD with a positive histogram (bullish), and confirmed institutional flows via ETFs (bullish). Against: stochastic at 78.5 near overbought (caution) and price below the intraday VWAP with short-term selling pressure (caution). Elevated volume, up 8.47% over average, validates interest without confirming aggressive distribution.
Short term: wait for tests of USD $118.35 (SMA-7) or USD $116.75 (SMA-10), using reaction candles to enter; stop-loss below USD $111.05 and partial profit-taking at USD $124.58.
Solana is going through a digestive pause within a three-month uptrend, with institutional catalysts still active and downside macro risks.
Solana retreats 1.40% to USD $118.49 in a day of profit-taking after weeks of strong bullish momentum, although the medium-term technical structure remains intact: price is still above all its major moving averages, and SOL ETFs continue to capture record inflows.
Market evidence supports it: SOL reached USD $124 on September 27 after rising 68% in two months, and today it moves away from the 90-day high of USD $124.58, with a price trading 1.47% below the intraday VWAP of USD $120.26—signaling that sellers dominated the session.
Solana maintains a market capitalization of USD $69.65 billion, placing it among the sector’s highest-cap assets, with a price 59.61% below its all-time high of USD $293.41 on January 19, 2025. That discount versus the ATH, combined with a 56.80% return over 90 days, points to an asset in a valuation rebuilding phase after a deep bearish cycle.
Recommendation: HOLD, with staggered buys only on pullbacks to defined support levels.
Methodology: out of five signals evaluated, three support further upside and two advise caution. In favor: trend aligned across all SMAs (bullish), MACD with a positive histogram (bullish), and confirmed institutional flows via ETFs (bullish). Against: stochastic at 78.5 near overbought (caution) and price below the intraday VWAP with short-term selling pressure (caution). Elevated volume, up 8.47% over average, validates interest without confirming aggressive distribution.
Short term: wait for tests of USD $118.35 (SMA-7) or USD $116.75 (SMA-10), using reaction candles to enter; stop-loss below USD $111.05 and partial profit-taking at USD $124.58.
Solana is going through a digestive pause within a three-month uptrend, with institutional catalysts still active and downside macro risks.
158
ICP falls 5.83% and moves away from the breakout zone that bulls are watching
#InternetComputer $ICP retreats 5.83% in 24 hours to USD $2.98, breaking a winning streak that had brought it to accumulate a 21.94% return over 30 days. We analyze the catalysts, the technical levels that define the next move, and what strategy suits each investor profile.
Macro data released on September 24 shows that greater business activity in the U.S. lifted Treasury yields and strengthened the dollar, triggering risk-off sentiment in digital markets. ICP, with an annualized volatility of 73%, is particularly sensitive to these rotation episodes.
Internet Computer is a decentralized computing platform that aims to run web applications directly on the blockchain, competing in the Layer 1 infrastructure segment alongside Solana, Avalanche, and Polkadot. Its utility as a general-purpose computing network provides a differentiated underlying narrative compared with purely speculative altcoins.
Recommendation: HOLD. Explicit methodology: among five technical signals evaluated, three favor holding the position.
Reasons to HOLD:
(1) price remains above the SMA-15 to SMA-200, keeping the underlying trend intact;
(2) the MACD remains in a bullish setup despite the drop;
(3) the 30-day (+21.94%) and 90-day (+39.47%) returns confirm structural momentum.
Against:
(1) a distribution candle with volume 21.52% higher than average
(2) price below the intraday VWAP with a falling RSI.
There is no confirmed sell signal (no break below USD $2.86) and no optimal re-entry (no rebound confirmation with volume).
Short term: tactical traders can watch for a confirmed rebound above USD $3.02–3.05 with volume to enter with a stop-loss below USD $2.86 and take-profit at USD $3.24.
The 5.83% drop of #icp is, in essence, a systematic correction in the crypto market, amplified by profit-taking after a quarterly rally of 39.47%.
{future}(ICPUSDT)
ICP falls 5.83% and moves away from the breakout zone that bulls are watching
#InternetComputer $ICP retreats 5.83% in 24 hours to USD $2.98, breaking a winning streak that had brought it to accumulate a 21.94% return over 30 days. We analyze the catalysts, the technical levels that define the next move, and what strategy suits each investor profile.
Macro data released on September 24 shows that greater business activity in the U.S. lifted Treasury yields and strengthened the dollar, triggering risk-off sentiment in digital markets. ICP, with an annualized volatility of 73%, is particularly sensitive to these rotation episodes.
Internet Computer is a decentralized computing platform that aims to run web applications directly on the blockchain, competing in the Layer 1 infrastructure segment alongside Solana, Avalanche, and Polkadot. Its utility as a general-purpose computing network provides a differentiated underlying narrative compared with purely speculative altcoins.
Recommendation: HOLD. Explicit methodology: among five technical signals evaluated, three favor holding the position.
Reasons to HOLD:
(1) price remains above the SMA-15 to SMA-200, keeping the underlying trend intact;
(2) the MACD remains in a bullish setup despite the drop;
(3) the 30-day (+21.94%) and 90-day (+39.47%) returns confirm structural momentum.
Against:
(1) a distribution candle with volume 21.52% higher than average
(2) price below the intraday VWAP with a falling RSI.
There is no confirmed sell signal (no break below USD $2.86) and no optimal re-entry (no rebound confirmation with volume).
Short term: tactical traders can watch for a confirmed rebound above USD $3.02–3.05 with volume to enter with a stop-loss below USD $2.86 and take-profit at USD $3.24.
The 5.83% drop of #icp is, in essence, a systematic correction in the crypto market, amplified by profit-taking after a quarterly rally of 39.47%.
#InternetComputer $ICP retreats 5.83% in 24 hours to USD $2.98, breaking a winning streak that had brought it to accumulate a 21.94% return over 30 days. We analyze the catalysts, the technical levels that define the next move, and what strategy suits each investor profile.
Macro data released on September 24 shows that greater business activity in the U.S. lifted Treasury yields and strengthened the dollar, triggering risk-off sentiment in digital markets. ICP, with an annualized volatility of 73%, is particularly sensitive to these rotation episodes.
Internet Computer is a decentralized computing platform that aims to run web applications directly on the blockchain, competing in the Layer 1 infrastructure segment alongside Solana, Avalanche, and Polkadot. Its utility as a general-purpose computing network provides a differentiated underlying narrative compared with purely speculative altcoins.
Recommendation: HOLD. Explicit methodology: among five technical signals evaluated, three favor holding the position.
Reasons to HOLD:
(1) price remains above the SMA-15 to SMA-200, keeping the underlying trend intact;
(2) the MACD remains in a bullish setup despite the drop;
(3) the 30-day (+21.94%) and 90-day (+39.47%) returns confirm structural momentum.
Against:
(1) a distribution candle with volume 21.52% higher than average
(2) price below the intraday VWAP with a falling RSI.
There is no confirmed sell signal (no break below USD $2.86) and no optimal re-entry (no rebound confirmation with volume).
Short term: tactical traders can watch for a confirmed rebound above USD $3.02–3.05 with volume to enter with a stop-loss below USD $2.86 and take-profit at USD $3.24.
The 5.83% drop of #icp is, in essence, a systematic correction in the crypto market, amplified by profit-taking after a quarterly rally of 39.47%.

1
145
$XRP consolidates near USD $1.49 as the market awaits key catalysts
#xrp trades at USD $1.49, down 0.88% over the last 24 hours, amid a broad pullback in the crypto market. However, daily volume is 30% higher than the 30-day average, and whales are accumulating near the USD $1.60 resistance.
The 0.88% drop is consistent with a broad pullback in the crypto market. Market evidence shows Bitcoin around USD $82,923, with a decline close to 2% in 24 hours, and combined liquidations of Bitcoin and Ethereum totaling USD $83.88M in 24 hours—equivalent to 82.6% of the total. When the reference asset weakens, high-cap altcoins like XRP tend to absorb proportional selling pressure.
XRP acts as an XRP #Ledger liquidation asset, with its main utility in cross-border payments and institutional liquidity—a monetized use case indirectly through adoption by payment entities and, more recently, by regulated investment vehicles.
Recommendation: HOLD, with a gradual accumulation bias. The applied methodology weighs five signals: medium-term trend (bullish, price above the 30-day SMA of USD $1.41), MACD (positive, histogram 0.0026), RSI (55.1, neutral), volume (elevated, +30% vs. average, but with a bearish candle, mixed signal), and position vs. VWAP (negative, -0.61%). The result is 3 out of 5 signals in favor, with context of prior compression ahead of catalysts.
Short term: trade the USD $1.44–$1.52 range. Enter on pullbacks to USD $1.46–$1.48, stop-loss below USD $1.43, take profit at USD $1.51–$1.52. Aggressive alternative: buy a breakout of USD $1.52 with volume above average, target USD $1.60.
XRP shows a technical consolidation setup within a bullish medium-term trend, with the outcome nearby conditioned on the September 30 catalysts and the balance between institutional ETF demand and Ripple’s monthly unlock
{future}(XRPUSDT)
$XRP consolidates near USD $1.49 as the market awaits key catalysts
#xrp trades at USD $1.49, down 0.88% over the last 24 hours, amid a broad pullback in the crypto market. However, daily volume is 30% higher than the 30-day average, and whales are accumulating near the USD $1.60 resistance.
The 0.88% drop is consistent with a broad pullback in the crypto market. Market evidence shows Bitcoin around USD $82,923, with a decline close to 2% in 24 hours, and combined liquidations of Bitcoin and Ethereum totaling USD $83.88M in 24 hours—equivalent to 82.6% of the total. When the reference asset weakens, high-cap altcoins like XRP tend to absorb proportional selling pressure.
XRP acts as an XRP #Ledger liquidation asset, with its main utility in cross-border payments and institutional liquidity—a monetized use case indirectly through adoption by payment entities and, more recently, by regulated investment vehicles.
Recommendation: HOLD, with a gradual accumulation bias. The applied methodology weighs five signals: medium-term trend (bullish, price above the 30-day SMA of USD $1.41), MACD (positive, histogram 0.0026), RSI (55.1, neutral), volume (elevated, +30% vs. average, but with a bearish candle, mixed signal), and position vs. VWAP (negative, -0.61%). The result is 3 out of 5 signals in favor, with context of prior compression ahead of catalysts.
Short term: trade the USD $1.44–$1.52 range. Enter on pullbacks to USD $1.46–$1.48, stop-loss below USD $1.43, take profit at USD $1.51–$1.52. Aggressive alternative: buy a breakout of USD $1.52 with volume above average, target USD $1.60.
XRP shows a technical consolidation setup within a bullish medium-term trend, with the outcome nearby conditioned on the September 30 catalysts and the balance between institutional ETF demand and Ripple’s monthly unlock
#xrp trades at USD $1.49, down 0.88% over the last 24 hours, amid a broad pullback in the crypto market. However, daily volume is 30% higher than the 30-day average, and whales are accumulating near the USD $1.60 resistance.
The 0.88% drop is consistent with a broad pullback in the crypto market. Market evidence shows Bitcoin around USD $82,923, with a decline close to 2% in 24 hours, and combined liquidations of Bitcoin and Ethereum totaling USD $83.88M in 24 hours—equivalent to 82.6% of the total. When the reference asset weakens, high-cap altcoins like XRP tend to absorb proportional selling pressure.
XRP acts as an XRP #Ledger liquidation asset, with its main utility in cross-border payments and institutional liquidity—a monetized use case indirectly through adoption by payment entities and, more recently, by regulated investment vehicles.
Recommendation: HOLD, with a gradual accumulation bias. The applied methodology weighs five signals: medium-term trend (bullish, price above the 30-day SMA of USD $1.41), MACD (positive, histogram 0.0026), RSI (55.1, neutral), volume (elevated, +30% vs. average, but with a bearish candle, mixed signal), and position vs. VWAP (negative, -0.61%). The result is 3 out of 5 signals in favor, with context of prior compression ahead of catalysts.
Short term: trade the USD $1.44–$1.52 range. Enter on pullbacks to USD $1.46–$1.48, stop-loss below USD $1.43, take profit at USD $1.51–$1.52. Aggressive alternative: buy a breakout of USD $1.52 with volume above average, target USD $1.60.
XRP shows a technical consolidation setup within a bullish medium-term trend, with the outcome nearby conditioned on the September 30 catalysts and the balance between institutional ETF demand and Ripple’s monthly unlock

1
284
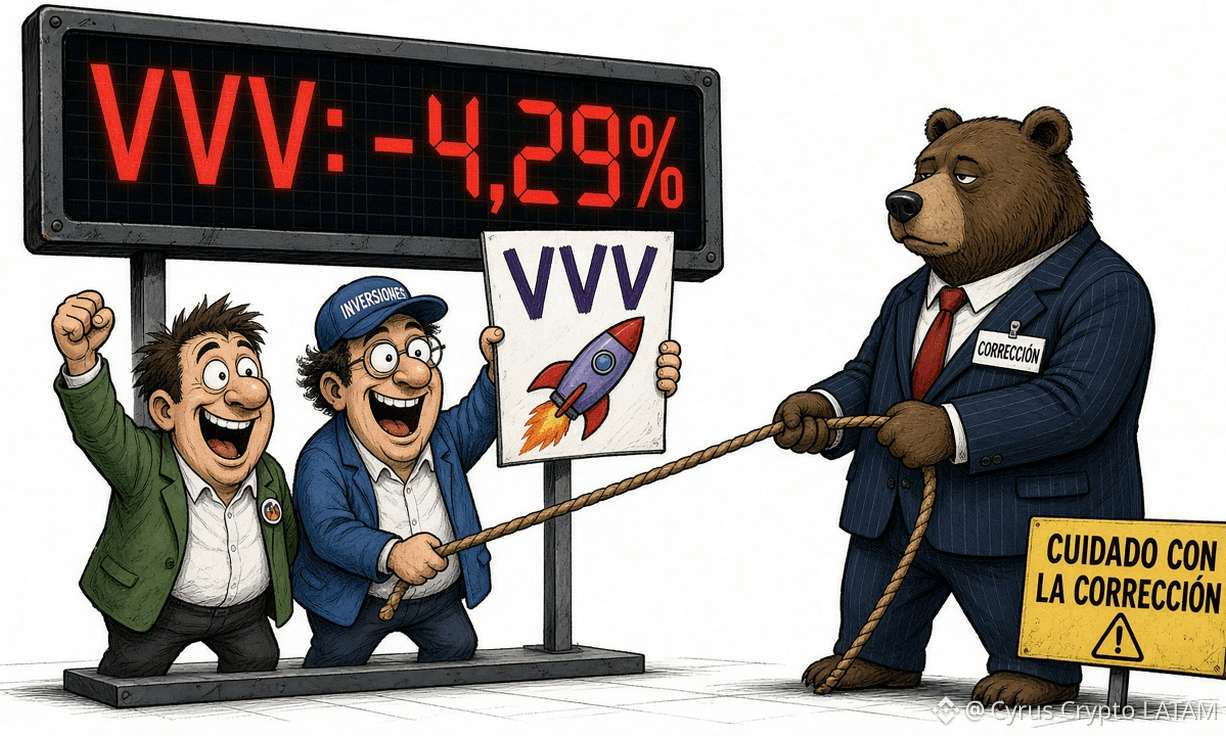
#VeniceToken $VVV corrected with force and moves away from the all-time high of September 21
Venice Token VVV falls 4.29% to USD $28.02 after approaching its all-time high of USD $34.45 reached on September 21, 2026. The drop reflects a natural profit-taking phase after an impressive 69.60% run in 30 days and a 864% gain over 52 weeks.
Confirmed catalyst: our own coverage documented the start of this correction; as Venice Token VVV drops 5.12% on September 26, 2026 during a correction after yearly highs, the token was already showing selling pressure on September 26—two days before the current pullback of -4.29%.
VVV’s valuation shows a market capitalization of USD $1.35 B, placing it as a mid-to-low cap token with an annualized volatility of 169.3% over 30 days. The average volume/market-cap ratio of 4.55% indicates moderate liquidity; today’s decline to 3.54% suggests declining participation during the correction.
Applying a simple five-signal methodology:
(1) price above SMA-30 and SMA-200: in favor of holding;
(2) MACD with a bearish signal: against;
(3) price below SMA-5, SMA-7 and SMA-10: against;
(4) RSI at 57.9 without extreme conditions: neutral;
(5) decreasing sell volume (-22.09% vs 30-day average): neutral-positive, suggesting limited selling pressure.
The score ends 1 in favor, 2 against, and 2 neutral, with the medium-term structural trend still bullish.
The recommendation is HOLD for those who already have a position with accumulated gains, with a stop-loss below USD $26.97.
Short term: aggressive traders may speculate in the USD $26.97–29.33 range, with a stop-loss at USD $26.50 and take-profit at USD $31.00–31.50. With a daily ATR of 9.4%, the position size should be small.
VVV is undergoing its first serious correction after a rally of exceptional proportions.
{future}(VVVUSDT)
#VeniceToken $VVV corrected with force and moves away from the all-time high of September 21
Venice Token VVV falls 4.29% to USD $28.02 after approaching its all-time high of USD $34.45 reached on September 21, 2026. The drop reflects a natural profit-taking phase after an impressive 69.60% run in 30 days and a 864% gain over 52 weeks.
Confirmed catalyst: our own coverage documented the start of this correction; as Venice Token VVV drops 5.12% on September 26, 2026 during a correction after yearly highs, the token was already showing selling pressure on September 26—two days before the current pullback of -4.29%.
VVV’s valuation shows a market capitalization of USD $1.35 B, placing it as a mid-to-low cap token with an annualized volatility of 169.3% over 30 days. The average volume/market-cap ratio of 4.55% indicates moderate liquidity; today’s decline to 3.54% suggests declining participation during the correction.
Applying a simple five-signal methodology:
(1) price above SMA-30 and SMA-200: in favor of holding;
(2) MACD with a bearish signal: against;
(3) price below SMA-5, SMA-7 and SMA-10: against;
(4) RSI at 57.9 without extreme conditions: neutral;
(5) decreasing sell volume (-22.09% vs 30-day average): neutral-positive, suggesting limited selling pressure.
The score ends 1 in favor, 2 against, and 2 neutral, with the medium-term structural trend still bullish.
The recommendation is HOLD for those who already have a position with accumulated gains, with a stop-loss below USD $26.97.
Short term: aggressive traders may speculate in the USD $26.97–29.33 range, with a stop-loss at USD $26.50 and take-profit at USD $31.00–31.50. With a daily ATR of 9.4%, the position size should be small.
VVV is undergoing its first serious correction after a rally of exceptional proportions.
Venice Token VVV falls 4.29% to USD $28.02 after approaching its all-time high of USD $34.45 reached on September 21, 2026. The drop reflects a natural profit-taking phase after an impressive 69.60% run in 30 days and a 864% gain over 52 weeks.
Confirmed catalyst: our own coverage documented the start of this correction; as Venice Token VVV drops 5.12% on September 26, 2026 during a correction after yearly highs, the token was already showing selling pressure on September 26—two days before the current pullback of -4.29%.
VVV’s valuation shows a market capitalization of USD $1.35 B, placing it as a mid-to-low cap token with an annualized volatility of 169.3% over 30 days. The average volume/market-cap ratio of 4.55% indicates moderate liquidity; today’s decline to 3.54% suggests declining participation during the correction.
Applying a simple five-signal methodology:
(1) price above SMA-30 and SMA-200: in favor of holding;
(2) MACD with a bearish signal: against;
(3) price below SMA-5, SMA-7 and SMA-10: against;
(4) RSI at 57.9 without extreme conditions: neutral;
(5) decreasing sell volume (-22.09% vs 30-day average): neutral-positive, suggesting limited selling pressure.
The score ends 1 in favor, 2 against, and 2 neutral, with the medium-term structural trend still bullish.
The recommendation is HOLD for those who already have a position with accumulated gains, with a stop-loss below USD $26.97.
Short term: aggressive traders may speculate in the USD $26.97–29.33 range, with a stop-loss at USD $26.50 and take-profit at USD $31.00–31.50. With a daily ATR of 9.4%, the position size should be small.
VVV is undergoing its first serious correction after a rally of exceptional proportions.
154
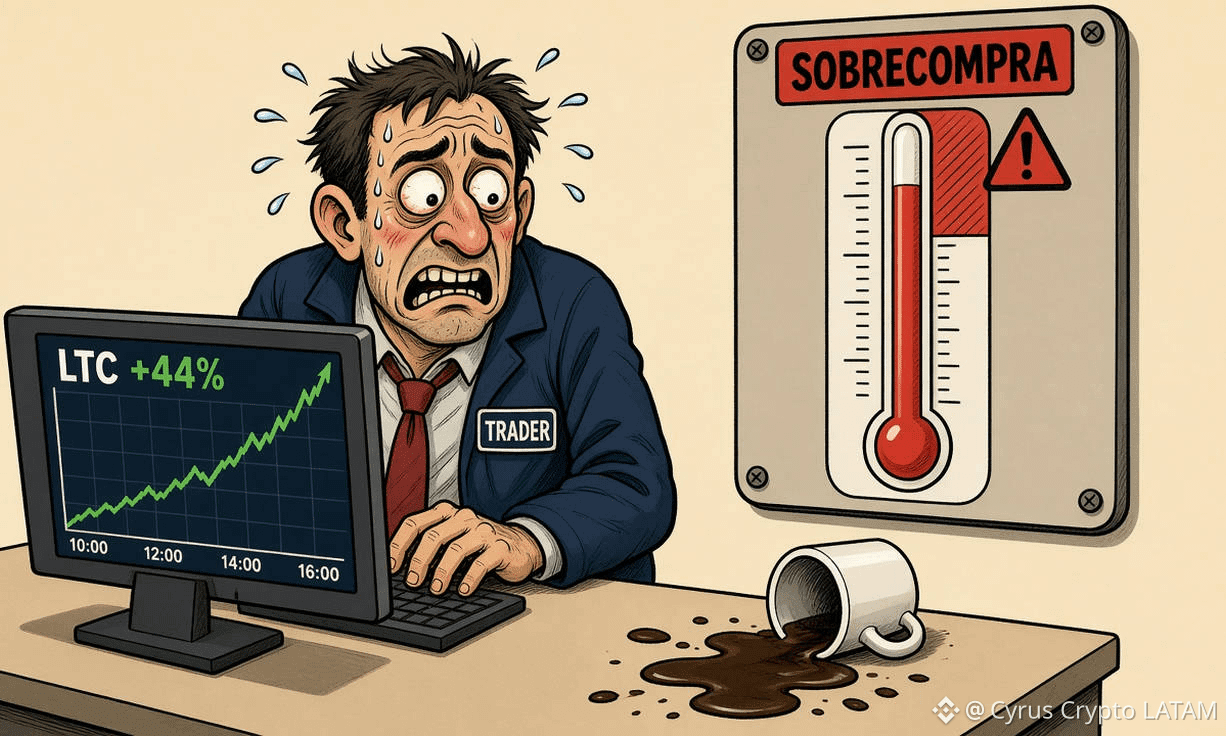
Litecoin retreats 1.44% and LTC strings its first pause after a 44% monthly rally
#Litecoin $LTC retreats 1.44% during the session after an impressive rally that saw it rise 44.63% in 30 days and 64.86% in 90 days, consolidating itself as one of the large-cap altcoins with the best recent performance. With the price at $70.58, technical indicators point to extreme overbought conditions.
The key move is not the 1.44% intraday dip, but the month’s accumulated rally. Market evidence shows that LTC climbed from about $54 on September 17 to levels above $70 one week later, consolidating its position as one of the period’s best-performing major altcoins.
Litecoin is a decentralized payment network derived from Bitcoin’s code, with faster block generation and low fees, keeping it as a reference asset for payments and network testing. Its primary utility is transactional, and its valuation is supported more by brand recognition, longevity, and liquidity than by performance metrics such as DeFi.
Recommendation: HOLD for existing positions and wait for a pullback or consolidation before making new buys.
Explicit methodology: out of 5 technical signals evaluated, 3 favor the bullish continuation (bullish MACD with a histogram of 1.24; price above all SMAs; volume 16.44% above the 30-day average), while 2 warn of immediate risk (RSI at 77.5 and stochastic at 82.5, both in overbought territory; Bollinger %B at 84.5). The price also trades slightly below the intraday VWAP, a sign of short-term weakness.
Short term: avoid market buys in the overbought zone. Consider entries on pullbacks toward $68.36 – $66.95, with a loss limit below $66.95 and take-profit at $72.33 or higher if there is a breakout with volume.
LTC’s rally is real and is backed by increasing volume and a rotation backdrop from Bitcoin into altcoins, with BTC dominance below 60%.
{future}(LTCUSDT)
Litecoin retreats 1.44% and LTC strings its first pause after a 44% monthly rally
#Litecoin $LTC retreats 1.44% during the session after an impressive rally that saw it rise 44.63% in 30 days and 64.86% in 90 days, consolidating itself as one of the large-cap altcoins with the best recent performance. With the price at $70.58, technical indicators point to extreme overbought conditions.
The key move is not the 1.44% intraday dip, but the month’s accumulated rally. Market evidence shows that LTC climbed from about $54 on September 17 to levels above $70 one week later, consolidating its position as one of the period’s best-performing major altcoins.
Litecoin is a decentralized payment network derived from Bitcoin’s code, with faster block generation and low fees, keeping it as a reference asset for payments and network testing. Its primary utility is transactional, and its valuation is supported more by brand recognition, longevity, and liquidity than by performance metrics such as DeFi.
Recommendation: HOLD for existing positions and wait for a pullback or consolidation before making new buys.
Explicit methodology: out of 5 technical signals evaluated, 3 favor the bullish continuation (bullish MACD with a histogram of 1.24; price above all SMAs; volume 16.44% above the 30-day average), while 2 warn of immediate risk (RSI at 77.5 and stochastic at 82.5, both in overbought territory; Bollinger %B at 84.5). The price also trades slightly below the intraday VWAP, a sign of short-term weakness.
Short term: avoid market buys in the overbought zone. Consider entries on pullbacks toward $68.36 – $66.95, with a loss limit below $66.95 and take-profit at $72.33 or higher if there is a breakout with volume.
LTC’s rally is real and is backed by increasing volume and a rotation backdrop from Bitcoin into altcoins, with BTC dominance below 60%.
#Litecoin $LTC retreats 1.44% during the session after an impressive rally that saw it rise 44.63% in 30 days and 64.86% in 90 days, consolidating itself as one of the large-cap altcoins with the best recent performance. With the price at $70.58, technical indicators point to extreme overbought conditions.
The key move is not the 1.44% intraday dip, but the month’s accumulated rally. Market evidence shows that LTC climbed from about $54 on September 17 to levels above $70 one week later, consolidating its position as one of the period’s best-performing major altcoins.
Litecoin is a decentralized payment network derived from Bitcoin’s code, with faster block generation and low fees, keeping it as a reference asset for payments and network testing. Its primary utility is transactional, and its valuation is supported more by brand recognition, longevity, and liquidity than by performance metrics such as DeFi.
Recommendation: HOLD for existing positions and wait for a pullback or consolidation before making new buys.
Explicit methodology: out of 5 technical signals evaluated, 3 favor the bullish continuation (bullish MACD with a histogram of 1.24; price above all SMAs; volume 16.44% above the 30-day average), while 2 warn of immediate risk (RSI at 77.5 and stochastic at 82.5, both in overbought territory; Bollinger %B at 84.5). The price also trades slightly below the intraday VWAP, a sign of short-term weakness.
Short term: avoid market buys in the overbought zone. Consider entries on pullbacks toward $68.36 – $66.95, with a loss limit below $66.95 and take-profit at $72.33 or higher if there is a breakout with volume.
LTC’s rally is real and is backed by increasing volume and a rotation backdrop from Bitcoin into altcoins, with BTC dominance below 60%.
146
$DASH cae up 8.9% in 24 hours: the correction hits after a bullish week
#DASH cede up 8.9% in 24 hours and trades in USD $64.73, in a pullback attributable to a broad liquidation event in the crypto market rather than a specific catalyst for the project.
Trading volume for the day (USD $159.25 million) is 11.46% lower than the 30-day average, and the Volume/Market Cap ratio fell to 19.15% versus a 21.63% average. An 8.9% drop with decreasing volume suggests there was no massive capitulation of spot selling positions; the pressure largely came from deleveraging and the withdrawal of buy-side demand, not from a structural exodus.
DASH’s valuation at USD $831.59 million places it as a mid-cap asset within the niche of coins focused on payments and privacy. Its 52-week performance (184.7%) clearly outpaces most comparable assets in its sector, indicating that the market is re-rating the narrative of decentralized digital payments that the project has defended since its inception.
Recommendation: HOLD. The applied methodology weighs five signals: trend via moving averages (bullish, price above all key SMAs), RSI (58.2, neutral-bullish), MACD (positive histogram, bullish), volume action (below average, neutral), and support structure (the day’s low at USD $64.27 still respects the SMA-7). The result is 3 out of 5 signals in favor and 2 neutral, with no confirmed bearish signals.
Short term (days): hold positions with a loss limit below USD $59.49. Tactical entries only on confirmed bounces above USD $64.27, with profit-taking at USD $67.09–72.57 and a dynamic stop that follows the SMA-7.
DASH is experiencing a tactical 8.9% correction within an unmistakably bullish long-term trend, caused by a sector-wide liquidation event confirmed by market sources and likely amplified by profit-taking after three weeks of euphoria.
{future}(DASHUSDT)
$DASH cae up 8.9% in 24 hours: the correction hits after a bullish week
#DASH cede up 8.9% in 24 hours and trades in USD $64.73, in a pullback attributable to a broad liquidation event in the crypto market rather than a specific catalyst for the project.
Trading volume for the day (USD $159.25 million) is 11.46% lower than the 30-day average, and the Volume/Market Cap ratio fell to 19.15% versus a 21.63% average. An 8.9% drop with decreasing volume suggests there was no massive capitulation of spot selling positions; the pressure largely came from deleveraging and the withdrawal of buy-side demand, not from a structural exodus.
DASH’s valuation at USD $831.59 million places it as a mid-cap asset within the niche of coins focused on payments and privacy. Its 52-week performance (184.7%) clearly outpaces most comparable assets in its sector, indicating that the market is re-rating the narrative of decentralized digital payments that the project has defended since its inception.
Recommendation: HOLD. The applied methodology weighs five signals: trend via moving averages (bullish, price above all key SMAs), RSI (58.2, neutral-bullish), MACD (positive histogram, bullish), volume action (below average, neutral), and support structure (the day’s low at USD $64.27 still respects the SMA-7). The result is 3 out of 5 signals in favor and 2 neutral, with no confirmed bearish signals.
Short term (days): hold positions with a loss limit below USD $59.49. Tactical entries only on confirmed bounces above USD $64.27, with profit-taking at USD $67.09–72.57 and a dynamic stop that follows the SMA-7.
DASH is experiencing a tactical 8.9% correction within an unmistakably bullish long-term trend, caused by a sector-wide liquidation event confirmed by market sources and likely amplified by profit-taking after three weeks of euphoria.
#DASH cede up 8.9% in 24 hours and trades in USD $64.73, in a pullback attributable to a broad liquidation event in the crypto market rather than a specific catalyst for the project.
Trading volume for the day (USD $159.25 million) is 11.46% lower than the 30-day average, and the Volume/Market Cap ratio fell to 19.15% versus a 21.63% average. An 8.9% drop with decreasing volume suggests there was no massive capitulation of spot selling positions; the pressure largely came from deleveraging and the withdrawal of buy-side demand, not from a structural exodus.
DASH’s valuation at USD $831.59 million places it as a mid-cap asset within the niche of coins focused on payments and privacy. Its 52-week performance (184.7%) clearly outpaces most comparable assets in its sector, indicating that the market is re-rating the narrative of decentralized digital payments that the project has defended since its inception.
Recommendation: HOLD. The applied methodology weighs five signals: trend via moving averages (bullish, price above all key SMAs), RSI (58.2, neutral-bullish), MACD (positive histogram, bullish), volume action (below average, neutral), and support structure (the day’s low at USD $64.27 still respects the SMA-7). The result is 3 out of 5 signals in favor and 2 neutral, with no confirmed bearish signals.
Short term (days): hold positions with a loss limit below USD $59.49. Tactical entries only on confirmed bounces above USD $64.27, with profit-taking at USD $67.09–72.57 and a dynamic stop that follows the SMA-7.
DASH is experiencing a tactical 8.9% correction within an unmistakably bullish long-term trend, caused by a sector-wide liquidation event confirmed by market sources and likely amplified by profit-taking after three weeks of euphoria.

1
552
#solana $SOL resist in USD $121.77 with an uptrend ETF: analysis for September 27
Backed by record inflows into Solana ETFs and a technical momentum that places it above all its moving averages, with the imminent activation of Alpenglow as a technological catalyst. However, the stochastics at 90.1 and the RSI at 68.7 warn of overbought conditions, while Pump.fun sales and Hyperliquid’s competitive pressure pose risks.
On the buy side, it was confirmed that Solana ETFs attract USD $188.21 million and Bitwise concentrates most of it. Net inflows into exchange-listed vehicles represent direct institutional demand for the underlying asset—an already confirmed catalyst that explains much of the 9.08% weekly advance.
At USD $121.77, the asset trades 58.50% below its ATH, against a 64.71% recovery over 90 days: the valuation is substantially lower than at the 2025 peak, with improved technical fundamentals (Alpenglow, leading tokenized commodities volume according to DiarioBitcoin coverage).
Recommendation: HOLD, with an accumulation bias on pullbacks. The methodology weighs five signals:
1) Bullish MACD with a positive histogram (in favor);
2) price above all SMAs (in favor);
3) 90D Fibonacci in an uptrend (in favor);
4) RSI at 68.7 and stochastics at 90.1 (against, correction risk);
5) volume today slightly below the 30-day average (neutral-negative).
Result: 3 out of 5 signals are in favor, with two warnings of overextension. In a market with institutional demand confirmed by ETF flows, closing positions is not justified, but opening new positions at market after a 20% move in 14 days offers a poor risk-reward ratio.
Short term: wait for pullbacks toward USD $117.16-120.16 for tactical buys, with a stop-loss below USD $116.30 (SMA-10) and take-profit at USD $124.58-127.
#sol is undergoing a structural recovery with verifiable institutional support, but the short term is stretched.
{future}(SOLUSDT)
#solana $SOL resist in USD $121.77 with an uptrend ETF: analysis for September 27
Backed by record inflows into Solana ETFs and a technical momentum that places it above all its moving averages, with the imminent activation of Alpenglow as a technological catalyst. However, the stochastics at 90.1 and the RSI at 68.7 warn of overbought conditions, while Pump.fun sales and Hyperliquid’s competitive pressure pose risks.
On the buy side, it was confirmed that Solana ETFs attract USD $188.21 million and Bitwise concentrates most of it. Net inflows into exchange-listed vehicles represent direct institutional demand for the underlying asset—an already confirmed catalyst that explains much of the 9.08% weekly advance.
At USD $121.77, the asset trades 58.50% below its ATH, against a 64.71% recovery over 90 days: the valuation is substantially lower than at the 2025 peak, with improved technical fundamentals (Alpenglow, leading tokenized commodities volume according to DiarioBitcoin coverage).
Recommendation: HOLD, with an accumulation bias on pullbacks. The methodology weighs five signals:
1) Bullish MACD with a positive histogram (in favor);
2) price above all SMAs (in favor);
3) 90D Fibonacci in an uptrend (in favor);
4) RSI at 68.7 and stochastics at 90.1 (against, correction risk);
5) volume today slightly below the 30-day average (neutral-negative).
Result: 3 out of 5 signals are in favor, with two warnings of overextension. In a market with institutional demand confirmed by ETF flows, closing positions is not justified, but opening new positions at market after a 20% move in 14 days offers a poor risk-reward ratio.
Short term: wait for pullbacks toward USD $117.16-120.16 for tactical buys, with a stop-loss below USD $116.30 (SMA-10) and take-profit at USD $124.58-127.
#sol is undergoing a structural recovery with verifiable institutional support, but the short term is stretched.
Backed by record inflows into Solana ETFs and a technical momentum that places it above all its moving averages, with the imminent activation of Alpenglow as a technological catalyst. However, the stochastics at 90.1 and the RSI at 68.7 warn of overbought conditions, while Pump.fun sales and Hyperliquid’s competitive pressure pose risks.
On the buy side, it was confirmed that Solana ETFs attract USD $188.21 million and Bitwise concentrates most of it. Net inflows into exchange-listed vehicles represent direct institutional demand for the underlying asset—an already confirmed catalyst that explains much of the 9.08% weekly advance.
At USD $121.77, the asset trades 58.50% below its ATH, against a 64.71% recovery over 90 days: the valuation is substantially lower than at the 2025 peak, with improved technical fundamentals (Alpenglow, leading tokenized commodities volume according to DiarioBitcoin coverage).
Recommendation: HOLD, with an accumulation bias on pullbacks. The methodology weighs five signals:
1) Bullish MACD with a positive histogram (in favor);
2) price above all SMAs (in favor);
3) 90D Fibonacci in an uptrend (in favor);
4) RSI at 68.7 and stochastics at 90.1 (against, correction risk);
5) volume today slightly below the 30-day average (neutral-negative).
Result: 3 out of 5 signals are in favor, with two warnings of overextension. In a market with institutional demand confirmed by ETF flows, closing positions is not justified, but opening new positions at market after a 20% move in 14 days offers a poor risk-reward ratio.
Short term: wait for pullbacks toward USD $117.16-120.16 for tactical buys, with a stop-loss below USD $116.30 (SMA-10) and take-profit at USD $124.58-127.
#sol is undergoing a structural recovery with verifiable institutional support, but the short term is stretched.

1.3k
#VeniceToken $VVV se consolidates near annual highs this September 27, 2026
Venice Token #VVV trades near USD $30.94 this September 27, 2026, just 10% below its all-time high marked six days ago. The bullish move of the past two weeks (+36.71% in 14 days) contrasts with a daily volume that is down by almost 50% versus its monthly average, a sign that calls for caution.
Decreasing volume on a rebound matters because sustained advances usually require more participants to buy; when price moves up on lower volume, the odds of a pullback increase. Not a guarantee, but a warning signal that justifies stricter stop-loss limits.
Venice Token has a market capitalization of USD $1.490 billion, placing it as a mid-cap asset within the AI token segment. That category has attracted significant speculative inflows, and part of VVV’s revaluation (more than 1,000% in 52 weeks) reflects the sector’s narrative premium in addition to the project’s own metrics.
Recommendation: HOLD.
The methodology considers five technical signals: bullish MACD (in favor), price above SMA-20, SMA-50, SMA-90, and SMA-200 (in favor), RSI at 65.1 with room before overbought (in favor), stochastic at 73.4 in the upper range but not extreme (neutral), and 24h volume 48.82% below the 30-day average (against). The tally is 3 in favor, 1 neutral, and 1 against, with the underlying uptrend intact.
Short term: look for an entry only on a breakout above USD $31.11 with volume higher than the monthly average, stop-loss at USD $29.15, and partial take-profit at USD $34.45 (ATH). Contrarian alternative: staggered buy in USD $28.65–$29.15 if price pulls back without breaking the key support.
Venice Token consolidates as one of the top-performing assets in the AI segment in 2026, with an undisputed underlying trend and a technical structure that still favors buyers.
{future}(VVVUSDT)
#VeniceToken $VVV se consolidates near annual highs this September 27, 2026
Venice Token #VVV trades near USD $30.94 this September 27, 2026, just 10% below its all-time high marked six days ago. The bullish move of the past two weeks (+36.71% in 14 days) contrasts with a daily volume that is down by almost 50% versus its monthly average, a sign that calls for caution.
Decreasing volume on a rebound matters because sustained advances usually require more participants to buy; when price moves up on lower volume, the odds of a pullback increase. Not a guarantee, but a warning signal that justifies stricter stop-loss limits.
Venice Token has a market capitalization of USD $1.490 billion, placing it as a mid-cap asset within the AI token segment. That category has attracted significant speculative inflows, and part of VVV’s revaluation (more than 1,000% in 52 weeks) reflects the sector’s narrative premium in addition to the project’s own metrics.
Recommendation: HOLD.
The methodology considers five technical signals: bullish MACD (in favor), price above SMA-20, SMA-50, SMA-90, and SMA-200 (in favor), RSI at 65.1 with room before overbought (in favor), stochastic at 73.4 in the upper range but not extreme (neutral), and 24h volume 48.82% below the 30-day average (against). The tally is 3 in favor, 1 neutral, and 1 against, with the underlying uptrend intact.
Short term: look for an entry only on a breakout above USD $31.11 with volume higher than the monthly average, stop-loss at USD $29.15, and partial take-profit at USD $34.45 (ATH). Contrarian alternative: staggered buy in USD $28.65–$29.15 if price pulls back without breaking the key support.
Venice Token consolidates as one of the top-performing assets in the AI segment in 2026, with an undisputed underlying trend and a technical structure that still favors buyers.
Venice Token #VVV trades near USD $30.94 this September 27, 2026, just 10% below its all-time high marked six days ago. The bullish move of the past two weeks (+36.71% in 14 days) contrasts with a daily volume that is down by almost 50% versus its monthly average, a sign that calls for caution.
Decreasing volume on a rebound matters because sustained advances usually require more participants to buy; when price moves up on lower volume, the odds of a pullback increase. Not a guarantee, but a warning signal that justifies stricter stop-loss limits.
Venice Token has a market capitalization of USD $1.490 billion, placing it as a mid-cap asset within the AI token segment. That category has attracted significant speculative inflows, and part of VVV’s revaluation (more than 1,000% in 52 weeks) reflects the sector’s narrative premium in addition to the project’s own metrics.
Recommendation: HOLD.
The methodology considers five technical signals: bullish MACD (in favor), price above SMA-20, SMA-50, SMA-90, and SMA-200 (in favor), RSI at 65.1 with room before overbought (in favor), stochastic at 73.4 in the upper range but not extreme (neutral), and 24h volume 48.82% below the 30-day average (against). The tally is 3 in favor, 1 neutral, and 1 against, with the underlying uptrend intact.
Short term: look for an entry only on a breakout above USD $31.11 with volume higher than the monthly average, stop-loss at USD $29.15, and partial take-profit at USD $34.45 (ATH). Contrarian alternative: staggered buy in USD $28.65–$29.15 if price pulls back without breaking the key support.
Venice Token consolidates as one of the top-performing assets in the AI segment in 2026, with an undisputed underlying trend and a technical structure that still favors buyers.

213
#BitcoinCash $BCH digiere su weekly rebound of 35% this September 26, 2026
Bitcoin Cash took a pause this September 26, 2026 after an extraordinary week: a gain of 35.42% in seven days and 48.30% in two weeks, driven by its listing on CME and a capital rotation toward altcoins as Bitcoin dominance fell below 60%.
The relevant move over the last 72 hours is not today’s drop of just 0.71%, but the weekly rally of 35.42%. The catalyst confirmed by external sources is the announcement of Bitcoin Cash’s listing on CME: according to Bitcoin Cash (BCH), Uniswap (UNI) Surge 63% on CME listing, the price jumped 30% in 24 hours to USD $347 after a breakout that began on Tuesday, September 22, 2026.
Bitcoin Cash maintains a market capitalization of USD $6.720 billion, placing it among the sector’s large assets, with daily volume of USD $196.3 million in the current session versus a 30-day average of USD $272.6 million.
Recommendation: HOLD. The applied methodology weighs five technical and participation signals: the bullish MACD with a histogram of 11.05, price above the six relevant SMAs, and the upward Fibonacci trend add up to three signals in favor of maintaining existing exposure. Against it weigh the RSI at 76.6, the stochastic at 80.9 with Bollinger %B at 89.3, and today’s volume 27.97% below the monthly average, four overextension warnings that discourage new market buys.
For the short term, traders can work the USD $329.44 – USD $346.40 range with entries near support, stop loss below USD $318 and profit taking at USD $344–USD $346, avoiding chasing breakouts without volume.
Bitcoin Cash has gone from a dormant asset to the star of sector rotation in just one week, and the CME listing gives it an institutional legitimacy that goes beyond the immediate momentum.
{future}(BCHUSDT)
#BitcoinCash $BCH digiere su weekly rebound of 35% this September 26, 2026
Bitcoin Cash took a pause this September 26, 2026 after an extraordinary week: a gain of 35.42% in seven days and 48.30% in two weeks, driven by its listing on CME and a capital rotation toward altcoins as Bitcoin dominance fell below 60%.
The relevant move over the last 72 hours is not today’s drop of just 0.71%, but the weekly rally of 35.42%. The catalyst confirmed by external sources is the announcement of Bitcoin Cash’s listing on CME: according to Bitcoin Cash (BCH), Uniswap (UNI) Surge 63% on CME listing, the price jumped 30% in 24 hours to USD $347 after a breakout that began on Tuesday, September 22, 2026.
Bitcoin Cash maintains a market capitalization of USD $6.720 billion, placing it among the sector’s large assets, with daily volume of USD $196.3 million in the current session versus a 30-day average of USD $272.6 million.
Recommendation: HOLD. The applied methodology weighs five technical and participation signals: the bullish MACD with a histogram of 11.05, price above the six relevant SMAs, and the upward Fibonacci trend add up to three signals in favor of maintaining existing exposure. Against it weigh the RSI at 76.6, the stochastic at 80.9 with Bollinger %B at 89.3, and today’s volume 27.97% below the monthly average, four overextension warnings that discourage new market buys.
For the short term, traders can work the USD $329.44 – USD $346.40 range with entries near support, stop loss below USD $318 and profit taking at USD $344–USD $346, avoiding chasing breakouts without volume.
Bitcoin Cash has gone from a dormant asset to the star of sector rotation in just one week, and the CME listing gives it an institutional legitimacy that goes beyond the immediate momentum.
Bitcoin Cash took a pause this September 26, 2026 after an extraordinary week: a gain of 35.42% in seven days and 48.30% in two weeks, driven by its listing on CME and a capital rotation toward altcoins as Bitcoin dominance fell below 60%.
The relevant move over the last 72 hours is not today’s drop of just 0.71%, but the weekly rally of 35.42%. The catalyst confirmed by external sources is the announcement of Bitcoin Cash’s listing on CME: according to Bitcoin Cash (BCH), Uniswap (UNI) Surge 63% on CME listing, the price jumped 30% in 24 hours to USD $347 after a breakout that began on Tuesday, September 22, 2026.
Bitcoin Cash maintains a market capitalization of USD $6.720 billion, placing it among the sector’s large assets, with daily volume of USD $196.3 million in the current session versus a 30-day average of USD $272.6 million.
Recommendation: HOLD. The applied methodology weighs five technical and participation signals: the bullish MACD with a histogram of 11.05, price above the six relevant SMAs, and the upward Fibonacci trend add up to three signals in favor of maintaining existing exposure. Against it weigh the RSI at 76.6, the stochastic at 80.9 with Bollinger %B at 89.3, and today’s volume 27.97% below the monthly average, four overextension warnings that discourage new market buys.
For the short term, traders can work the USD $329.44 – USD $346.40 range with entries near support, stop loss below USD $318 and profit taking at USD $344–USD $346, avoiding chasing breakouts without volume.
Bitcoin Cash has gone from a dormant asset to the star of sector rotation in just one week, and the CME listing gives it an institutional legitimacy that goes beyond the immediate momentum.
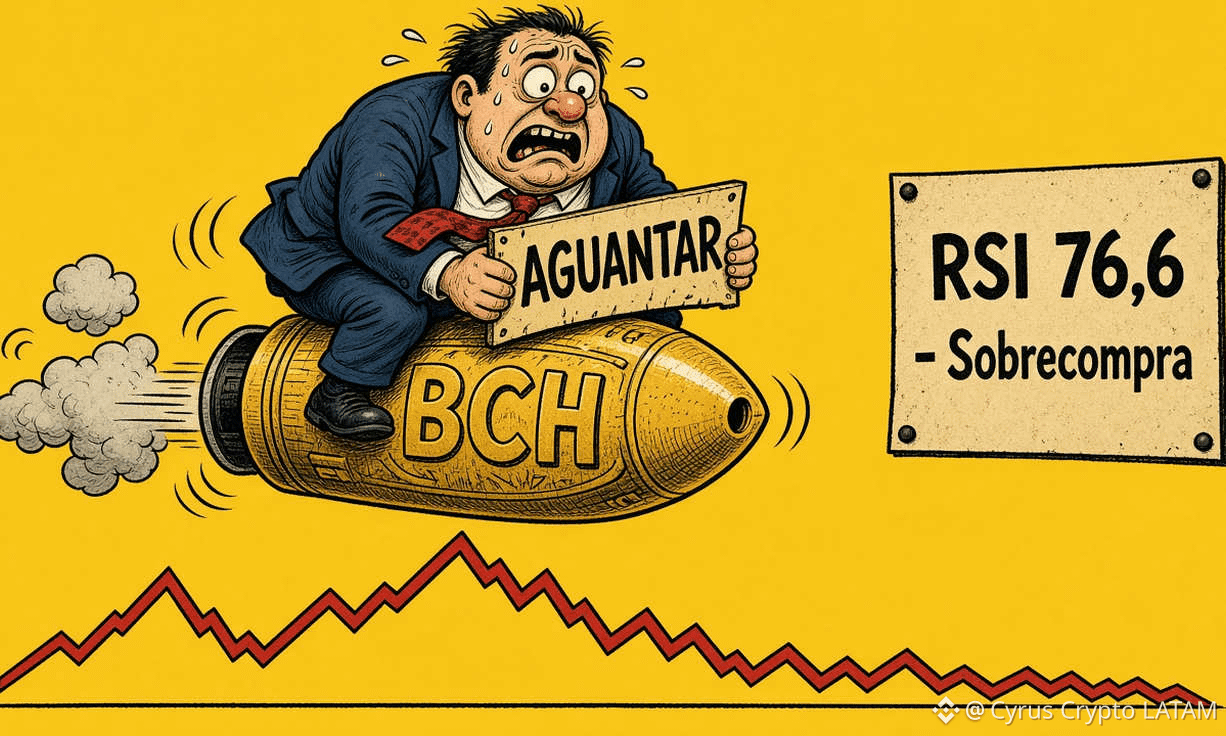
136
#hype defends the USD $92 level with the MACD still bullish: analysis for September 26, 2026
#Hyperliquid $HYPE trades at USD $92.44 on September 26, 2026, just -5.61% below its all-time high of USD $97.93 reached on September 23, one day before its spot listing on Binance. The token has gained +263.30% since January 1, and the technical structures remain bullish, although declining volume and whale distribution after the listing suggest a demanding consolidation phase.
HYPE’s spot listing on Binance with three pairs, activated on September 24, is the dominant event of the last 72 hours. DiarioBitcoin’s coverage documented it in time: Binance lists HYPE spot with three trading pairs this September 24.
Hyperliquid is the leading decentralized perpetual derivatives exchange, with an estimated share of approximately 70% of the DEX perp market based on industry comparisons. It features direct monetization via commissions that funds HYPE buybacks and burns—a mechanism that turns trading activity into structural buy pressure on the token.
Recommendation: HOLD for existing positions; wait for confirmation before making new purchases.
Explicit 6-signal methodology:
(1) Bullish MACD — in favor;
(2) price above SMA-20, SMA-50, SMA-90, and SMA-200 — in favor;
(3) RSI at 61.3 with margin — in favor;
(4) volume -49% vs 30-day average — against;
(5) price below SMA-5 and SMA-7 — against;
(6) stochastic at 75.4 with an extended bounce — against.
Result: 3/6 signals in favor, a technical tie that does not justify opening a position at closing prices.
Short term (days-weeks): trade the range extremes. Scale in buying at USD $89–91.50 with a stop-loss at USD $86.40 and partial take-profit at USD $94.20 and USD $97.50. Avoid chasing price above USD $93 without volume.
HYPE combines the best fundamental profile in the decentralized derivatives sector with a technical phase of post-catalyst consolidation.
{future}(HYPEUSDT)
#hype defends the USD $92 level with the MACD still bullish: analysis for September 26, 2026
#Hyperliquid $HYPE trades at USD $92.44 on September 26, 2026, just -5.61% below its all-time high of USD $97.93 reached on September 23, one day before its spot listing on Binance. The token has gained +263.30% since January 1, and the technical structures remain bullish, although declining volume and whale distribution after the listing suggest a demanding consolidation phase.
HYPE’s spot listing on Binance with three pairs, activated on September 24, is the dominant event of the last 72 hours. DiarioBitcoin’s coverage documented it in time: Binance lists HYPE spot with three trading pairs this September 24.
Hyperliquid is the leading decentralized perpetual derivatives exchange, with an estimated share of approximately 70% of the DEX perp market based on industry comparisons. It features direct monetization via commissions that funds HYPE buybacks and burns—a mechanism that turns trading activity into structural buy pressure on the token.
Recommendation: HOLD for existing positions; wait for confirmation before making new purchases.
Explicit 6-signal methodology:
(1) Bullish MACD — in favor;
(2) price above SMA-20, SMA-50, SMA-90, and SMA-200 — in favor;
(3) RSI at 61.3 with margin — in favor;
(4) volume -49% vs 30-day average — against;
(5) price below SMA-5 and SMA-7 — against;
(6) stochastic at 75.4 with an extended bounce — against.
Result: 3/6 signals in favor, a technical tie that does not justify opening a position at closing prices.
Short term (days-weeks): trade the range extremes. Scale in buying at USD $89–91.50 with a stop-loss at USD $86.40 and partial take-profit at USD $94.20 and USD $97.50. Avoid chasing price above USD $93 without volume.
HYPE combines the best fundamental profile in the decentralized derivatives sector with a technical phase of post-catalyst consolidation.
#Hyperliquid $HYPE trades at USD $92.44 on September 26, 2026, just -5.61% below its all-time high of USD $97.93 reached on September 23, one day before its spot listing on Binance. The token has gained +263.30% since January 1, and the technical structures remain bullish, although declining volume and whale distribution after the listing suggest a demanding consolidation phase.
HYPE’s spot listing on Binance with three pairs, activated on September 24, is the dominant event of the last 72 hours. DiarioBitcoin’s coverage documented it in time: Binance lists HYPE spot with three trading pairs this September 24.
Hyperliquid is the leading decentralized perpetual derivatives exchange, with an estimated share of approximately 70% of the DEX perp market based on industry comparisons. It features direct monetization via commissions that funds HYPE buybacks and burns—a mechanism that turns trading activity into structural buy pressure on the token.
Recommendation: HOLD for existing positions; wait for confirmation before making new purchases.
Explicit 6-signal methodology:
(1) Bullish MACD — in favor;
(2) price above SMA-20, SMA-50, SMA-90, and SMA-200 — in favor;
(3) RSI at 61.3 with margin — in favor;
(4) volume -49% vs 30-day average — against;
(5) price below SMA-5 and SMA-7 — against;
(6) stochastic at 75.4 with an extended bounce — against.
Result: 3/6 signals in favor, a technical tie that does not justify opening a position at closing prices.
Short term (days-weeks): trade the range extremes. Scale in buying at USD $89–91.50 with a stop-loss at USD $86.40 and partial take-profit at USD $94.20 and USD $97.50. Avoid chasing price above USD $93 without volume.
HYPE combines the best fundamental profile in the decentralized derivatives sector with a technical phase of post-catalyst consolidation.

798
#DASH recovers land with 242% progress in twelve months and sustained buy-side pressure
$DASH it trades around USD $72.09, a level that implies an approximate return of 241.99% over twelve months and a 75.55% gain since January 1. The asset remains above all its relevant moving averages, with the RSI at 68.2% and a clearly bullish MACD.
DASH’s advance toward the USD $72.09 zone, with a 10.11% premium over the intraday VWAP, is primarily driven by a technical re-accumulation dynamic: price has crossed successively above the SMA-5, SMA-10, SMA-20, and SMA-30 over the past several weeks—a pattern that attracts trend-following flows and algorithmic systems that trade moving-average crossovers.
DASH is a payments-focused cryptocurrency with a history dating back to 2014, historically distinguished by its masternode governance system and transaction privacy features. With a market capitalization of USD $926.04 million, it sits in the mid-cap range within the payments segment, practically competing with Litecoin, Monero, and fast-settlement solutions.
Using a five-technical-signal methodology:
(1) moving-average structure aligned upward—in favor;
(2) MACD with the line above the signal and a positive histogram—in favor;
(3) price above the intraday VWAP—in favor;
(4) RSI at 68.2% near overbought—in against;
(5) a 12.5% extension over the SMA-5 implying deteriorated asymmetry for new entries—in against.
The result is 3/5 signals in favor, which supports a recommendation to hold existing positions with trailing stops.
For short-term traders: trade only pullbacks toward USD $64–65 (SMA-5/VWAP) with a loss limit below USD $59.3 and a target on extensions above USD $72. Avoid chasing the price when the RSI is in the overbought zone.
DASH is moving through a structurally strong bullish trend, with a 241.99% annual return and all its moving averages aligned upward.
{future}(DASHUSDT)
#DASH recovers land with 242% progress in twelve months and sustained buy-side pressure
$DASH it trades around USD $72.09, a level that implies an approximate return of 241.99% over twelve months and a 75.55% gain since January 1. The asset remains above all its relevant moving averages, with the RSI at 68.2% and a clearly bullish MACD.
DASH’s advance toward the USD $72.09 zone, with a 10.11% premium over the intraday VWAP, is primarily driven by a technical re-accumulation dynamic: price has crossed successively above the SMA-5, SMA-10, SMA-20, and SMA-30 over the past several weeks—a pattern that attracts trend-following flows and algorithmic systems that trade moving-average crossovers.
DASH is a payments-focused cryptocurrency with a history dating back to 2014, historically distinguished by its masternode governance system and transaction privacy features. With a market capitalization of USD $926.04 million, it sits in the mid-cap range within the payments segment, practically competing with Litecoin, Monero, and fast-settlement solutions.
Using a five-technical-signal methodology:
(1) moving-average structure aligned upward—in favor;
(2) MACD with the line above the signal and a positive histogram—in favor;
(3) price above the intraday VWAP—in favor;
(4) RSI at 68.2% near overbought—in against;
(5) a 12.5% extension over the SMA-5 implying deteriorated asymmetry for new entries—in against.
The result is 3/5 signals in favor, which supports a recommendation to hold existing positions with trailing stops.
For short-term traders: trade only pullbacks toward USD $64–65 (SMA-5/VWAP) with a loss limit below USD $59.3 and a target on extensions above USD $72. Avoid chasing the price when the RSI is in the overbought zone.
DASH is moving through a structurally strong bullish trend, with a 241.99% annual return and all its moving averages aligned upward.
$DASH it trades around USD $72.09, a level that implies an approximate return of 241.99% over twelve months and a 75.55% gain since January 1. The asset remains above all its relevant moving averages, with the RSI at 68.2% and a clearly bullish MACD.
DASH’s advance toward the USD $72.09 zone, with a 10.11% premium over the intraday VWAP, is primarily driven by a technical re-accumulation dynamic: price has crossed successively above the SMA-5, SMA-10, SMA-20, and SMA-30 over the past several weeks—a pattern that attracts trend-following flows and algorithmic systems that trade moving-average crossovers.
DASH is a payments-focused cryptocurrency with a history dating back to 2014, historically distinguished by its masternode governance system and transaction privacy features. With a market capitalization of USD $926.04 million, it sits in the mid-cap range within the payments segment, practically competing with Litecoin, Monero, and fast-settlement solutions.
Using a five-technical-signal methodology:
(1) moving-average structure aligned upward—in favor;
(2) MACD with the line above the signal and a positive histogram—in favor;
(3) price above the intraday VWAP—in favor;
(4) RSI at 68.2% near overbought—in against;
(5) a 12.5% extension over the SMA-5 implying deteriorated asymmetry for new entries—in against.
The result is 3/5 signals in favor, which supports a recommendation to hold existing positions with trailing stops.
For short-term traders: trade only pullbacks toward USD $64–65 (SMA-5/VWAP) with a loss limit below USD $59.3 and a target on extensions above USD $72. Avoid chasing the price when the RSI is in the overbought zone.
DASH is moving through a structurally strong bullish trend, with a 241.99% annual return and all its moving averages aligned upward.

1
881
$ZEC sustains USD $1.553 after a 97% monthly rally: breather or pause in the privacy train?
#zec is trading at USD $1.553,11 with a gain of only 0,17% on the day—an obvious slowdown after a 97,47% advance in 30 days and 311% in 90 days. With daily volume down more than 51% versus the monthly average and the RSI in the high zone, the market is asking whether the privacy narrative, the wave of institutional news, and the upcoming NU7 update can keep the momentum.
The move over the last 24 to 72 hours is moderate by percentage—between +0,17% daily and a limited weekly pullback—supported by press evidence that mentions about a 2% drop over the week. However, it contrasts sharply with the 97,47% monthly push. Today’s range (USD $1.520,24 - USD $1.553,25) is less than half of yesterday’s (USD $1.526,76 - USD $1.620,72), signaling volatility compression after a rejection in the USD $1.620 area.
Its core value—verifiable transactional privacy—has shifted from being seen as a regulatory burden to a preferred investment narrative, in a context of greater institutional acceptance of privacy tools.
Recommendation: HOLD. Explicit methodology: out of 5 signals evaluated, 3 favor the bullish continuation (positive MACD, price above all SMAs, bullish Fibonacci trend over 90D), while 2 are a warning (RSI at 68,1 close to overbought and daily volume -51,62% vs. average). The stochastic at 84,0 reinforces caution. For new capital, the risk/reward at USD $1.553 is unfavorable: the first relevant support with volume is at USD $1.382, 11% below, while immediate resistance is only 6% away.
Short term: buy pullbacks at USD $1.470-$1.520 (SMA-7 area and today’s low) with a stop-loss below USD $1.380 and take-profit at USD $1.648 (Fibonacci 0%).
ZEC embodies the classic case of an asset in an extreme uptrend, with early signs of momentum maturing.
{future}(ZECUSDT)
$ZEC sustains USD $1.553 after a 97% monthly rally: breather or pause in the privacy train?
#zec is trading at USD $1.553,11 with a gain of only 0,17% on the day—an obvious slowdown after a 97,47% advance in 30 days and 311% in 90 days. With daily volume down more than 51% versus the monthly average and the RSI in the high zone, the market is asking whether the privacy narrative, the wave of institutional news, and the upcoming NU7 update can keep the momentum.
The move over the last 24 to 72 hours is moderate by percentage—between +0,17% daily and a limited weekly pullback—supported by press evidence that mentions about a 2% drop over the week. However, it contrasts sharply with the 97,47% monthly push. Today’s range (USD $1.520,24 - USD $1.553,25) is less than half of yesterday’s (USD $1.526,76 - USD $1.620,72), signaling volatility compression after a rejection in the USD $1.620 area.
Its core value—verifiable transactional privacy—has shifted from being seen as a regulatory burden to a preferred investment narrative, in a context of greater institutional acceptance of privacy tools.
Recommendation: HOLD. Explicit methodology: out of 5 signals evaluated, 3 favor the bullish continuation (positive MACD, price above all SMAs, bullish Fibonacci trend over 90D), while 2 are a warning (RSI at 68,1 close to overbought and daily volume -51,62% vs. average). The stochastic at 84,0 reinforces caution. For new capital, the risk/reward at USD $1.553 is unfavorable: the first relevant support with volume is at USD $1.382, 11% below, while immediate resistance is only 6% away.
Short term: buy pullbacks at USD $1.470-$1.520 (SMA-7 area and today’s low) with a stop-loss below USD $1.380 and take-profit at USD $1.648 (Fibonacci 0%).
ZEC embodies the classic case of an asset in an extreme uptrend, with early signs of momentum maturing.
#zec is trading at USD $1.553,11 with a gain of only 0,17% on the day—an obvious slowdown after a 97,47% advance in 30 days and 311% in 90 days. With daily volume down more than 51% versus the monthly average and the RSI in the high zone, the market is asking whether the privacy narrative, the wave of institutional news, and the upcoming NU7 update can keep the momentum.
The move over the last 24 to 72 hours is moderate by percentage—between +0,17% daily and a limited weekly pullback—supported by press evidence that mentions about a 2% drop over the week. However, it contrasts sharply with the 97,47% monthly push. Today’s range (USD $1.520,24 - USD $1.553,25) is less than half of yesterday’s (USD $1.526,76 - USD $1.620,72), signaling volatility compression after a rejection in the USD $1.620 area.
Its core value—verifiable transactional privacy—has shifted from being seen as a regulatory burden to a preferred investment narrative, in a context of greater institutional acceptance of privacy tools.
Recommendation: HOLD. Explicit methodology: out of 5 signals evaluated, 3 favor the bullish continuation (positive MACD, price above all SMAs, bullish Fibonacci trend over 90D), while 2 are a warning (RSI at 68,1 close to overbought and daily volume -51,62% vs. average). The stochastic at 84,0 reinforces caution. For new capital, the risk/reward at USD $1.553 is unfavorable: the first relevant support with volume is at USD $1.382, 11% below, while immediate resistance is only 6% away.
Short term: buy pullbacks at USD $1.470-$1.520 (SMA-7 area and today’s low) with a stop-loss below USD $1.380 and take-profit at USD $1.648 (Fibonacci 0%).
ZEC embodies the classic case of an asset in an extreme uptrend, with early signs of momentum maturing.

716
Log in to explore more content
Join global crypto users on Binance Square
⚡️ Get latest and useful information about crypto.
💬 Trusted by the world’s largest crypto exchange.
👍 Discover real insights from verified creators.
Email / Phone number
Trending Topics
ChainlinkLaunchesBankSWIFTLedgerFramework
486 views
29 Discussing
#ChainlinkLaunchesBankSWIFTLedgerFramework Chainlink has introduced a framework connecting traditional banking infrastructure with blockchain-based ledgers, highlighting efforts to bridge SWIFT-linked financial systems with tokenized assets and onchain settlement. 🔗🏦
#Chainlink #SWIFT #Tokenization #BlockchainFinance
Arsalan Official
·1 Likes
·12 views
EarningsSeason
412,380 views
3,144 Discussing
SECChairWantsStockMarketsOnChain
3,649 views
133 Discussing