
CryptoPulse Brief
34 Posts

CryptoPulse Brief
Report
Block User
Crypto Insights Market News & Analysis Bitcoin Altcoins Web3 | Stay Ahead NFA
1 Following
1 Followers
5 Liked
Posts
🚨 BREAKING: $70,000 IS GONE — $BTC LOSES THE LINE EVERYONE WAS DEFENDING
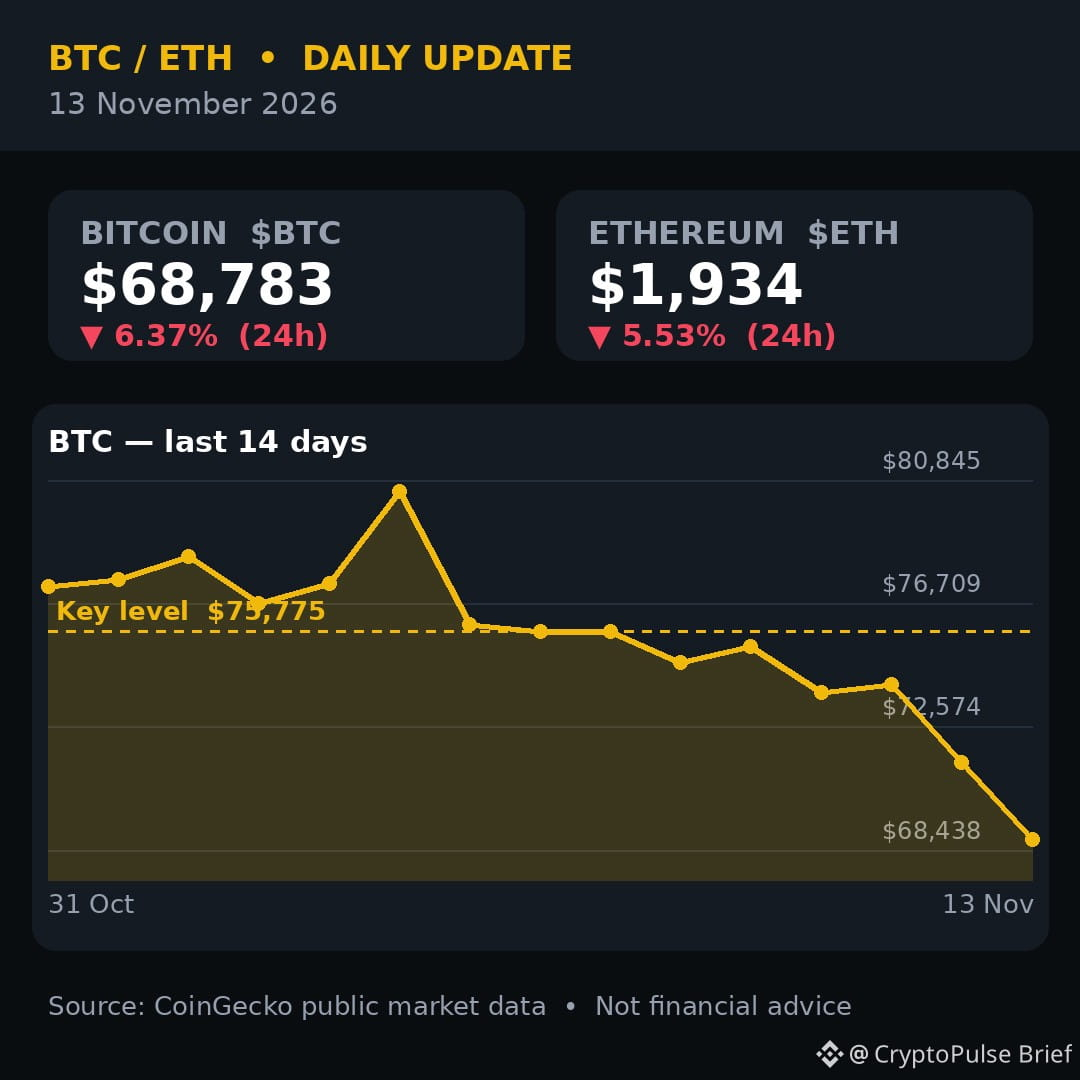
Bitcoin crashed through $70,000 in the Asian session and fell as low as $68,297 — its lowest since August 19. It is trading near $68,783, down 6.4% in 24 hours and almost 10% in a week. Ethereum slipped below $2,000 to about $1,934, down 5.5%.
The damage is in the derivatives market: $1.41 billion in liquidations over 24 hours, and 89% of it was longs. 172,922 traders were wiped out, including a single $31 million long on Hyperliquid. When price broke $70,000, every leveraged long stacked just below it got flushed at once.
This is the fifth straight session of outflows from US spot Bitcoin ETFs — $1.44 billion in five sessions. Add a 10-year Treasury yield above 5.1% and a dollar at a 19-month high, and risk assets had nowhere to hide.
My take: this is a deleveraging cascade, not a verdict on Bitcoin itself. The daily RSI is near 25 — deeply oversold. Oversold does not mean the bottom is in, but it does mean the sellers are exhausted, and forced selling burns itself out. The next trigger is today's US PPI report at 8:30 AM ET: a hot print opens the door toward $65,000, a cool one could spark a sharp relief bounce.
One coin is holding up better than the rest: $XRP is still above $1, down just 1.4%, while Solana slid to around $80.
Levels to watch: support at $68,000–$68,500, then $67,500 and the 200-week average near $67,879. Reclaiming $70,000 is the first step back; $73,000 is where the panic really starts to fade.
Is $68,000 the floor, or does PPI open the door to $65,000? Drop your view below.
Source: CoinGecko, Bloomberg, CoinGlass — 13 Nov 2026
Follow for daily crypto updates.
#Bitcoin #Crypto #BTC
Not financial advice.
🚨 BREAKING: $70,000 IS GONE — $BTC LOSES THE LINE EVERYONE WAS DEFENDING
Bitcoin crashed through $70,000 in the Asian session and fell as low as $68,297 — its lowest since August 19. It is trading near $68,783, down 6.4% in 24 hours and almost 10% in a week. Ethereum slipped below $2,000 to about $1,934, down 5.5%.
The damage is in the derivatives market: $1.41 billion in liquidations over 24 hours, and 89% of it was longs. 172,922 traders were wiped out, including a single $31 million long on Hyperliquid. When price broke $70,000, every leveraged long stacked just below it got flushed at once.
This is the fifth straight session of outflows from US spot Bitcoin ETFs — $1.44 billion in five sessions. Add a 10-year Treasury yield above 5.1% and a dollar at a 19-month high, and risk assets had nowhere to hide.
My take: this is a deleveraging cascade, not a verdict on Bitcoin itself. The daily RSI is near 25 — deeply oversold. Oversold does not mean the bottom is in, but it does mean the sellers are exhausted, and forced selling burns itself out. The next trigger is today's US PPI report at 8:30 AM ET: a hot print opens the door toward $65,000, a cool one could spark a sharp relief bounce.
One coin is holding up better than the rest: $XRP is still above $1, down just 1.4%, while Solana slid to around $80.
Levels to watch: support at $68,000–$68,500, then $67,500 and the 200-week average near $67,879. Reclaiming $70,000 is the first step back; $73,000 is where the panic really starts to fade.
Is $68,000 the floor, or does PPI open the door to $65,000? Drop your view below.
Source: CoinGecko, Bloomberg, CoinGlass — 13 Nov 2026
Follow for daily crypto updates.
#Bitcoin #Crypto #BTC
Not financial advice.
Bitcoin crashed through $70,000 in the Asian session and fell as low as $68,297 — its lowest since August 19. It is trading near $68,783, down 6.4% in 24 hours and almost 10% in a week. Ethereum slipped below $2,000 to about $1,934, down 5.5%.
The damage is in the derivatives market: $1.41 billion in liquidations over 24 hours, and 89% of it was longs. 172,922 traders were wiped out, including a single $31 million long on Hyperliquid. When price broke $70,000, every leveraged long stacked just below it got flushed at once.
This is the fifth straight session of outflows from US spot Bitcoin ETFs — $1.44 billion in five sessions. Add a 10-year Treasury yield above 5.1% and a dollar at a 19-month high, and risk assets had nowhere to hide.
My take: this is a deleveraging cascade, not a verdict on Bitcoin itself. The daily RSI is near 25 — deeply oversold. Oversold does not mean the bottom is in, but it does mean the sellers are exhausted, and forced selling burns itself out. The next trigger is today's US PPI report at 8:30 AM ET: a hot print opens the door toward $65,000, a cool one could spark a sharp relief bounce.
One coin is holding up better than the rest: $XRP is still above $1, down just 1.4%, while Solana slid to around $80.
Levels to watch: support at $68,000–$68,500, then $67,500 and the 200-week average near $67,879. Reclaiming $70,000 is the first step back; $73,000 is where the panic really starts to fade.
Is $68,000 the floor, or does PPI open the door to $65,000? Drop your view below.
Source: CoinGecko, Bloomberg, CoinGlass — 13 Nov 2026
Follow for daily crypto updates.
#Bitcoin #Crypto #BTC
Not financial advice.
110
🚨 BREAKING: NVIDIA CEO JENSEN HUANG RESIGNS — $BTC CRASHES TOWARD $70,000
Bitcoin just lost $72,000 — and the trigger came from outside crypto entirely.
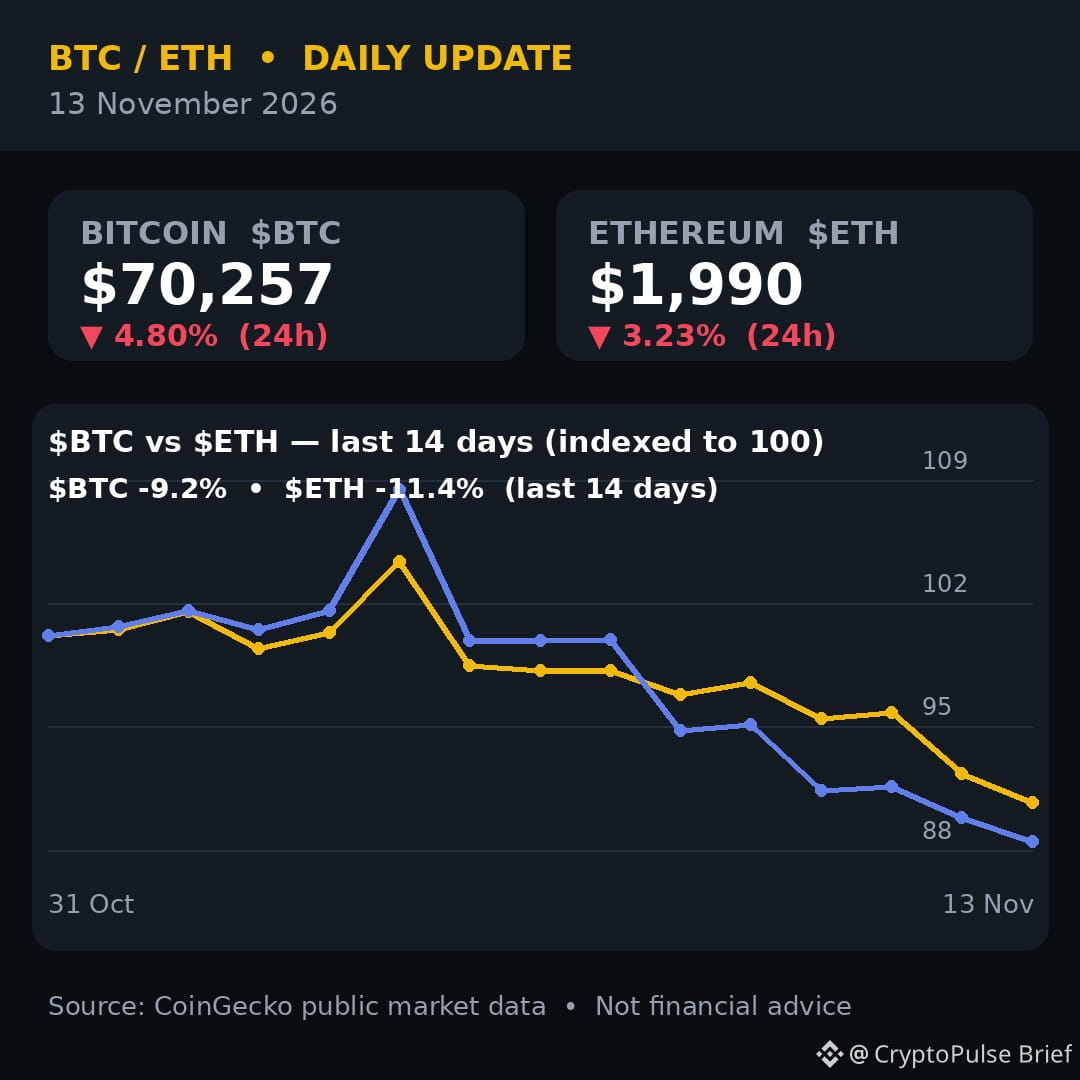
$BTC is trading near $70,257, down almost 5% in 24 hours and nearly 12% in two weeks, its lowest level since September. Ethereum is at $1,990, down 3.2%. More than $550 billion has been wiped off the total crypto market since October's highs, and the Fear & Greed Index sits at 29 — deep in fear.
Here is what happened overnight: Nvidia co-founder Jensen Huang resigned as CEO and chairman on Thursday with no warning. Nvidia shares fell as much as 13% intraday before closing down 4.3%, and US stocks slid with it — the S&P 500 down 0.35% and the Nasdaq down 0.39%.
The shock landed on a market that was already fragile. October CPI came in hot at 0.4% against 0.3% expected, and odds of a Fed rate hike on December 8-9 now sit near 90%. US spot Bitcoin ETFs saw $1.28 billion in net outflows last week — the biggest weekly exit since late June.
My take: this is a macro sell-off wearing a crypto costume. $BTC is now below its 200-day average of $73,137 and its 50-week average, and the daily RSI sits at 29.5 — deep in oversold territory. Oversold does not mean the bottom is in, but it does mean sellers are exhausted and any good news can snap the market back hard. Watch today's US PPI report at 8:30 AM ET: a hot print pushes real yields higher and $BTC lower, while a cool print could be the spark for a relief bounce.
Levels to watch: $70,000 is the psychological line in the sand. Lose it and $68,000 comes into play. Reclaim $73,137 and the panic starts to fade. A real recovery needs $75,000-$76,000.
Is this the bottom, or just the start of a deeper drop? Drop your view below.
Source: Coinotag, KuCoin News, Brave New Coin — 13 Nov 2026
Follow for daily crypto updates.
#Bitcoin #Crypto #BTC
Not financial advice.
🚨 BREAKING: NVIDIA CEO JENSEN HUANG RESIGNS — $BTC CRASHES TOWARD $70,000
Bitcoin just lost $72,000 — and the trigger came from outside crypto entirely.
$BTC is trading near $70,257, down almost 5% in 24 hours and nearly 12% in two weeks, its lowest level since September. Ethereum is at $1,990, down 3.2%. More than $550 billion has been wiped off the total crypto market since October's highs, and the Fear & Greed Index sits at 29 — deep in fear.
Here is what happened overnight: Nvidia co-founder Jensen Huang resigned as CEO and chairman on Thursday with no warning. Nvidia shares fell as much as 13% intraday before closing down 4.3%, and US stocks slid with it — the S&P 500 down 0.35% and the Nasdaq down 0.39%.
The shock landed on a market that was already fragile. October CPI came in hot at 0.4% against 0.3% expected, and odds of a Fed rate hike on December 8-9 now sit near 90%. US spot Bitcoin ETFs saw $1.28 billion in net outflows last week — the biggest weekly exit since late June.
My take: this is a macro sell-off wearing a crypto costume. $BTC is now below its 200-day average of $73,137 and its 50-week average, and the daily RSI sits at 29.5 — deep in oversold territory. Oversold does not mean the bottom is in, but it does mean sellers are exhausted and any good news can snap the market back hard. Watch today's US PPI report at 8:30 AM ET: a hot print pushes real yields higher and $BTC lower, while a cool print could be the spark for a relief bounce.
Levels to watch: $70,000 is the psychological line in the sand. Lose it and $68,000 comes into play. Reclaim $73,137 and the panic starts to fade. A real recovery needs $75,000-$76,000.
Is this the bottom, or just the start of a deeper drop? Drop your view below.
Source: Coinotag, KuCoin News, Brave New Coin — 13 Nov 2026
Follow for daily crypto updates.
#Bitcoin #Crypto #BTC
Not financial advice.
Bitcoin just lost $72,000 — and the trigger came from outside crypto entirely.
$BTC is trading near $70,257, down almost 5% in 24 hours and nearly 12% in two weeks, its lowest level since September. Ethereum is at $1,990, down 3.2%. More than $550 billion has been wiped off the total crypto market since October's highs, and the Fear & Greed Index sits at 29 — deep in fear.
Here is what happened overnight: Nvidia co-founder Jensen Huang resigned as CEO and chairman on Thursday with no warning. Nvidia shares fell as much as 13% intraday before closing down 4.3%, and US stocks slid with it — the S&P 500 down 0.35% and the Nasdaq down 0.39%.
The shock landed on a market that was already fragile. October CPI came in hot at 0.4% against 0.3% expected, and odds of a Fed rate hike on December 8-9 now sit near 90%. US spot Bitcoin ETFs saw $1.28 billion in net outflows last week — the biggest weekly exit since late June.
My take: this is a macro sell-off wearing a crypto costume. $BTC is now below its 200-day average of $73,137 and its 50-week average, and the daily RSI sits at 29.5 — deep in oversold territory. Oversold does not mean the bottom is in, but it does mean sellers are exhausted and any good news can snap the market back hard. Watch today's US PPI report at 8:30 AM ET: a hot print pushes real yields higher and $BTC lower, while a cool print could be the spark for a relief bounce.
Levels to watch: $70,000 is the psychological line in the sand. Lose it and $68,000 comes into play. Reclaim $73,137 and the panic starts to fade. A real recovery needs $75,000-$76,000.
Is this the bottom, or just the start of a deeper drop? Drop your view below.
Source: Coinotag, KuCoin News, Brave New Coin — 13 Nov 2026
Follow for daily crypto updates.
#Bitcoin #Crypto #BTC
Not financial advice.
152
The bullish signal that convinced everyone a new bull run had started — just got erased.
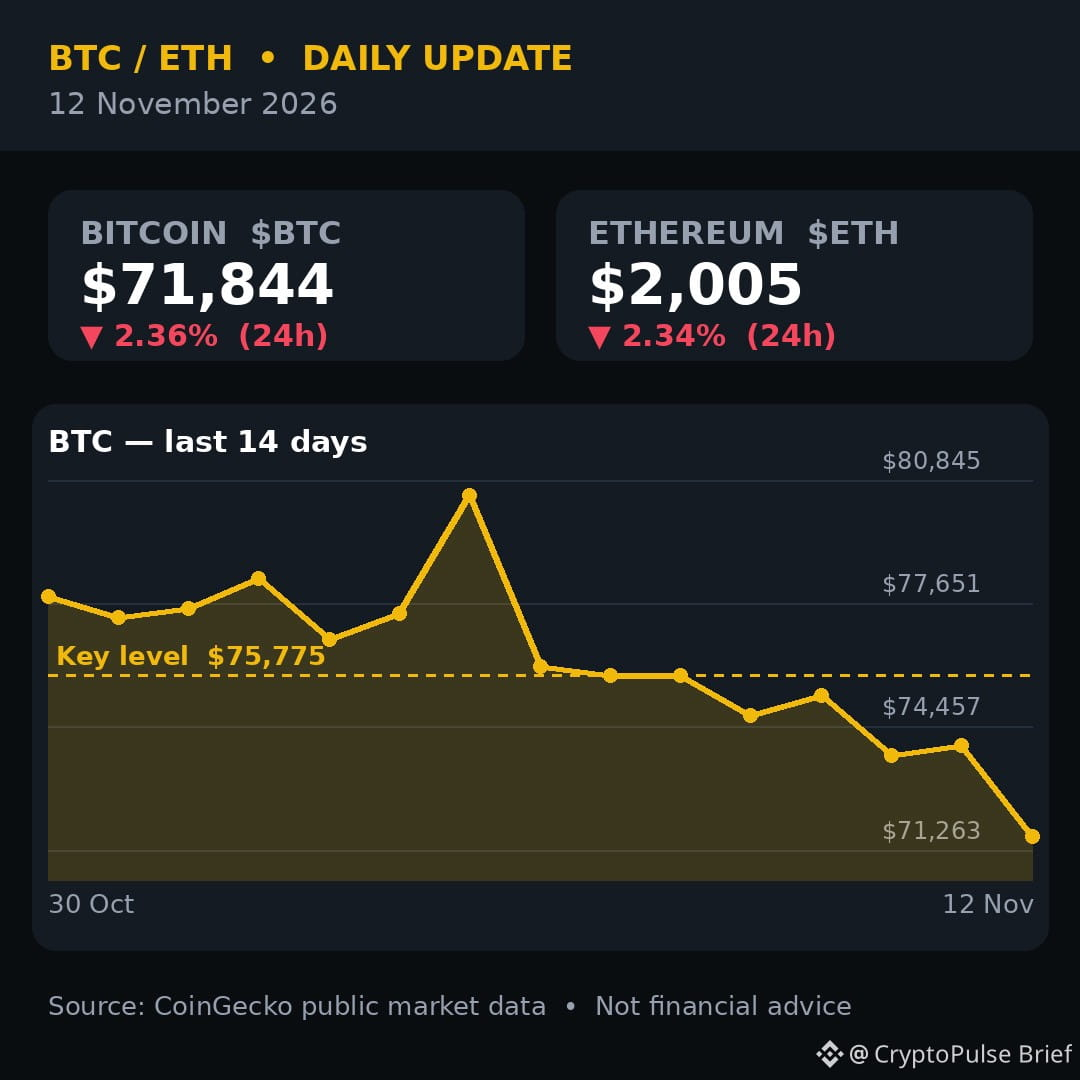
$BTC has fallen below its 50-week moving average of $75,153, reversing the September breakout that analysts read as the start of a new bull run, according to CoinDesk's Daybook on November 12. A failed breakout like this is the pattern technical analysts take as renewed seller dominance.
The slide is accelerating into the evening. $BTC is now near $71,844, down 2.4% in 24 hours, with $ETH at $2,005. US spot $BTC ETFs lost $299.9 million on Wednesday — a fifth straight day of outflows totalling about $1.44 billion since November 5 — and BlackRock's IBIT is on a nine-session outflow streak. Meanwhile Nvidia shares fell around 7% in pre-market trading amid reports its board is preparing to remove CEO Jensen Huang, dragging tech stocks down with it, and traders now price a roughly 90% chance of a Fed rate hike at the December 8-9 meeting.
But not everything is red. Zcash is the day's trending coin: $ZEC jumped 13.7% to about $989, near the $1,000 level, up 23.3% on the week and topping trending searches — with a coinholder vote opening November 16 on a proposal to move 50,000 ZEC out of the community grants treasury.
My take: this is a technical break meeting a macro headwind, not panic. The 50-week average is the line bulls defended all autumn — losing it turns every bounce into a test. Yet money is not leaving crypto entirely; it is rotating into privacy coins while the majors wash out. That rotation is what bottoms usually look like before they form.
Levels to watch: support at $71,800-$72,000, then $70,000. Resistance at $73,000, then the 50-week average at $75,153 — reclaiming that is what flips the picture back.
Source: CoinDesk / CoinGecko, 12 Nov 2026
Do you think losing the 50-week average ends the bull case — or is this the final washout before a bounce?
Follow for daily crypto updates.
#Bitcoin #Crypto #BTC
Not financial advice.
The bullish signal that convinced everyone a new bull run had started — just got erased.
$BTC has fallen below its 50-week moving average of $75,153, reversing the September breakout that analysts read as the start of a new bull run, according to CoinDesk's Daybook on November 12. A failed breakout like this is the pattern technical analysts take as renewed seller dominance.
The slide is accelerating into the evening. $BTC is now near $71,844, down 2.4% in 24 hours, with $ETH at $2,005. US spot $BTC ETFs lost $299.9 million on Wednesday — a fifth straight day of outflows totalling about $1.44 billion since November 5 — and BlackRock's IBIT is on a nine-session outflow streak. Meanwhile Nvidia shares fell around 7% in pre-market trading amid reports its board is preparing to remove CEO Jensen Huang, dragging tech stocks down with it, and traders now price a roughly 90% chance of a Fed rate hike at the December 8-9 meeting.
But not everything is red. Zcash is the day's trending coin: $ZEC jumped 13.7% to about $989, near the $1,000 level, up 23.3% on the week and topping trending searches — with a coinholder vote opening November 16 on a proposal to move 50,000 ZEC out of the community grants treasury.
My take: this is a technical break meeting a macro headwind, not panic. The 50-week average is the line bulls defended all autumn — losing it turns every bounce into a test. Yet money is not leaving crypto entirely; it is rotating into privacy coins while the majors wash out. That rotation is what bottoms usually look like before they form.
Levels to watch: support at $71,800-$72,000, then $70,000. Resistance at $73,000, then the 50-week average at $75,153 — reclaiming that is what flips the picture back.
Source: CoinDesk / CoinGecko, 12 Nov 2026
Do you think losing the 50-week average ends the bull case — or is this the final washout before a bounce?
Follow for daily crypto updates.
#Bitcoin #Crypto #BTC
Not financial advice.
$BTC has fallen below its 50-week moving average of $75,153, reversing the September breakout that analysts read as the start of a new bull run, according to CoinDesk's Daybook on November 12. A failed breakout like this is the pattern technical analysts take as renewed seller dominance.
The slide is accelerating into the evening. $BTC is now near $71,844, down 2.4% in 24 hours, with $ETH at $2,005. US spot $BTC ETFs lost $299.9 million on Wednesday — a fifth straight day of outflows totalling about $1.44 billion since November 5 — and BlackRock's IBIT is on a nine-session outflow streak. Meanwhile Nvidia shares fell around 7% in pre-market trading amid reports its board is preparing to remove CEO Jensen Huang, dragging tech stocks down with it, and traders now price a roughly 90% chance of a Fed rate hike at the December 8-9 meeting.
But not everything is red. Zcash is the day's trending coin: $ZEC jumped 13.7% to about $989, near the $1,000 level, up 23.3% on the week and topping trending searches — with a coinholder vote opening November 16 on a proposal to move 50,000 ZEC out of the community grants treasury.
My take: this is a technical break meeting a macro headwind, not panic. The 50-week average is the line bulls defended all autumn — losing it turns every bounce into a test. Yet money is not leaving crypto entirely; it is rotating into privacy coins while the majors wash out. That rotation is what bottoms usually look like before they form.
Levels to watch: support at $71,800-$72,000, then $70,000. Resistance at $73,000, then the 50-week average at $75,153 — reclaiming that is what flips the picture back.
Source: CoinDesk / CoinGecko, 12 Nov 2026
Do you think losing the 50-week average ends the bull case — or is this the final washout before a bounce?
Follow for daily crypto updates.
#Bitcoin #Crypto #BTC
Not financial advice.
285
4.2 billion just vanished from crypto's fuel tank — and $BTC is still standing.
Stablecoin supply has shrunk by $14.2B in the last 30 days, the sharpest monthly contraction since June 2022, according to Glassnode data published November 11. At the same time, apparent demand for $BTC has fallen by 284,000 coins, and US spot $BTC ETFs have now seen $1.6B in net outflows across 20 trading sessions.
So why is $BTC still holding $73,600?
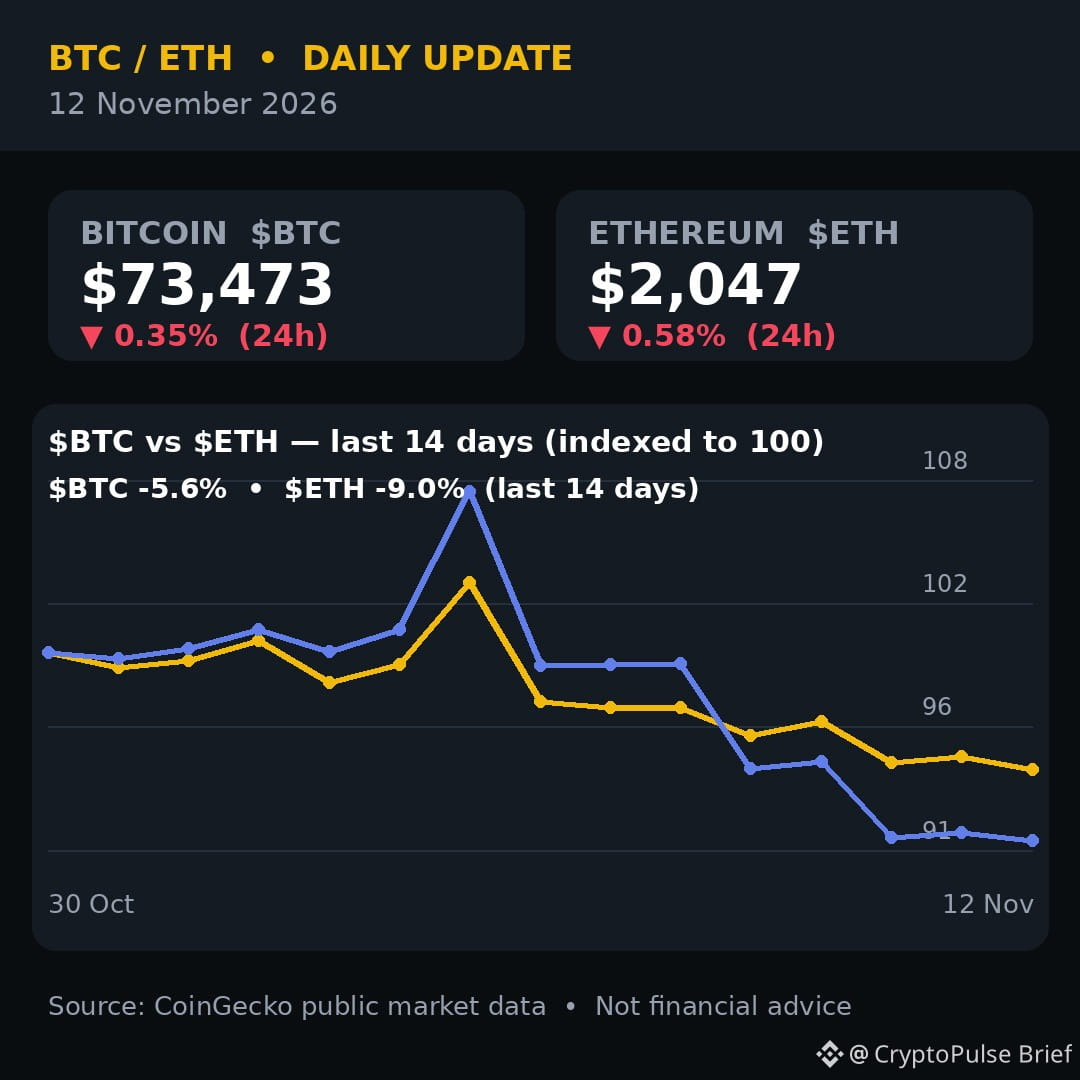
Here is my take: this is a liquidity squeeze, not a collapse. Stablecoins are the dry powder that funds the next leg up — when that supply contracts this fast, rallies starve. But the selling is not panicking either. $BTC bounced off $72,727, its November 10 low, and is sitting right on its 200-day average near $73,173. Whales have been accumulating through the dip, per Glassnode wallet data, and ETF outflows have slowed to a trickle — just $95M in the latest session, the smallest of the four-day streak.
Meanwhile, one coin is ignoring the gloom entirely: Telegram's Gram token jumped 14% in 24 hours, with over a million self-custodial wallets activated in 48 hours, according to Pavel Durov.
Levels to watch:
• Support: $73,000–$73,300, then $72,000
• Resistance: $75,000–$75,600 — reclaiming that flips the short-term picture
• $ETH needs to hold $2,030, with $2,000 as the psychological line
The market is coiled. Liquidity is thin, fear is at 28, and the next big stablecoin inflow — or outflow — decides the direction.
Source: Glassnode, CoinGecko
Do you think the $14.2B stablecoin drain is the real reason this rally keeps stalling — or just a symptom of the fear?
Follow for daily crypto updates.
#BTC #Crypto #Bitcoin
Not financial advice.
4.2 billion just vanished from crypto's fuel tank — and $BTC is still standing.
Stablecoin supply has shrunk by $14.2B in the last 30 days, the sharpest monthly contraction since June 2022, according to Glassnode data published November 11. At the same time, apparent demand for $BTC has fallen by 284,000 coins, and US spot $BTC ETFs have now seen $1.6B in net outflows across 20 trading sessions.
So why is $BTC still holding $73,600?
Here is my take: this is a liquidity squeeze, not a collapse. Stablecoins are the dry powder that funds the next leg up — when that supply contracts this fast, rallies starve. But the selling is not panicking either. $BTC bounced off $72,727, its November 10 low, and is sitting right on its 200-day average near $73,173. Whales have been accumulating through the dip, per Glassnode wallet data, and ETF outflows have slowed to a trickle — just $95M in the latest session, the smallest of the four-day streak.
Meanwhile, one coin is ignoring the gloom entirely: Telegram's Gram token jumped 14% in 24 hours, with over a million self-custodial wallets activated in 48 hours, according to Pavel Durov.
Levels to watch:
• Support: $73,000–$73,300, then $72,000
• Resistance: $75,000–$75,600 — reclaiming that flips the short-term picture
• $ETH needs to hold $2,030, with $2,000 as the psychological line
The market is coiled. Liquidity is thin, fear is at 28, and the next big stablecoin inflow — or outflow — decides the direction.
Source: Glassnode, CoinGecko
Do you think the $14.2B stablecoin drain is the real reason this rally keeps stalling — or just a symptom of the fear?
Follow for daily crypto updates.
#BTC #Crypto #Bitcoin
Not financial advice.
Stablecoin supply has shrunk by $14.2B in the last 30 days, the sharpest monthly contraction since June 2022, according to Glassnode data published November 11. At the same time, apparent demand for $BTC has fallen by 284,000 coins, and US spot $BTC ETFs have now seen $1.6B in net outflows across 20 trading sessions.
So why is $BTC still holding $73,600?
Here is my take: this is a liquidity squeeze, not a collapse. Stablecoins are the dry powder that funds the next leg up — when that supply contracts this fast, rallies starve. But the selling is not panicking either. $BTC bounced off $72,727, its November 10 low, and is sitting right on its 200-day average near $73,173. Whales have been accumulating through the dip, per Glassnode wallet data, and ETF outflows have slowed to a trickle — just $95M in the latest session, the smallest of the four-day streak.
Meanwhile, one coin is ignoring the gloom entirely: Telegram's Gram token jumped 14% in 24 hours, with over a million self-custodial wallets activated in 48 hours, according to Pavel Durov.
Levels to watch:
• Support: $73,000–$73,300, then $72,000
• Resistance: $75,000–$75,600 — reclaiming that flips the short-term picture
• $ETH needs to hold $2,030, with $2,000 as the psychological line
The market is coiled. Liquidity is thin, fear is at 28, and the next big stablecoin inflow — or outflow — decides the direction.
Source: Glassnode, CoinGecko
Do you think the $14.2B stablecoin drain is the real reason this rally keeps stalling — or just a symptom of the fear?
Follow for daily crypto updates.
#BTC #Crypto #Bitcoin
Not financial advice.
81
🚨 BREAKING: MSCI just kicked Strategy out of its indexes — the verdict is in.
MSCI confirmed late Wednesday that Strategy — holder of 850,364 Bitcoin, over 4% of all $BTC that will ever exist — will be deleted from the MSCI USA, World and ACWI indexes after the close on November 30. Metaplanet and Upexi were deleted too; Ethereum treasury firm Sharplink is on a watchlist.
Strategy's shares fell about 2.5% in after-hours trading to near $119. Passive funds must sell an estimated $1.57–$2.8 billion of the stock by November 30 — and J.P. Morgan warns it could reach $8.8 billion if other index providers follow MSCI's lead.
The buying machine is already slowing. Last week, only 28.9% of the cash Strategy raised — $81.9 million — actually went into Bitcoin, while $188 million went to preferred-stock buybacks. Its market value to net asset value has compressed to just 1.08x, barely above its Bitcoin. With $BTC near $73,750, below Strategy's $75,456 average cost, every new buy comes at a paper loss.
Yet $BTC is holding up near $73,750, with $ETH near $2,056, and ETF outflows slowed to $95 million on Tuesday — the fourth straight day of selling, but the smallest yet. Fear & Greed sits at 28, deep in Fear, while Zcash — the crowd's favourite refuge this week — hovers near $1,000.
My take: the verdict removes the uncertainty, not the selling. Nothing forces Strategy to sell a single Bitcoin — the 850,364 coins stay put. What it removes is the permanent, price-insensitive buyer index inclusion gave the stock. If the premium keeps compressing, the equity-funded buying that absorbed billions in Bitcoin supply slows with it.
Levels to watch: support at $72,700–$73,000, then $70,000. Resistance at $74,500, then $76,100 — the 50-week average that must be reclaimed to turn this market around.
Do you think the MSCI exit breaks the Strategy premium for good — or is this the dip buyers have been waiting for?
Source: Reuters / Cointelegraph, 12 Nov 2026
Follow for daily crypto updates.
#Bitcoin #Crypto #BTC
Not financial advice.
🚨 BREAKING: MSCI just kicked Strategy out of its indexes — the verdict is in.
MSCI confirmed late Wednesday that Strategy — holder of 850,364 Bitcoin, over 4% of all $BTC that will ever exist — will be deleted from the MSCI USA, World and ACWI indexes after the close on November 30. Metaplanet and Upexi were deleted too; Ethereum treasury firm Sharplink is on a watchlist.
Strategy's shares fell about 2.5% in after-hours trading to near $119. Passive funds must sell an estimated $1.57–$2.8 billion of the stock by November 30 — and J.P. Morgan warns it could reach $8.8 billion if other index providers follow MSCI's lead.
The buying machine is already slowing. Last week, only 28.9% of the cash Strategy raised — $81.9 million — actually went into Bitcoin, while $188 million went to preferred-stock buybacks. Its market value to net asset value has compressed to just 1.08x, barely above its Bitcoin. With $BTC near $73,750, below Strategy's $75,456 average cost, every new buy comes at a paper loss.
Yet $BTC is holding up near $73,750, with $ETH near $2,056, and ETF outflows slowed to $95 million on Tuesday — the fourth straight day of selling, but the smallest yet. Fear & Greed sits at 28, deep in Fear, while Zcash — the crowd's favourite refuge this week — hovers near $1,000.
My take: the verdict removes the uncertainty, not the selling. Nothing forces Strategy to sell a single Bitcoin — the 850,364 coins stay put. What it removes is the permanent, price-insensitive buyer index inclusion gave the stock. If the premium keeps compressing, the equity-funded buying that absorbed billions in Bitcoin supply slows with it.
Levels to watch: support at $72,700–$73,000, then $70,000. Resistance at $74,500, then $76,100 — the 50-week average that must be reclaimed to turn this market around.
Do you think the MSCI exit breaks the Strategy premium for good — or is this the dip buyers have been waiting for?
Source: Reuters / Cointelegraph, 12 Nov 2026
Follow for daily crypto updates.
#Bitcoin #Crypto #BTC
Not financial advice.
MSCI confirmed late Wednesday that Strategy — holder of 850,364 Bitcoin, over 4% of all $BTC that will ever exist — will be deleted from the MSCI USA, World and ACWI indexes after the close on November 30. Metaplanet and Upexi were deleted too; Ethereum treasury firm Sharplink is on a watchlist.
Strategy's shares fell about 2.5% in after-hours trading to near $119. Passive funds must sell an estimated $1.57–$2.8 billion of the stock by November 30 — and J.P. Morgan warns it could reach $8.8 billion if other index providers follow MSCI's lead.
The buying machine is already slowing. Last week, only 28.9% of the cash Strategy raised — $81.9 million — actually went into Bitcoin, while $188 million went to preferred-stock buybacks. Its market value to net asset value has compressed to just 1.08x, barely above its Bitcoin. With $BTC near $73,750, below Strategy's $75,456 average cost, every new buy comes at a paper loss.
Yet $BTC is holding up near $73,750, with $ETH near $2,056, and ETF outflows slowed to $95 million on Tuesday — the fourth straight day of selling, but the smallest yet. Fear & Greed sits at 28, deep in Fear, while Zcash — the crowd's favourite refuge this week — hovers near $1,000.
My take: the verdict removes the uncertainty, not the selling. Nothing forces Strategy to sell a single Bitcoin — the 850,364 coins stay put. What it removes is the permanent, price-insensitive buyer index inclusion gave the stock. If the premium keeps compressing, the equity-funded buying that absorbed billions in Bitcoin supply slows with it.
Levels to watch: support at $72,700–$73,000, then $70,000. Resistance at $74,500, then $76,100 — the 50-week average that must be reclaimed to turn this market around.
Do you think the MSCI exit breaks the Strategy premium for good — or is this the dip buyers have been waiting for?
Source: Reuters / Cointelegraph, 12 Nov 2026
Follow for daily crypto updates.
#Bitcoin #Crypto #BTC
Not financial advice.
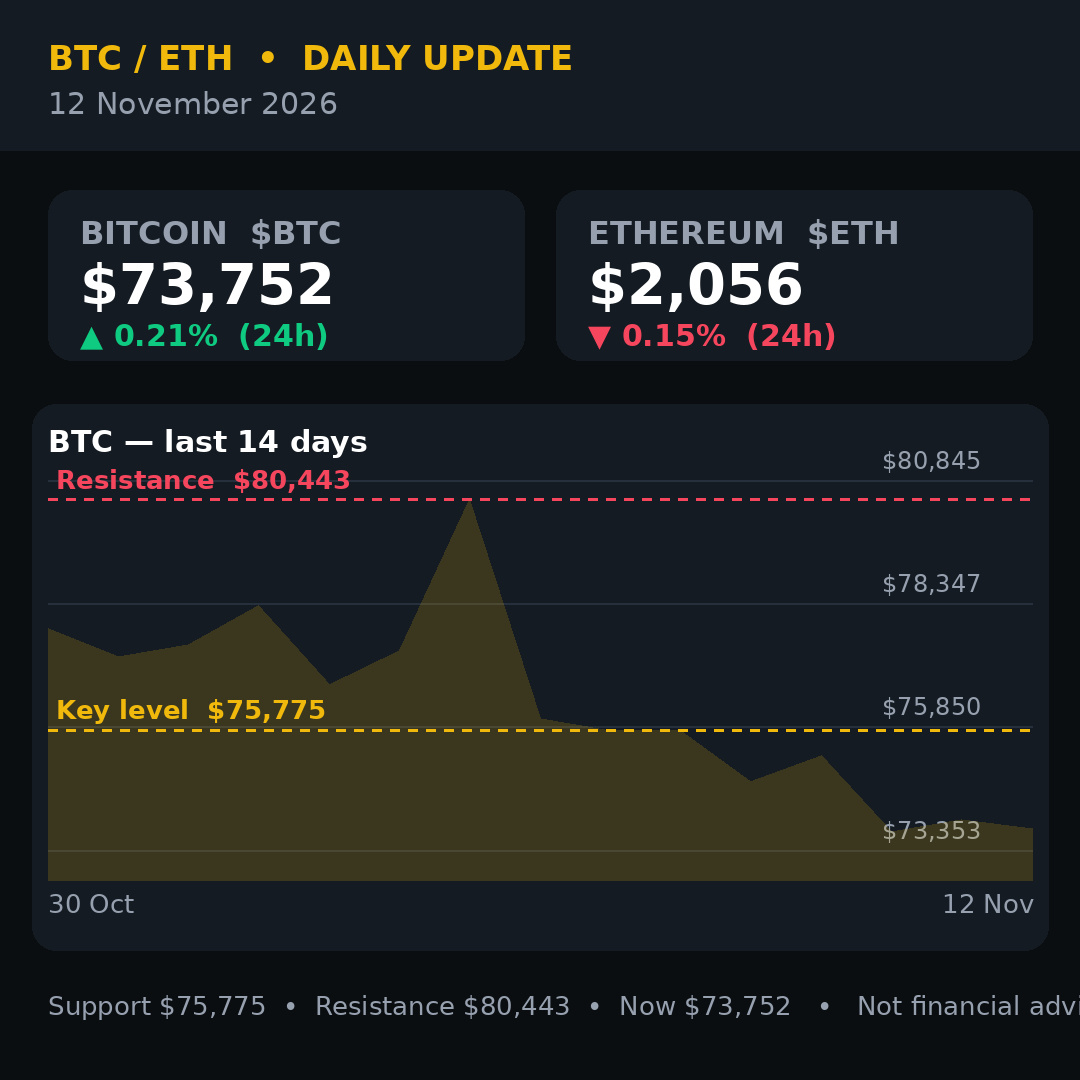
128
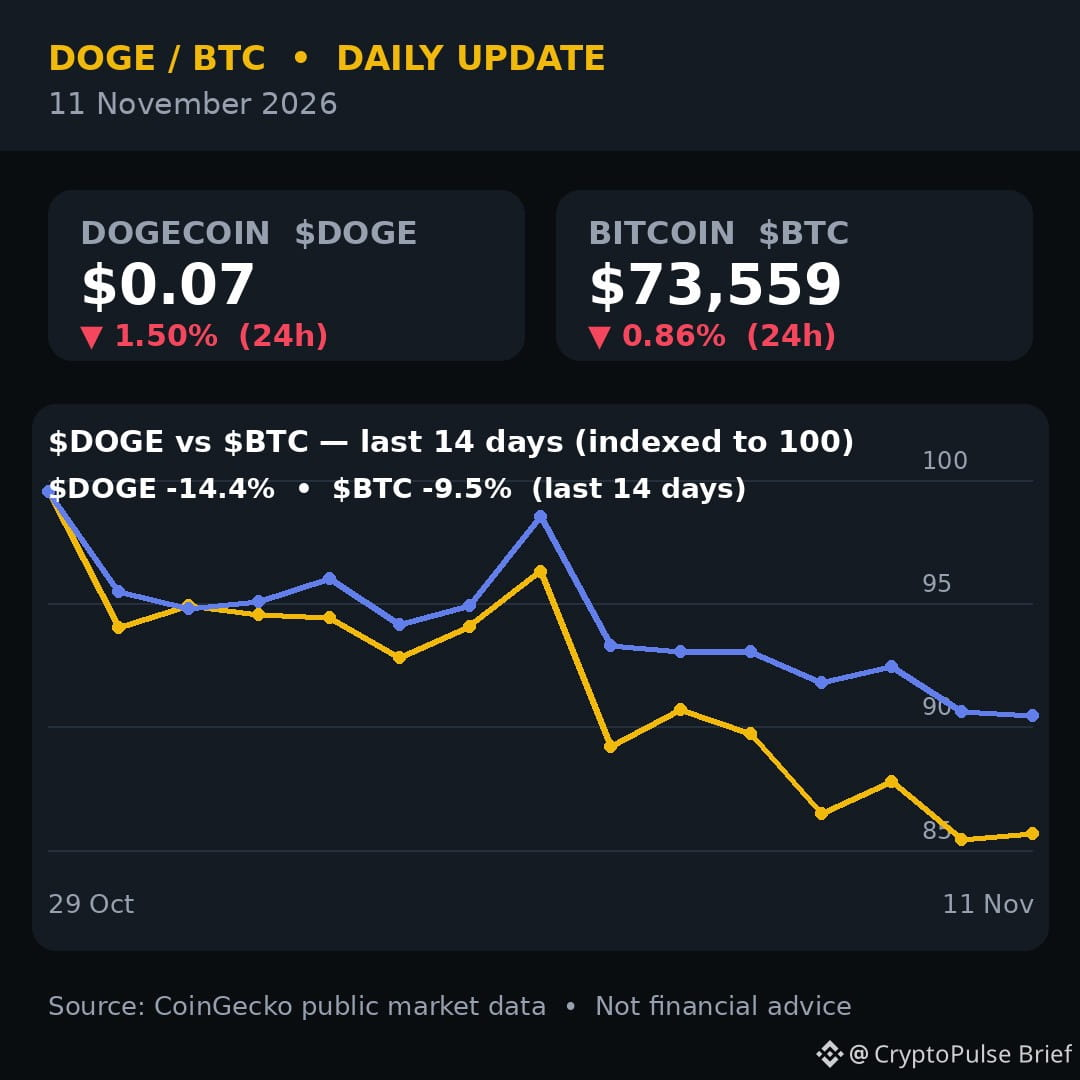
Bitcoin just took the hottest inflation print in months — and barely moved. That is the story.
October CPI came in at +0.4% against +0.3% expected, and traders now price a roughly 90% chance of a December Fed rate hike. Yet $BTC is holding near $73,600, down less than 1% in 24 hours, after dipping to $72,700 on Tuesday — its lowest since August. $ETH is near $2,055, down about 3%.
Here is what changed: the ETF selling is slowing. U.S. spot Bitcoin ETFs lost just $95 million on Tuesday, down from $201 million on Monday, $412 million on Friday and $430 million on Thursday. Four straight days of outflows, but the pace is fading fast. The Fear & Greed Index sits at 29 (Fear), and $591.9 million of leveraged positions were wiped out in 24 hours — 76% of them longs. That is a flush, not a panic.
My take: this is what a bottoming process looks like, not a collapse. Hot CPI, a Fed governor openly backing a hike, and $BTC still clinging to its 200-day moving average near $73,200. Sellers had every excuse to break it — and could not, yet. The risk is real though: lose $73,200 and the door opens to $70,000.
And while the big coins bled, the crowd looked elsewhere: Dogecoin is the most-searched coin on CoinGecko today, ahead of Avalanche and Zcash, and $DOGE is holding near $0.068, down only about 1.5% while the market fell harder. When traders go hunting in a red market, attention is the first thing that moves.
Levels to watch: support at $73,200 (the 200-day average), then $72,700 and $70,000. Resistance at $74,500, then $76,400 — the 365-day average that must be reclaimed to restore a bullish structure.
Do you think the ETF selling has peaked — or is this just a pause before the next leg down?
Source: CoinDesk, 11 Nov 2026; CoinGecko
Follow for daily crypto updates.
#Bitcoin #Crypto #DOGE
Not financial advice.
Bitcoin just took the hottest inflation print in months — and barely moved. That is the story.
October CPI came in at +0.4% against +0.3% expected, and traders now price a roughly 90% chance of a December Fed rate hike. Yet $BTC is holding near $73,600, down less than 1% in 24 hours, after dipping to $72,700 on Tuesday — its lowest since August. $ETH is near $2,055, down about 3%.
Here is what changed: the ETF selling is slowing. U.S. spot Bitcoin ETFs lost just $95 million on Tuesday, down from $201 million on Monday, $412 million on Friday and $430 million on Thursday. Four straight days of outflows, but the pace is fading fast. The Fear & Greed Index sits at 29 (Fear), and $591.9 million of leveraged positions were wiped out in 24 hours — 76% of them longs. That is a flush, not a panic.
My take: this is what a bottoming process looks like, not a collapse. Hot CPI, a Fed governor openly backing a hike, and $BTC still clinging to its 200-day moving average near $73,200. Sellers had every excuse to break it — and could not, yet. The risk is real though: lose $73,200 and the door opens to $70,000.
And while the big coins bled, the crowd looked elsewhere: Dogecoin is the most-searched coin on CoinGecko today, ahead of Avalanche and Zcash, and $DOGE is holding near $0.068, down only about 1.5% while the market fell harder. When traders go hunting in a red market, attention is the first thing that moves.
Levels to watch: support at $73,200 (the 200-day average), then $72,700 and $70,000. Resistance at $74,500, then $76,400 — the 365-day average that must be reclaimed to restore a bullish structure.
Do you think the ETF selling has peaked — or is this just a pause before the next leg down?
Source: CoinDesk, 11 Nov 2026; CoinGecko
Follow for daily crypto updates.
#Bitcoin #Crypto #DOGE
Not financial advice.
October CPI came in at +0.4% against +0.3% expected, and traders now price a roughly 90% chance of a December Fed rate hike. Yet $BTC is holding near $73,600, down less than 1% in 24 hours, after dipping to $72,700 on Tuesday — its lowest since August. $ETH is near $2,055, down about 3%.
Here is what changed: the ETF selling is slowing. U.S. spot Bitcoin ETFs lost just $95 million on Tuesday, down from $201 million on Monday, $412 million on Friday and $430 million on Thursday. Four straight days of outflows, but the pace is fading fast. The Fear & Greed Index sits at 29 (Fear), and $591.9 million of leveraged positions were wiped out in 24 hours — 76% of them longs. That is a flush, not a panic.
My take: this is what a bottoming process looks like, not a collapse. Hot CPI, a Fed governor openly backing a hike, and $BTC still clinging to its 200-day moving average near $73,200. Sellers had every excuse to break it — and could not, yet. The risk is real though: lose $73,200 and the door opens to $70,000.
And while the big coins bled, the crowd looked elsewhere: Dogecoin is the most-searched coin on CoinGecko today, ahead of Avalanche and Zcash, and $DOGE is holding near $0.068, down only about 1.5% while the market fell harder. When traders go hunting in a red market, attention is the first thing that moves.
Levels to watch: support at $73,200 (the 200-day average), then $72,700 and $70,000. Resistance at $74,500, then $76,400 — the 365-day average that must be reclaimed to restore a bullish structure.
Do you think the ETF selling has peaked — or is this just a pause before the next leg down?
Source: CoinDesk, 11 Nov 2026; CoinGecko
Follow for daily crypto updates.
#Bitcoin #Crypto #DOGE
Not financial advice.
39
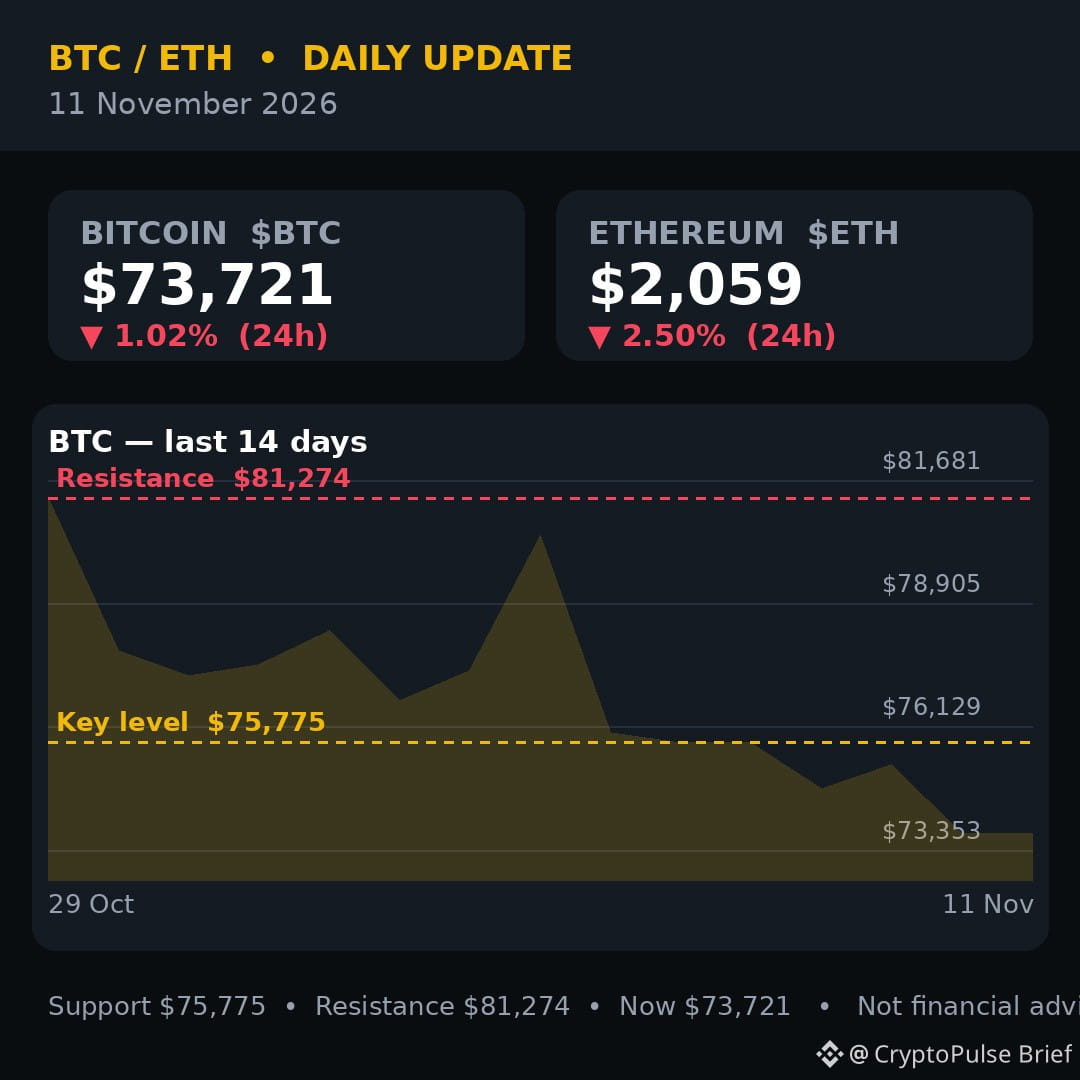
🚨 BREAKING: $2.8 billion of forced selling could hit Strategy this month — and every $BTC holder should watch one date: November 12.
MSCI has put Strategy — the company holding more than 850,000 Bitcoin — on its proposed removal list. The index provider announces its final decision after 6 a.m. on November 12. If Strategy is removed, passive funds tracking MSCI would have to sell an estimated $1.57 billion to $2.8 billion of its shares by November 30.
That matters for crypto because Strategy is the single biggest corporate buyer of $BTC. Its whole model runs on an equity premium: shares trade above the value of the Bitcoin on its balance sheet, and that premium funds new purchases. A forced sell-off compresses the premium — and a compressed premium slows the buying machine that has absorbed billions of dollars of Bitcoin supply.
The timing could hardly be worse. $BTC slipped below $73,000 overnight, its lowest since August 20, after hot October CPI (+0.4% vs +0.3% expected) pushed December rate-hike odds toward 90%. The coin has now lost its 50-week moving average near $76,100, and $917 million of leveraged positions were wiped out in 24 hours. Ethereum is near $2,050, the Fear & Greed Index sits at 29, and Zcash is today's biggest large-cap loser, down over 12% toward the $1,000 level.
My take: this is not a Bitcoin problem, it is a Strategy problem — but the two are joined at the hip. If MSCI keeps Strategy in the index, the relief could be sharp: five straight red weekly candles have left the market primed for a squeeze. If it is removed, expect the premium to compress and $BTC to retest the $72,700 low.
Levels to watch: support at $72,700–$73,000, then $70,000. Resistance at $74,500, then $76,100 — reclaiming the 50-week average is the first sign the sellers are losing control.
Do you think MSCI removes Strategy — or does the stock survive the review?
Source: Binance News / PANews, 11 Nov 2026
Follow for daily crypto updates.
#Bitcoin #Crypto #BTC
Not financial advice.
🚨 BREAKING: $2.8 billion of forced selling could hit Strategy this month — and every $BTC holder should watch one date: November 12.
MSCI has put Strategy — the company holding more than 850,000 Bitcoin — on its proposed removal list. The index provider announces its final decision after 6 a.m. on November 12. If Strategy is removed, passive funds tracking MSCI would have to sell an estimated $1.57 billion to $2.8 billion of its shares by November 30.
That matters for crypto because Strategy is the single biggest corporate buyer of $BTC . Its whole model runs on an equity premium: shares trade above the value of the Bitcoin on its balance sheet, and that premium funds new purchases. A forced sell-off compresses the premium — and a compressed premium slows the buying machine that has absorbed billions of dollars of Bitcoin supply.
The timing could hardly be worse. $BTC slipped below $73,000 overnight, its lowest since August 20, after hot October CPI (+0.4% vs +0.3% expected) pushed December rate-hike odds toward 90%. The coin has now lost its 50-week moving average near $76,100, and $917 million of leveraged positions were wiped out in 24 hours. Ethereum is near $2,050, the Fear & Greed Index sits at 29, and Zcash is today's biggest large-cap loser, down over 12% toward the $1,000 level.
My take: this is not a Bitcoin problem, it is a Strategy problem — but the two are joined at the hip. If MSCI keeps Strategy in the index, the relief could be sharp: five straight red weekly candles have left the market primed for a squeeze. If it is removed, expect the premium to compress and $BTC to retest the $72,700 low.
Levels to watch: support at $72,700–$73,000, then $70,000. Resistance at $74,500, then $76,100 — reclaiming the 50-week average is the first sign the sellers are losing control.
Do you think MSCI removes Strategy — or does the stock survive the review?
Source: Binance News / PANews, 11 Nov 2026
Follow for daily crypto updates.
#Bitcoin #Crypto #BTC
Not financial advice.
MSCI has put Strategy — the company holding more than 850,000 Bitcoin — on its proposed removal list. The index provider announces its final decision after 6 a.m. on November 12. If Strategy is removed, passive funds tracking MSCI would have to sell an estimated $1.57 billion to $2.8 billion of its shares by November 30.
That matters for crypto because Strategy is the single biggest corporate buyer of $BTC . Its whole model runs on an equity premium: shares trade above the value of the Bitcoin on its balance sheet, and that premium funds new purchases. A forced sell-off compresses the premium — and a compressed premium slows the buying machine that has absorbed billions of dollars of Bitcoin supply.
The timing could hardly be worse. $BTC slipped below $73,000 overnight, its lowest since August 20, after hot October CPI (+0.4% vs +0.3% expected) pushed December rate-hike odds toward 90%. The coin has now lost its 50-week moving average near $76,100, and $917 million of leveraged positions were wiped out in 24 hours. Ethereum is near $2,050, the Fear & Greed Index sits at 29, and Zcash is today's biggest large-cap loser, down over 12% toward the $1,000 level.
My take: this is not a Bitcoin problem, it is a Strategy problem — but the two are joined at the hip. If MSCI keeps Strategy in the index, the relief could be sharp: five straight red weekly candles have left the market primed for a squeeze. If it is removed, expect the premium to compress and $BTC to retest the $72,700 low.
Levels to watch: support at $72,700–$73,000, then $70,000. Resistance at $74,500, then $76,100 — reclaiming the 50-week average is the first sign the sellers are losing control.
Do you think MSCI removes Strategy — or does the stock survive the review?
Source: Binance News / PANews, 11 Nov 2026
Follow for daily crypto updates.
#Bitcoin #Crypto #BTC
Not financial advice.
95
BlackRock's Bitcoin ETF has now lost money 7 days in a row — $1.66 BILLION gone since October 30. And 2026 flows just flipped negative.
Here's what the numbers say:
📉 $BTC ETFs: -$201M on Monday alone, the 3rd straight day of outflows. BlackRock's IBIT lost $213M by itself — more than the whole market's net outflow, because Morgan Stanley's fund took in $22M.
📉 $ETH ETFs: -$185M on Monday, with BlackRock's Ethereum fund losing $119M.
📉 Year-to-date, US spot Bitcoin ETFs are now -$1.1 BILLION. Compare that to +$25 BILLION of inflows by early November in both 2024 and 2025. A complete reversal.
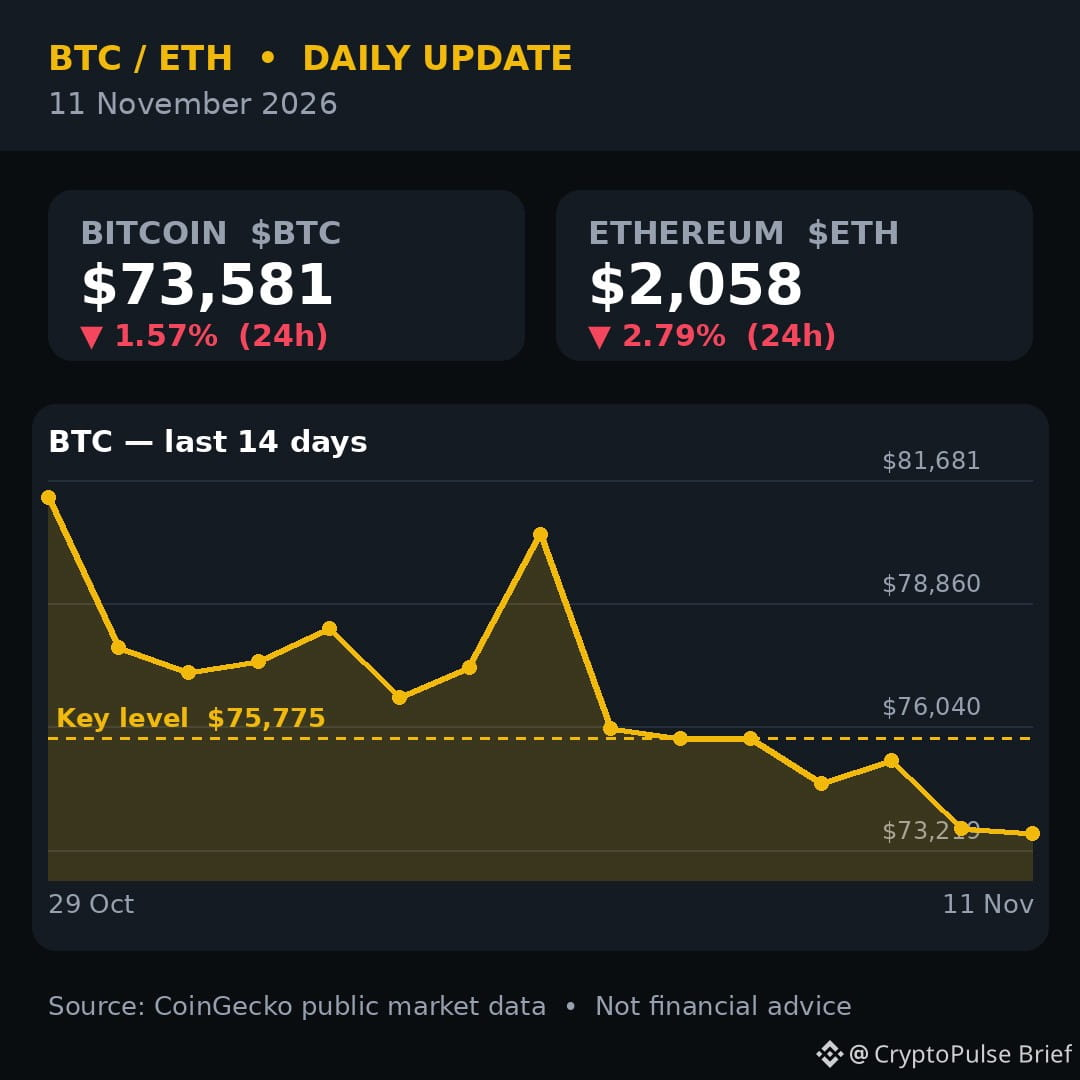
$BTC trades near $73,600, testing Sunday's $73,510 low. Another $204.5M in futures got liquidated in 24 hours, and the Fear & Greed Index sits at 32 — firmly in Fear. Markets now price an ~84% chance of a Fed rate hike in December.
But look closer: the money isn't all leaving crypto. AI coins are surging while $BTC bleeds — $FET is up 68% this week with social dominance up 439% (LunarCrush). That's rotation, not capitulation.
My take: this is institutions de-risking into a hawkish Fed, not a loss of faith in crypto itself. The ETF tap is the tape to watch — one day of inflows ends this story fast. Until then, $73,510 is the line in the sand. Lose it and $70,000 comes into play quickly, especially with thin Veterans Day liquidity today (US bond market closed).
Levels to watch:
Support: $73,510 → $72,180 → $70,000
Resistance: $74,600 → $75,000 → $75,600
Are these outflows a buy-the-dip setup, or the start of a slide to $70K? Tell me below 👇
Source: Farside Investors, CoinGlass
Follow for daily crypto updates.
#BTC #Crypto #BitcoinETF
Not financial advice.
BlackRock's Bitcoin ETF has now lost money 7 days in a row — $1.66 BILLION gone since October 30. And 2026 flows just flipped negative.
Here's what the numbers say:
📉 $BTC ETFs: -$201M on Monday alone, the 3rd straight day of outflows. BlackRock's IBIT lost $213M by itself — more than the whole market's net outflow, because Morgan Stanley's fund took in $22M.
📉 $ETH ETFs: -$185M on Monday, with BlackRock's Ethereum fund losing $119M.
📉 Year-to-date, US spot Bitcoin ETFs are now -$1.1 BILLION. Compare that to +$25 BILLION of inflows by early November in both 2024 and 2025. A complete reversal.
$BTC trades near $73,600, testing Sunday's $73,510 low. Another $204.5M in futures got liquidated in 24 hours, and the Fear & Greed Index sits at 32 — firmly in Fear. Markets now price an ~84% chance of a Fed rate hike in December.
But look closer: the money isn't all leaving crypto. AI coins are surging while $BTC bleeds — $FET is up 68% this week with social dominance up 439% (LunarCrush). That's rotation, not capitulation.
My take: this is institutions de-risking into a hawkish Fed, not a loss of faith in crypto itself. The ETF tap is the tape to watch — one day of inflows ends this story fast. Until then, $73,510 is the line in the sand. Lose it and $70,000 comes into play quickly, especially with thin Veterans Day liquidity today (US bond market closed).
Levels to watch:
Support: $73,510 → $72,180 → $70,000
Resistance: $74,600 → $75,000 → $75,600
Are these outflows a buy-the-dip setup, or the start of a slide to $70K? Tell me below 👇
Source: Farside Investors, CoinGlass
Follow for daily crypto updates.
#BTC #Crypto #BitcoinETF
Not financial advice.
Here's what the numbers say:
📉 $BTC ETFs: -$201M on Monday alone, the 3rd straight day of outflows. BlackRock's IBIT lost $213M by itself — more than the whole market's net outflow, because Morgan Stanley's fund took in $22M.
📉 $ETH ETFs: -$185M on Monday, with BlackRock's Ethereum fund losing $119M.
📉 Year-to-date, US spot Bitcoin ETFs are now -$1.1 BILLION. Compare that to +$25 BILLION of inflows by early November in both 2024 and 2025. A complete reversal.
$BTC trades near $73,600, testing Sunday's $73,510 low. Another $204.5M in futures got liquidated in 24 hours, and the Fear & Greed Index sits at 32 — firmly in Fear. Markets now price an ~84% chance of a Fed rate hike in December.
But look closer: the money isn't all leaving crypto. AI coins are surging while $BTC bleeds — $FET is up 68% this week with social dominance up 439% (LunarCrush). That's rotation, not capitulation.
My take: this is institutions de-risking into a hawkish Fed, not a loss of faith in crypto itself. The ETF tap is the tape to watch — one day of inflows ends this story fast. Until then, $73,510 is the line in the sand. Lose it and $70,000 comes into play quickly, especially with thin Veterans Day liquidity today (US bond market closed).
Levels to watch:
Support: $73,510 → $72,180 → $70,000
Resistance: $74,600 → $75,000 → $75,600
Are these outflows a buy-the-dip setup, or the start of a slide to $70K? Tell me below 👇
Source: Farside Investors, CoinGlass
Follow for daily crypto updates.
#BTC #Crypto #BitcoinETF
Not financial advice.
71
🚨 BREAKING: October CPI just came in HOT — and $200 million in crypto longs vanished in five minutes.
The Bureau of Labor Statistics reported headline inflation rose 0.4% in October, above every forecast in a pre-release survey that ranged from 0.19% to 0.28%. Core inflation, the number the Fed actually watches, held at 0.3% for a third straight month. There was no annual rate at all — the BLS never collected October 2025 prices during last year's government shutdown, so there is no base to compare against.
$BTC dropped from $74,770 to $73,525 in five minutes, touching $73,400 on Coinbase, and closed that window near $73,709. $ETH slipped under $2,050, its lowest in 11 weeks. Bitcoin has since steadied near $74,200, but the relief rally the market was begging for is off the table.
My take: this is the worst kind of surprise. A cool print was the one clean path to a bounce — Strategy underwater, ETF outflows at $2.13 billion over seven sessions, and fear at 32 on the Fear & Greed Index all pointed to a market that needed good news. Instead it got the opposite. Fed Governor Waller had already said a core reading around 0.3% could justify a larger December hike, and traders are now pricing a 25-basis-point increase on December 9, taking rates to 4.00%-4.25%. The next test is Friday's producer prices, then the Fed's preferred PCE gauge.
Levels to watch: $BTC must hold $73,500 — below it, $73,150 (the 200-day average) is next. Reclaim $75,590 and the panic trade starts to unwind. For $ETH, $2,060 is the line in the sand; $2,150 is the first resistance.
Hot CPI, hawkish Fed, bleeding ETFs — is this the bottom, or just the next leg down?
Source: U.S. Bureau of Labor Statistics / CoinDesk, 10 Nov 2026
Follow for daily crypto updates.
#BTC #Crypto #CPI
Not financial advice.
🚨 BREAKING: October CPI just came in HOT — and $200 million in crypto longs vanished in five minutes.
The Bureau of Labor Statistics reported headline inflation rose 0.4% in October, above every forecast in a pre-release survey that ranged from 0.19% to 0.28%. Core inflation, the number the Fed actually watches, held at 0.3% for a third straight month. There was no annual rate at all — the BLS never collected October 2025 prices during last year's government shutdown, so there is no base to compare against.
$BTC dropped from $74,770 to $73,525 in five minutes, touching $73,400 on Coinbase, and closed that window near $73,709. $ETH slipped under $2,050, its lowest in 11 weeks. Bitcoin has since steadied near $74,200, but the relief rally the market was begging for is off the table.
My take: this is the worst kind of surprise. A cool print was the one clean path to a bounce — Strategy underwater, ETF outflows at $2.13 billion over seven sessions, and fear at 32 on the Fear & Greed Index all pointed to a market that needed good news. Instead it got the opposite. Fed Governor Waller had already said a core reading around 0.3% could justify a larger December hike, and traders are now pricing a 25-basis-point increase on December 9, taking rates to 4.00%-4.25%. The next test is Friday's producer prices, then the Fed's preferred PCE gauge.
Levels to watch: $BTC must hold $73,500 — below it, $73,150 (the 200-day average) is next. Reclaim $75,590 and the panic trade starts to unwind. For $ETH , $2,060 is the line in the sand; $2,150 is the first resistance.
Hot CPI, hawkish Fed, bleeding ETFs — is this the bottom, or just the next leg down?
Source: U.S. Bureau of Labor Statistics / CoinDesk, 10 Nov 2026
Follow for daily crypto updates.
#BTC #Crypto #CPI
Not financial advice.
The Bureau of Labor Statistics reported headline inflation rose 0.4% in October, above every forecast in a pre-release survey that ranged from 0.19% to 0.28%. Core inflation, the number the Fed actually watches, held at 0.3% for a third straight month. There was no annual rate at all — the BLS never collected October 2025 prices during last year's government shutdown, so there is no base to compare against.
$BTC dropped from $74,770 to $73,525 in five minutes, touching $73,400 on Coinbase, and closed that window near $73,709. $ETH slipped under $2,050, its lowest in 11 weeks. Bitcoin has since steadied near $74,200, but the relief rally the market was begging for is off the table.
My take: this is the worst kind of surprise. A cool print was the one clean path to a bounce — Strategy underwater, ETF outflows at $2.13 billion over seven sessions, and fear at 32 on the Fear & Greed Index all pointed to a market that needed good news. Instead it got the opposite. Fed Governor Waller had already said a core reading around 0.3% could justify a larger December hike, and traders are now pricing a 25-basis-point increase on December 9, taking rates to 4.00%-4.25%. The next test is Friday's producer prices, then the Fed's preferred PCE gauge.
Levels to watch: $BTC must hold $73,500 — below it, $73,150 (the 200-day average) is next. Reclaim $75,590 and the panic trade starts to unwind. For $ETH , $2,060 is the line in the sand; $2,150 is the first resistance.
Hot CPI, hawkish Fed, bleeding ETFs — is this the bottom, or just the next leg down?
Source: U.S. Bureau of Labor Statistics / CoinDesk, 10 Nov 2026
Follow for daily crypto updates.
#BTC #Crypto #CPI
Not financial advice.
91
🚨 BREAKING: The New York Stock Exchange just picked a crypto chain to settle tokenized stocks — and it is not Ethereum.
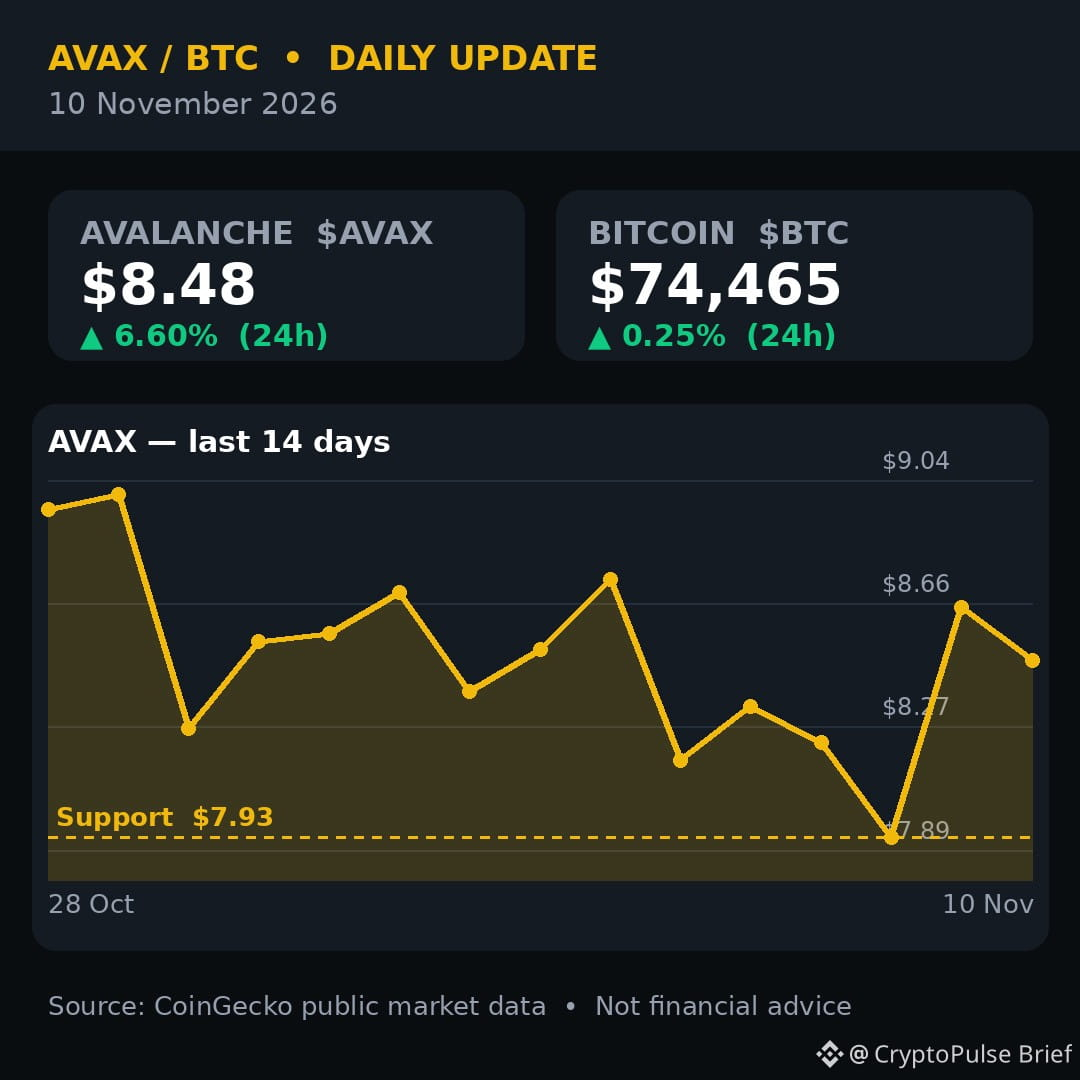
It is Avalanche. Ava Labs confirmed on 9 November that $AVAX will provide the core ledger for the clearing firm behind an NYSE-affiliated platform for 24/7 trading, clearing and settlement of tokenized securities, funded with stablecoins.
The market answered fast. $AVAX trades near $8.50, up about 7.8% in 24 hours, after spiking to $9.01 — a 12.7% jump from its daily low. Volume exploded to roughly $537 million, up nearly 448% in a day. Futures open interest rose 14% to about $382 million, and shorts made up 61.6% of liquidations — the bears got squeezed as much as the bulls got paid. Charles Schwab widened its crypto coverage to Avalanche the same day.
Meanwhile $BTC barely moved, holding near $74,500 ahead of today's CPI print. While Bitcoin waits on macro, $AVAX is running on a real institutional headline.
My take: this is the validation money cannot buy. The NYSE chose Avalanche for speed, reliability, predictable costs and network controls — exactly what institutions demand before putting real settlement on a chain. But stay honest: the platform still needs regulatory approval, and it serves the clearing firm, not live equity trades yet. The market is pricing a future use case, not today's fees. And $AVAX is still down about 53% over the past year — a sharp reversal, not a confirmed trend change.
Levels to watch: $9 is the wall — a clean break opens the road to $10. Lose $8.00 and the spike fades; $7.83 is the line bulls must defend.
Is the NYSE's pick the moment Avalanche becomes Wall Street's chain — or a sell-the-news spike?
Source: CryptoNews / Ava Labs, 10 Nov 2026
Follow for daily crypto updates.
#AVAX #Crypto #NYSE
Not financial advice.
🚨 BREAKING: The New York Stock Exchange just picked a crypto chain to settle tokenized stocks — and it is not Ethereum.
It is Avalanche. Ava Labs confirmed on 9 November that $AVAX will provide the core ledger for the clearing firm behind an NYSE-affiliated platform for 24/7 trading, clearing and settlement of tokenized securities, funded with stablecoins.
The market answered fast. $AVAX trades near $8.50, up about 7.8% in 24 hours, after spiking to $9.01 — a 12.7% jump from its daily low. Volume exploded to roughly $537 million, up nearly 448% in a day. Futures open interest rose 14% to about $382 million, and shorts made up 61.6% of liquidations — the bears got squeezed as much as the bulls got paid. Charles Schwab widened its crypto coverage to Avalanche the same day.
Meanwhile $BTC barely moved, holding near $74,500 ahead of today's CPI print. While Bitcoin waits on macro, $AVAX is running on a real institutional headline.
My take: this is the validation money cannot buy. The NYSE chose Avalanche for speed, reliability, predictable costs and network controls — exactly what institutions demand before putting real settlement on a chain. But stay honest: the platform still needs regulatory approval, and it serves the clearing firm, not live equity trades yet. The market is pricing a future use case, not today's fees. And $AVAX is still down about 53% over the past year — a sharp reversal, not a confirmed trend change.
Levels to watch: $9 is the wall — a clean break opens the road to $10. Lose $8.00 and the spike fades; $7.83 is the line bulls must defend.
Is the NYSE's pick the moment Avalanche becomes Wall Street's chain — or a sell-the-news spike?
Source: CryptoNews / Ava Labs, 10 Nov 2026
Follow for daily crypto updates.
#AVAX #Crypto #NYSE
Not financial advice.
It is Avalanche. Ava Labs confirmed on 9 November that $AVAX will provide the core ledger for the clearing firm behind an NYSE-affiliated platform for 24/7 trading, clearing and settlement of tokenized securities, funded with stablecoins.
The market answered fast. $AVAX trades near $8.50, up about 7.8% in 24 hours, after spiking to $9.01 — a 12.7% jump from its daily low. Volume exploded to roughly $537 million, up nearly 448% in a day. Futures open interest rose 14% to about $382 million, and shorts made up 61.6% of liquidations — the bears got squeezed as much as the bulls got paid. Charles Schwab widened its crypto coverage to Avalanche the same day.
Meanwhile $BTC barely moved, holding near $74,500 ahead of today's CPI print. While Bitcoin waits on macro, $AVAX is running on a real institutional headline.
My take: this is the validation money cannot buy. The NYSE chose Avalanche for speed, reliability, predictable costs and network controls — exactly what institutions demand before putting real settlement on a chain. But stay honest: the platform still needs regulatory approval, and it serves the clearing firm, not live equity trades yet. The market is pricing a future use case, not today's fees. And $AVAX is still down about 53% over the past year — a sharp reversal, not a confirmed trend change.
Levels to watch: $9 is the wall — a clean break opens the road to $10. Lose $8.00 and the spike fades; $7.83 is the line bulls must defend.
Is the NYSE's pick the moment Avalanche becomes Wall Street's chain — or a sell-the-news spike?
Source: CryptoNews / Ava Labs, 10 Nov 2026
Follow for daily crypto updates.
#AVAX #Crypto #NYSE
Not financial advice.
102
The biggest Bitcoin holder on Earth is now underwater — and today's CPI print decides what happens next.
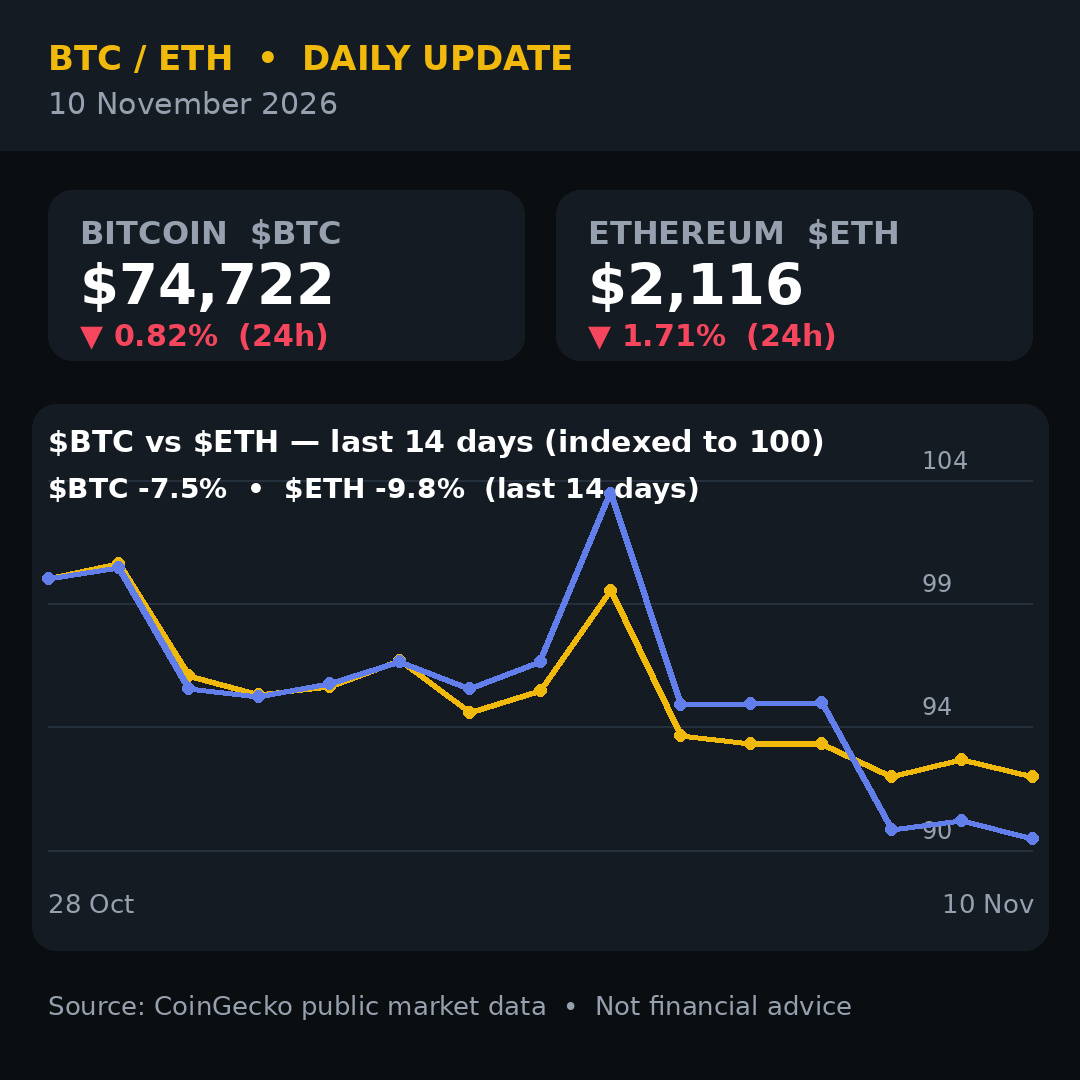
$BTC trades near $74,700, just above $74,400 support after closing its fifth straight red week. That weekly close below the 50-week moving average (~$75,200-$75,500) is the first in two months. The pullback from the September high now runs close to 16%.
Here is the number that should make everyone pause: Strategy holds 850,364 $BTC at an average cost of $75,456, and just bought 1,036 more at $79,012, per its November 9 SEC filing. Spot now sits below the largest corporate holder's cost basis. When the biggest buyer is underwater, the market listens.
The whales agree. Glassnode data shows large Hyperliquid traders have flipped their Bitcoin perpetual positions from net long to net short — after seven months long. Spot $BTC ETFs added to the pressure with roughly $1.28 billion in net outflows last week. $ETH sits near $2,116, still below its 200-day average.
Now the whole market waits on one number. October CPI lands today at 8:30am ET, expected at just 0.2% month-on-month after September's hot 0.6%. A cool print could be the relief rally this market is begging for — a soft reading lifted $BTC about 10% in one day back in November 2022. A hot print does the opposite: it pushes December rate-hike odds above 90% and puts the $73,500 low straight back in play.
My take: this is no longer a crypto story, it is a macro story. Charts, whales and ETF flows all point the same way — down — and only an inflation surprise flips the script today.
Levels to watch: $BTC support at $74,400, then $73,500. Reclaim $75,590 and the panic starts to unwind; $76,040 is the first resistance. For $ETH, $2,060 is the line in the sand, $2,150 the first hurdle.
Cool CPI or hot CPI — which way does $BTC break first?
Source: Bitfinex Alpha / Glassnode via BraveNewCoin, 10 Nov 2026
Follow for daily crypto updates.
#BTC #Crypto #CPI
Not financial advice.
The biggest Bitcoin holder on Earth is now underwater — and today's CPI print decides what happens next.
$BTC trades near $74,700, just above $74,400 support after closing its fifth straight red week. That weekly close below the 50-week moving average (~$75,200-$75,500) is the first in two months. The pullback from the September high now runs close to 16%.
Here is the number that should make everyone pause: Strategy holds 850,364 $BTC at an average cost of $75,456, and just bought 1,036 more at $79,012, per its November 9 SEC filing. Spot now sits below the largest corporate holder's cost basis. When the biggest buyer is underwater, the market listens.
The whales agree. Glassnode data shows large Hyperliquid traders have flipped their Bitcoin perpetual positions from net long to net short — after seven months long. Spot $BTC ETFs added to the pressure with roughly $1.28 billion in net outflows last week. $ETH sits near $2,116, still below its 200-day average.
Now the whole market waits on one number. October CPI lands today at 8:30am ET, expected at just 0.2% month-on-month after September's hot 0.6%. A cool print could be the relief rally this market is begging for — a soft reading lifted $BTC about 10% in one day back in November 2022. A hot print does the opposite: it pushes December rate-hike odds above 90% and puts the $73,500 low straight back in play.
My take: this is no longer a crypto story, it is a macro story. Charts, whales and ETF flows all point the same way — down — and only an inflation surprise flips the script today.
Levels to watch: $BTC support at $74,400, then $73,500. Reclaim $75,590 and the panic starts to unwind; $76,040 is the first resistance. For $ETH , $2,060 is the line in the sand, $2,150 the first hurdle.
Cool CPI or hot CPI — which way does $BTC break first?
Source: Bitfinex Alpha / Glassnode via BraveNewCoin, 10 Nov 2026
Follow for daily crypto updates.
#BTC #Crypto #CPI
Not financial advice.
$BTC trades near $74,700, just above $74,400 support after closing its fifth straight red week. That weekly close below the 50-week moving average (~$75,200-$75,500) is the first in two months. The pullback from the September high now runs close to 16%.
Here is the number that should make everyone pause: Strategy holds 850,364 $BTC at an average cost of $75,456, and just bought 1,036 more at $79,012, per its November 9 SEC filing. Spot now sits below the largest corporate holder's cost basis. When the biggest buyer is underwater, the market listens.
The whales agree. Glassnode data shows large Hyperliquid traders have flipped their Bitcoin perpetual positions from net long to net short — after seven months long. Spot $BTC ETFs added to the pressure with roughly $1.28 billion in net outflows last week. $ETH sits near $2,116, still below its 200-day average.
Now the whole market waits on one number. October CPI lands today at 8:30am ET, expected at just 0.2% month-on-month after September's hot 0.6%. A cool print could be the relief rally this market is begging for — a soft reading lifted $BTC about 10% in one day back in November 2022. A hot print does the opposite: it pushes December rate-hike odds above 90% and puts the $73,500 low straight back in play.
My take: this is no longer a crypto story, it is a macro story. Charts, whales and ETF flows all point the same way — down — and only an inflation surprise flips the script today.
Levels to watch: $BTC support at $74,400, then $73,500. Reclaim $75,590 and the panic starts to unwind; $76,040 is the first resistance. For $ETH , $2,060 is the line in the sand, $2,150 the first hurdle.
Cool CPI or hot CPI — which way does $BTC break first?
Source: Bitfinex Alpha / Glassnode via BraveNewCoin, 10 Nov 2026
Follow for daily crypto updates.
#BTC #Crypto #CPI
Not financial advice.
106
🚨 BREAKING: COINBASE JUST BECAME A FEDERALLY CHARTERED BANK
While the market bleeds, the biggest US exchange just crossed a line crypto has waited years for. Coinbase has won a full national trust bank charter from the OCC — its institutional custody business now sits under direct federal banking supervision.
The charter became effective November 6, upgrading the conditional approval from April, after an application filed in October 2025. Coinbase will move its existing New York-regulated custody business into the federal entity over three years. Ripple secured its own final OCC charter on October 26 — the federal door is now open, and the biggest names are walking through it.
Let me be precise: this is a trust charter, not a retail bank. No ordinary deposits, no lending, no stablecoin issuance. But that misses the point. Federal supervision is what pension funds, endowments and corporate treasuries have waited for before trusting an exchange with serious size. Custody is the plumbing of institutional crypto — and the plumbing just got a federal stamp.
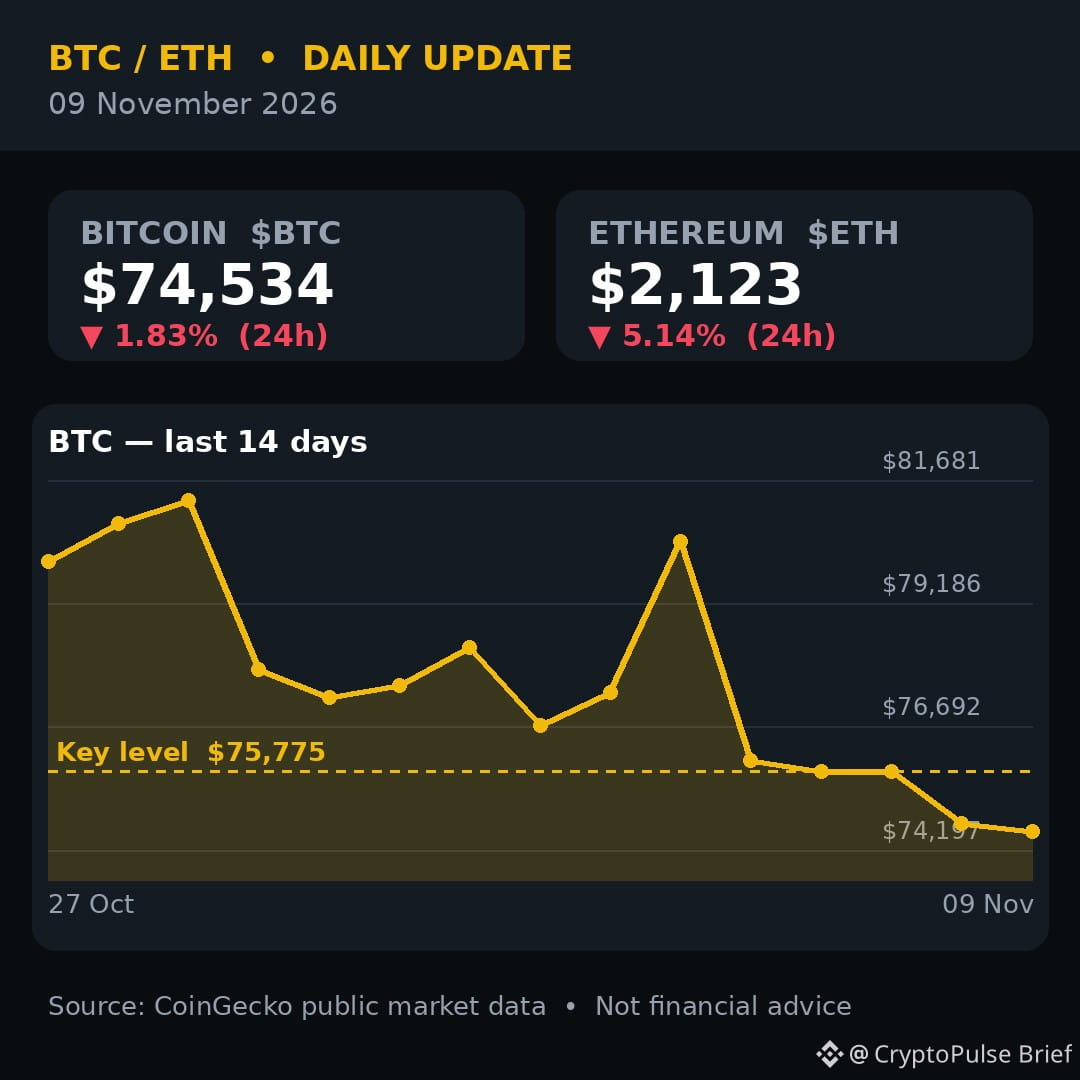
Meanwhile $BTC trades near $74,500 after Sunday's flush to $73,510, its lowest since August, and $ETH sits near $2,123 after breaking below its 200-day average. The market is scared. The infrastructure is not.
Levels to watch: $BTC must hold $73,500 — below it, $73,150 (the 200-day average) is next. Reclaim $75,590 and the panic trade starts to unwind. For $ETH, $2,060 is the line in the sand; $2,150 is the first resistance.
Bad day for prices, good day for the industry. Which matters more to you — the chart or the charter?
Source: Bitcoin Magazine / CoinDesk, 9 Nov 2026
Follow for daily crypto updates.
#BTC #Crypto #Coinbase
Not financial advice.
🚨 BREAKING: COINBASE JUST BECAME A FEDERALLY CHARTERED BANK
While the market bleeds, the biggest US exchange just crossed a line crypto has waited years for. Coinbase has won a full national trust bank charter from the OCC — its institutional custody business now sits under direct federal banking supervision.
The charter became effective November 6, upgrading the conditional approval from April, after an application filed in October 2025. Coinbase will move its existing New York-regulated custody business into the federal entity over three years. Ripple secured its own final OCC charter on October 26 — the federal door is now open, and the biggest names are walking through it.
Let me be precise: this is a trust charter, not a retail bank. No ordinary deposits, no lending, no stablecoin issuance. But that misses the point. Federal supervision is what pension funds, endowments and corporate treasuries have waited for before trusting an exchange with serious size. Custody is the plumbing of institutional crypto — and the plumbing just got a federal stamp.
Meanwhile $BTC trades near $74,500 after Sunday's flush to $73,510, its lowest since August, and $ETH sits near $2,123 after breaking below its 200-day average. The market is scared. The infrastructure is not.
Levels to watch: $BTC must hold $73,500 — below it, $73,150 (the 200-day average) is next. Reclaim $75,590 and the panic trade starts to unwind. For $ETH , $2,060 is the line in the sand; $2,150 is the first resistance.
Bad day for prices, good day for the industry. Which matters more to you — the chart or the charter?
Source: Bitcoin Magazine / CoinDesk, 9 Nov 2026
Follow for daily crypto updates.
#BTC #Crypto #Coinbase
Not financial advice.
While the market bleeds, the biggest US exchange just crossed a line crypto has waited years for. Coinbase has won a full national trust bank charter from the OCC — its institutional custody business now sits under direct federal banking supervision.
The charter became effective November 6, upgrading the conditional approval from April, after an application filed in October 2025. Coinbase will move its existing New York-regulated custody business into the federal entity over three years. Ripple secured its own final OCC charter on October 26 — the federal door is now open, and the biggest names are walking through it.
Let me be precise: this is a trust charter, not a retail bank. No ordinary deposits, no lending, no stablecoin issuance. But that misses the point. Federal supervision is what pension funds, endowments and corporate treasuries have waited for before trusting an exchange with serious size. Custody is the plumbing of institutional crypto — and the plumbing just got a federal stamp.
Meanwhile $BTC trades near $74,500 after Sunday's flush to $73,510, its lowest since August, and $ETH sits near $2,123 after breaking below its 200-day average. The market is scared. The infrastructure is not.
Levels to watch: $BTC must hold $73,500 — below it, $73,150 (the 200-day average) is next. Reclaim $75,590 and the panic trade starts to unwind. For $ETH , $2,060 is the line in the sand; $2,150 is the first resistance.
Bad day for prices, good day for the industry. Which matters more to you — the chart or the charter?
Source: Bitcoin Magazine / CoinDesk, 9 Nov 2026
Follow for daily crypto updates.
#BTC #Crypto #Coinbase
Not financial advice.
104
While Bitcoin fights to hold $75K, one major coin is bleeding twice as fast — and almost nobody is talking about it.
$XRP is down about 6% in the last 24 hours to $1.09, making it the weakest major coin today. It is now down roughly 12.6% on the week. Meanwhile $BTC is holding near $74,260, down just over 2%, and Ether has slid to around $2,130, down more than 4% — but XRP is falling harder than all of them.
Here is what it means: this is no longer just a Bitcoin story. When the biggest altcoins start falling faster than Bitcoin, it tells you risk appetite is draining out of the whole market. Traders cut the riskiest positions first, and XRP — one of the most widely held altcoins — is where that shows up first.
Levels to watch: $1.00 is the big psychological line for XRP. Losing it puts the August lows back in play. On the upside, reclaiming $1.20 would be the first sign sellers are losing control. For Bitcoin, $73,500 is the line that has to hold — it was Sunday's low.
Is XRP's drop a buying opportunity, or a warning that altcoins have further to fall?
Source: CoinGecko, 9 Nov 2026
Follow for daily crypto updates.
#XRP #Crypto #BTC
Not financial advice.
While Bitcoin fights to hold $75K, one major coin is bleeding twice as fast — and almost nobody is talking about it.
$XRP is down about 6% in the last 24 hours to $1.09, making it the weakest major coin today. It is now down roughly 12.6% on the week. Meanwhile $BTC is holding near $74,260, down just over 2%, and Ether has slid to around $2,130, down more than 4% — but XRP is falling harder than all of them.
Here is what it means: this is no longer just a Bitcoin story. When the biggest altcoins start falling faster than Bitcoin, it tells you risk appetite is draining out of the whole market. Traders cut the riskiest positions first, and XRP — one of the most widely held altcoins — is where that shows up first.
Levels to watch: $1.00 is the big psychological line for XRP. Losing it puts the August lows back in play. On the upside, reclaiming $1.20 would be the first sign sellers are losing control. For Bitcoin, $73,500 is the line that has to hold — it was Sunday's low.
Is XRP's drop a buying opportunity, or a warning that altcoins have further to fall?
Source: CoinGecko, 9 Nov 2026
Follow for daily crypto updates.
#XRP #Crypto #BTC
Not financial advice.
$XRP is down about 6% in the last 24 hours to $1.09, making it the weakest major coin today. It is now down roughly 12.6% on the week. Meanwhile $BTC is holding near $74,260, down just over 2%, and Ether has slid to around $2,130, down more than 4% — but XRP is falling harder than all of them.
Here is what it means: this is no longer just a Bitcoin story. When the biggest altcoins start falling faster than Bitcoin, it tells you risk appetite is draining out of the whole market. Traders cut the riskiest positions first, and XRP — one of the most widely held altcoins — is where that shows up first.
Levels to watch: $1.00 is the big psychological line for XRP. Losing it puts the August lows back in play. On the upside, reclaiming $1.20 would be the first sign sellers are losing control. For Bitcoin, $73,500 is the line that has to hold — it was Sunday's low.
Is XRP's drop a buying opportunity, or a warning that altcoins have further to fall?
Source: CoinGecko, 9 Nov 2026
Follow for daily crypto updates.
#XRP #Crypto #BTC
Not financial advice.
131
🚨 BREAKING: CRYPTO CRASHES TO 2-MONTH LOWS AFTER US MIDTERMS
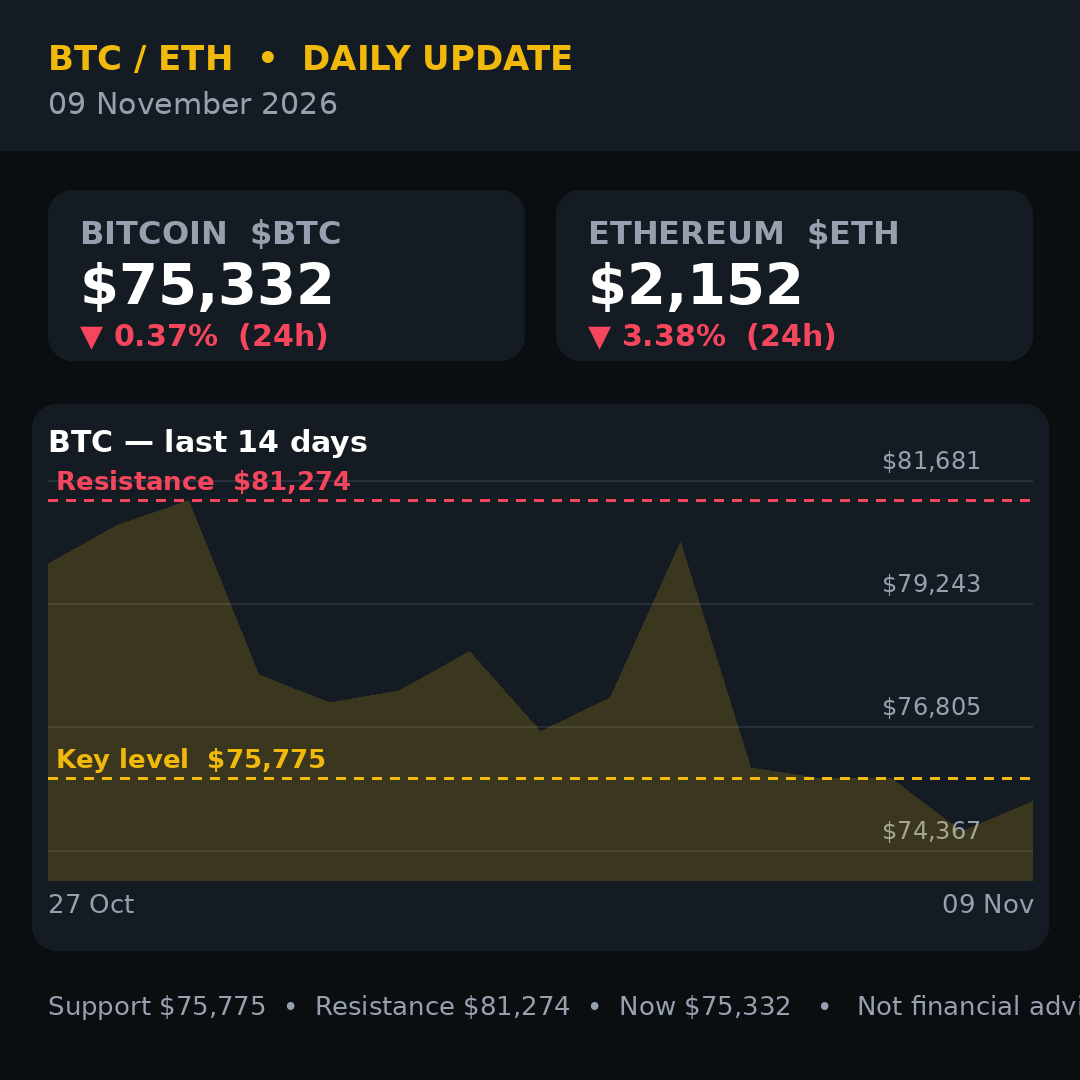
$BTC just flashed down to $73,510 — its lowest since August — and $ETH fell 5% to $2,223 in late Sunday trade. Over $855 million in positions were liquidated in 24 hours, and 90% of them were longs.
What happened? Democrats swept the US Congress in last week's midterms, and traders are now pricing in tougher crypto regulation. The fear is simple: a tougher SEC, tighter rules on prediction markets, and a colder climate for an industry that spent two years lobbying for friendlier treatment.
The timing could not be worse. Spot $BTC ETFs have now seen $411.9 million in net outflows over two days, and the market is still digesting last week's $6 billion Binance heist headlines. Sentiment is pinned in extreme fear — yet $BTC has clawed back above $75,000 this morning, trading near $75,100.
My take: this looks like a politics-driven flush, not a structural break. The $75,000 line has now held for a third session, and the bounce off $73,510 shows buyers are still stepping in below. But until tomorrow's US October CPI print (due Tuesday, 8:30am ET) passes, every rally risks being sold into.
Levels to watch: support $74,740, then $73,510 — lose that and $70,000 comes into play fast. Resistance $75,590, then $76,000.
Are you buying this dip or waiting for CPI?
Source: Reuters, 9 November 2026
Follow for daily crypto updates.
#Bitcoin #Crypto #BTC
Not financial advice.
🚨 BREAKING: CRYPTO CRASHES TO 2-MONTH LOWS AFTER US MIDTERMS
$BTC just flashed down to $73,510 — its lowest since August — and $ETH fell 5% to $2,223 in late Sunday trade. Over $855 million in positions were liquidated in 24 hours, and 90% of them were longs.
What happened? Democrats swept the US Congress in last week's midterms, and traders are now pricing in tougher crypto regulation. The fear is simple: a tougher SEC, tighter rules on prediction markets, and a colder climate for an industry that spent two years lobbying for friendlier treatment.
The timing could not be worse. Spot $BTC ETFs have now seen $411.9 million in net outflows over two days, and the market is still digesting last week's $6 billion Binance heist headlines. Sentiment is pinned in extreme fear — yet $BTC has clawed back above $75,000 this morning, trading near $75,100.
My take: this looks like a politics-driven flush, not a structural break. The $75,000 line has now held for a third session, and the bounce off $73,510 shows buyers are still stepping in below. But until tomorrow's US October CPI print (due Tuesday, 8:30am ET) passes, every rally risks being sold into.
Levels to watch: support $74,740, then $73,510 — lose that and $70,000 comes into play fast. Resistance $75,590, then $76,000.
Are you buying this dip or waiting for CPI?
Source: Reuters, 9 November 2026
Follow for daily crypto updates.
#Bitcoin #Crypto #BTC
Not financial advice.
$BTC just flashed down to $73,510 — its lowest since August — and $ETH fell 5% to $2,223 in late Sunday trade. Over $855 million in positions were liquidated in 24 hours, and 90% of them were longs.
What happened? Democrats swept the US Congress in last week's midterms, and traders are now pricing in tougher crypto regulation. The fear is simple: a tougher SEC, tighter rules on prediction markets, and a colder climate for an industry that spent two years lobbying for friendlier treatment.
The timing could not be worse. Spot $BTC ETFs have now seen $411.9 million in net outflows over two days, and the market is still digesting last week's $6 billion Binance heist headlines. Sentiment is pinned in extreme fear — yet $BTC has clawed back above $75,000 this morning, trading near $75,100.
My take: this looks like a politics-driven flush, not a structural break. The $75,000 line has now held for a third session, and the bounce off $73,510 shows buyers are still stepping in below. But until tomorrow's US October CPI print (due Tuesday, 8:30am ET) passes, every rally risks being sold into.
Levels to watch: support $74,740, then $73,510 — lose that and $70,000 comes into play fast. Resistance $75,590, then $76,000.
Are you buying this dip or waiting for CPI?
Source: Reuters, 9 November 2026
Follow for daily crypto updates.
#Bitcoin #Crypto #BTC
Not financial advice.
110
🚨 BREAKING: US TREASURY CUTS MEXC OFF FROM US BANKS
Washington just dropped one of the biggest enforcement bombs of the year on crypto — and $BTC barely blinked.
The US Treasury's FinCEN named exchange MEXC Global a 'primary money laundering concern' and ordered US banks to stop all transfers to and from it. The allegation: at least $16 billion in illicit transactions since 2021, tied to sanctioned groups in Iran, Russia and North Korea. The order takes effect 30 days after it hits the Federal Register.
MEXC says it already bars US users and that funds are safe. But OKX's CEO is already warning users not to send funds directly from MEXC to OKX — they may be frozen.
Yet the market's reaction tells the real story. $BTC trades near $75,900, flat on the day, holding above $75,000 for a fourth straight day. $ETH sits near $2,238, also flat. Just $50 million was liquidated in 24 hours — down 70% from a day earlier. Fear & Greed is at 28 (Fear), up from 25.
My take: this is a stress test, and so far the market is passing it. A $16B action against a major exchange would have caused a panic sell-off in past cycles. Instead buyers keep defending $75,000, and Arkham spotted one entity buying about $228 million of $BTC. The weak hands already left during the week's $1.28 billion of ETF outflows — the worst week since June.
Levels to watch: support $75,000 and the 50-week average near $75,560. Resistance is $76,000 first — the trigger for renewed momentum — then $80,000. The 50-day average sits at $81,765, so a real recovery still has work to do.
Source: Cointelegraph / US Treasury (FinCEN)
Is the market finally learning to shrug off bad news — or is this the calm before a Monday move? What happens first: $80,000 or $70,000?
Follow for daily crypto updates.
#BitcoinRebounds$75KAsChipsLead #BTC #Crypto
Not financial advice.
🚨 BREAKING: US TREASURY CUTS MEXC OFF FROM US BANKS
Washington just dropped one of the biggest enforcement bombs of the year on crypto — and $BTC barely blinked.
The US Treasury's FinCEN named exchange MEXC Global a 'primary money laundering concern' and ordered US banks to stop all transfers to and from it. The allegation: at least $16 billion in illicit transactions since 2021, tied to sanctioned groups in Iran, Russia and North Korea. The order takes effect 30 days after it hits the Federal Register.
MEXC says it already bars US users and that funds are safe. But OKX's CEO is already warning users not to send funds directly from MEXC to OKX — they may be frozen.
Yet the market's reaction tells the real story. $BTC trades near $75,900, flat on the day, holding above $75,000 for a fourth straight day. $ETH sits near $2,238, also flat. Just $50 million was liquidated in 24 hours — down 70% from a day earlier. Fear & Greed is at 28 (Fear), up from 25.
My take: this is a stress test, and so far the market is passing it. A $16B action against a major exchange would have caused a panic sell-off in past cycles. Instead buyers keep defending $75,000, and Arkham spotted one entity buying about $228 million of $BTC . The weak hands already left during the week's $1.28 billion of ETF outflows — the worst week since June.
Levels to watch: support $75,000 and the 50-week average near $75,560. Resistance is $76,000 first — the trigger for renewed momentum — then $80,000. The 50-day average sits at $81,765, so a real recovery still has work to do.
Source: Cointelegraph / US Treasury (FinCEN)
Is the market finally learning to shrug off bad news — or is this the calm before a Monday move? What happens first: $80,000 or $70,000?
Follow for daily crypto updates.
#BitcoinRebounds$75KAsChipsLead #BTC #Crypto
Not financial advice.
Washington just dropped one of the biggest enforcement bombs of the year on crypto — and $BTC barely blinked.
The US Treasury's FinCEN named exchange MEXC Global a 'primary money laundering concern' and ordered US banks to stop all transfers to and from it. The allegation: at least $16 billion in illicit transactions since 2021, tied to sanctioned groups in Iran, Russia and North Korea. The order takes effect 30 days after it hits the Federal Register.
MEXC says it already bars US users and that funds are safe. But OKX's CEO is already warning users not to send funds directly from MEXC to OKX — they may be frozen.
Yet the market's reaction tells the real story. $BTC trades near $75,900, flat on the day, holding above $75,000 for a fourth straight day. $ETH sits near $2,238, also flat. Just $50 million was liquidated in 24 hours — down 70% from a day earlier. Fear & Greed is at 28 (Fear), up from 25.
My take: this is a stress test, and so far the market is passing it. A $16B action against a major exchange would have caused a panic sell-off in past cycles. Instead buyers keep defending $75,000, and Arkham spotted one entity buying about $228 million of $BTC . The weak hands already left during the week's $1.28 billion of ETF outflows — the worst week since June.
Levels to watch: support $75,000 and the 50-week average near $75,560. Resistance is $76,000 first — the trigger for renewed momentum — then $80,000. The 50-day average sits at $81,765, so a real recovery still has work to do.
Source: Cointelegraph / US Treasury (FinCEN)
Is the market finally learning to shrug off bad news — or is this the calm before a Monday move? What happens first: $80,000 or $70,000?
Follow for daily crypto updates.
#BitcoinRebounds$75KAsChipsLead #BTC #Crypto
Not financial advice.
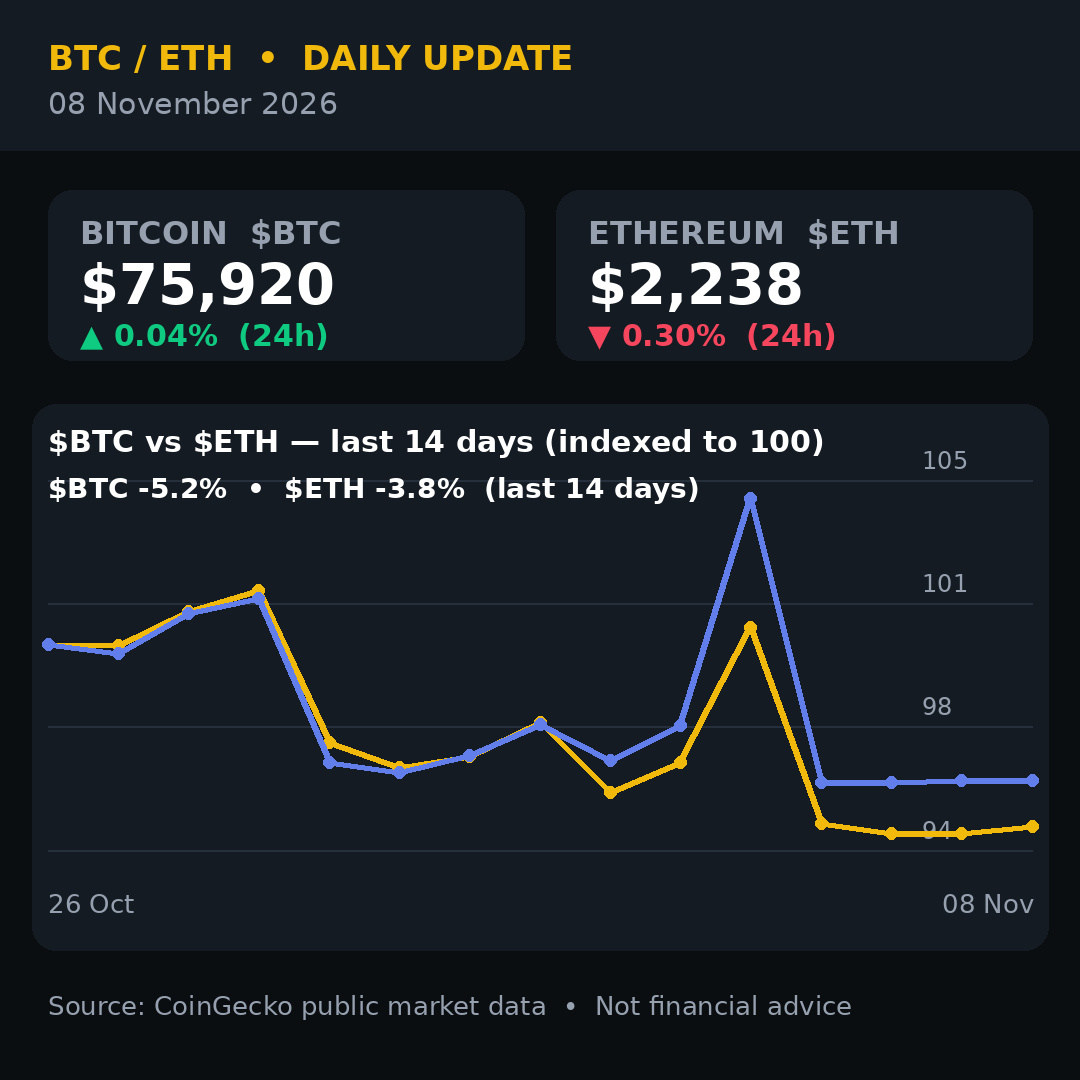
135
While $BTC sleeps, AI coins are printing — and one of them is up 68% in a week.
$FET is the loudest coin in crypto right now. It is up 68% on the week and sits at AltRank #2 across the whole market, according to LunarCrush data published today. Social engagements hit 1.87 million today — 283% above its daily average — trading volume is running 154% above normal, and its social dominance is up 439% week over week.
It is not alone. The whole AI sector is moving: Nosana is up 55% on the week and 25% in the last 24 hours, Qubic is up 53% on the week, Oraichain jumped 30% in a day, and DeepBrain Chain is up 19% in 24 hours. Even Chainlink, the oracle backbone every serious AI stack needs, is riding the same wave.
Here is my take: this is not a random pump. After a week where $BTC bled and spot $BTC ETFs lost $411.9 million in a single Friday session, traders are rotating toward a story with real momentum. AI is the one narrative in crypto that also exists outside crypto — every AI headline gives these tokens a reason to move. But note the warning sign too: $FET is actually down about 2% today even while the weekly chart screams green. That is how fast this sector cools off when buyers pause.
Meanwhile $BTC is holding near $75,863, flat on the day, sitting right on its 50-week moving average near $75,556. The base case for the next 24 hours is sideways between $74,800 and $77,200. $ETH is near $2,238.
Levels to watch: for $BTC, $75,556 is the line that must hold, with $76,000 above as the first wall to break and $80,000 as the recovery marker. For $FET, watch whether today's dip finds buyers or turns into a deeper weekly-gain giveback.
Are AI coins the next big rotation, or is this just a weekend surge that fades by Monday? Tell me what you are watching.
Follow for daily crypto updates.
#FET #BTC #Crypto
Not financial advice.
While $BTC sleeps, AI coins are printing — and one of them is up 68% in a week.
$FET is the loudest coin in crypto right now. It is up 68% on the week and sits at AltRank #2 across the whole market, according to LunarCrush data published today. Social engagements hit 1.87 million today — 283% above its daily average — trading volume is running 154% above normal, and its social dominance is up 439% week over week.
It is not alone. The whole AI sector is moving: Nosana is up 55% on the week and 25% in the last 24 hours, Qubic is up 53% on the week, Oraichain jumped 30% in a day, and DeepBrain Chain is up 19% in 24 hours. Even Chainlink, the oracle backbone every serious AI stack needs, is riding the same wave.
Here is my take: this is not a random pump. After a week where $BTC bled and spot $BTC ETFs lost $411.9 million in a single Friday session, traders are rotating toward a story with real momentum. AI is the one narrative in crypto that also exists outside crypto — every AI headline gives these tokens a reason to move. But note the warning sign too: $FET is actually down about 2% today even while the weekly chart screams green. That is how fast this sector cools off when buyers pause.
Meanwhile $BTC is holding near $75,863, flat on the day, sitting right on its 50-week moving average near $75,556. The base case for the next 24 hours is sideways between $74,800 and $77,200. $ETH is near $2,238.
Levels to watch: for $BTC , $75,556 is the line that must hold, with $76,000 above as the first wall to break and $80,000 as the recovery marker. For $FET , watch whether today's dip finds buyers or turns into a deeper weekly-gain giveback.
Are AI coins the next big rotation, or is this just a weekend surge that fades by Monday? Tell me what you are watching.
Follow for daily crypto updates.
#FET #BTC #Crypto
Not financial advice.
$FET is the loudest coin in crypto right now. It is up 68% on the week and sits at AltRank #2 across the whole market, according to LunarCrush data published today. Social engagements hit 1.87 million today — 283% above its daily average — trading volume is running 154% above normal, and its social dominance is up 439% week over week.
It is not alone. The whole AI sector is moving: Nosana is up 55% on the week and 25% in the last 24 hours, Qubic is up 53% on the week, Oraichain jumped 30% in a day, and DeepBrain Chain is up 19% in 24 hours. Even Chainlink, the oracle backbone every serious AI stack needs, is riding the same wave.
Here is my take: this is not a random pump. After a week where $BTC bled and spot $BTC ETFs lost $411.9 million in a single Friday session, traders are rotating toward a story with real momentum. AI is the one narrative in crypto that also exists outside crypto — every AI headline gives these tokens a reason to move. But note the warning sign too: $FET is actually down about 2% today even while the weekly chart screams green. That is how fast this sector cools off when buyers pause.
Meanwhile $BTC is holding near $75,863, flat on the day, sitting right on its 50-week moving average near $75,556. The base case for the next 24 hours is sideways between $74,800 and $77,200. $ETH is near $2,238.
Levels to watch: for $BTC , $75,556 is the line that must hold, with $76,000 above as the first wall to break and $80,000 as the recovery marker. For $FET , watch whether today's dip finds buyers or turns into a deeper weekly-gain giveback.
Are AI coins the next big rotation, or is this just a weekend surge that fades by Monday? Tell me what you are watching.
Follow for daily crypto updates.
#FET #BTC #Crypto
Not financial advice.
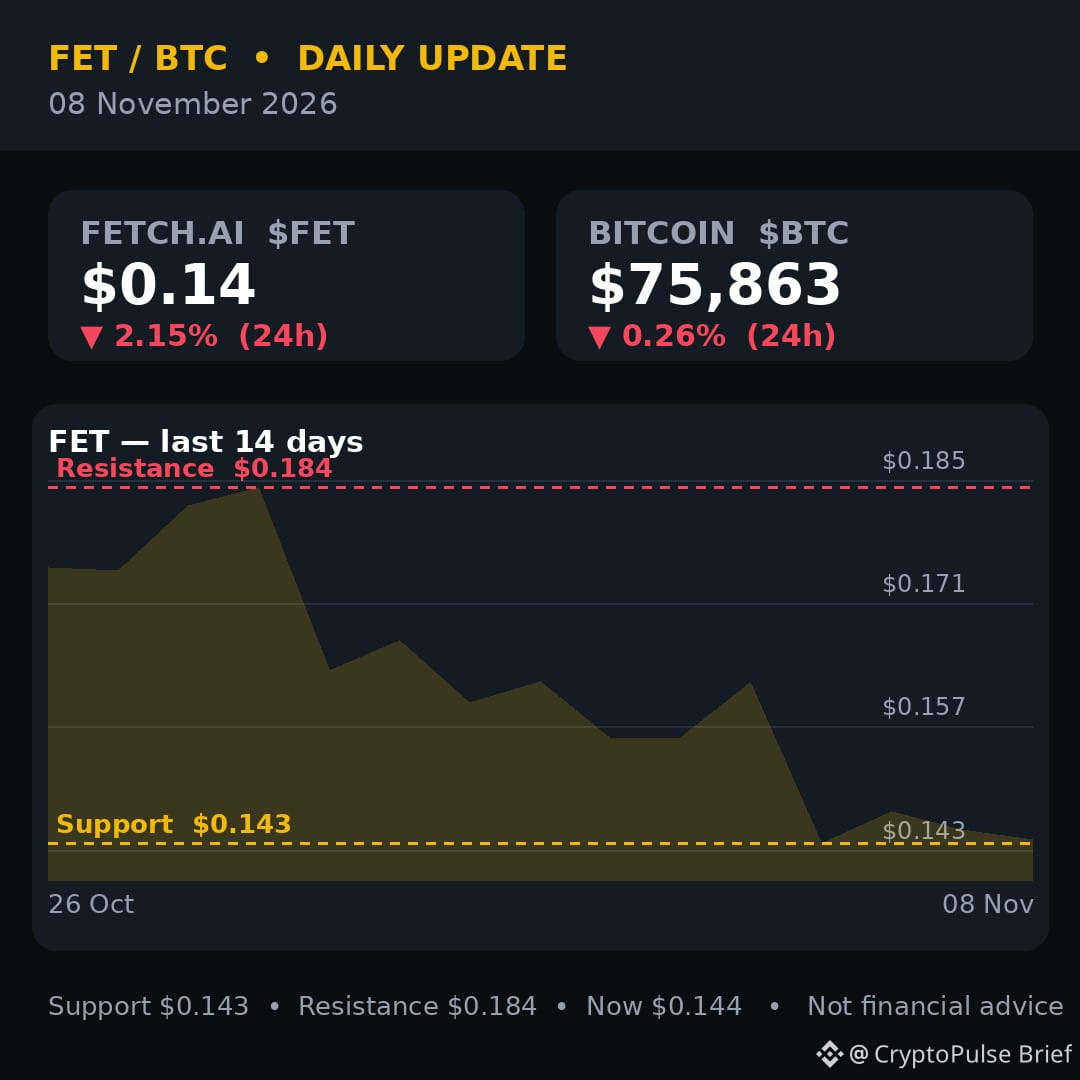
386
Asia tested Bitcoin's nerve overnight — and it held. 🌏
$BTC dipped toward $75,200 in the Asian session, then bounced back toward $76,000. Right now: BTC ~$75,741, ETH ~$2,231.
The panic is cooling: only ~$97M in liquidations in the last 24 hours, after $1B+ earlier this week. But trend models still flag BTC and $ETH as bearish — the bounce is real, the trend is not confirmed yet.
Fear & Greed sits at 28 (Fear). Steady hands are being tested, not rewarded yet.
Do you think $75K holds, or is another leg down coming? 👇
#BTC #ETH #Crypto #Bitcoin #Ethereum
Not financial advice.
Asia tested Bitcoin's nerve overnight — and it held. 🌏
$BTC dipped toward $75,200 in the Asian session, then bounced back toward $76,000. Right now: BTC ~$75,741, ETH ~$2,231.
The panic is cooling: only ~$97M in liquidations in the last 24 hours, after $1B+ earlier this week. But trend models still flag BTC and $ETH as bearish — the bounce is real, the trend is not confirmed yet.
Fear & Greed sits at 28 (Fear). Steady hands are being tested, not rewarded yet.
Do you think $75K holds, or is another leg down coming? 👇
#BTC #ETH #Crypto #Bitcoin #Ethereum
Not financial advice.
$BTC dipped toward $75,200 in the Asian session, then bounced back toward $76,000. Right now: BTC ~$75,741, ETH ~$2,231.
The panic is cooling: only ~$97M in liquidations in the last 24 hours, after $1B+ earlier this week. But trend models still flag BTC and $ETH as bearish — the bounce is real, the trend is not confirmed yet.
Fear & Greed sits at 28 (Fear). Steady hands are being tested, not rewarded yet.
Do you think $75K holds, or is another leg down coming? 👇
#BTC #ETH #Crypto #Bitcoin #Ethereum
Not financial advice.
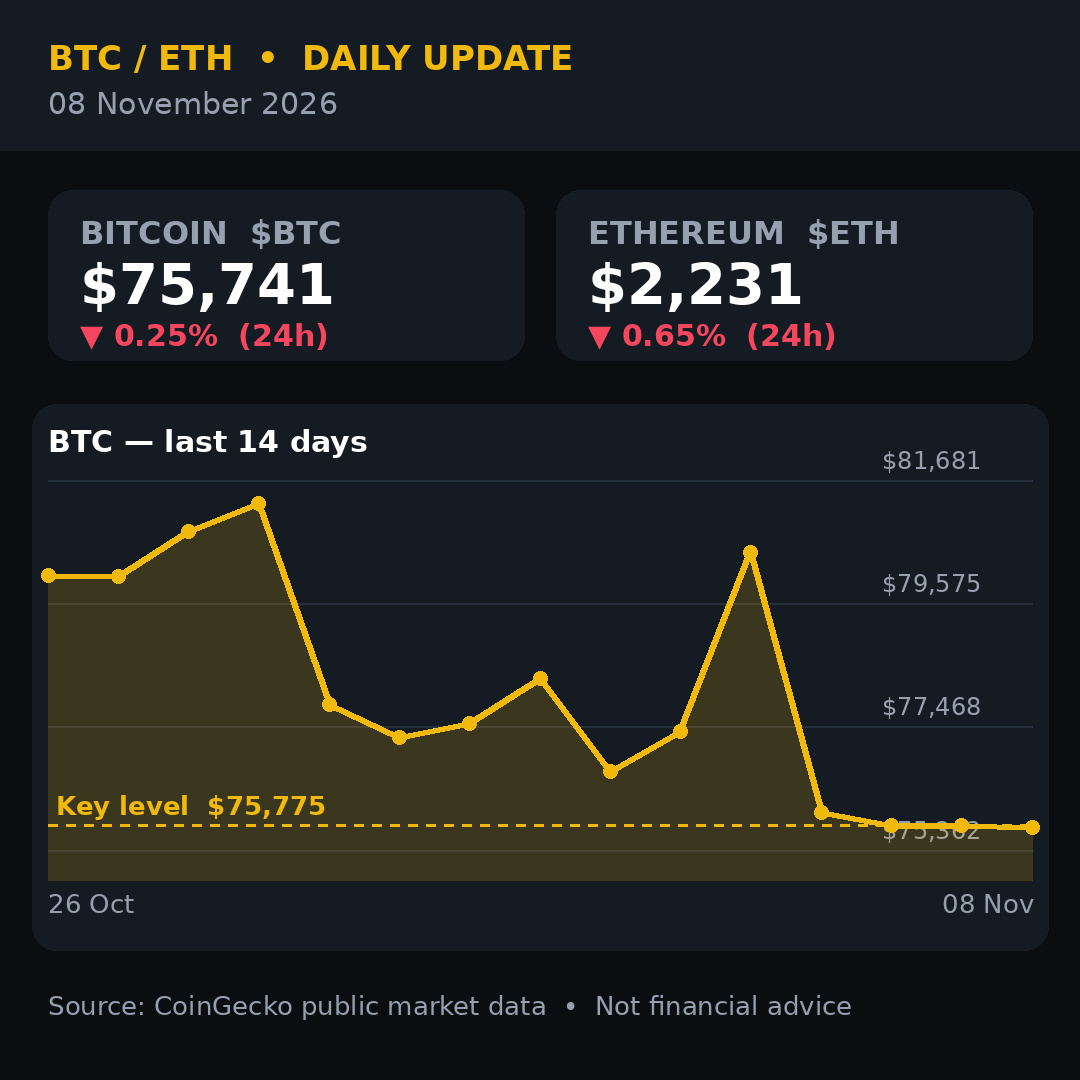
127
😱 Extreme Fear is back — but Bitcoin isn't panicking.
The Crypto Fear & Greed Index just fell to 25, 'Extreme Fear', for the first time since early August. Two days ago it was 50 (Neutral).
Yet BTC holds near $75,900 — above its $75,775 30-day low and the 50-week average. ETH sits near $2,244.
This week brought $1B+ in liquidations, mostly longs, and a hot US jobs report (165K jobs vs ~65K expected) revived talk of a December rate hike.
Fear is loud. The chart is quiet. Which do you trust more? 👇
#BTC #ETH #Crypto #Bitcoin #Ethereum
Not financial advice.
😱 Extreme Fear is back — but Bitcoin isn't panicking.
The Crypto Fear & Greed Index just fell to 25, 'Extreme Fear', for the first time since early August. Two days ago it was 50 (Neutral).
Yet BTC holds near $75,900 — above its $75,775 30-day low and the 50-week average. ETH sits near $2,244.
This week brought $1B+ in liquidations, mostly longs, and a hot US jobs report (165K jobs vs ~65K expected) revived talk of a December rate hike.
Fear is loud. The chart is quiet. Which do you trust more? 👇
#BTC #ETH #Crypto #Bitcoin #Ethereum
Not financial advice.
The Crypto Fear & Greed Index just fell to 25, 'Extreme Fear', for the first time since early August. Two days ago it was 50 (Neutral).
Yet BTC holds near $75,900 — above its $75,775 30-day low and the 50-week average. ETH sits near $2,244.
This week brought $1B+ in liquidations, mostly longs, and a hot US jobs report (165K jobs vs ~65K expected) revived talk of a December rate hike.
Fear is loud. The chart is quiet. Which do you trust more? 👇
#BTC #ETH #Crypto #Bitcoin #Ethereum
Not financial advice.
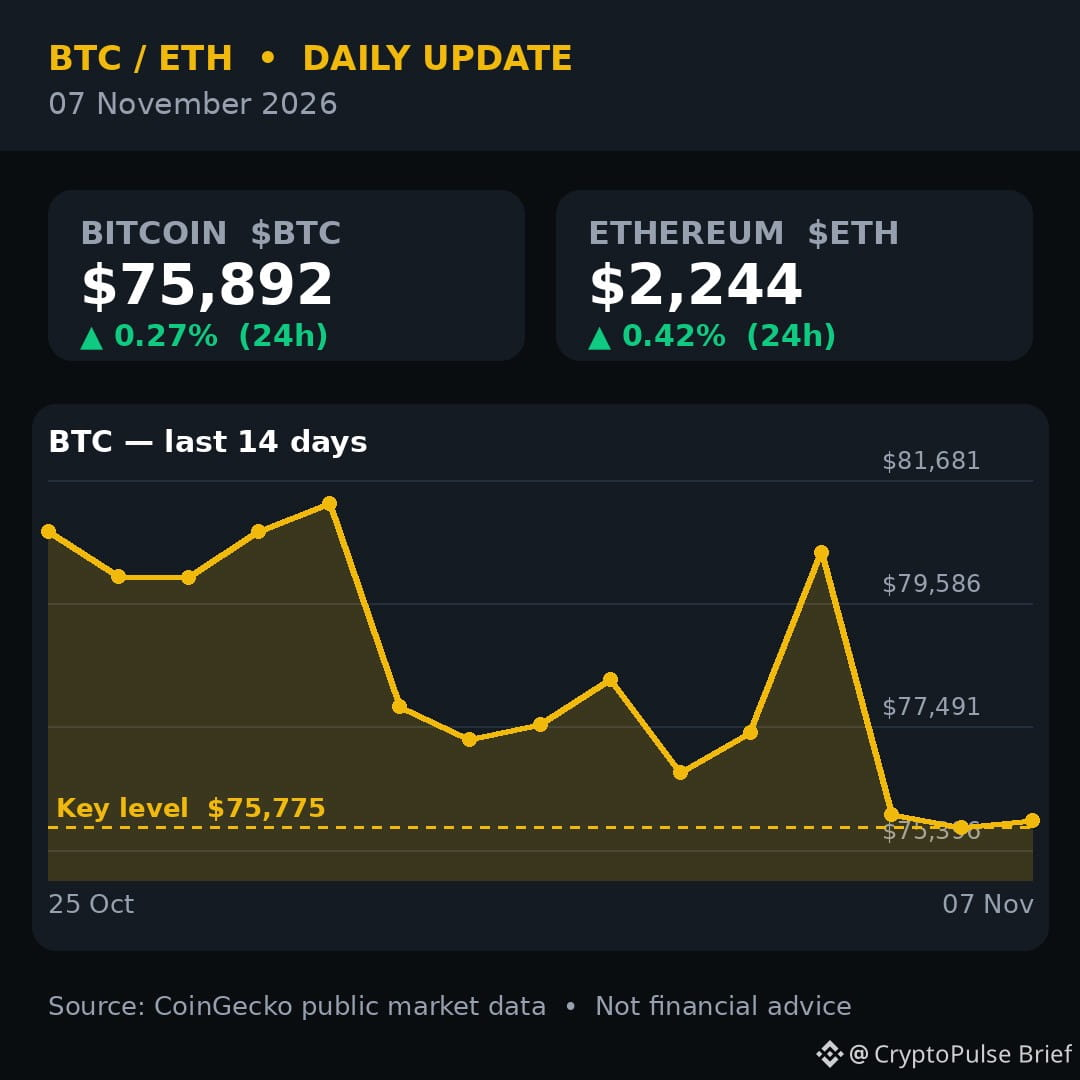
95
📉 $BTC holds $76K while ETFs bleed $1.65B in a week
Bitcoin is trading near $76,000, up ~0.5% in 24h, but US spot BTC + ETH ETFs lost $1.65B in Nov 2-6. BlackRock's IBIT alone lost $1.21B.
$ETH is at ~$2,248, up ~1% in 24h, holding above $2,200 support.
Traders are now watching $75,775 as the key level — and some are pricing a November low near $70K.
Is this a dip to buy, or the start of a deeper fall? 👇
#BTC #ETH #Crypto #Bitcoin #Ethereum
Not financial advice.
📉 $BTC holds $76K while ETFs bleed $1.65B in a week
Bitcoin is trading near $76,000, up ~0.5% in 24h, but US spot BTC + ETH ETFs lost $1.65B in Nov 2-6. BlackRock's IBIT alone lost $1.21B.
$ETH is at ~$2,248, up ~1% in 24h, holding above $2,200 support.
Traders are now watching $75,775 as the key level — and some are pricing a November low near $70K.
Is this a dip to buy, or the start of a deeper fall? 👇
#BTC #ETH #Crypto #Bitcoin #Ethereum
Not financial advice.
Bitcoin is trading near $76,000, up ~0.5% in 24h, but US spot BTC + ETH ETFs lost $1.65B in Nov 2-6. BlackRock's IBIT alone lost $1.21B.
$ETH is at ~$2,248, up ~1% in 24h, holding above $2,200 support.
Traders are now watching $75,775 as the key level — and some are pricing a November low near $70K.
Is this a dip to buy, or the start of a deeper fall? 👇
#BTC #ETH #Crypto #Bitcoin #Ethereum
Not financial advice.
118
BTC Just Overtook Tesla Again
market cap has climbed to around $1.63T, putting it back among the world’s top 15 assets by market value.
Is Bitcoin becoming impossible for traditional finance to ignore?
{spot}(BTCUSDT)
$BTC is back in the global asset spotlight.
#Bitcoin #BTC #CryptoNewss #CryptoMarket #blockchain
BTC Just Overtook Tesla Again
market cap has climbed to around $1.63T, putting it back among the world’s top 15 assets by market value.
Is Bitcoin becoming impossible for traditional finance to ignore?
$BTC is back in the global asset spotlight.
#Bitcoin #BTC #CryptoNewss #CryptoMarket #blockchain
market cap has climbed to around $1.63T, putting it back among the world’s top 15 assets by market value.
Is Bitcoin becoming impossible for traditional finance to ignore?
$BTC is back in the global asset spotlight.
#Bitcoin #BTC #CryptoNewss #CryptoMarket #blockchain
73
Log in to explore more content
Join global crypto users on Binance Square
⚡️ Get latest and useful information about crypto.
💬 Trusted by the world’s largest crypto exchange.
👍 Discover real insights from verified creators.
Email / Phone number
Trending Topics
WhatWillDriveCryptoandStocks’NextRebound?
48,801 views
685 Discussing
Bitcoin Slips Below $70,000 as Dollar Index Hits 19-Month High
Binance News
·16 Likes
·35.5k views
Anthropic’s6xIPODemandSignalsPotentialRecordRaise
15,919 views
334 Discussing
USCryptoETFsLose$1.48BInFiveDays
72 views
2 Discussing