
bihun_nv
104 Posts

bihun_nv
Report
Block User
Хочеш мені допомогти мій id: 527652598💵
Open Trade
Frequent Trader
4 Years
1 Following
23 Followers
66 Liked
Posts
Portfolio
All
Videos
PINNED
·
--

Article
📈 Digital assets aren’t a game of chance: how the myth of easy riches breaks those just starting out#btc #eth #solana #bnb #atom
📈 Digital assets aren’t a game of chance: how the myth of easy riches breaks those just starting out
On social media, the cryptocurrency market is often portrayed as an endless source of easy money: quick “multiples” overnight, successful trades, and a lavish lifestyle. As a result, many beginners develop the dangerous illusion that crypto is the easiest path to millions, and all you have to do is guess which way the price will move.
📈 Digital assets aren’t a game of chance: how the myth of easy riches breaks those just starting out
#btc #eth #solana #bnb #atom
📈 Digital assets aren’t a game of chance: how the myth of easy riches breaks those just starting out
On social media, the cryptocurrency market is often portrayed as an endless source of easy money: quick “multiples” overnight, successful trades, and a lavish lifestyle. As a result, many beginners develop the dangerous illusion that crypto is the easiest path to millions, and all you have to do is guess which way the price will move.
📈 Digital assets aren’t a game of chance: how the myth of easy riches breaks those just starting out
On social media, the cryptocurrency market is often portrayed as an endless source of easy money: quick “multiples” overnight, successful trades, and a lavish lifestyle. As a result, many beginners develop the dangerous illusion that crypto is the easiest path to millions, and all you have to do is guess which way the price will move.
2
27
·
--
$APT 🚀Going short on APT with 25x leverage
Entry: market
Take profit: 0.6298, 0.6214, 0.5950
Stop loss: 0.6712
Take 50% profit at the first target, 25% at the second target, and the remaining 25% at the final target. After the first target is reached, move the stop loss to breakeven.
$APT 🚀Going short on APT with 25x leverage
Entry: market
Take profit: 0.6298, 0.6214, 0.5950
Stop loss: 0.6712
Take 50% profit at the first target, 25% at the second target, and the remaining 25% at the final target. After the first target is reached, move the stop loss to breakeven.
Entry: market
Take profit: 0.6298, 0.6214, 0.5950
Stop loss: 0.6712
Take 50% profit at the first target, 25% at the second target, and the remaining 25% at the final target. After the first target is reached, move the stop loss to breakeven.
57
·
--
Bearish
$BTC Trump sells BTC
Trump Media recently transferred 4,259 BTC (worth $343.67M) to the Crypto.com cryptocurrency exchange.
After the US midterm elections, the market often declines, and sell-offs by large holders such as companies owned by Trump or Musk may be the reason.
But interestingly, the market almost always rose after all the sell-offs. Perhaps we’ll see that Santa rally in December.
{spot}(BTCUSDT)
$BTC Trump sells BTC
Trump Media recently transferred 4,259 BTC (worth $343.67M) to the Crypto.com cryptocurrency exchange.
After the US midterm elections, the market often declines, and sell-offs by large holders such as companies owned by Trump or Musk may be the reason.
But interestingly, the market almost always rose after all the sell-offs. Perhaps we’ll see that Santa rally in December.
Trump Media recently transferred 4,259 BTC (worth $343.67M) to the Crypto.com cryptocurrency exchange.
After the US midterm elections, the market often declines, and sell-offs by large holders such as companies owned by Trump or Musk may be the reason.
But interestingly, the market almost always rose after all the sell-offs. Perhaps we’ll see that Santa rally in December.
94
·
--
Bullish
Holding $BTC 68.3 USDT
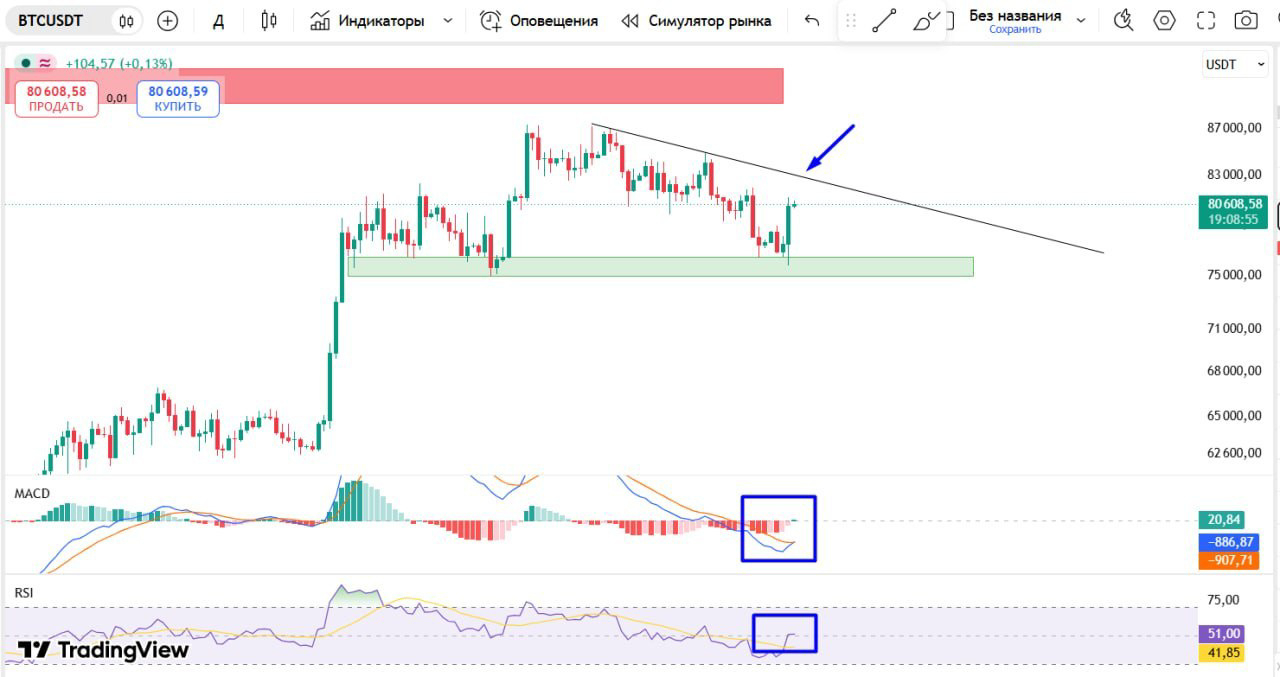
$BTC 🤓 ▪️ BTC is starting to look quite strong on the daily chart.
MACD is already showing the first signs of an upward reversal, and RSI is also gaining strength. Plus, there’s still a sizable liquidity cluster above, around $82,600.
📈 I think we could easily see another 3% rise today. The main thing is for buyers to break through the downward trendline.
Let’s see if this scenario plays out 🎹
{spot}(BTCUSDT)
$BTC 🤓 ▪️ BTC is starting to look quite strong on the daily chart.
MACD is already showing the first signs of an upward reversal, and RSI is also gaining strength. Plus, there’s still a sizable liquidity cluster above, around $82,600.
📈 I think we could easily see another 3% rise today. The main thing is for buyers to break through the downward trendline.
Let’s see if this scenario plays out 🎹
MACD is already showing the first signs of an upward reversal, and RSI is also gaining strength. Plus, there’s still a sizable liquidity cluster above, around $82,600.
📈 I think we could easily see another 3% rise today. The main thing is for buyers to break through the downward trendline.
Let’s see if this scenario plays out 🎹
141
·
--
502
·
--
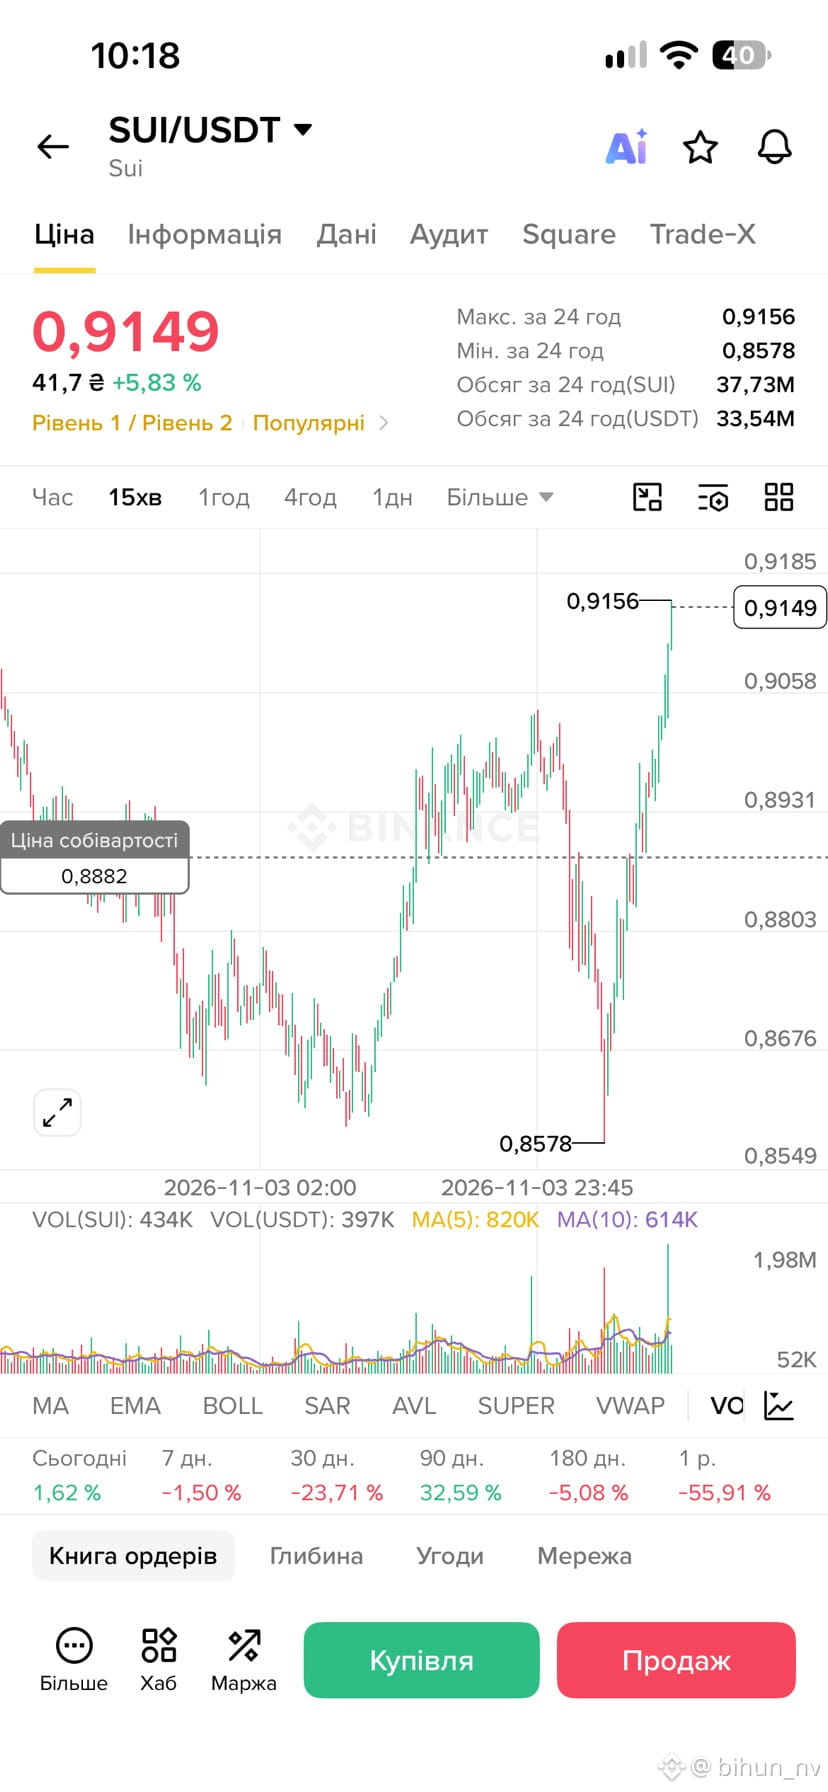
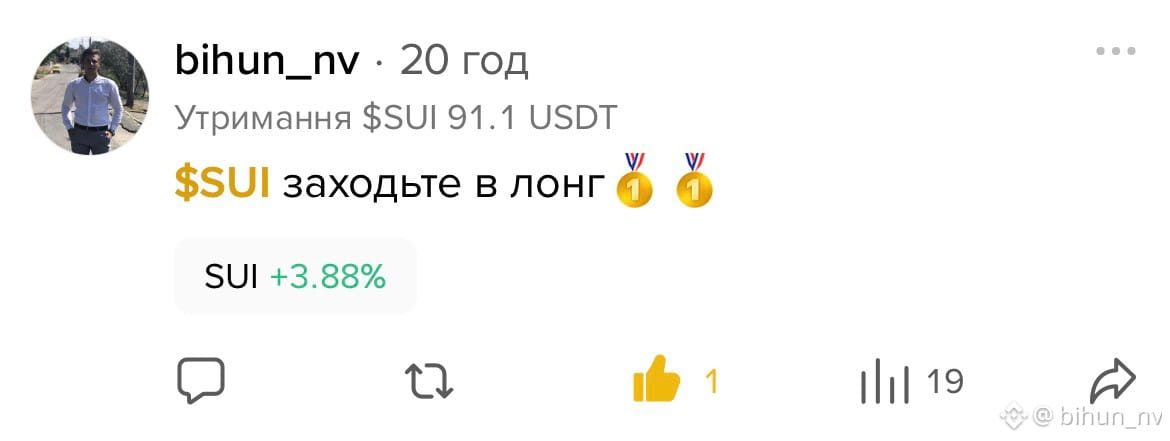
$SUI 2 posts today, how much would you have earned if you had listened to me yesterday?
$SUI 2 posts today, how much would you have earned if you had listened to me yesterday?
150
·
--
$SUI Holding the price above $0.8920 opens the way to testing resistance at $0.9100 in the coming hours.
$SUI Holding the price above $0.8920 opens the way to testing resistance at $0.9100 in the coming hours.
61
·
--
Bullish
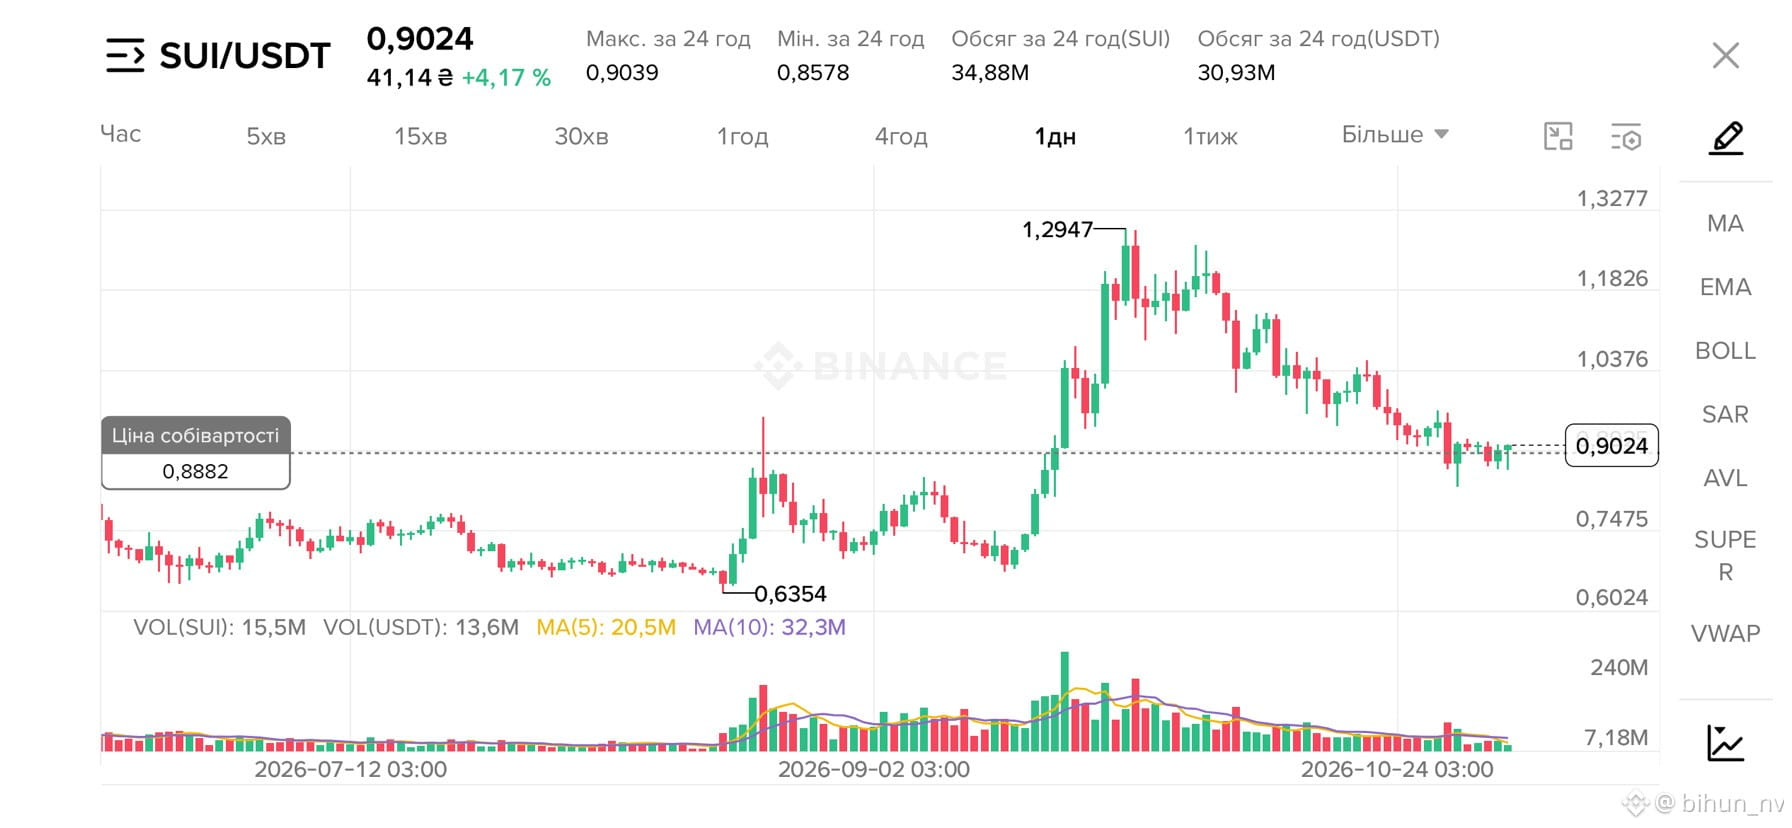
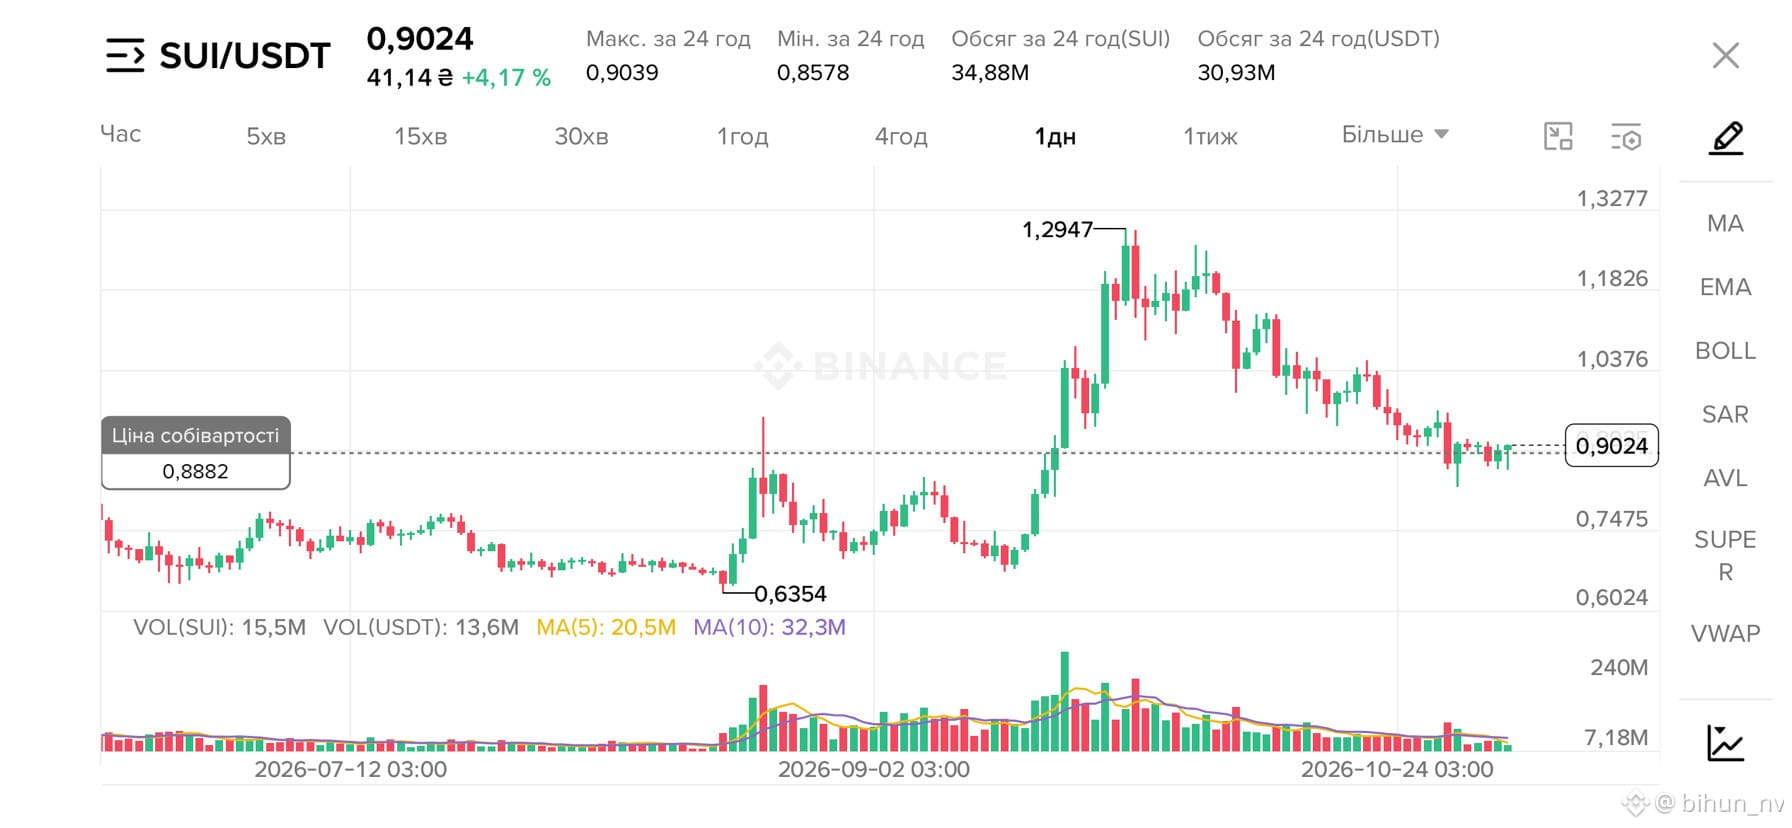
$SUI • Bullish reversal: According to the latest trading data, SUI is trading at $0,9026. The price has held above EMA(7) ($0,8918), EMA(25)
($0,8881), and EMA(99) ($0,8916), indicating a recovery in the short-term uptrend.
• Indicator confirmation: MACD has formed a bullish crossover with a positive histogram
(0,00062), while RS (14) at 62,58 signals moderate buying momentum with no signs of critical overbought conditions.
Support and resistance levels
• Resistance zones: The nearest resistance is formed by the upper Bollinger Band near $0,9097, followed by the
local high of $0,9130.
• Support zones: The middle Bollinger Band
($0,8922) and EMA(25) ($0,8881) form the first
line of defense. Strong support is located at the low of the latest rebound near $0,8650.
Key levels
• Entry/exit signals:
• Buy the pullback: 0.89 (EMA25 and middle Bollinger Band support).
• Breakout long: 0.91 (break above the upper Bollinger
Band).
• Take profit: 0.93 (locking in gains near key
daily resistance).
$SUI • Bullish reversal: According to the latest trading data, SUI is trading at $0,9026. The price has held above EMA(7) ($0,8918), EMA(25)
($0,8881), and EMA(99) ($0,8916), indicating a recovery in the short-term uptrend.
• Indicator confirmation: MACD has formed a bullish crossover with a positive histogram
(0,00062), while RS (14) at 62,58 signals moderate buying momentum with no signs of critical overbought conditions.
Support and resistance levels
• Resistance zones: The nearest resistance is formed by the upper Bollinger Band near $0,9097, followed by the
local high of $0,9130.
• Support zones: The middle Bollinger Band
($0,8922) and EMA(25) ($0,8881) form the first
line of defense. Strong support is located at the low of the latest rebound near $0,8650.
Key levels
• Entry/exit signals:
• Buy the pullback: 0.89 (EMA25 and middle Bollinger Band support).
• Breakout long: 0.91 (break above the upper Bollinger
Band).
• Take profit: 0.93 (locking in gains near key
daily resistance).
($0,8881), and EMA(99) ($0,8916), indicating a recovery in the short-term uptrend.
• Indicator confirmation: MACD has formed a bullish crossover with a positive histogram
(0,00062), while RS (14) at 62,58 signals moderate buying momentum with no signs of critical overbought conditions.
Support and resistance levels
• Resistance zones: The nearest resistance is formed by the upper Bollinger Band near $0,9097, followed by the
local high of $0,9130.
• Support zones: The middle Bollinger Band
($0,8922) and EMA(25) ($0,8881) form the first
line of defense. Strong support is located at the low of the latest rebound near $0,8650.
Key levels
• Entry/exit signals:
• Buy the pullback: 0.89 (EMA25 and middle Bollinger Band support).
• Breakout long: 0.91 (break above the upper Bollinger
Band).
• Take profit: 0.93 (locking in gains near key
daily resistance).
79
·
--
Holding $SUI 64.4 USDT
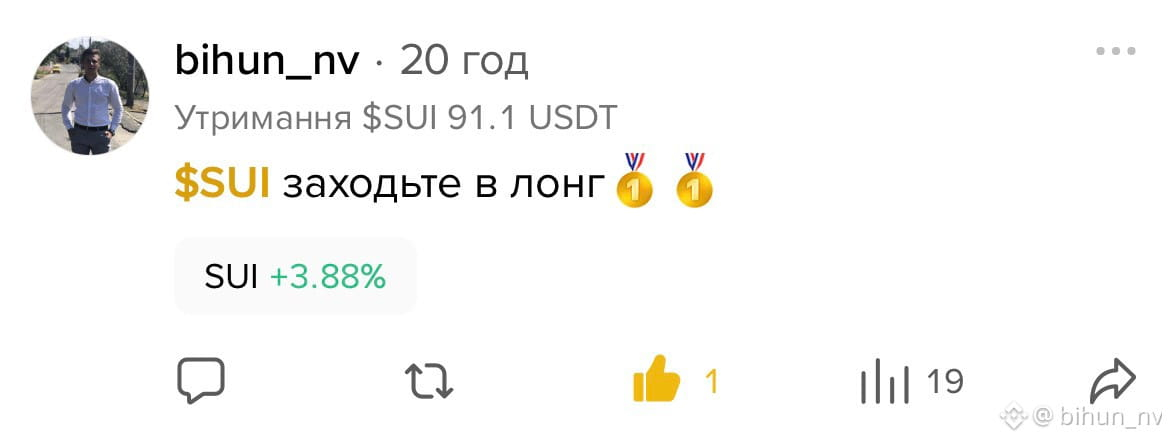
$SUI And I warned you. Subscribe so you don't miss moments like these.
{spot}(SUIUSDT)
$SUI And I warned you. Subscribe so you don't miss moments like these.
130
·
--
Bullish
$PEPE Maintaining the price above $0.00000488 preserves the bullish advantage for a retest of
$0.00000503.
{spot}(PEPEUSDT)
$PEPE Maintaining the price above $0.00000488 preserves the bullish advantage for a retest of
$0.00000503.
$0.00000503.
64
·
--
Bullish
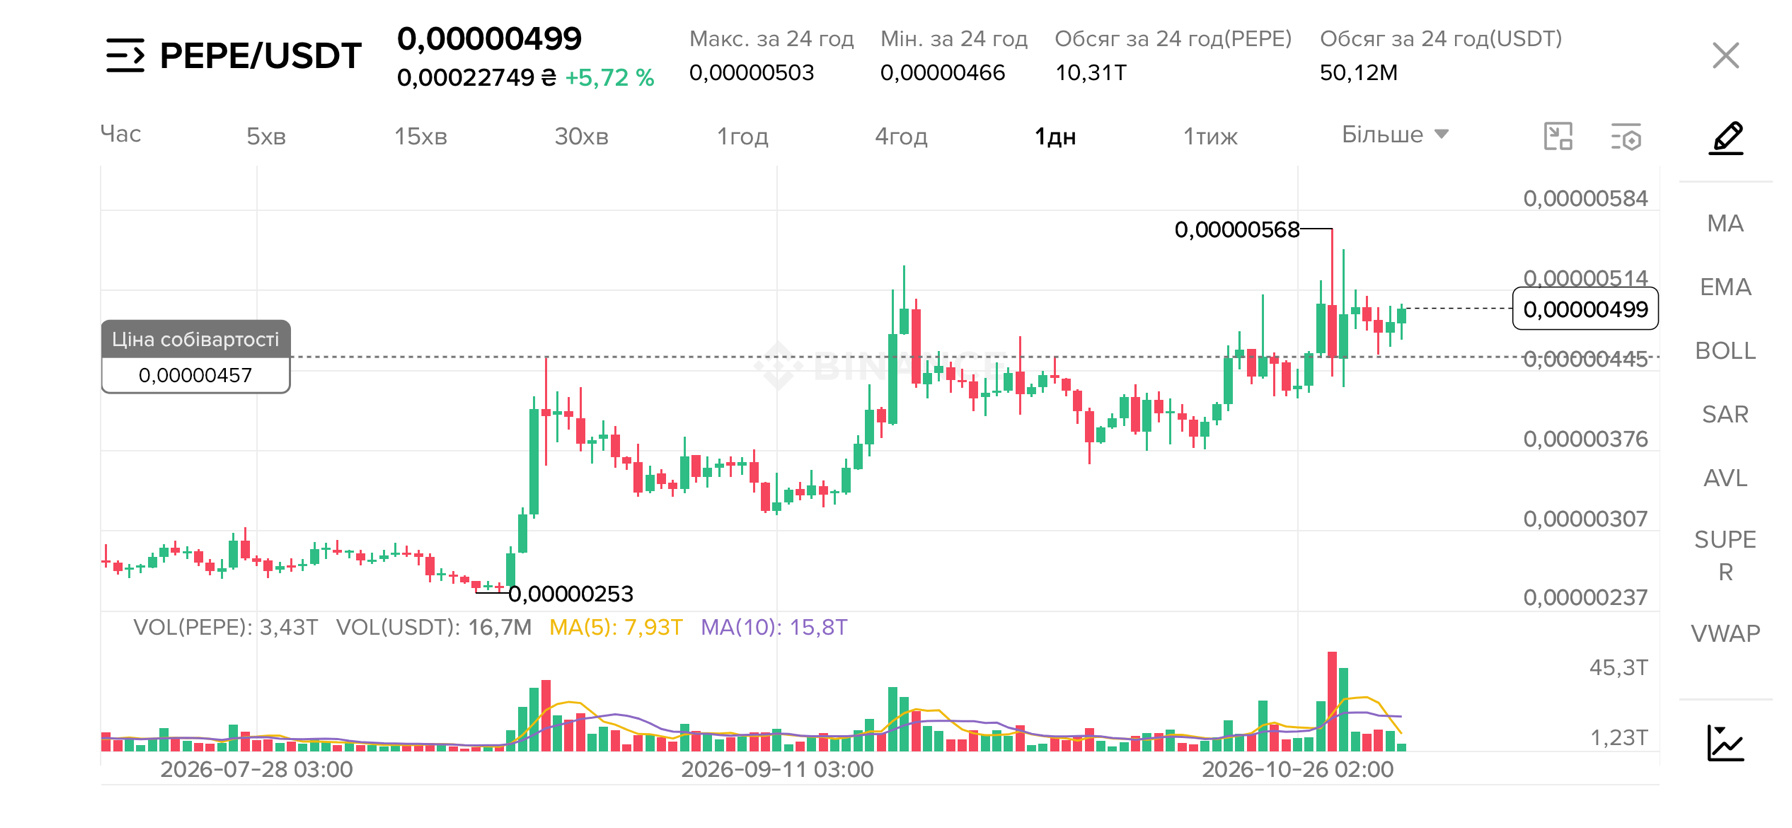
$PEPE Current trend: According to trading data, the price of PEPE has consolidated at $0.00000498, trading
above EMA-7 ($0.00000491) and EMA-25
($0.00000486). The RSI-6 indicator at 75.06 signals strong upward momentum, but is approaching the overbought zone.
• Volatility dynamics: The upper Bollinger
Bands limit has expanded to $0.00000498, which
confirms buying pressure as cumulative volume (OBV)
rises.
Support and resistance levels
• Key resistance:
• Primary resistance is located at the local high of
$0.00000503.
• The next psychological resistance is at $0.00000510 in the event of a breakout with momentum.
• Support levels:
• The nearest support is based near the Bollinger middle band and EMA-7 at $0.00000488.
• Strong secondary support is concentrated in the zone
where EMA-25 and EMA-99 intersect at $0.00000485-
$0.00000486.
Trading signals
• Long entry: Buy on a pullback to support:
0.00000486 (test of dynamic EMA-25/EMA-99
support).
• Take profit: Set take-profit near resistance:
0.00000503 (local peak and overbought RSI).
$PEPE Current trend: According to trading data, the price of PEPE has consolidated at $0.00000498, trading
above EMA-7 ($0.00000491) and EMA-25
($0.00000486). The RSI-6 indicator at 75.06 signals strong upward momentum, but is approaching the overbought zone.
• Volatility dynamics: The upper Bollinger
Bands limit has expanded to $0.00000498, which
confirms buying pressure as cumulative volume (OBV)
rises.
Support and resistance levels
• Key resistance:
• Primary resistance is located at the local high of
$0.00000503.
• The next psychological resistance is at $0.00000510 in the event of a breakout with momentum.
• Support levels:
• The nearest support is based near the Bollinger middle band and EMA-7 at $0.00000488.
• Strong secondary support is concentrated in the zone
where EMA-25 and EMA-99 intersect at $0.00000485-
$0.00000486.
Trading signals
• Long entry: Buy on a pullback to support:
0.00000486 (test of dynamic EMA-25/EMA-99
support).
• Take profit: Set take-profit near resistance:
0.00000503 (local peak and overbought RSI).
above EMA-7 ($0.00000491) and EMA-25
($0.00000486). The RSI-6 indicator at 75.06 signals strong upward momentum, but is approaching the overbought zone.
• Volatility dynamics: The upper Bollinger
Bands limit has expanded to $0.00000498, which
confirms buying pressure as cumulative volume (OBV)
rises.
Support and resistance levels
• Key resistance:
• Primary resistance is located at the local high of
$0.00000503.
• The next psychological resistance is at $0.00000510 in the event of a breakout with momentum.
• Support levels:
• The nearest support is based near the Bollinger middle band and EMA-7 at $0.00000488.
• Strong secondary support is concentrated in the zone
where EMA-25 and EMA-99 intersect at $0.00000485-
$0.00000486.
Trading signals
• Long entry: Buy on a pullback to support:
0.00000486 (test of dynamic EMA-25/EMA-99
support).
• Take profit: Set take-profit near resistance:
0.00000503 (local peak and overbought RSI).
66
·
--
Bearish
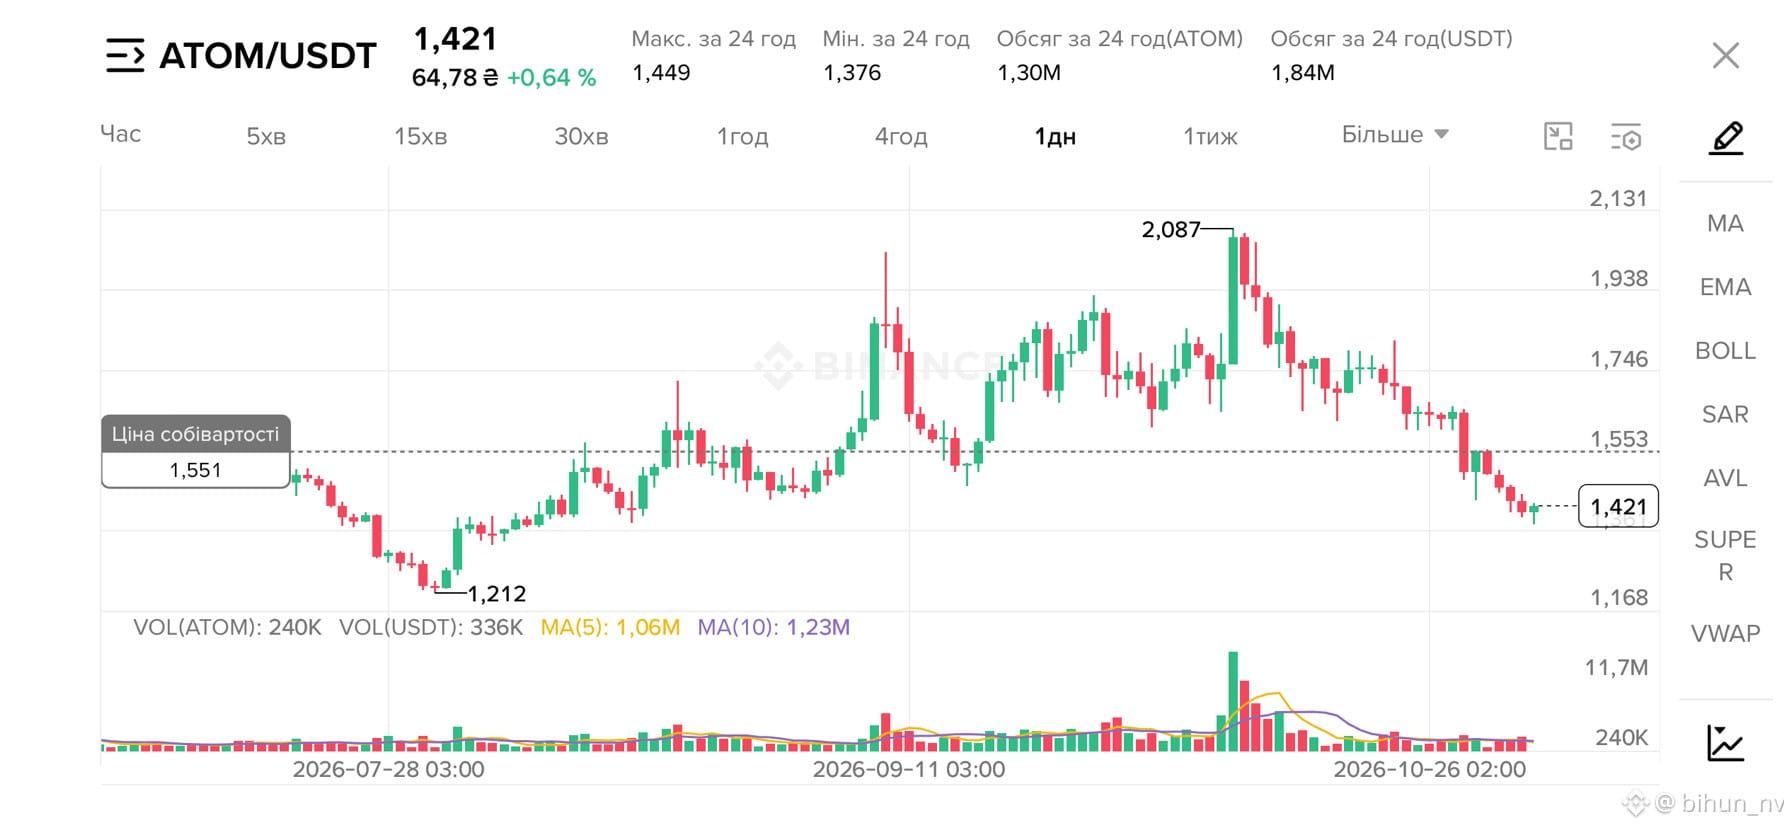
$ATOM Holding above $1,415 keeps the potential for a test of the $1,440 zone, but a break below $1,390 will restore the bears’ dominance.
$ATOM Holding above $1,415 keeps the potential for a test of the $1,440 zone, but a break below $1,390 will restore the bears’ dominance.
48
·
--
Bearish
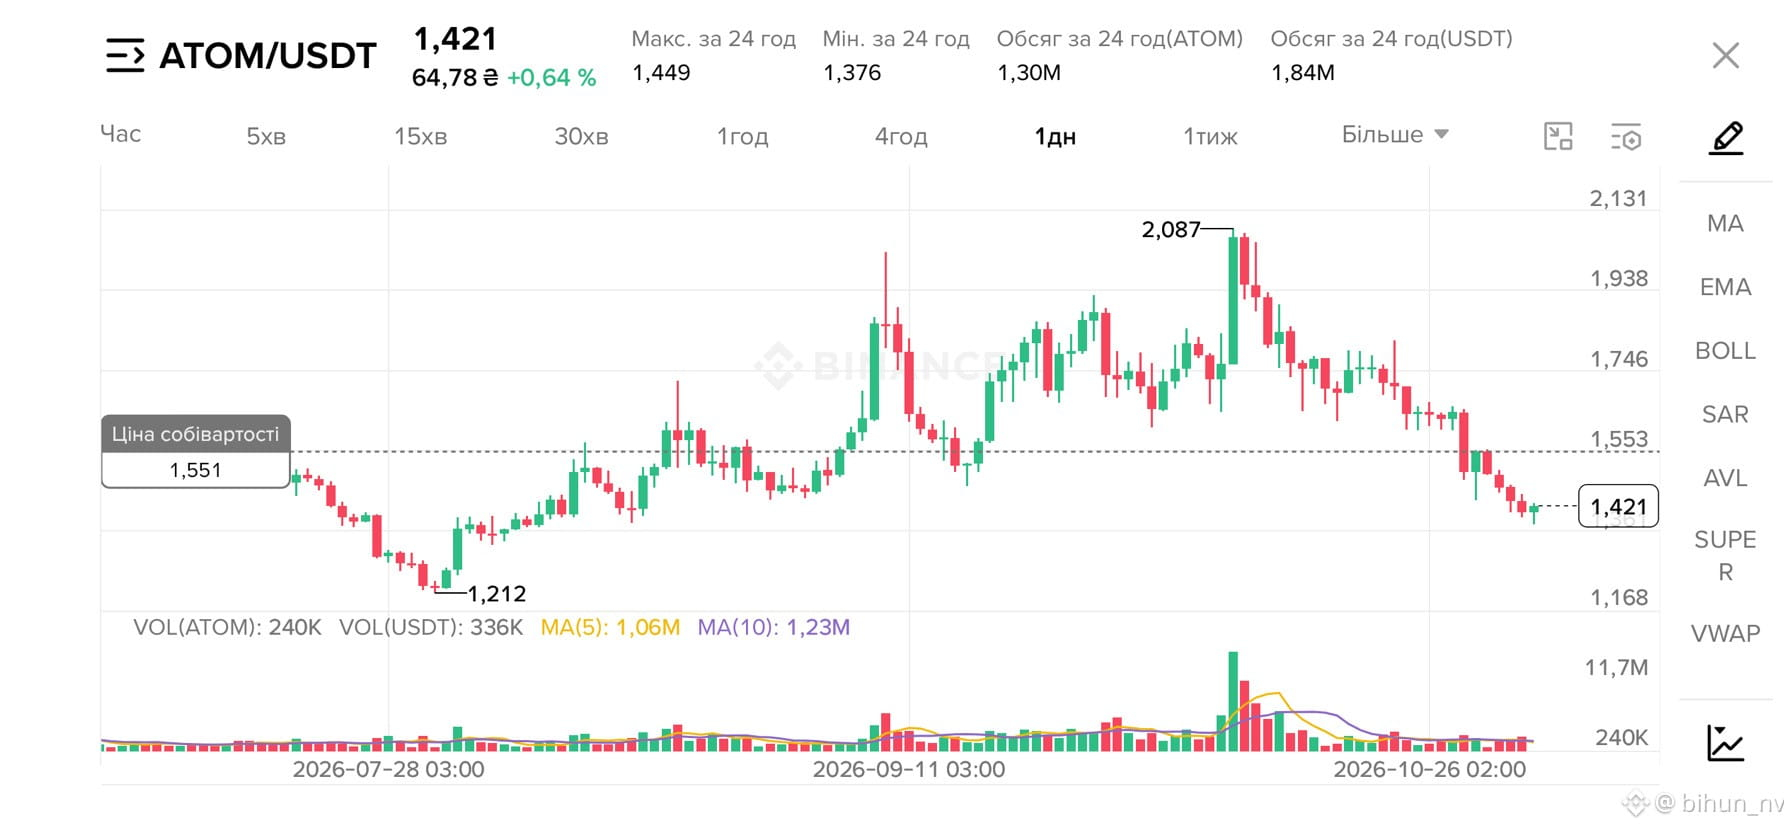
$ATOM Nearest support: The $1,415–$1,416 level serves as the primary dynamic support zone, aligning with the Bollinger Bands middle line ($1,415) and EMA-25 ($1,417).
• Critical support: The local low of $1,376 and the lower Bollinger Band at $1,390 provide protection against a deeper decline.
• Nearest resistance: The $1,431–$1,440 zone caps upward movement, with the Supertrend line ($1,431) and the upper Bollinger Band ($1,440) running through it.
• Main barrier: The long-term EMA-99 at $1,458 forms a strong downward barrier.
Key trading signals
• Buy on a pullback: Buy 1: 1.415 (support from the BOLL middle line and EMA-25 amid positive MACD).
• Take profit: Sell 1: 1.44 (resistance at the upper Bollinger Band and overbought conditions according to Stoch RSI).
$ATOM Nearest support: The $1,415–$1,416 level serves as the primary dynamic support zone, aligning with the Bollinger Bands middle line ($1,415) and EMA-25 ($1,417).
• Critical support: The local low of $1,376 and the lower Bollinger Band at $1,390 provide protection against a deeper decline.
• Nearest resistance: The $1,431–$1,440 zone caps upward movement, with the Supertrend line ($1,431) and the upper Bollinger Band ($1,440) running through it.
• Main barrier: The long-term EMA-99 at $1,458 forms a strong downward barrier.
Key trading signals
• Buy on a pullback: Buy 1: 1.415 (support from the BOLL middle line and EMA-25 amid positive MACD).
• Take profit: Sell 1: 1.44 (resistance at the upper Bollinger Band and overbought conditions according to Stoch RSI).
• Critical support: The local low of $1,376 and the lower Bollinger Band at $1,390 provide protection against a deeper decline.
• Nearest resistance: The $1,431–$1,440 zone caps upward movement, with the Supertrend line ($1,431) and the upper Bollinger Band ($1,440) running through it.
• Main barrier: The long-term EMA-99 at $1,458 forms a strong downward barrier.
Key trading signals
• Buy on a pullback: Buy 1: 1.415 (support from the BOLL middle line and EMA-25 amid positive MACD).
• Take profit: Sell 1: 1.44 (resistance at the upper Bollinger Band and overbought conditions according to Stoch RSI).
110
·
--
Bullish
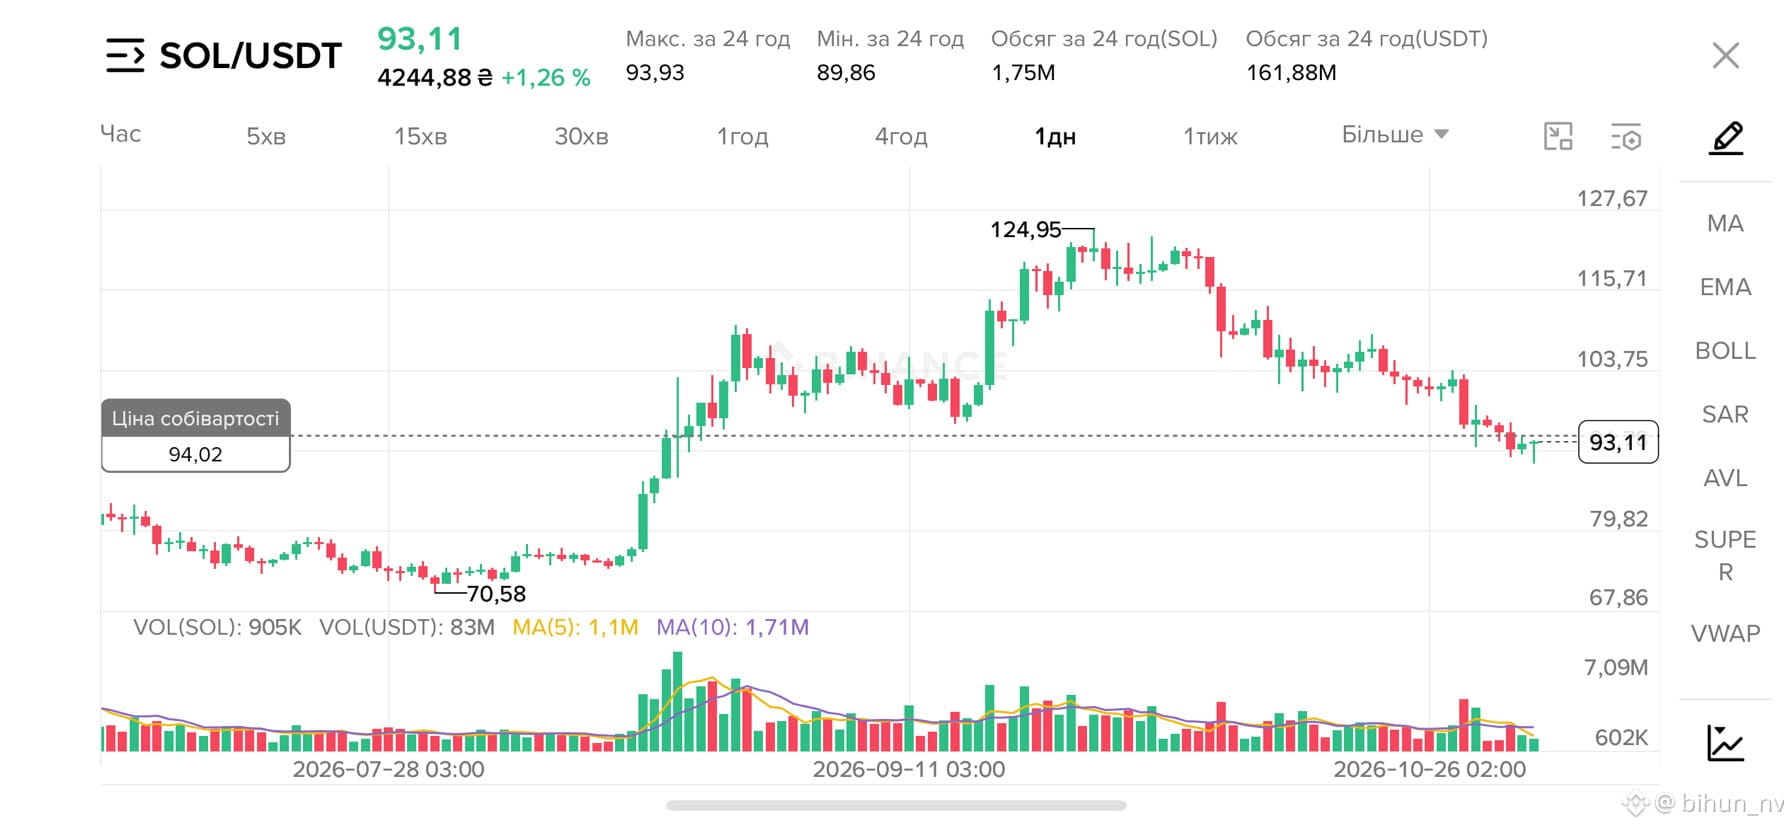
$SOL SOL's short-term rebound has the potential to reach resistance at $94.20 if buyers manage to keep prices above $92.70.
{spot}(SOLUSDT)
$SOL SOL's short-term rebound has the potential to reach resistance at $94.20 if buyers manage to keep prices above $92.70.
128
·
--
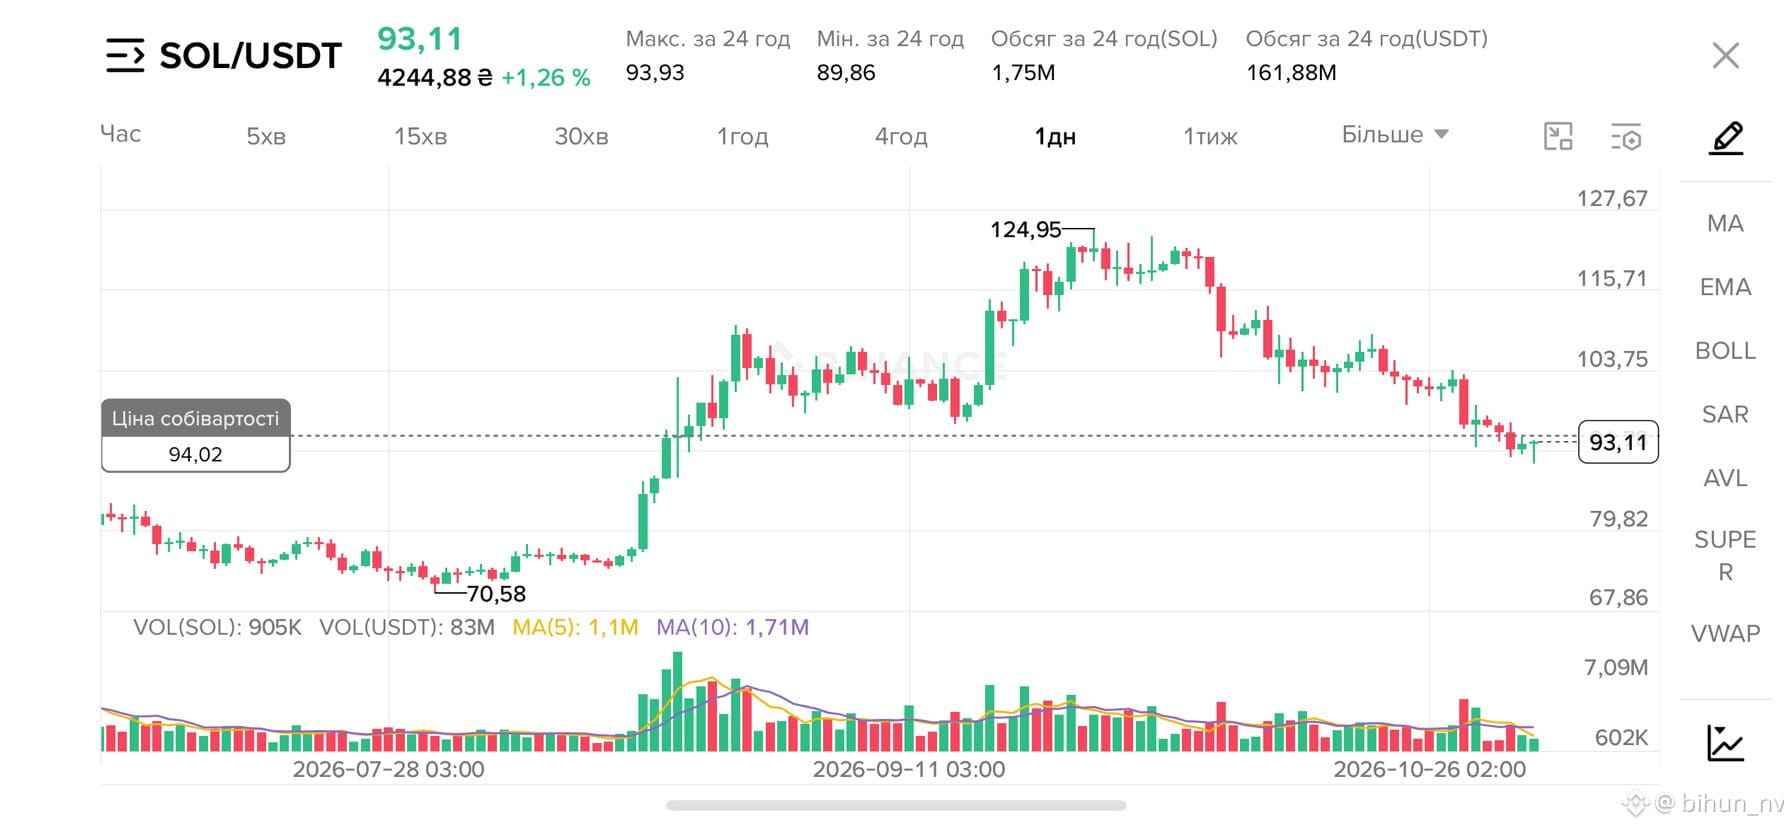
$SOL Current momentum: According to the latest data, the price of
SOL on the 1-hour chart has recovered to $93,10 after falling to $89,86. Short-term momentum
is positive: EMA 7 ($92,61) crossed EMA 25
($92,72) upward.
• Oscillators: MACD shows a bullish crossover (the histogram rose to +0,025), while RSI 14 at ~54,66 confirms buyer dominance without being overbought.
Support and resistance levels
• Support: The $92,72 level (EMA 25 together with the middle Bollinger Band at $92,92) serves as the nearest stabilization zone. The key liquidity base has formed around the local low of
$89,86.
• Resistance: The main obstacle remains the
long-term EMA 99 ($94,16) and the upper Bollinger
Band ($94,51).
Key trading levels
• Potential entry (Buy): 92.70 (test of EMA 25 and the Bollinger Band support).
• Profit-taking target (Sell): 94.20 (taking profit near the declining EMA 99).
{spot}(SOLUSDT)
$SOL Current momentum: According to the latest data, the price of
SOL on the 1-hour chart has recovered to $93,10 after falling to $89,86. Short-term momentum
is positive: EMA 7 ($92,61) crossed EMA 25
($92,72) upward.
• Oscillators: MACD shows a bullish crossover (the histogram rose to +0,025), while RSI 14 at ~54,66 confirms buyer dominance without being overbought.
Support and resistance levels
• Support: The $92,72 level (EMA 25 together with the middle Bollinger Band at $92,92) serves as the nearest stabilization zone. The key liquidity base has formed around the local low of
$89,86.
• Resistance: The main obstacle remains the
long-term EMA 99 ($94,16) and the upper Bollinger
Band ($94,51).
Key trading levels
• Potential entry (Buy): 92.70 (test of EMA 25 and the Bollinger Band support).
• Profit-taking target (Sell): 94.20 (taking profit near the declining EMA 99).
SOL on the 1-hour chart has recovered to $93,10 after falling to $89,86. Short-term momentum
is positive: EMA 7 ($92,61) crossed EMA 25
($92,72) upward.
• Oscillators: MACD shows a bullish crossover (the histogram rose to +0,025), while RSI 14 at ~54,66 confirms buyer dominance without being overbought.
Support and resistance levels
• Support: The $92,72 level (EMA 25 together with the middle Bollinger Band at $92,92) serves as the nearest stabilization zone. The key liquidity base has formed around the local low of
$89,86.
• Resistance: The main obstacle remains the
long-term EMA 99 ($94,16) and the upper Bollinger
Band ($94,51).
Key trading levels
• Potential entry (Buy): 92.70 (test of EMA 25 and the Bollinger Band support).
• Profit-taking target (Sell): 94.20 (taking profit near the declining EMA 99).
104
·
--
Bullish
Holding $ETH 97.4 USDT
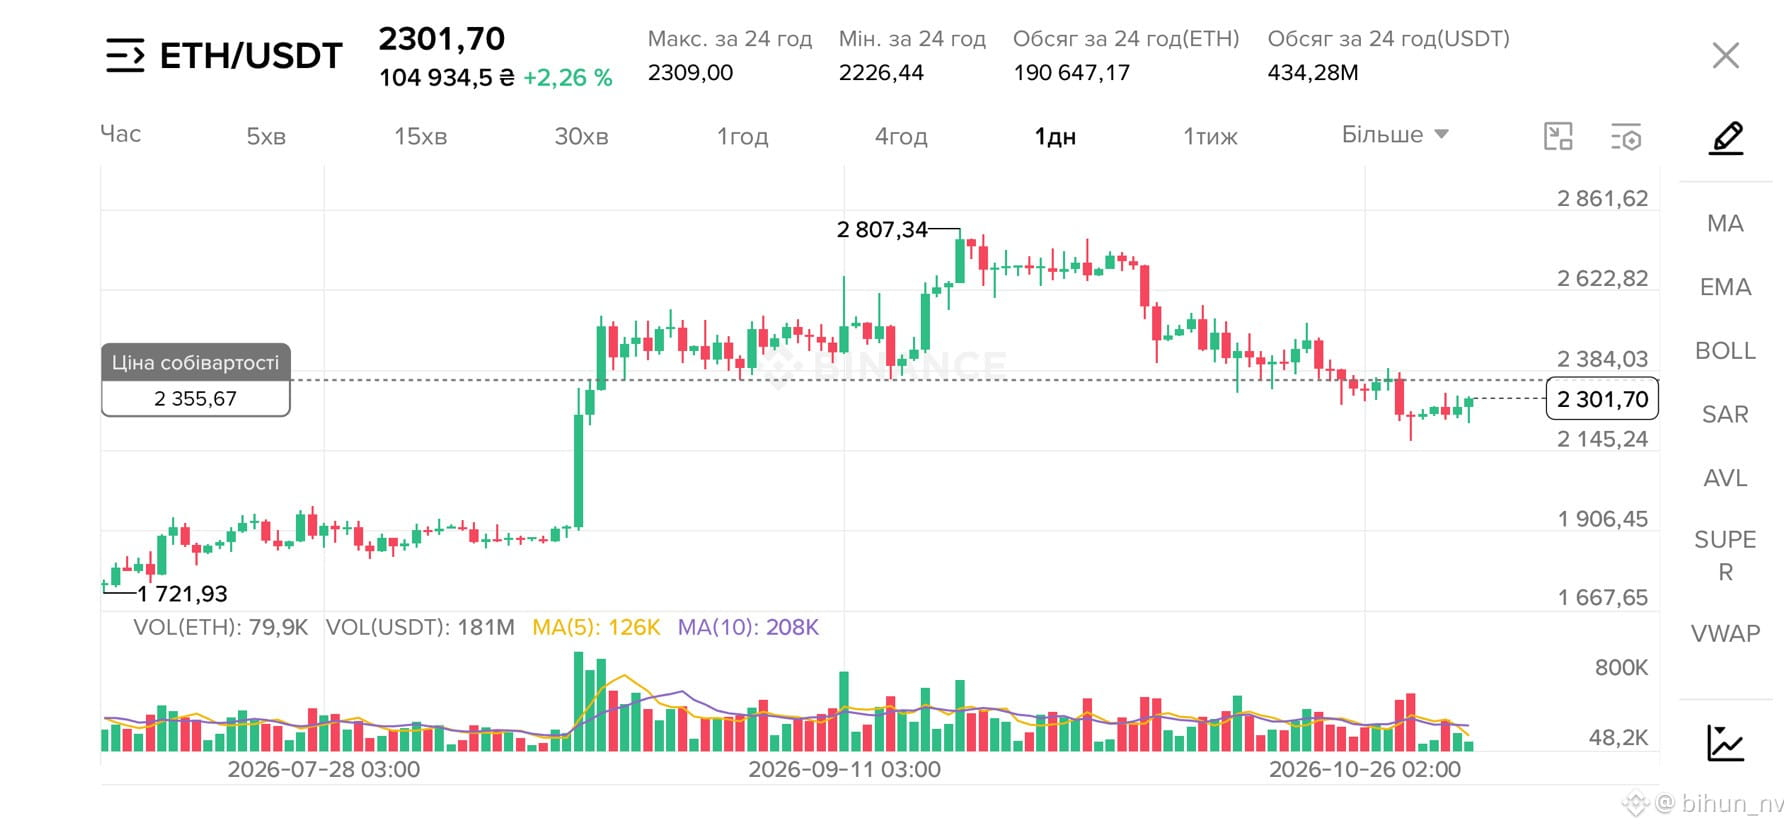
$ETH ETH shows positive 1H momentum above key EMAs, but for the rally to continue, buyers need to decisively break through the $2,309.00–$2,315.67 barrier.
{spot}(ETHUSDT)
$ETH ETH shows positive 1H momentum above key EMAs, but for the rally to continue, buyers need to decisively break through the $2,309.00–$2,315.67 barrier.
1
162
·
--
$ETH
Trend Analysis (1H)
• Upward momentum: ETH recovered to $2
301,53, holding above the EMA 7 ($2 285,82), EMA 25 ($2 279,10), and EMA 99 ($2
275,74) moving averages.
• Technical indicators: The MACD line (3,64) crossed above the signal line, with a positive histogram (1,58). RSI at 61,92 indicates moderate bullish momentum without being overbought.
Support and Resistance Levels
• Resistance: The nearest resistance is at the upper Bollinger Band at $2 315,67, while the key local high is near $2 309,00.
• Support: The initial support base is formed by the Bollinger midline at $2 284,45, while the critical buyer defense zone is around the EMA 99 ($2 275,74) and the lower band at $2 253,23.
Key Trading Levels
• Buy target: A pullback to the Bollinger midline and
EMA 7 offers a buying zone at $2 284,45, provided a bounce is confirmed.
• Sell target: Take profit near the local resistance
and high of $2 309,00.
$ETH
Trend Analysis (1H)
• Upward momentum: ETH recovered to $2
301,53, holding above the EMA 7 ($2 285,82), EMA 25 ($2 279,10), and EMA 99 ($2
275,74) moving averages.
• Technical indicators: The MACD line (3,64) crossed above the signal line, with a positive histogram (1,58). RSI at 61,92 indicates moderate bullish momentum without being overbought.
Support and Resistance Levels
• Resistance: The nearest resistance is at the upper Bollinger Band at $2 315,67, while the key local high is near $2 309,00.
• Support: The initial support base is formed by the Bollinger midline at $2 284,45, while the critical buyer defense zone is around the EMA 99 ($2 275,74) and the lower band at $2 253,23.
Key Trading Levels
• Buy target: A pullback to the Bollinger midline and
EMA 7 offers a buying zone at $2 284,45, provided a bounce is confirmed.
• Sell target: Take profit near the local resistance
and high of $2 309,00.
Trend Analysis (1H)
• Upward momentum: ETH recovered to $2
301,53, holding above the EMA 7 ($2 285,82), EMA 25 ($2 279,10), and EMA 99 ($2
275,74) moving averages.
• Technical indicators: The MACD line (3,64) crossed above the signal line, with a positive histogram (1,58). RSI at 61,92 indicates moderate bullish momentum without being overbought.
Support and Resistance Levels
• Resistance: The nearest resistance is at the upper Bollinger Band at $2 315,67, while the key local high is near $2 309,00.
• Support: The initial support base is formed by the Bollinger midline at $2 284,45, while the critical buyer defense zone is around the EMA 99 ($2 275,74) and the lower band at $2 253,23.
Key Trading Levels
• Buy target: A pullback to the Bollinger midline and
EMA 7 offers a buying zone at $2 284,45, provided a bounce is confirmed.
• Sell target: Take profit near the local resistance
and high of $2 309,00.
515
·
--
Bearish
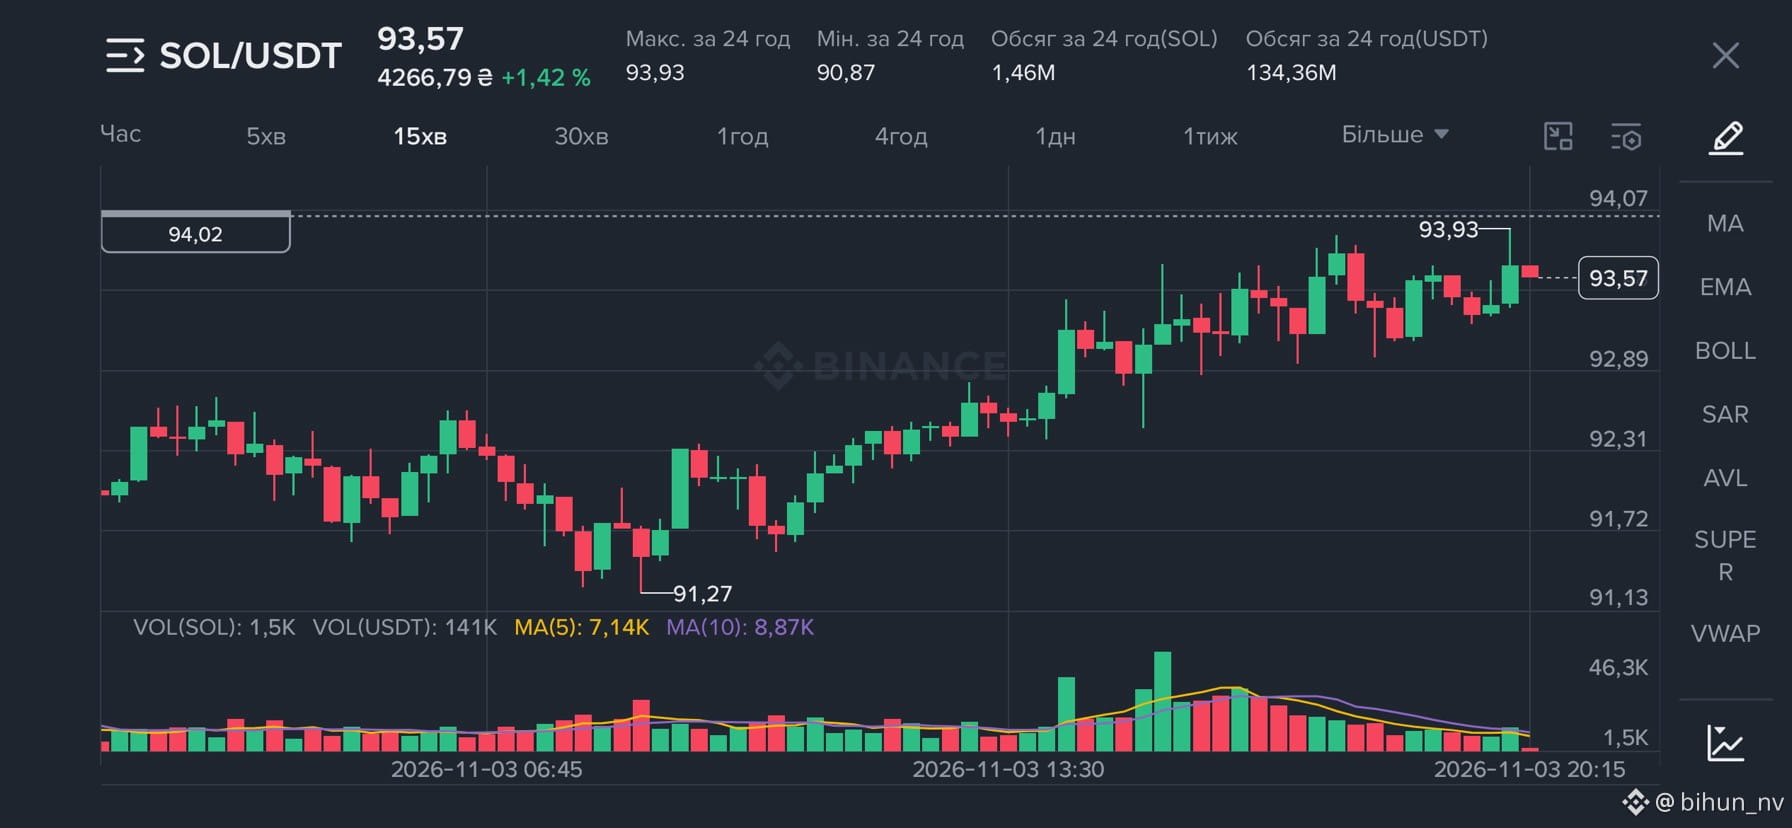
Holding $SOL 91 USDT
$SOL
I was literally just a couple of cents away from making a profit. What do you think?
{spot}(SOLUSDT)
$SOL
I was literally just a couple of cents away from making a profit. What do you think?
I was literally just a couple of cents away from making a profit. What do you think?
410
·
--
$FARTCOIN 🚀Going long on FARTCOIN at 25x
Entry: market price
Take profit: 0.1189, 0.1213, 0.1258
Stop loss: 0.1114
Take profit on 50% at the first target, 25% at the second target, and 25% on the remaining position. After the first target, move the stop loss to breakeven.
$FARTCOIN 🚀Going long on FARTCOIN at 25x
Entry: market price
Take profit: 0.1189, 0.1213, 0.1258
Stop loss: 0.1114
Take profit on 50% at the first target, 25% at the second target, and 25% on the remaining position. After the first target, move the stop loss to breakeven.
Entry: market price
Take profit: 0.1189, 0.1213, 0.1258
Stop loss: 0.1114
Take profit on 50% at the first target, 25% at the second target, and 25% on the remaining position. After the first target, move the stop loss to breakeven.
154
Log in to explore more content
Join global crypto users on Binance Square
⚡️ Get latest and useful information about crypto.
💬 Trusted by the world’s largest crypto exchange.
👍 Discover real insights from verified creators.
Email / Phone number
Trending Topics
NvidiaInvestigatesAfterHuang’sAffairApology
25,946 views
342 Discussing
Nvidia Board Opens Probe Into Whether Huang Was Target of Foreign Intelligence Effort
Binance News
·10 Likes
·15.7k views
BitcoinFiveWeeklyLosses
41,234 views
768 Discussing
AIChipSlumpNasdaq
23,131 views
432 Discussing