

Amr_faras 2024
215 Posts

Amr_faras 2024
Report
Block User
Open Trade
Frequent Trader
2.7 Years
4 Following
35 Followers
143 Liked
Posts
Portfolio
All
Quotes
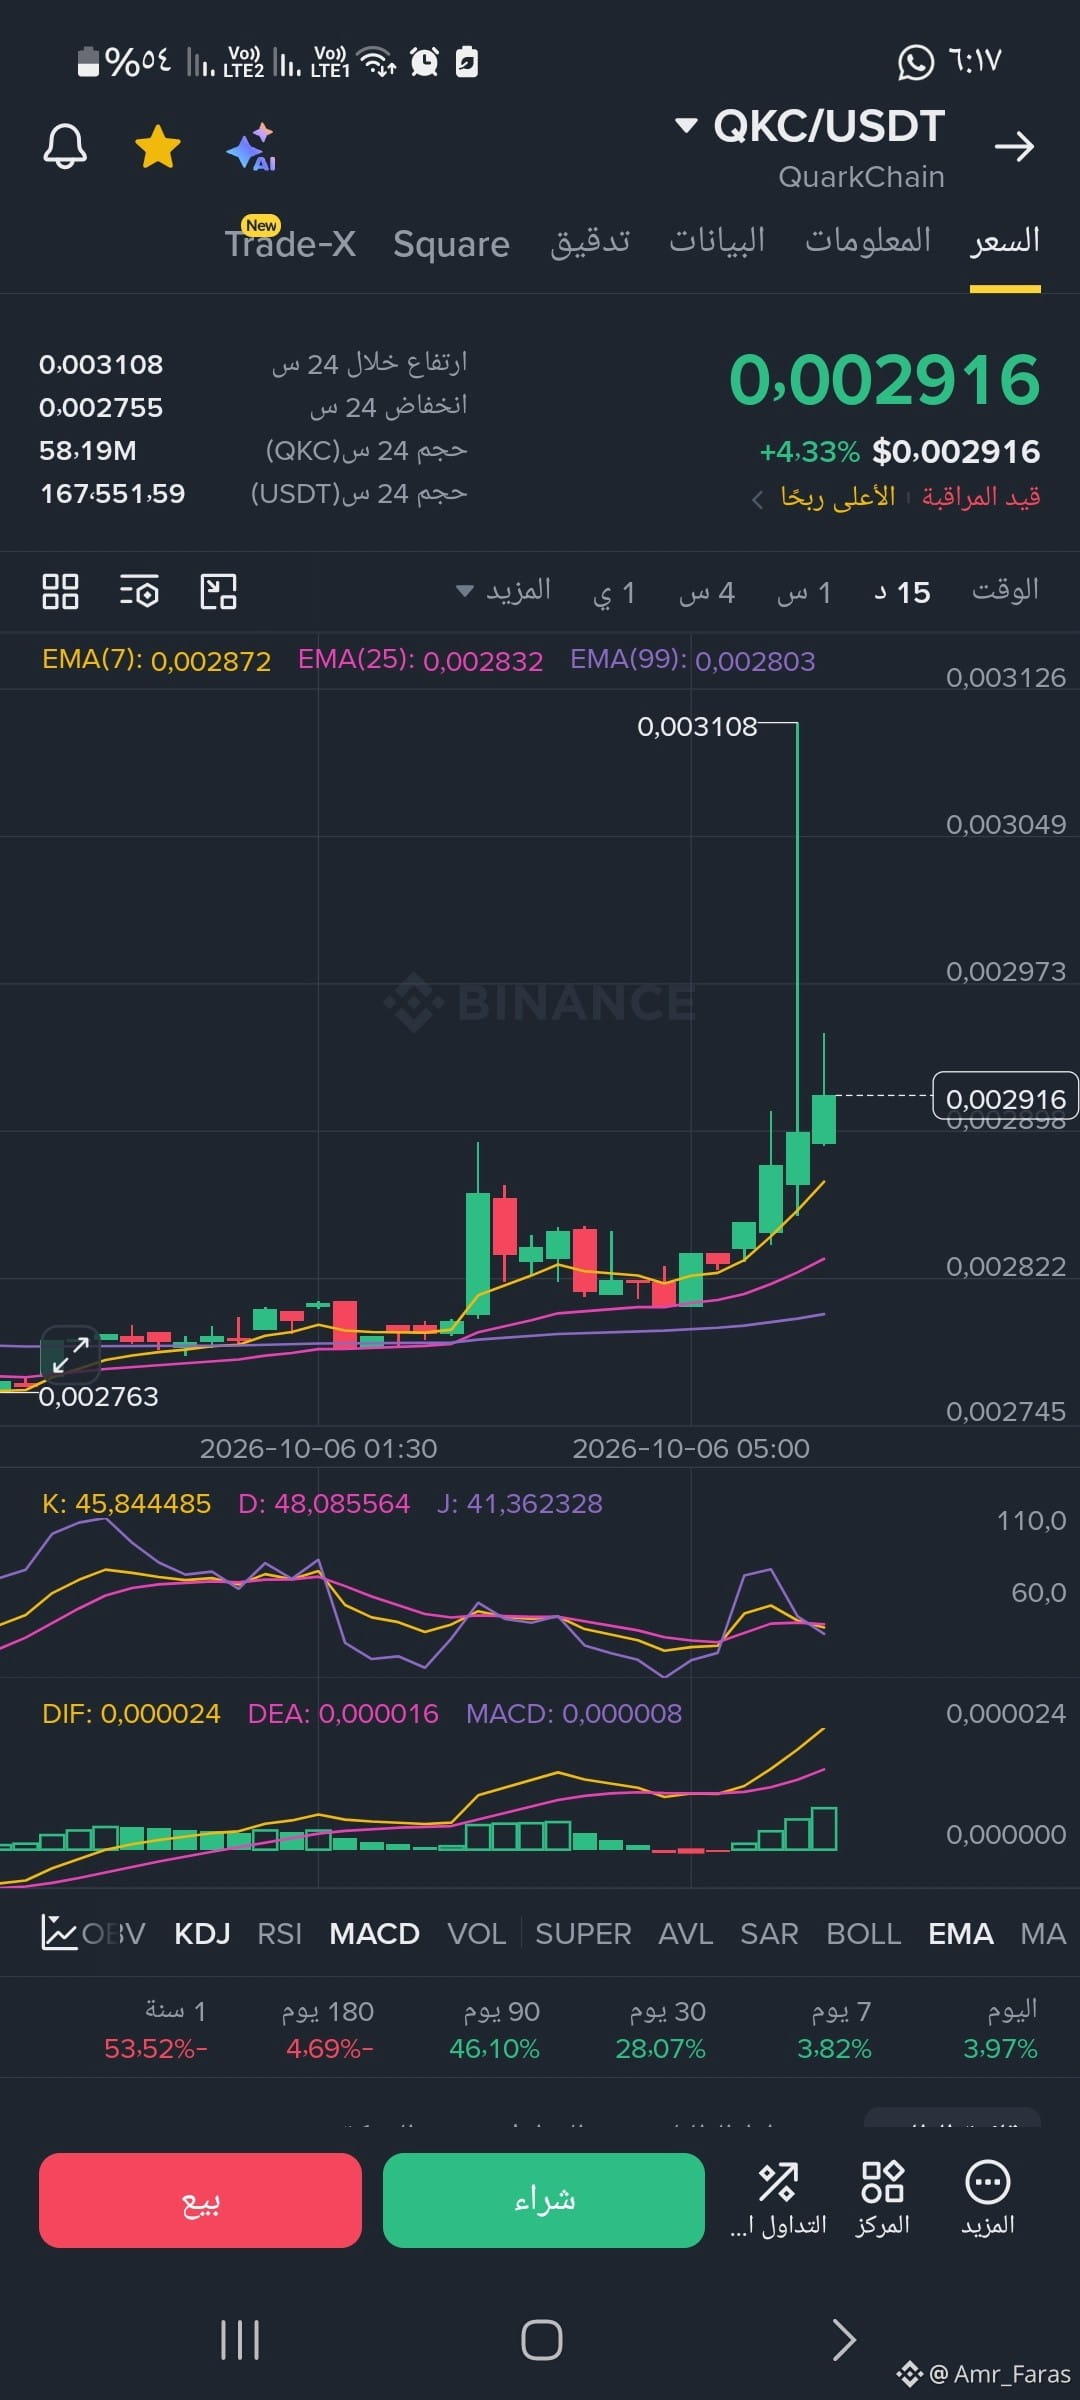
#qkc Price Action and Japanese Candlesticks (Candlesticks)
• Current trend: The chart shows a strong, sudden rise (a very long green candle), indicating a rapid influx of substantial buying liquidity that pushed the price up from 0.002763 to a local peak of 0.003108, before it pulled back slightly and settled at 0.002916.
• Exponential Moving Averages (EMA): The current price is trading above all the moving averages shown:
• EMA(7): 0.002872 (yellow)
• EMA(25): 0.002832 (pink)
• EMA(99): 0.002803 (purple)
• The price being above these averages reinforces short-term bullish momentum, and these levels are currently acting as support zones in the event of a correction.
#qkc Price Action and Japanese Candlesticks (Candlesticks)
• Current trend: The chart shows a strong, sudden rise (a very long green candle), indicating a rapid influx of substantial buying liquidity that pushed the price up from 0.002763 to a local peak of 0.003108, before it pulled back slightly and settled at 0.002916.
• Exponential Moving Averages (EMA): The current price is trading above all the moving averages shown:
• EMA(7): 0.002872 (yellow)
• EMA(25): 0.002832 (pink)
• EMA(99): 0.002803 (purple)
• The price being above these averages reinforces short-term bullish momentum, and these levels are currently acting as support zones in the event of a correction.
• Current trend: The chart shows a strong, sudden rise (a very long green candle), indicating a rapid influx of substantial buying liquidity that pushed the price up from 0.002763 to a local peak of 0.003108, before it pulled back slightly and settled at 0.002916.
• Exponential Moving Averages (EMA): The current price is trading above all the moving averages shown:
• EMA(7): 0.002872 (yellow)
• EMA(25): 0.002832 (pink)
• EMA(99): 0.002803 (purple)
• The price being above these averages reinforces short-term bullish momentum, and these levels are currently acting as support zones in the event of a correction.
1
163
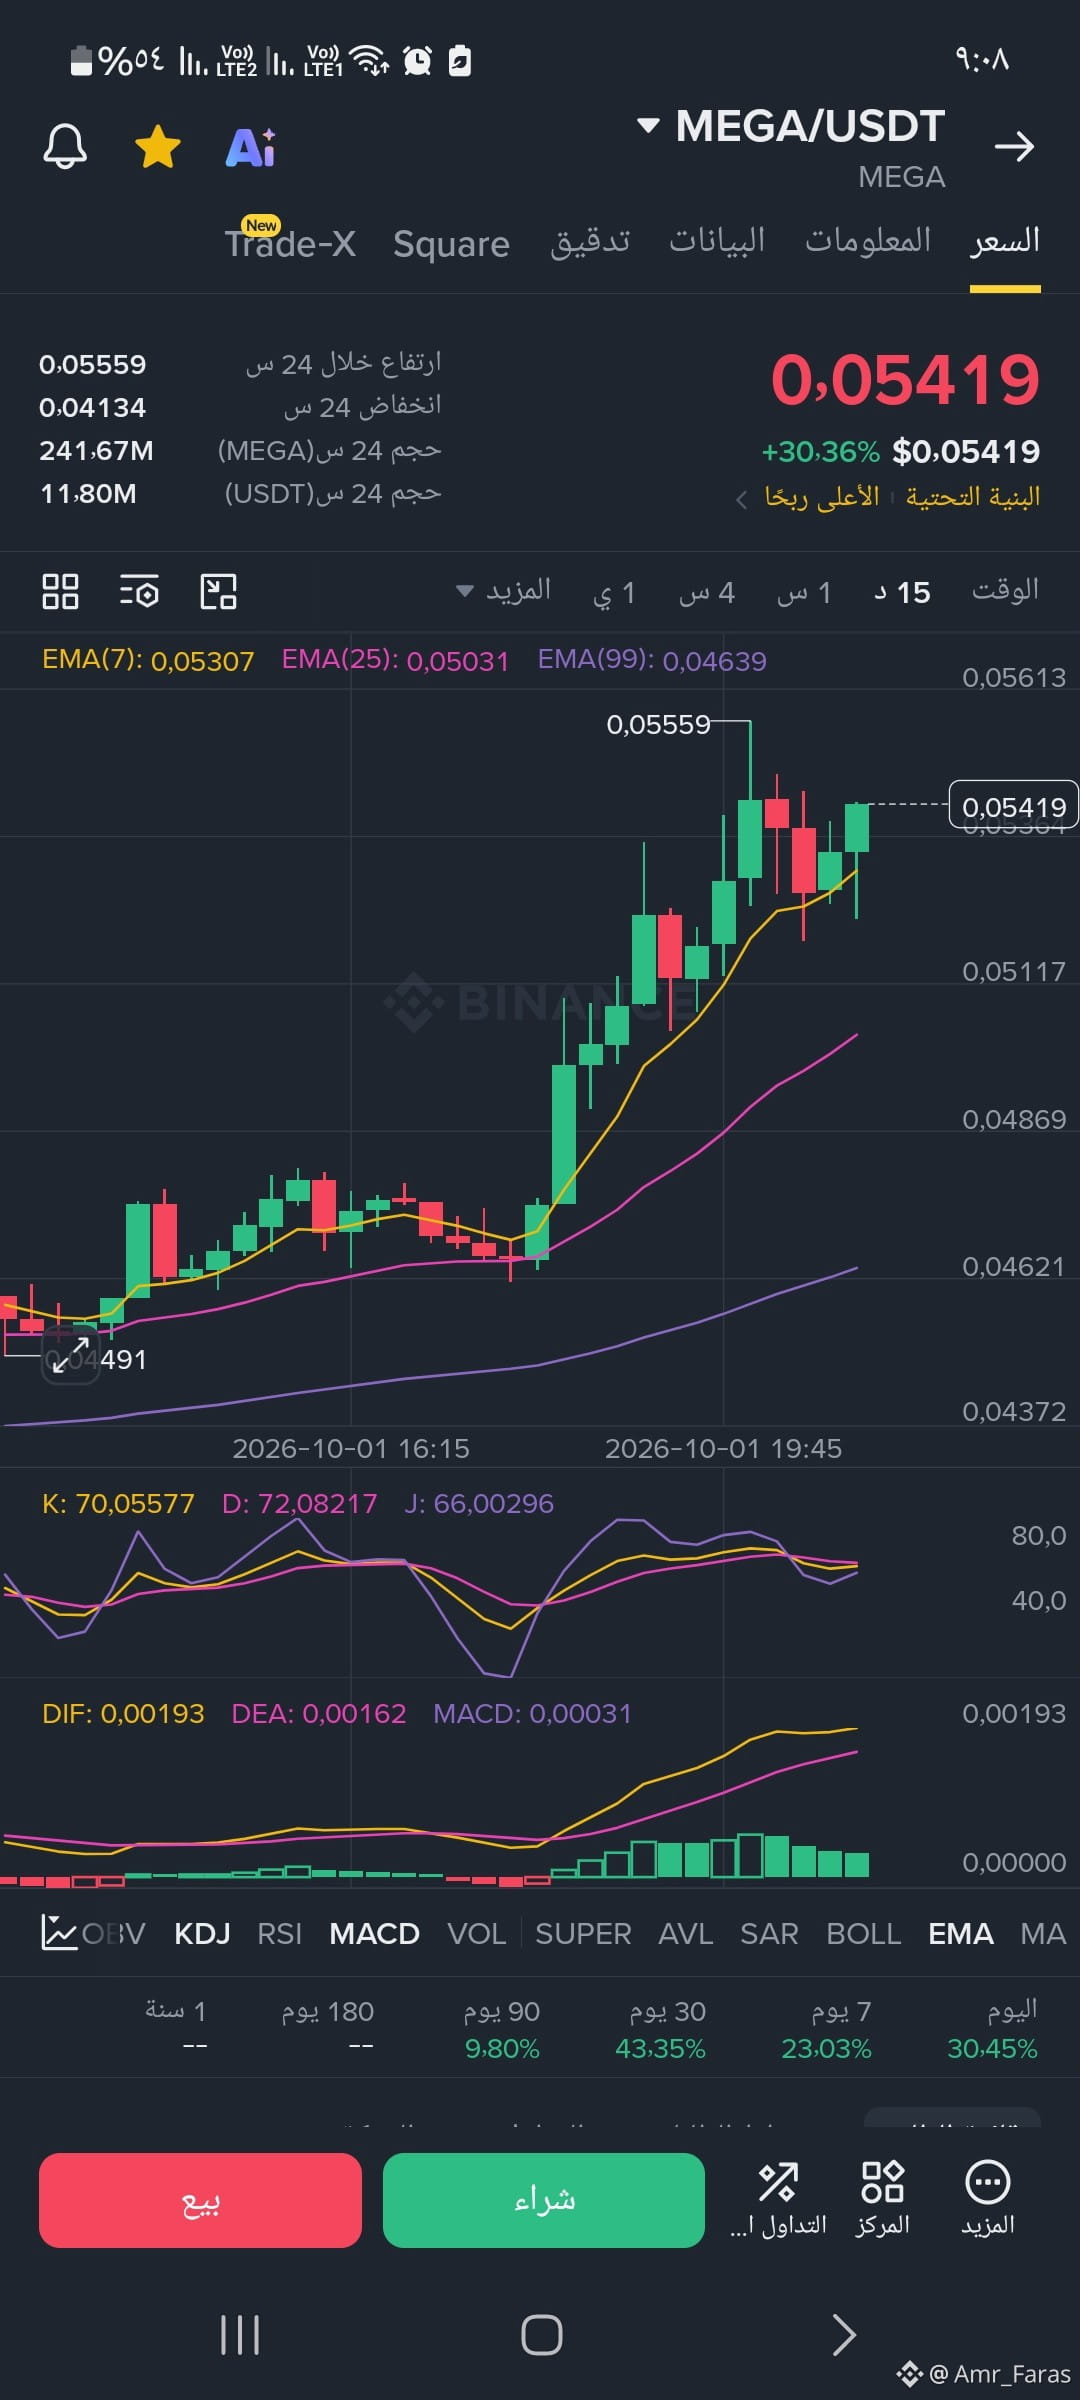
#Mega
Momentum and Liquidity Indicators
• Stochastic Oscillator (KDJ): The indicator lines converge at the top of the range (K: 70.05 and D: 72.08). This suggests the price is approaching an overbought zone, meaning there may be a temporary cool-down or a slight pullback to catch its breath before any further rise.
• MACD Indicator: The DIF line (0.00193) is above the DEA line (0.00162), with the Histogram bars in the positive green range (0.00031). This supports the continued dominance of buyers at present.
3. Price Movement Summary (Over the Past Few Days)
The performance table below the chart shows the accelerated coin growth:
• Daily Performance (Today): Strong rise of 30.45%.
• Over 7 days: Up 23.03% (indicating that the biggest increase is concentrated today).
• Over 30 days: Notable growth of 43.35%.
#Mega
Momentum and Liquidity Indicators
• Stochastic Oscillator (KDJ): The indicator lines converge at the top of the range (K: 70.05 and D: 72.08). This suggests the price is approaching an overbought zone, meaning there may be a temporary cool-down or a slight pullback to catch its breath before any further rise.
• MACD Indicator: The DIF line (0.00193) is above the DEA line (0.00162), with the Histogram bars in the positive green range (0.00031). This supports the continued dominance of buyers at present.
3. Price Movement Summary (Over the Past Few Days)
The performance table below the chart shows the accelerated coin growth:
• Daily Performance (Today): Strong rise of 30.45%.
• Over 7 days: Up 23.03% (indicating that the biggest increase is concentrated today).
• Over 30 days: Notable growth of 43.35%.
Momentum and Liquidity Indicators
• Stochastic Oscillator (KDJ): The indicator lines converge at the top of the range (K: 70.05 and D: 72.08). This suggests the price is approaching an overbought zone, meaning there may be a temporary cool-down or a slight pullback to catch its breath before any further rise.
• MACD Indicator: The DIF line (0.00193) is above the DEA line (0.00162), with the Histogram bars in the positive green range (0.00031). This supports the continued dominance of buyers at present.
3. Price Movement Summary (Over the Past Few Days)
The performance table below the chart shows the accelerated coin growth:
• Daily Performance (Today): Strong rise of 30.45%.
• Over 7 days: Up 23.03% (indicating that the biggest increase is concentrated today).
• Over 30 days: Notable growth of 43.35%.
1
168
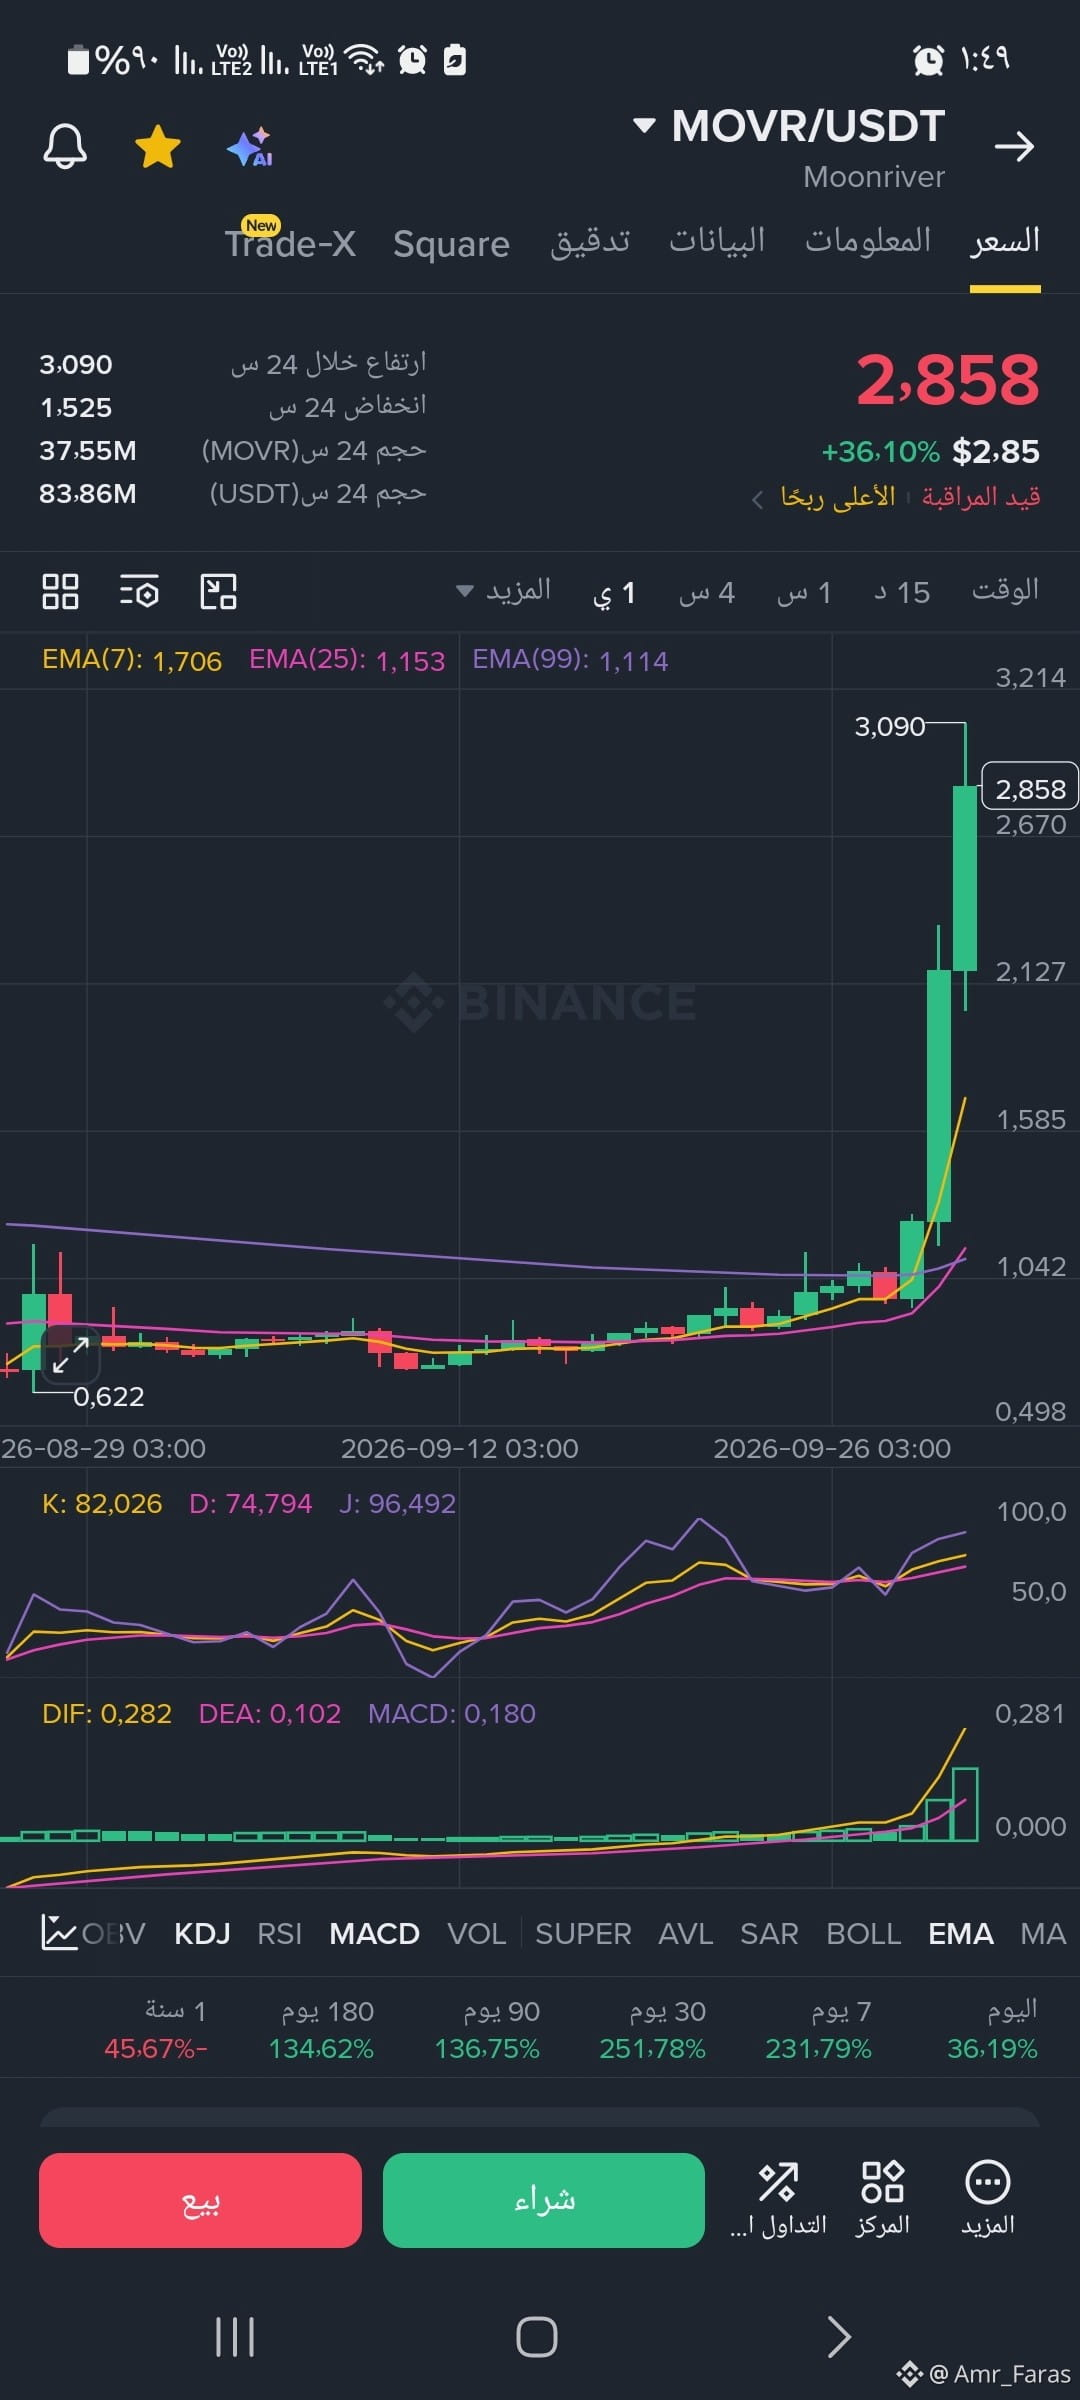
#MOVER
• Price Trend: The price is in a sharp and vertical bullish breakout (Parabolic Move). This sudden and strong rise is represented by the very long green candle at the end of the chart.
• Current Price: The pair is trading at $2.858.
• Volume Indicator (Volume): There is a significant and massive increase in trading volume (the green bar at the bottom), confirming that the rally is driven by strong liquidity and heavy buying pressure.
#MOVER
• Price Trend: The price is in a sharp and vertical bullish breakout (Parabolic Move). This sudden and strong rise is represented by the very long green candle at the end of the chart.
• Current Price: The pair is trading at $2.858.
• Volume Indicator (Volume): There is a significant and massive increase in trading volume (the green bar at the bottom), confirming that the rally is driven by strong liquidity and heavy buying pressure.
• Price Trend: The price is in a sharp and vertical bullish breakout (Parabolic Move). This sudden and strong rise is represented by the very long green candle at the end of the chart.
• Current Price: The pair is trading at $2.858.
• Volume Indicator (Volume): There is a significant and massive increase in trading volume (the green bar at the bottom), confirming that the rally is driven by strong liquidity and heavy buying pressure.
1
190
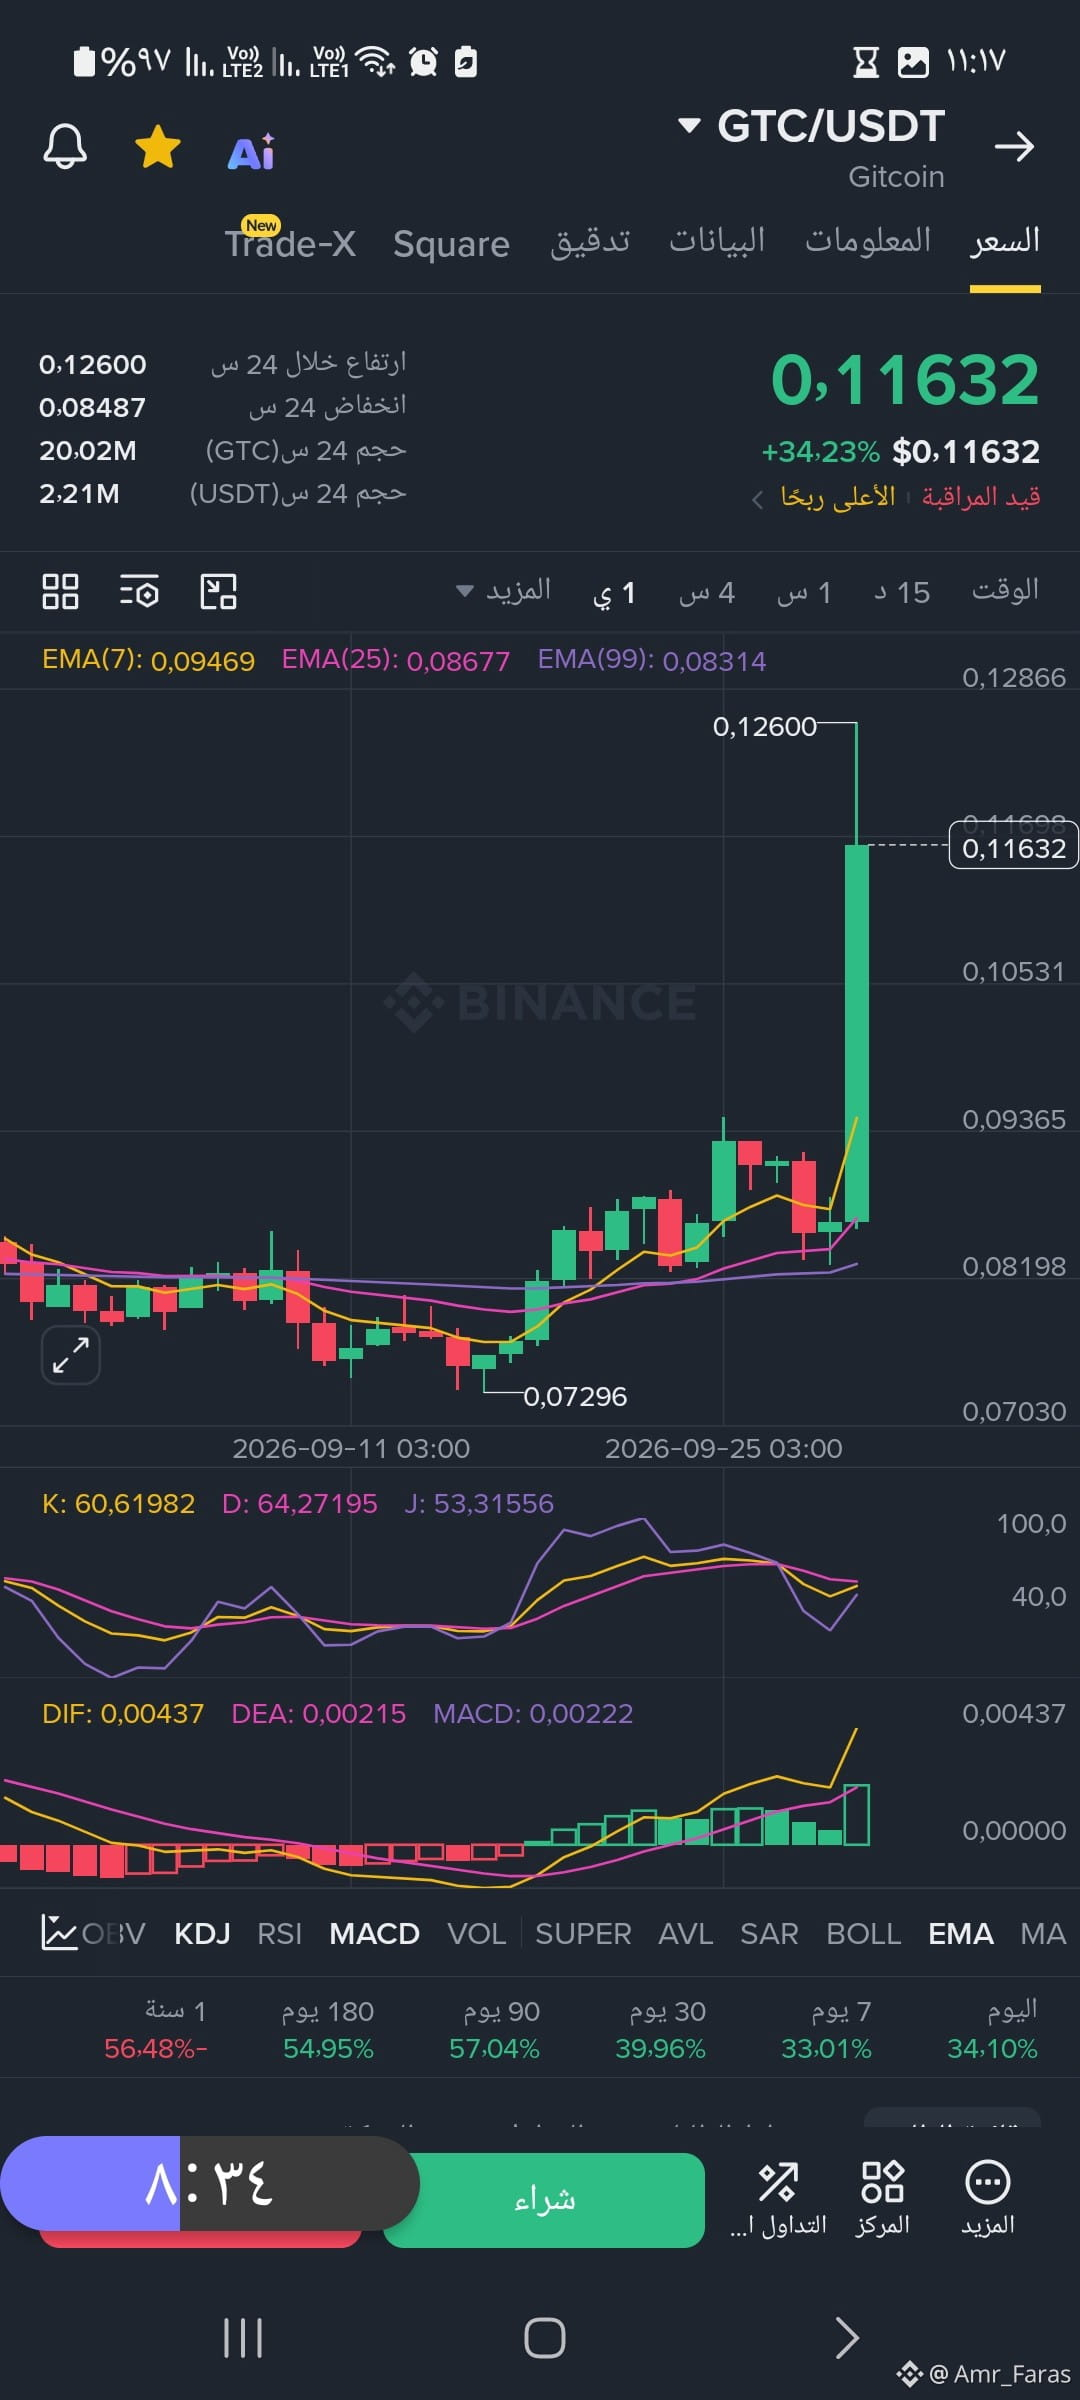
#GTC
⚠️ Reading and investment notes
• Potential profit-taking phase: Considering the long upper tail of the last candle that touched 0.12600 and then reversed downward, this indicates strong resistance and selling pressure (profit-taking) from traders at those higher levels.
• Entry strategy: Entering directly after a sharp rise exceeding 34% involves high risk due to the likelihood of a quick correction after a test of nearby support levels (such as the 0.094 - 0.100 USDT zone)
#GTC
⚠️ Reading and investment notes
• Potential profit-taking phase: Considering the long upper tail of the last candle that touched 0.12600 and then reversed downward, this indicates strong resistance and selling pressure (profit-taking) from traders at those higher levels.
• Entry strategy: Entering directly after a sharp rise exceeding 34% involves high risk due to the likelihood of a quick correction after a test of nearby support levels (such as the 0.094 - 0.100 USDT zone)
⚠️ Reading and investment notes
• Potential profit-taking phase: Considering the long upper tail of the last candle that touched 0.12600 and then reversed downward, this indicates strong resistance and selling pressure (profit-taking) from traders at those higher levels.
• Entry strategy: Entering directly after a sharp rise exceeding 34% involves high risk due to the likelihood of a quick correction after a test of nearby support levels (such as the 0.094 - 0.100 USDT zone)
1
155
#ICP生态
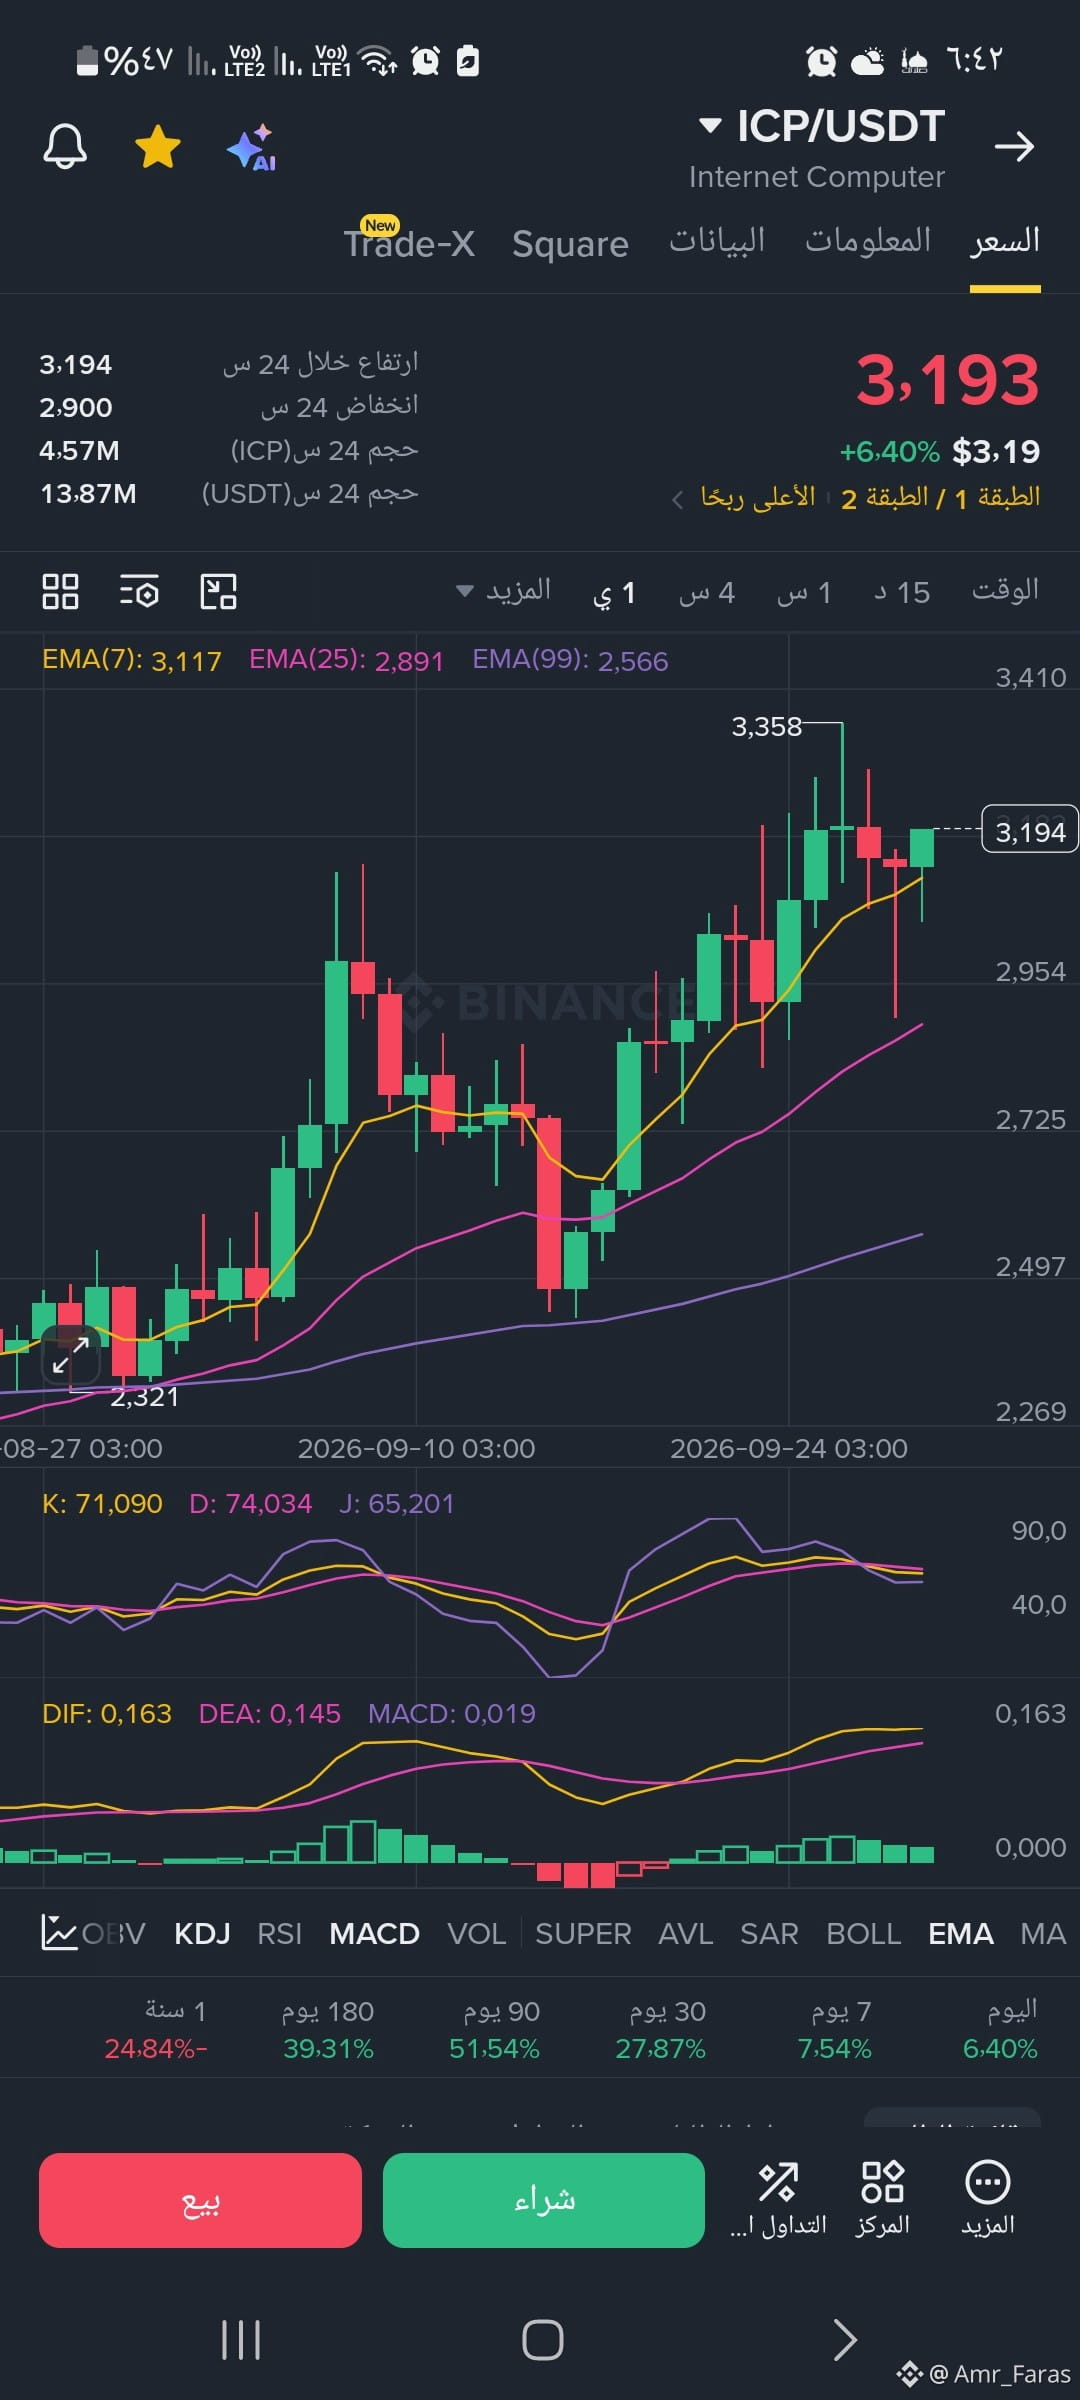
The technical indicators in the image are positive and bullish. The price is looking for consolidation above the 3.190 dollar levels, to build on them as new support, in preparation for a retest of the 3.358 dollar peak
#ICP生态
The technical indicators in the image are positive and bullish. The price is looking for consolidation above the 3.190 dollar levels, to build on them as new support, in preparation for a retest of the 3.358 dollar peak
The technical indicators in the image are positive and bullish. The price is looking for consolidation above the 3.190 dollar levels, to build on them as new support, in preparation for a retest of the 3.358 dollar peak
1
239
#SEI/USDT
🔍 Reading technical indicators
1. KDJ indicator (Momentum indicator)
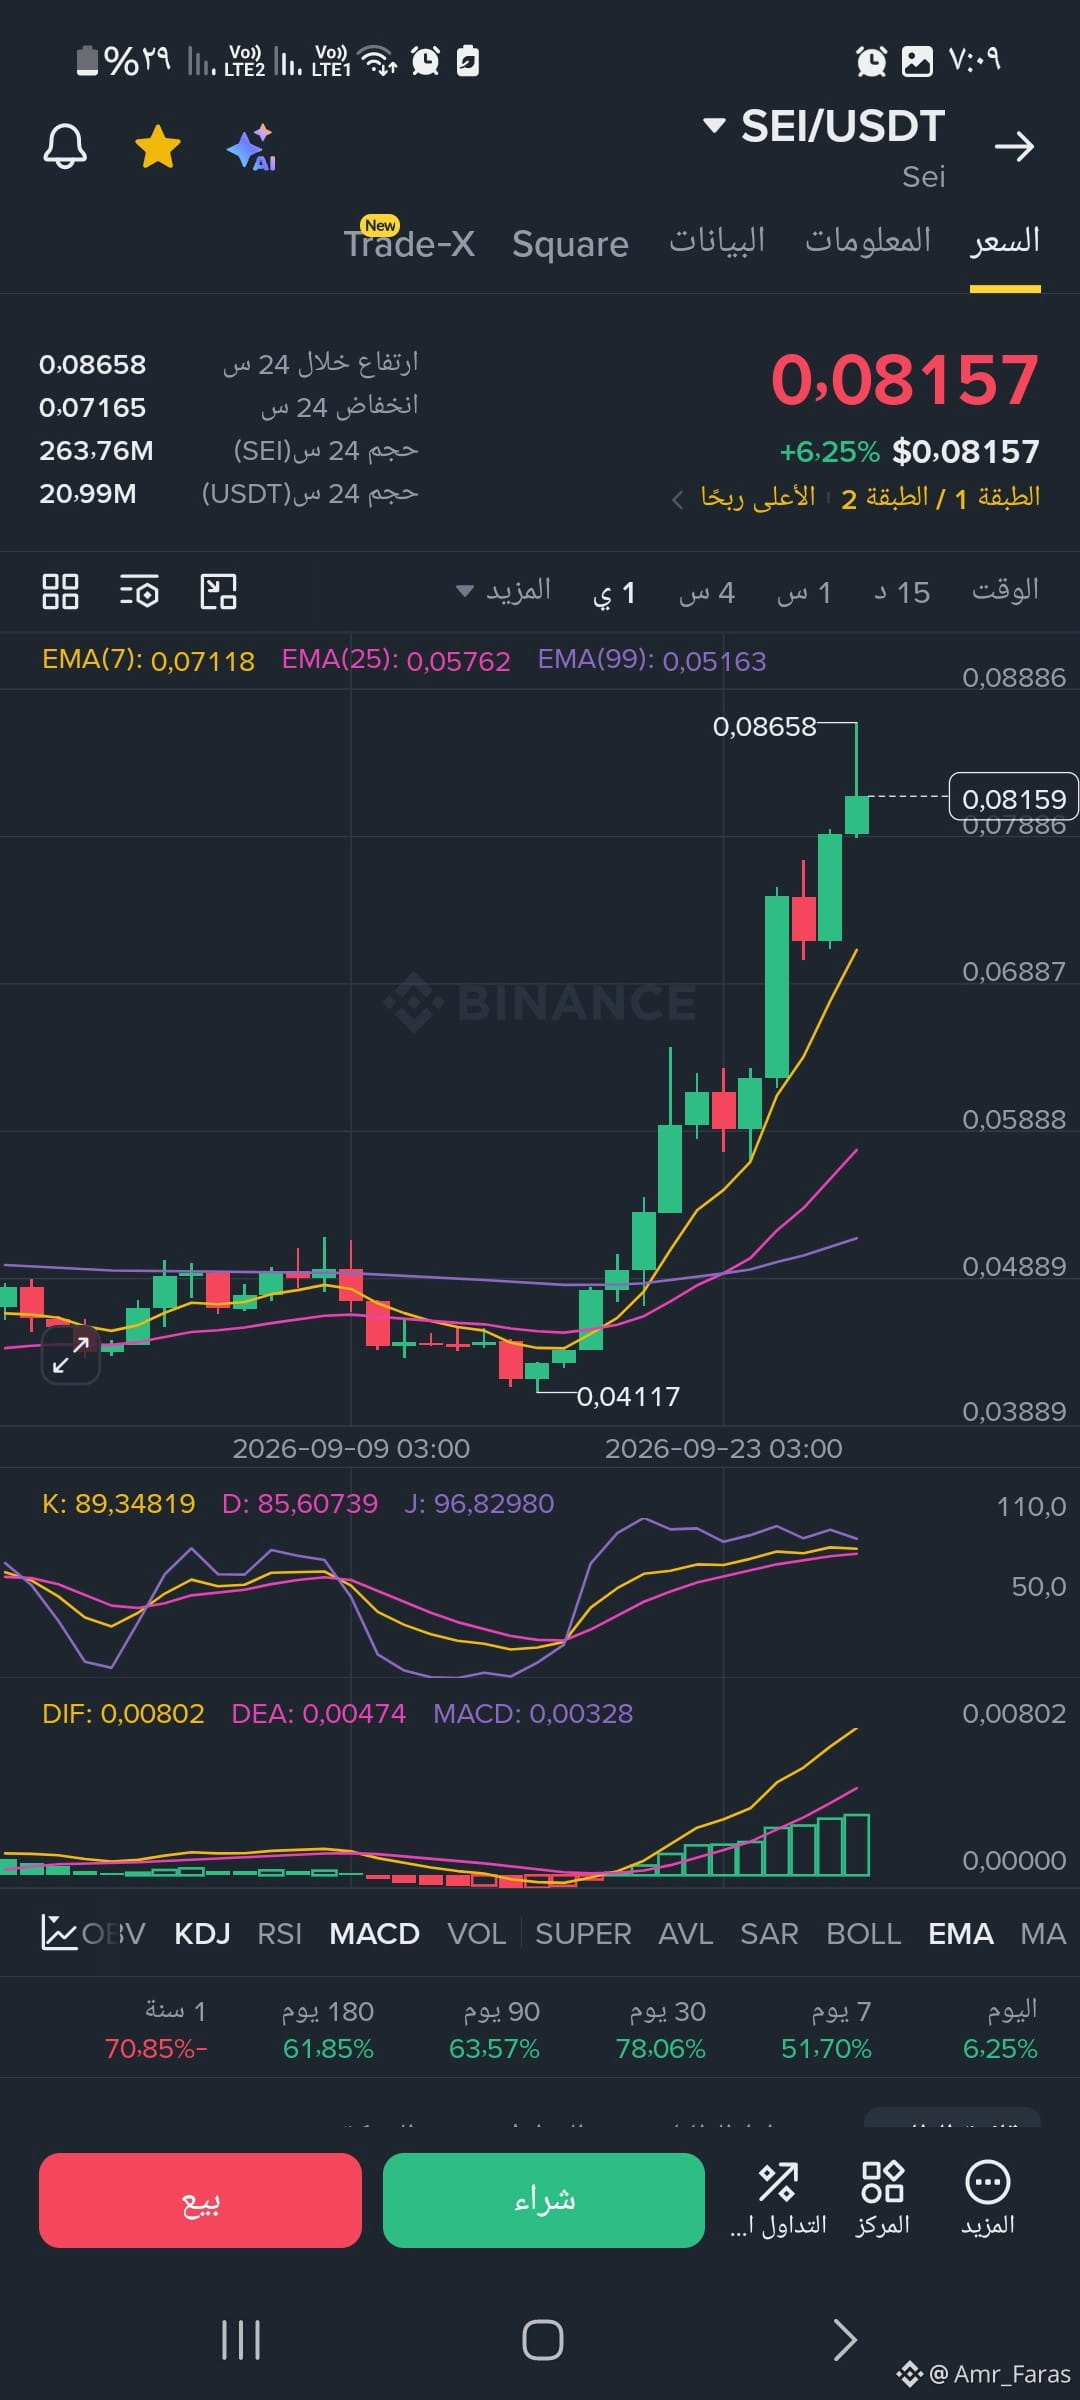
Current values: K: 89.34 | D: 85.60 | J: 96.82
Analysis: The lines are clearly trading in the Overbought zone above the 80 levels. The lines are close together and moving in parallel upward, reflecting the continued strength of upward momentum. However, entering at these levels involves high risk due to the likelihood of a near-term correction.
2. MACD indicator (MACD)
Analysis: The histogram bars are green and expanding in the positive zone above the zero line. The DIF line (0.00802) is above the DEA line (0.00407), confirming the ongoing positive crossover and the current strength of the upward momentum.
#SEI/USDT
🔍 Reading technical indicators
1. KDJ indicator (Momentum indicator)
Current values: K: 89.34 | D: 85.60 | J: 96.82
Analysis: The lines are clearly trading in the Overbought zone above the 80 levels. The lines are close together and moving in parallel upward, reflecting the continued strength of upward momentum. However, entering at these levels involves high risk due to the likelihood of a near-term correction.
2. MACD indicator (MACD)
Analysis: The histogram bars are green and expanding in the positive zone above the zero line. The DIF line (0.00802) is above the DEA line (0.00407), confirming the ongoing positive crossover and the current strength of the upward momentum.
🔍 Reading technical indicators
1. KDJ indicator (Momentum indicator)
Current values: K: 89.34 | D: 85.60 | J: 96.82
Analysis: The lines are clearly trading in the Overbought zone above the 80 levels. The lines are close together and moving in parallel upward, reflecting the continued strength of upward momentum. However, entering at these levels involves high risk due to the likelihood of a near-term correction.
2. MACD indicator (MACD)
Analysis: The histogram bars are green and expanding in the positive zone above the zero line. The DIF line (0.00802) is above the DEA line (0.00407), confirming the ongoing positive crossover and the current strength of the upward momentum.
1
209
#QNT/USDT
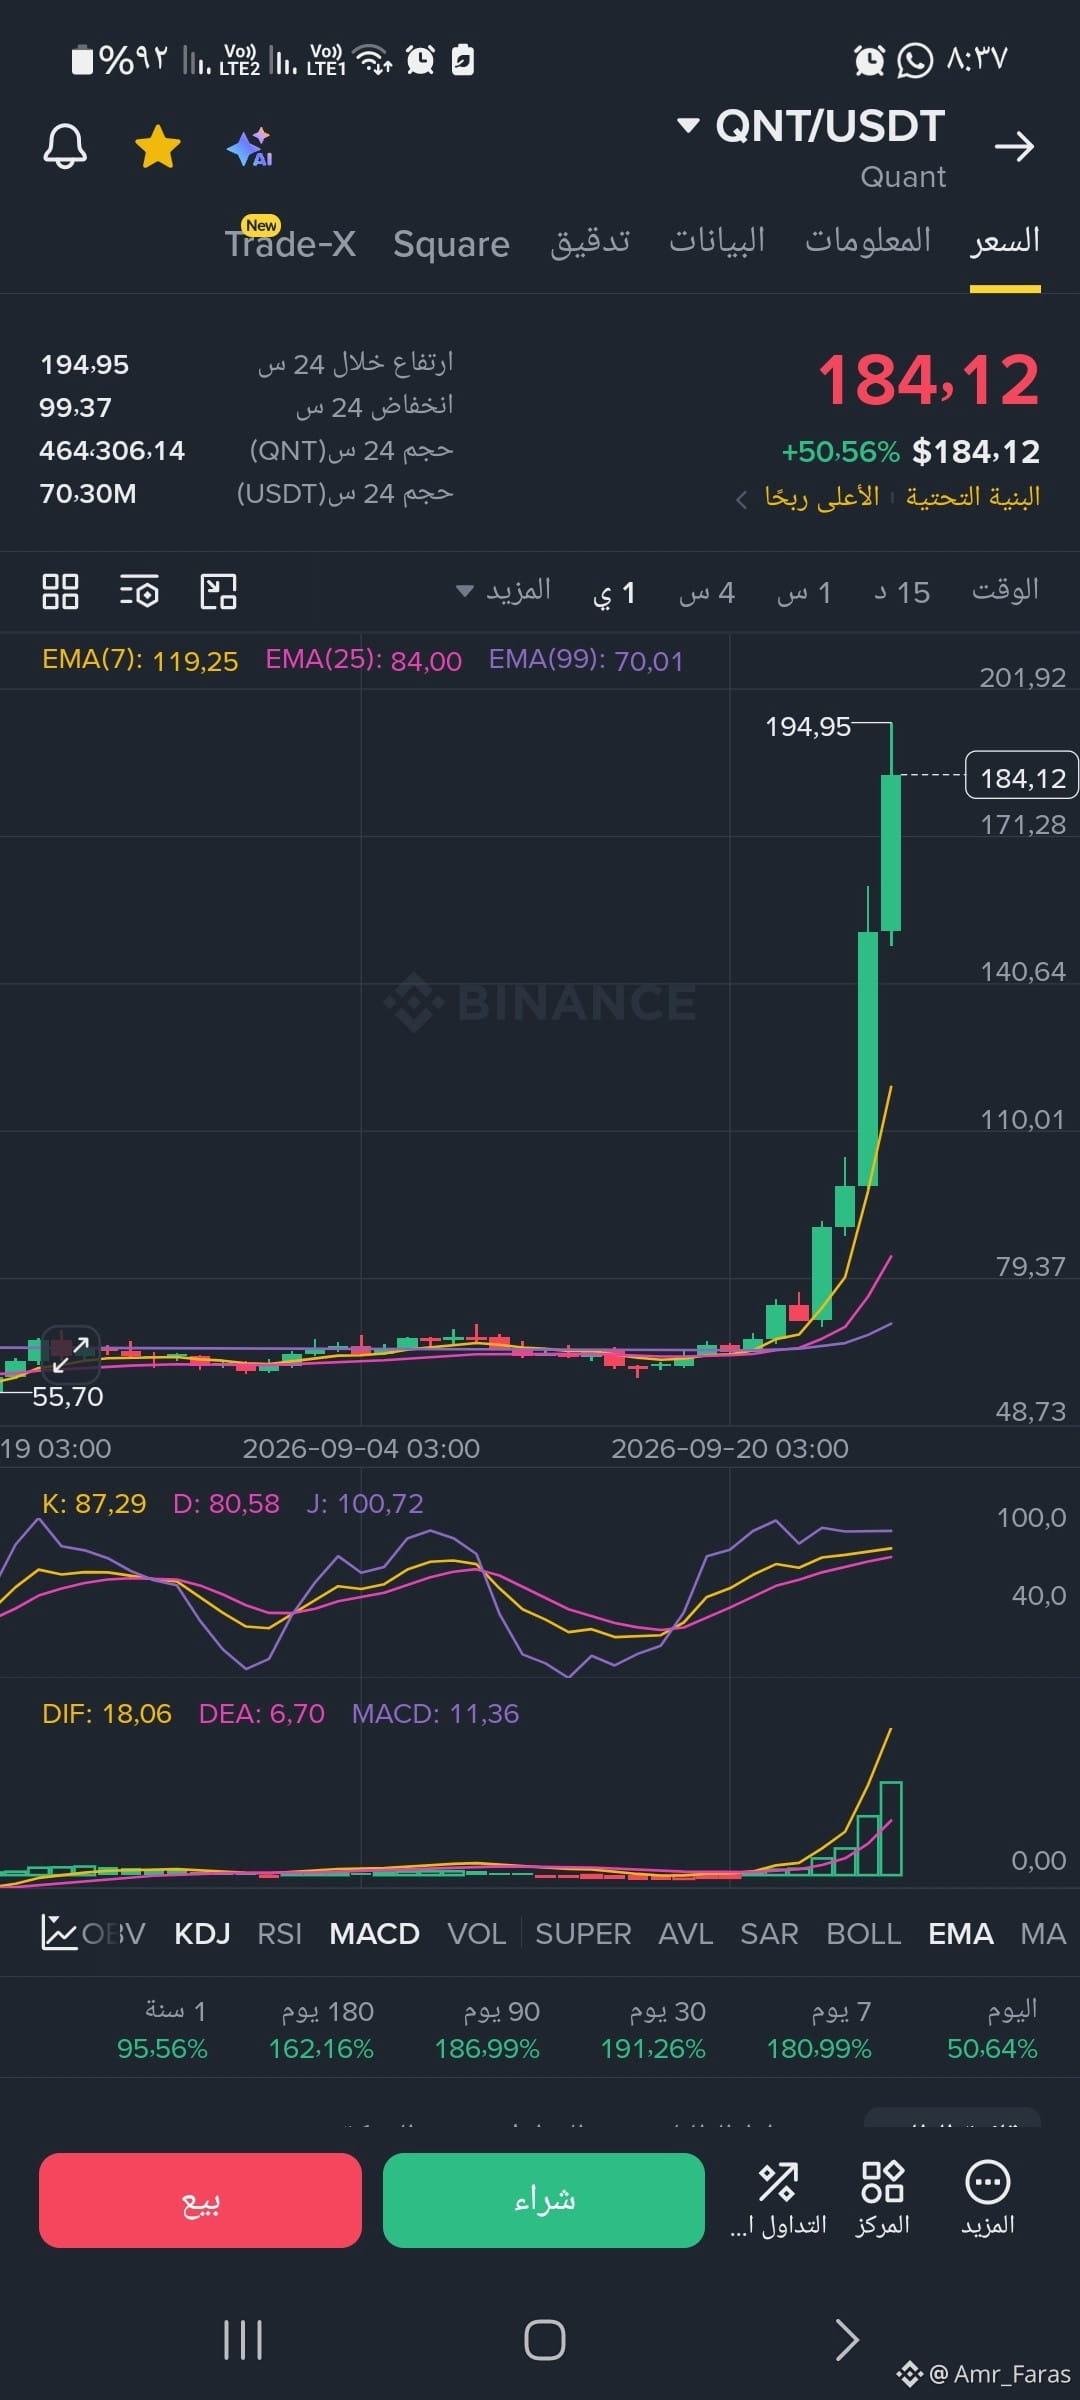
📉 KDJK Indicator: 87.29 | D: 80.58 | J: 100.72
Analysis: The indicator is fully trading within the extremely overbought (Overbought) zones. Specifically, when the J line reaches 100.72, it issues a warning signal indicating a likely near-term cooldown or pullback to offload these inflated indicators.
💡 Key Support and Resistance Levels
Near Resistance: 194.95 level (the highest point reached by the upper tail of the current candle).
First Support: The 140.64 to 119.25 zone (previous broken resistance levels and the location of the 7 EMA average).
#QNT/USDT
📉 KDJK Indicator: 87.29 | D: 80.58 | J: 100.72
Analysis: The indicator is fully trading within the extremely overbought (Overbought) zones. Specifically, when the J line reaches 100.72, it issues a warning signal indicating a likely near-term cooldown or pullback to offload these inflated indicators.
💡 Key Support and Resistance Levels
Near Resistance: 194.95 level (the highest point reached by the upper tail of the current candle).
First Support: The 140.64 to 119.25 zone (previous broken resistance levels and the location of the 7 EMA average).
📉 KDJK Indicator: 87.29 | D: 80.58 | J: 100.72
Analysis: The indicator is fully trading within the extremely overbought (Overbought) zones. Specifically, when the J line reaches 100.72, it issues a warning signal indicating a likely near-term cooldown or pullback to offload these inflated indicators.
💡 Key Support and Resistance Levels
Near Resistance: 194.95 level (the highest point reached by the upper tail of the current candle).
First Support: The 140.64 to 119.25 zone (previous broken resistance levels and the location of the 7 EMA average).
1
68
#WLD
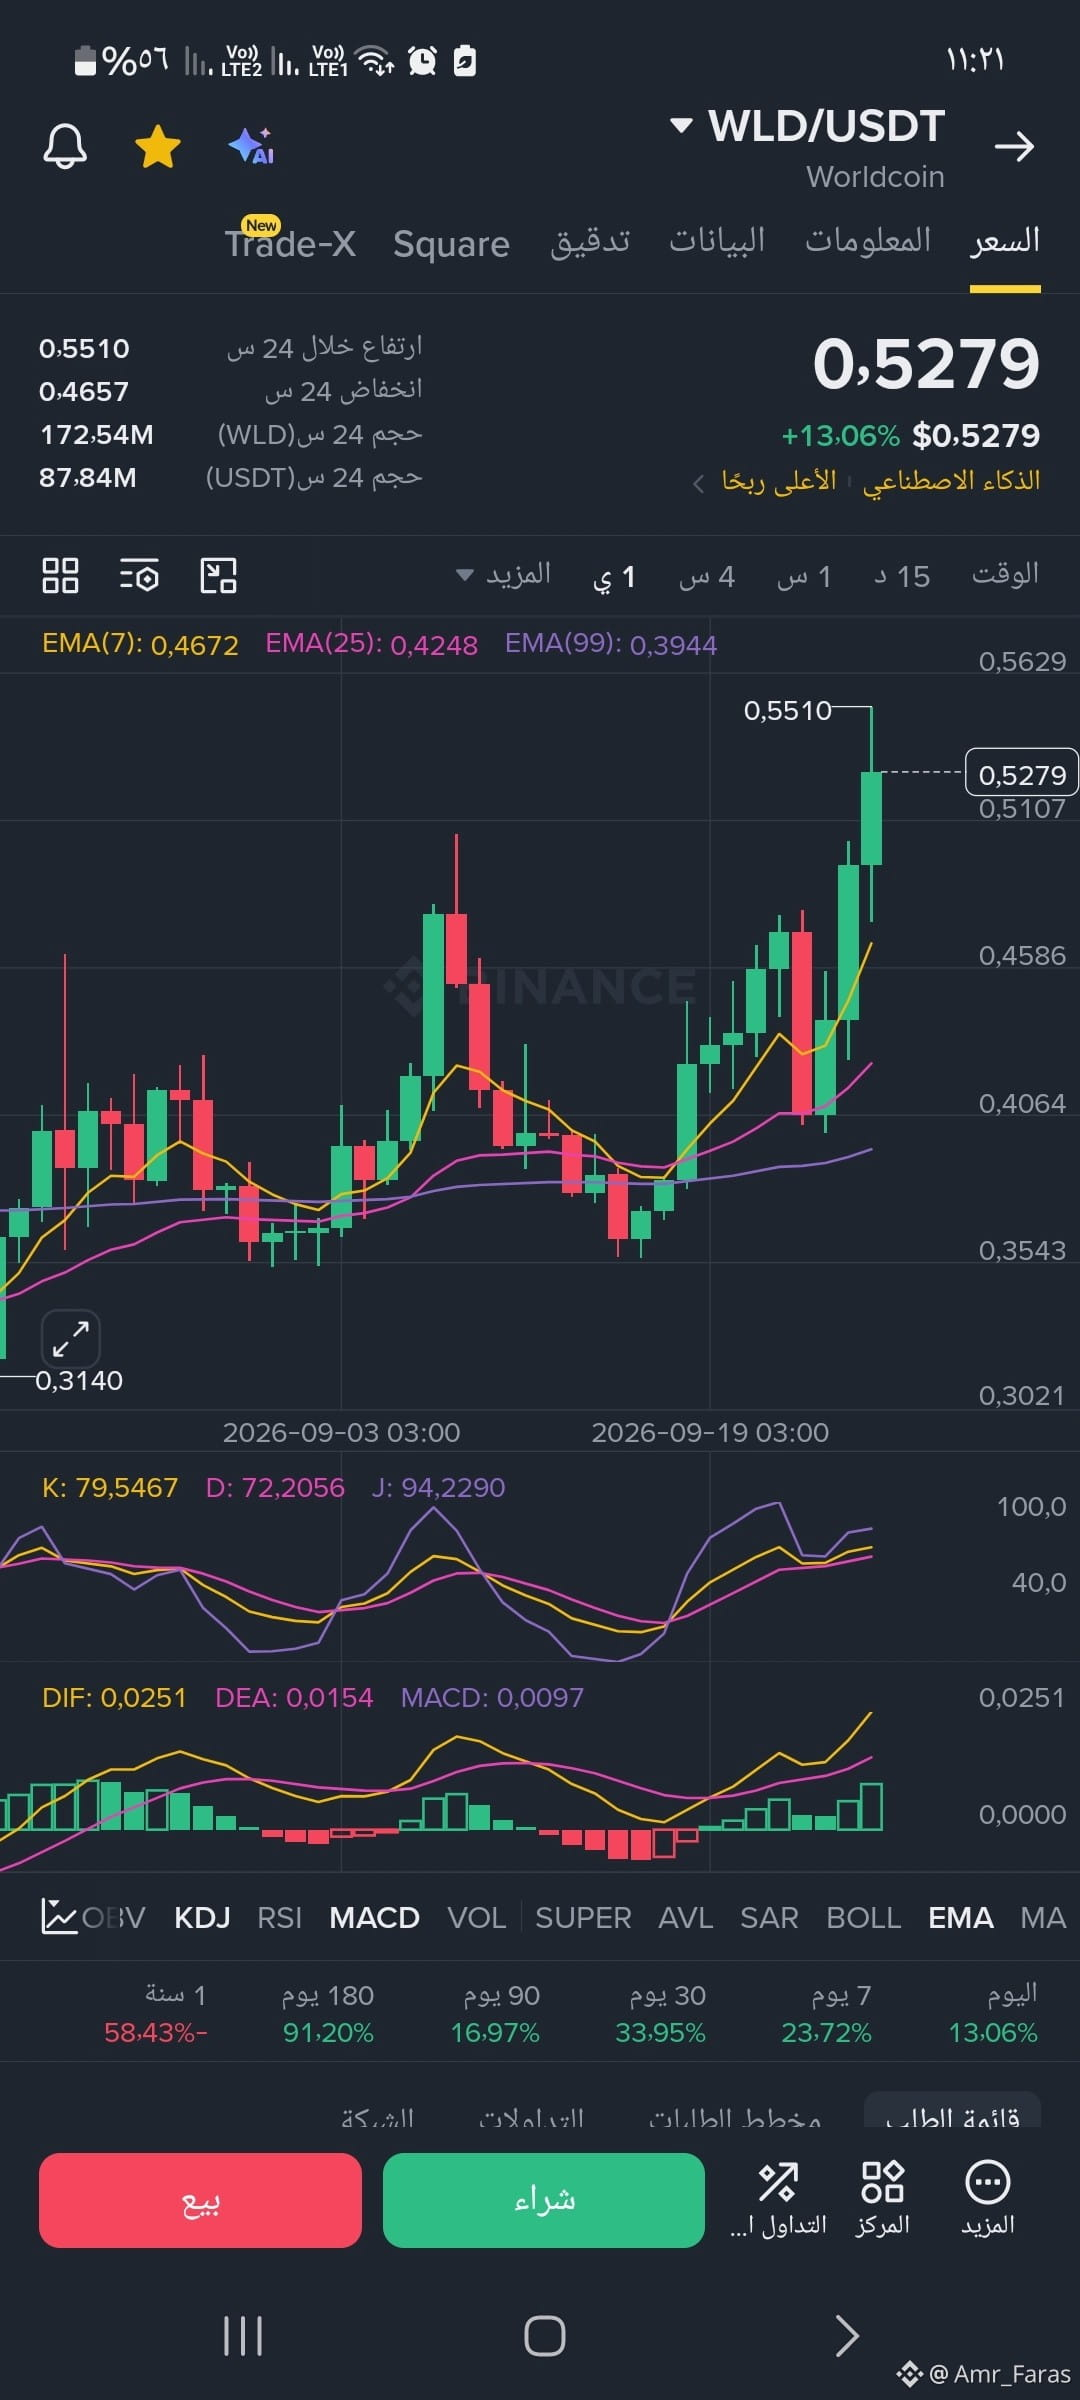
💡 Expected scenariosThe positive scenario (continued upward movement): If the price manages to break through the psychological and structural resistance level at 0.5510 and momentum remains strong, it could open the door to higher levels around 0.5629.The negative scenario (correction): Given the overbought conditions on the indicators, we may see quick profit-taking operations that lead the price to fall to retest nearby support areas (such as the 0.5100 zone or EMA levels around 0.4670).
#WLD
💡 Expected scenariosThe positive scenario (continued upward movement): If the price manages to break through the psychological and structural resistance level at 0.5510 and momentum remains strong, it could open the door to higher levels around 0.5629.The negative scenario (correction): Given the overbought conditions on the indicators, we may see quick profit-taking operations that lead the price to fall to retest nearby support areas (such as the 0.5100 zone or EMA levels around 0.4670).
💡 Expected scenariosThe positive scenario (continued upward movement): If the price manages to break through the psychological and structural resistance level at 0.5510 and momentum remains strong, it could open the door to higher levels around 0.5629.The negative scenario (correction): Given the overbought conditions on the indicators, we may see quick profit-taking operations that lead the price to fall to retest nearby support areas (such as the 0.5100 zone or EMA levels around 0.4670).
2
400
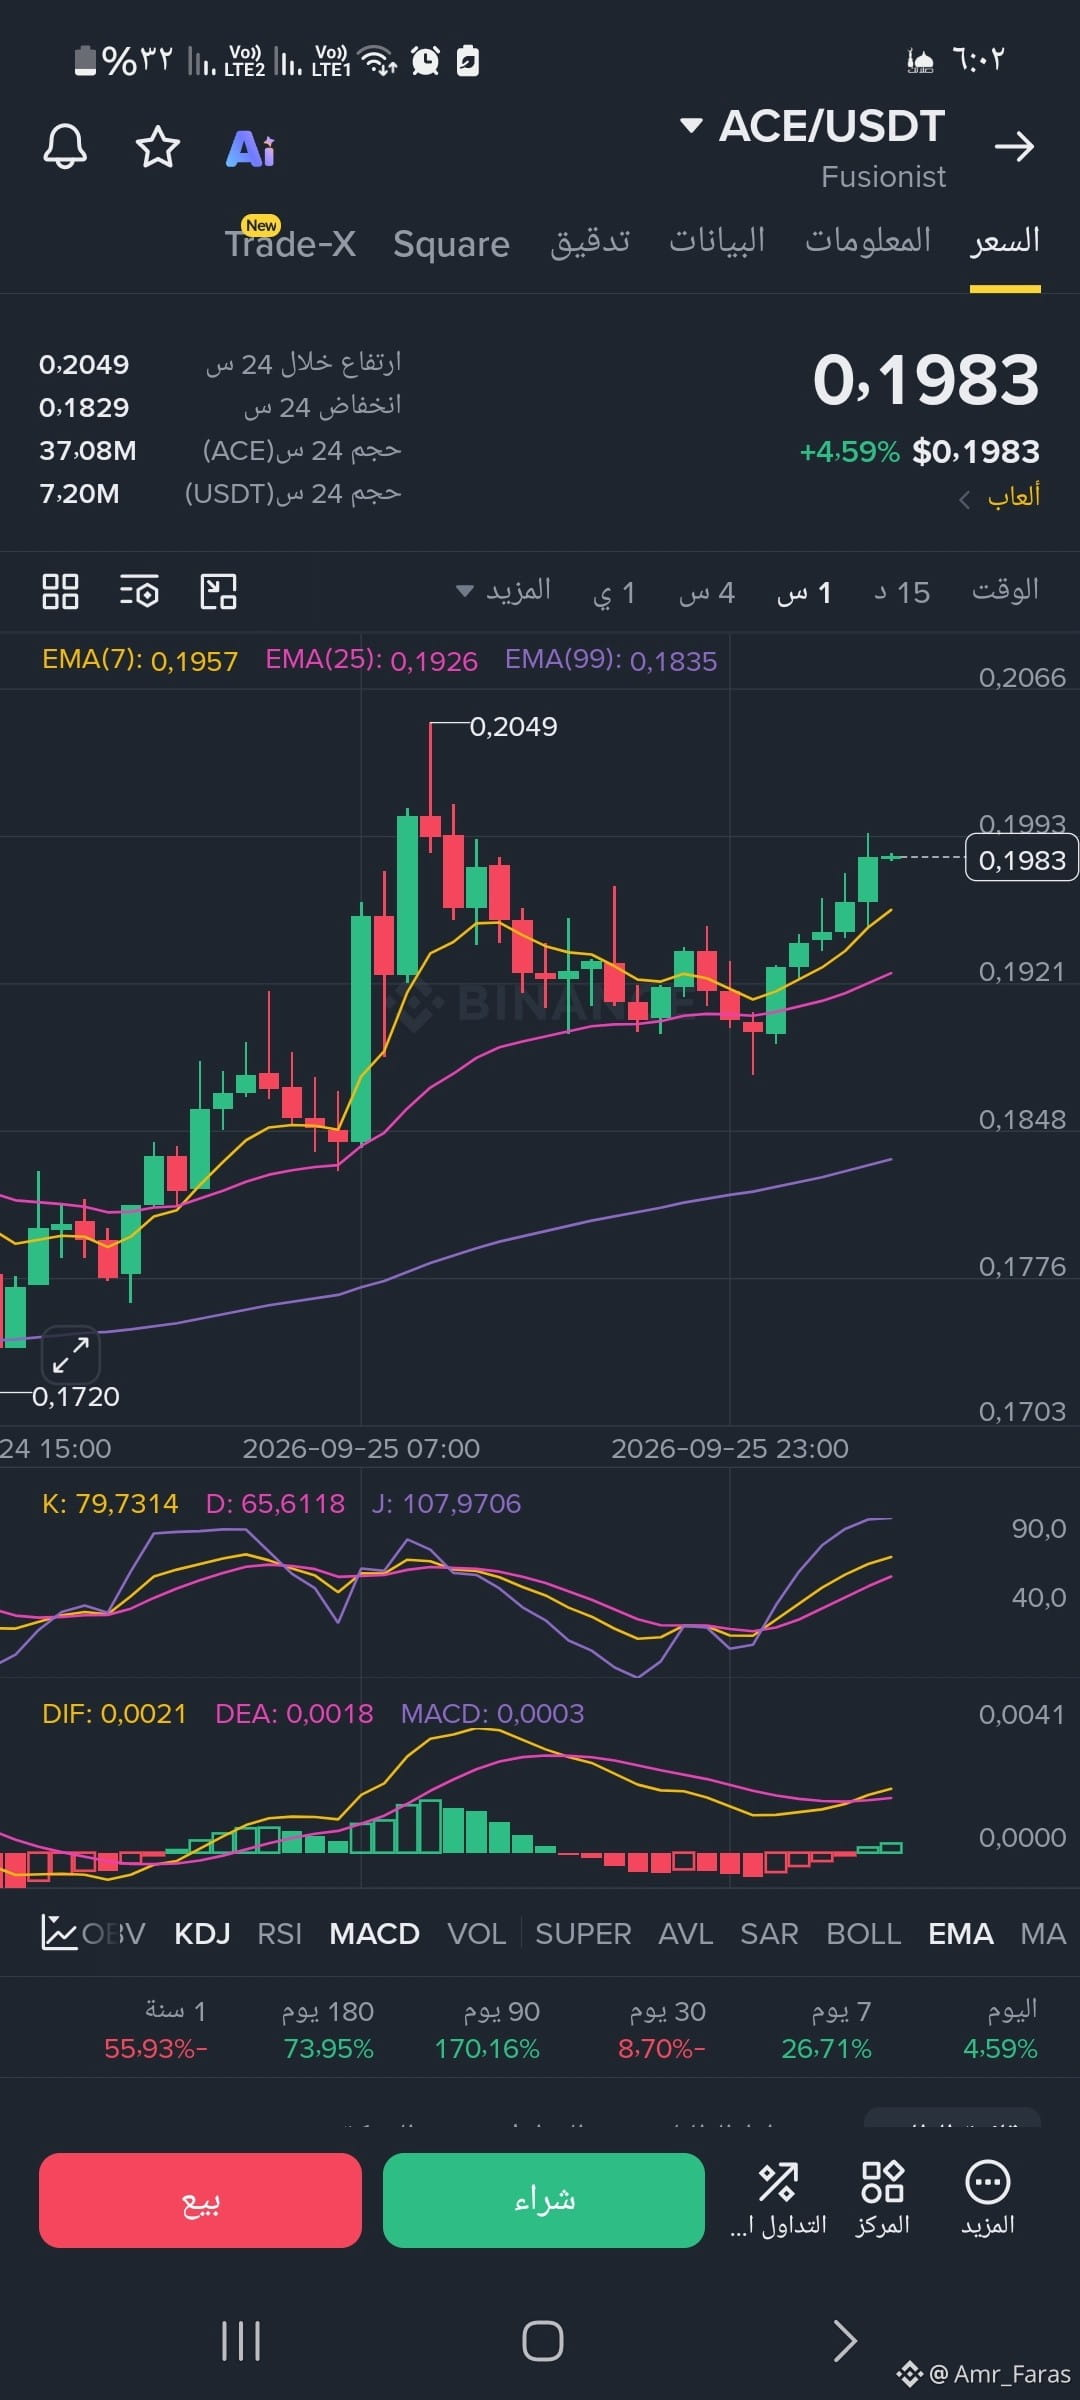
#ACE🔥🔥
💡 Summary and Technical RecommendationThe chart is positive at the moment and supports an upward move, but entering directly from the current prices involves risk due to the temporary overbought signal from the KDJ indicator.⚠️ Best scenarios for a short-term trader:Wait for a clear breakout and stability above the resistance level of 0.2000 with strong trading volume to enter, targeting 0.2049.Wait for a slight pullback and test support areas near 0.1950 or 0.1920 to buy the rebound, always placing a Stop Loss order below the nearest support levels to ensure strict capital management.
#ACE🔥🔥
💡 Summary and Technical RecommendationThe chart is positive at the moment and supports an upward move, but entering directly from the current prices involves risk due to the temporary overbought signal from the KDJ indicator.⚠️ Best scenarios for a short-term trader:Wait for a clear breakout and stability above the resistance level of 0.2000 with strong trading volume to enter, targeting 0.2049.Wait for a slight pullback and test support areas near 0.1950 or 0.1920 to buy the rebound, always placing a Stop Loss order below the nearest support levels to ensure strict capital management.
💡 Summary and Technical RecommendationThe chart is positive at the moment and supports an upward move, but entering directly from the current prices involves risk due to the temporary overbought signal from the KDJ indicator.⚠️ Best scenarios for a short-term trader:Wait for a clear breakout and stability above the resistance level of 0.2000 with strong trading volume to enter, targeting 0.2049.Wait for a slight pullback and test support areas near 0.1950 or 0.1920 to buy the rebound, always placing a Stop Loss order below the nearest support levels to ensure strict capital management.
1
323
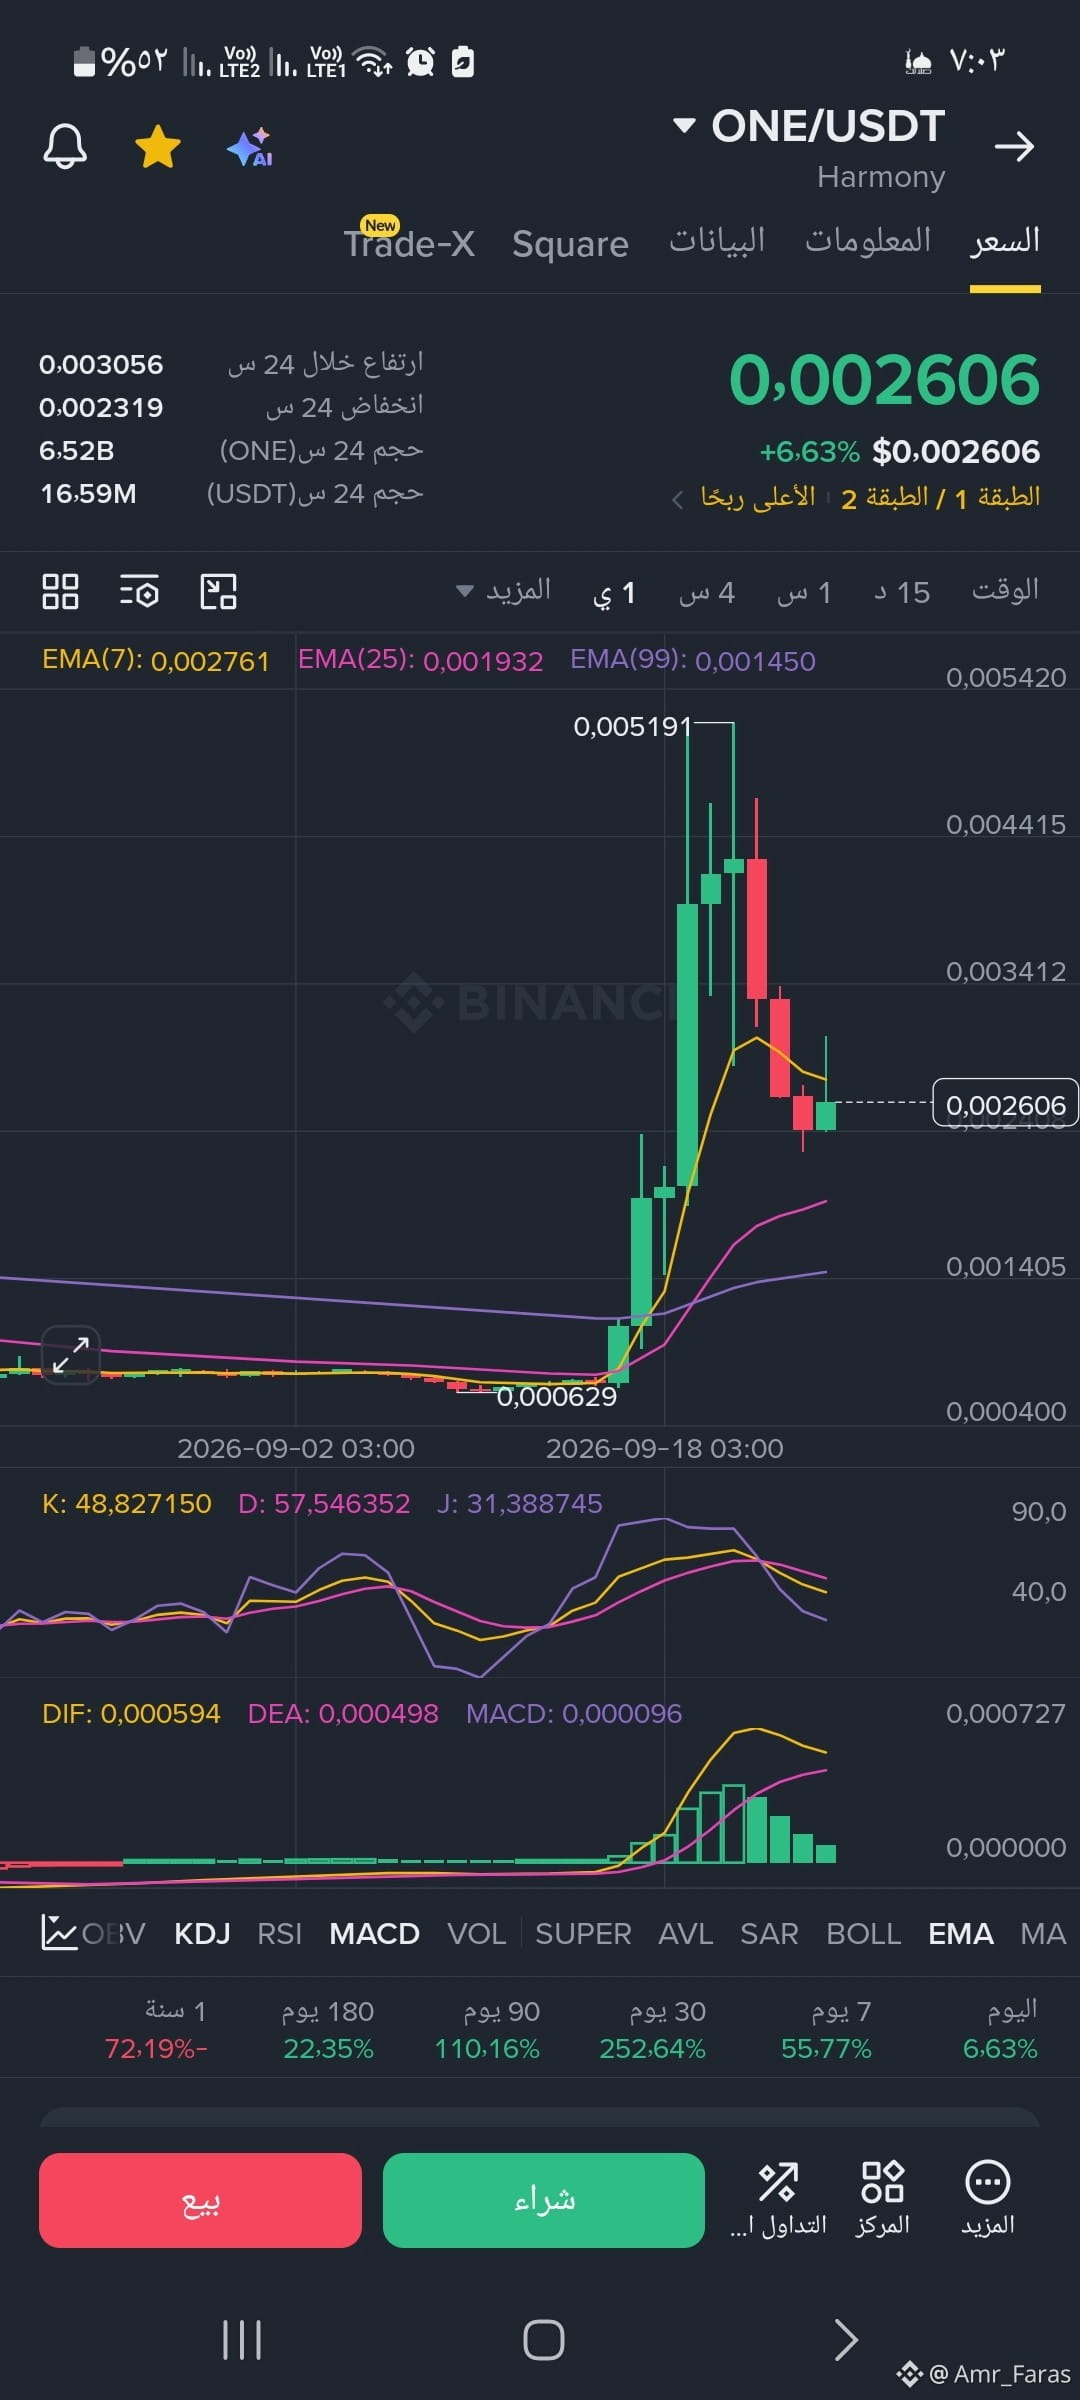
#ONE/USDT
📊 Technical analysis of the current indicators📌 Price movement and Japanese candlesticks: The price recently saw a strong upward wave, pushing toward the visible peak at $0.005191. After touching this peak, the price entered a phase of sharp downward correction, represented by consecutive red candlesticks. It is currently stabilizing at the $0.002606 level.📌 Exponential Moving Averages (EMA): EMA(7) in yellow: at $0.002761. EMA(25) in purple: at $0.001932. EMA(99) in violet: at $0.001450. The current price is trading just below the EMA(7) line, but it is still above EMA(25) and EMA(99). This indicates a short-term correction, while the overall long-term trend continues to hold its key supports.📌 MACD indicator (Moving Average Convergence Divergence): DIF line at 0.000594 and DEA line at 0.000498. The histogram bar shows a decrease in bullish momentum (the green lines are getting shorter), reflecting temporarily weaker buying power and increased selling pressure during the recent period.
#ONE/USDT
📊 Technical analysis of the current indicators📌 Price movement and Japanese candlesticks: The price recently saw a strong upward wave, pushing toward the visible peak at $0.005191. After touching this peak, the price entered a phase of sharp downward correction, represented by consecutive red candlesticks. It is currently stabilizing at the $0.002606 level.📌 Exponential Moving Averages (EMA): EMA(7) in yellow: at $0.002761. EMA(25) in purple: at $0.001932. EMA(99) in violet: at $0.001450. The current price is trading just below the EMA(7) line, but it is still above EMA(25) and EMA(99). This indicates a short-term correction, while the overall long-term trend continues to hold its key supports.📌 MACD indicator (Moving Average Convergence Divergence): DIF line at 0.000594 and DEA line at 0.000498. The histogram bar shows a decrease in bullish momentum (the green lines are getting shorter), reflecting temporarily weaker buying power and increased selling pressure during the recent period.
📊 Technical analysis of the current indicators📌 Price movement and Japanese candlesticks: The price recently saw a strong upward wave, pushing toward the visible peak at $0.005191. After touching this peak, the price entered a phase of sharp downward correction, represented by consecutive red candlesticks. It is currently stabilizing at the $0.002606 level.📌 Exponential Moving Averages (EMA): EMA(7) in yellow: at $0.002761. EMA(25) in purple: at $0.001932. EMA(99) in violet: at $0.001450. The current price is trading just below the EMA(7) line, but it is still above EMA(25) and EMA(99). This indicates a short-term correction, while the overall long-term trend continues to hold its key supports.📌 MACD indicator (Moving Average Convergence Divergence): DIF line at 0.000594 and DEA line at 0.000498. The histogram bar shows a decrease in bullish momentum (the green lines are getting shorter), reflecting temporarily weaker buying power and increased selling pressure during the recent period.
2
2k
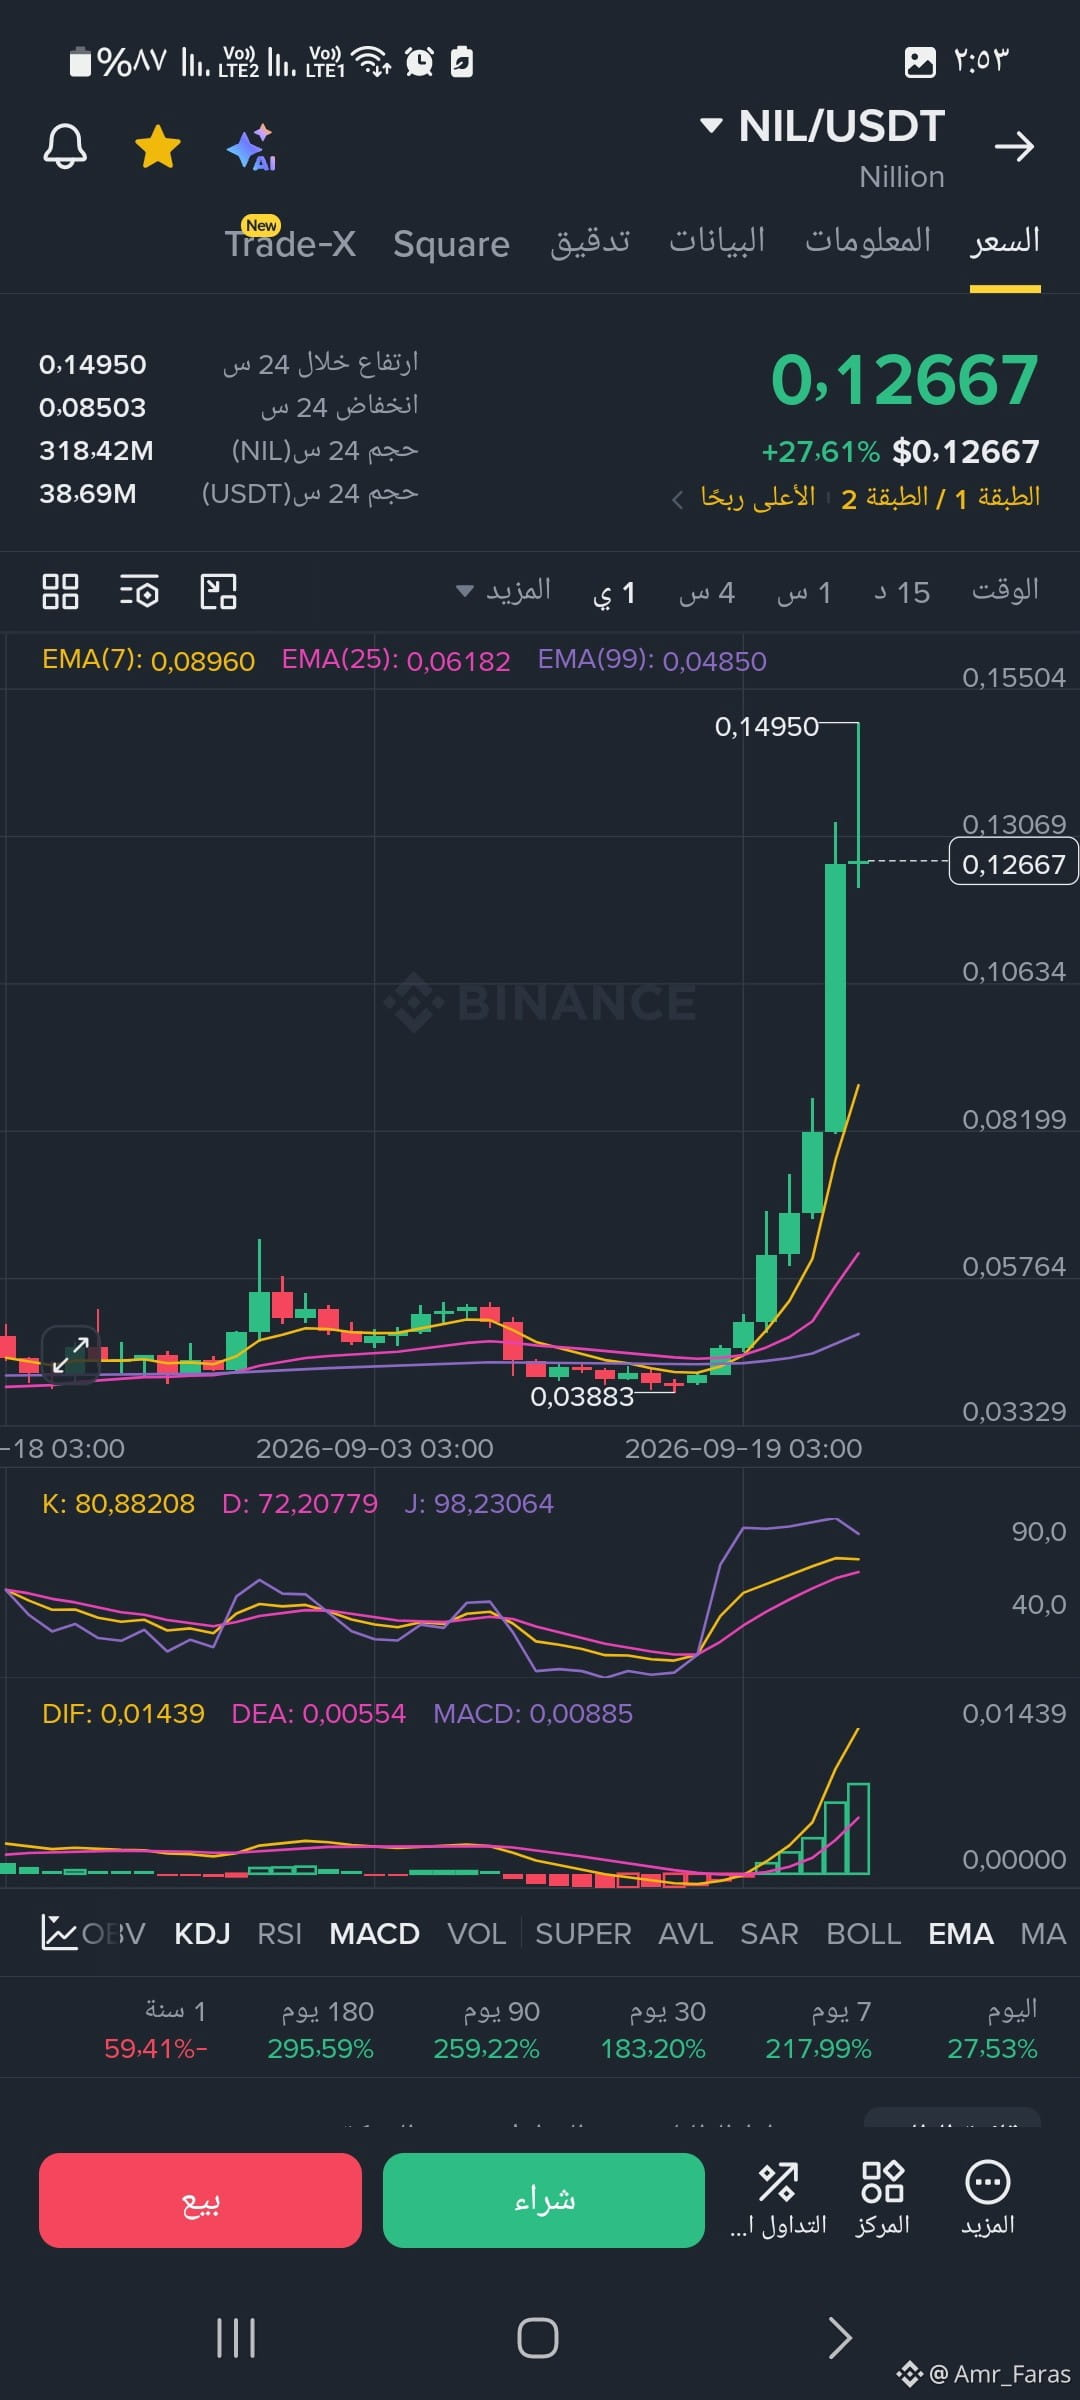
#NIL
Exponential Moving Averages (EMA): The current price is trading at a significant premium above the EMA moving averages: EMA(7) at 0.08960, EMA(25) at 0.06182, and EMA(99) at 0.04850. This ascending arrangement of the moving averages confirms a strong bullish momentum in the short to medium term.
MACD Indicator: The indicator shows a positive bullish crossover, with the green histogram bars growing, reflecting increased inflow of buying liquidity and current momentum.
KDJ Indicator: The indicator is in high zones (overbought area), where the readings approach the 90 and 98 levels, which calls for caution regarding the possibility of a temporary price correction or profit-taking.
#NIL
Exponential Moving Averages (EMA): The current price is trading at a significant premium above the EMA moving averages: EMA(7) at 0.08960, EMA(25) at 0.06182, and EMA(99) at 0.04850. This ascending arrangement of the moving averages confirms a strong bullish momentum in the short to medium term.
MACD Indicator: The indicator shows a positive bullish crossover, with the green histogram bars growing, reflecting increased inflow of buying liquidity and current momentum.
KDJ Indicator: The indicator is in high zones (overbought area), where the readings approach the 90 and 98 levels, which calls for caution regarding the possibility of a temporary price correction or profit-taking.
Exponential Moving Averages (EMA): The current price is trading at a significant premium above the EMA moving averages: EMA(7) at 0.08960, EMA(25) at 0.06182, and EMA(99) at 0.04850. This ascending arrangement of the moving averages confirms a strong bullish momentum in the short to medium term.
MACD Indicator: The indicator shows a positive bullish crossover, with the green histogram bars growing, reflecting increased inflow of buying liquidity and current momentum.
KDJ Indicator: The indicator is in high zones (overbought area), where the readings approach the 90 and 98 levels, which calls for caution regarding the possibility of a temporary price correction or profit-taking.
1
145
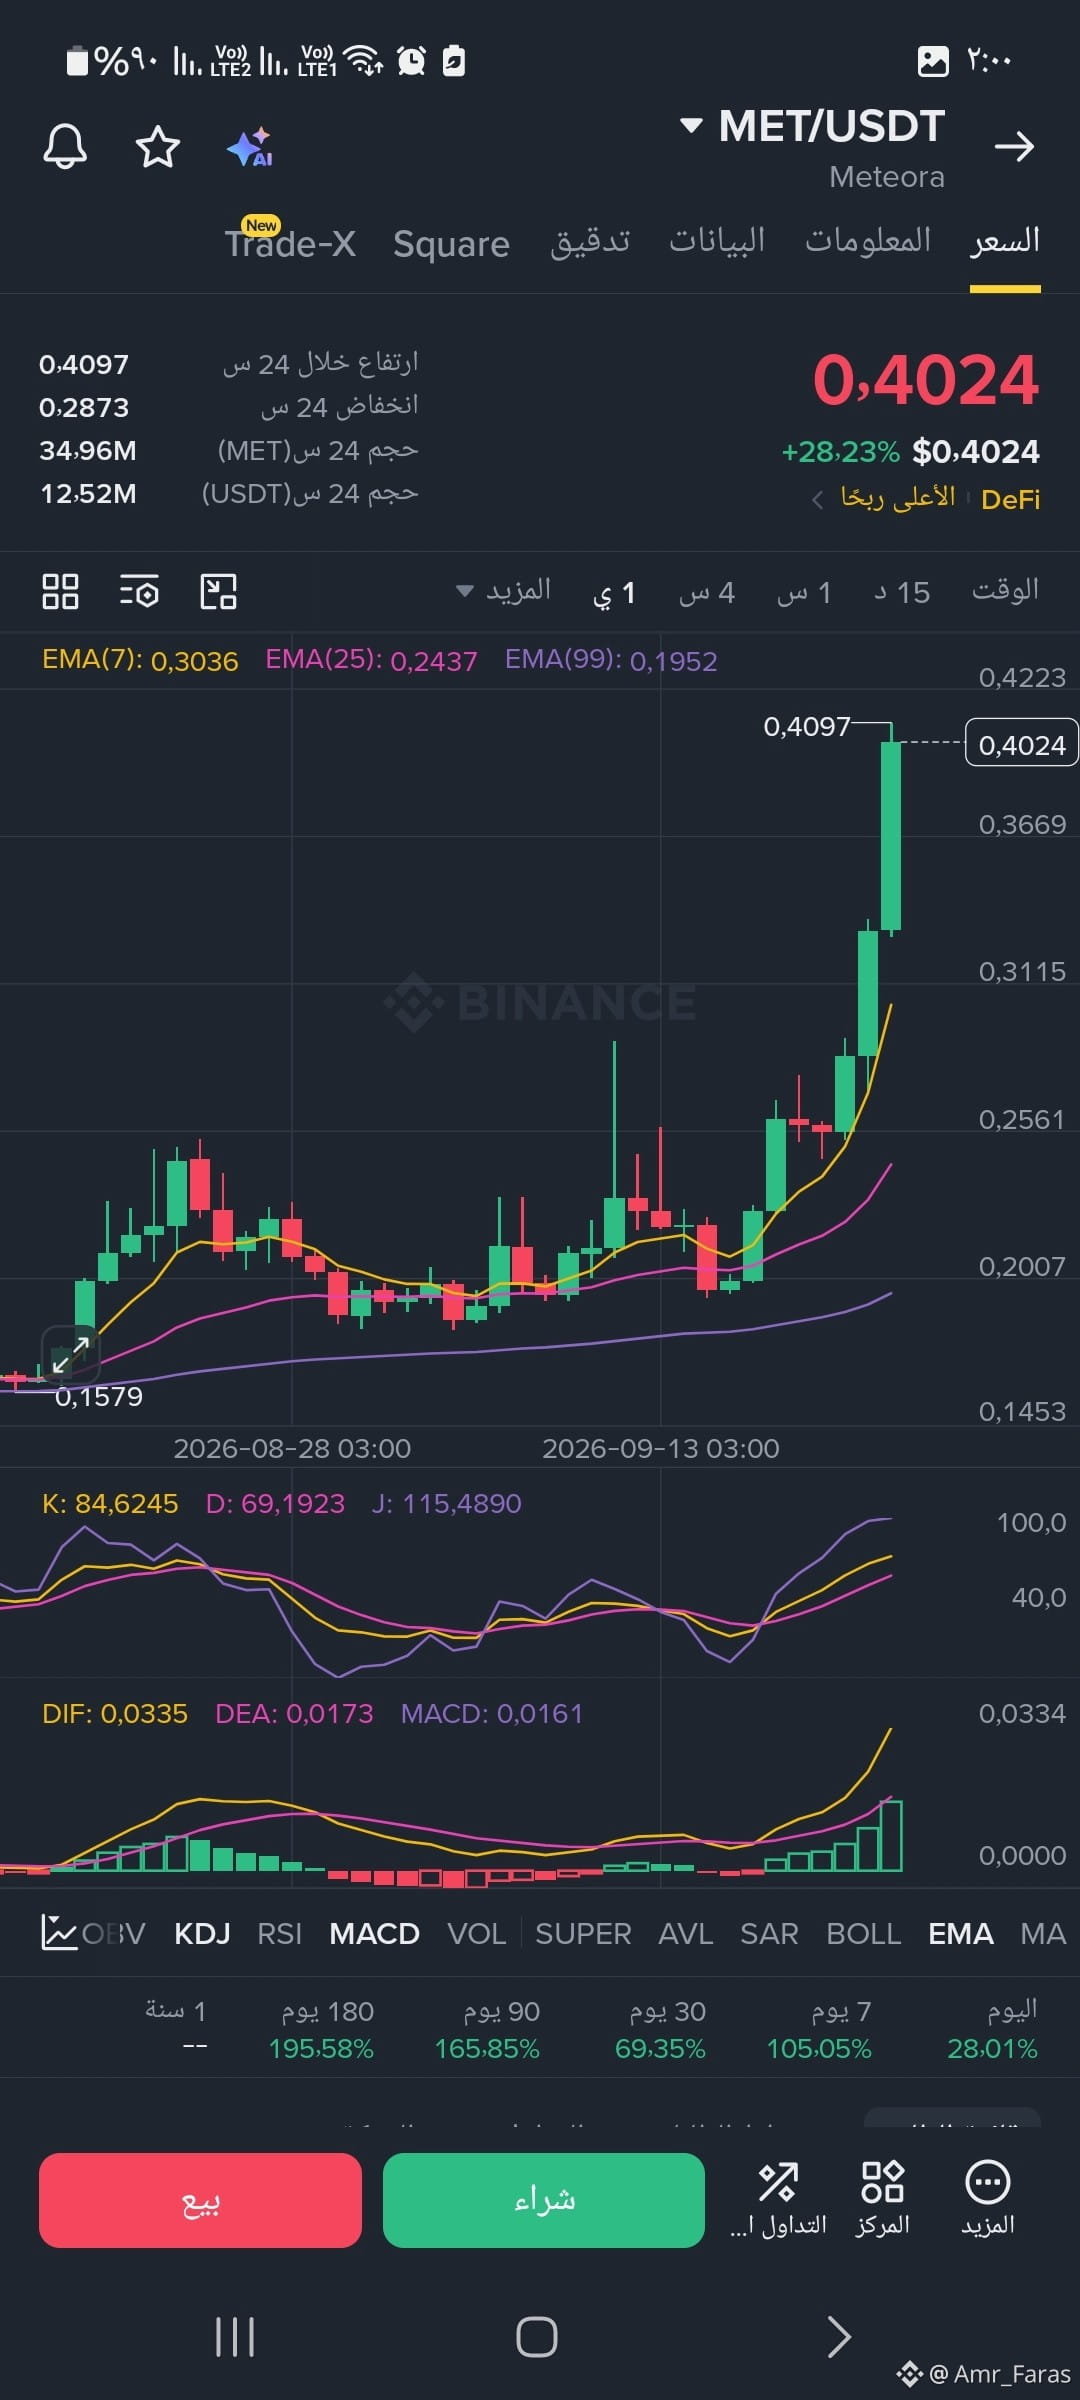
#metaverseminer Proposed Implementation Plan and Technical ObjectivesThe smart work plan is based on dividing future objectives to protect profits and avoid sudden reversals:🎯 Very short term (rapid trading objectives): If the current momentum continues without correction, the price looks to test the last high at 0.41$ and surge toward the 0.44$ levels.🎯 Medium term (trend confirmation): Stabilizing above the 0.40$ levels opens the door technically to exploring new price zones that may reach 0.50$.⚠️ Stop Loss level to protect capital: Closing a full daily candle below the main support levels at 0.24$ is a negative signal that requires immediate exit to stop the capital bleed.
#metaverseminer Proposed Implementation Plan and Technical ObjectivesThe smart work plan is based on dividing future objectives to protect profits and avoid sudden reversals:🎯 Very short term (rapid trading objectives): If the current momentum continues without correction, the price looks to test the last high at 0.41$ and surge toward the 0.44$ levels.🎯 Medium term (trend confirmation): Stabilizing above the 0.40$ levels opens the door technically to exploring new price zones that may reach 0.50$.⚠️ Stop Loss level to protect capital: Closing a full daily candle below the main support levels at 0.24$ is a negative signal that requires immediate exit to stop the capital bleed.
1
107
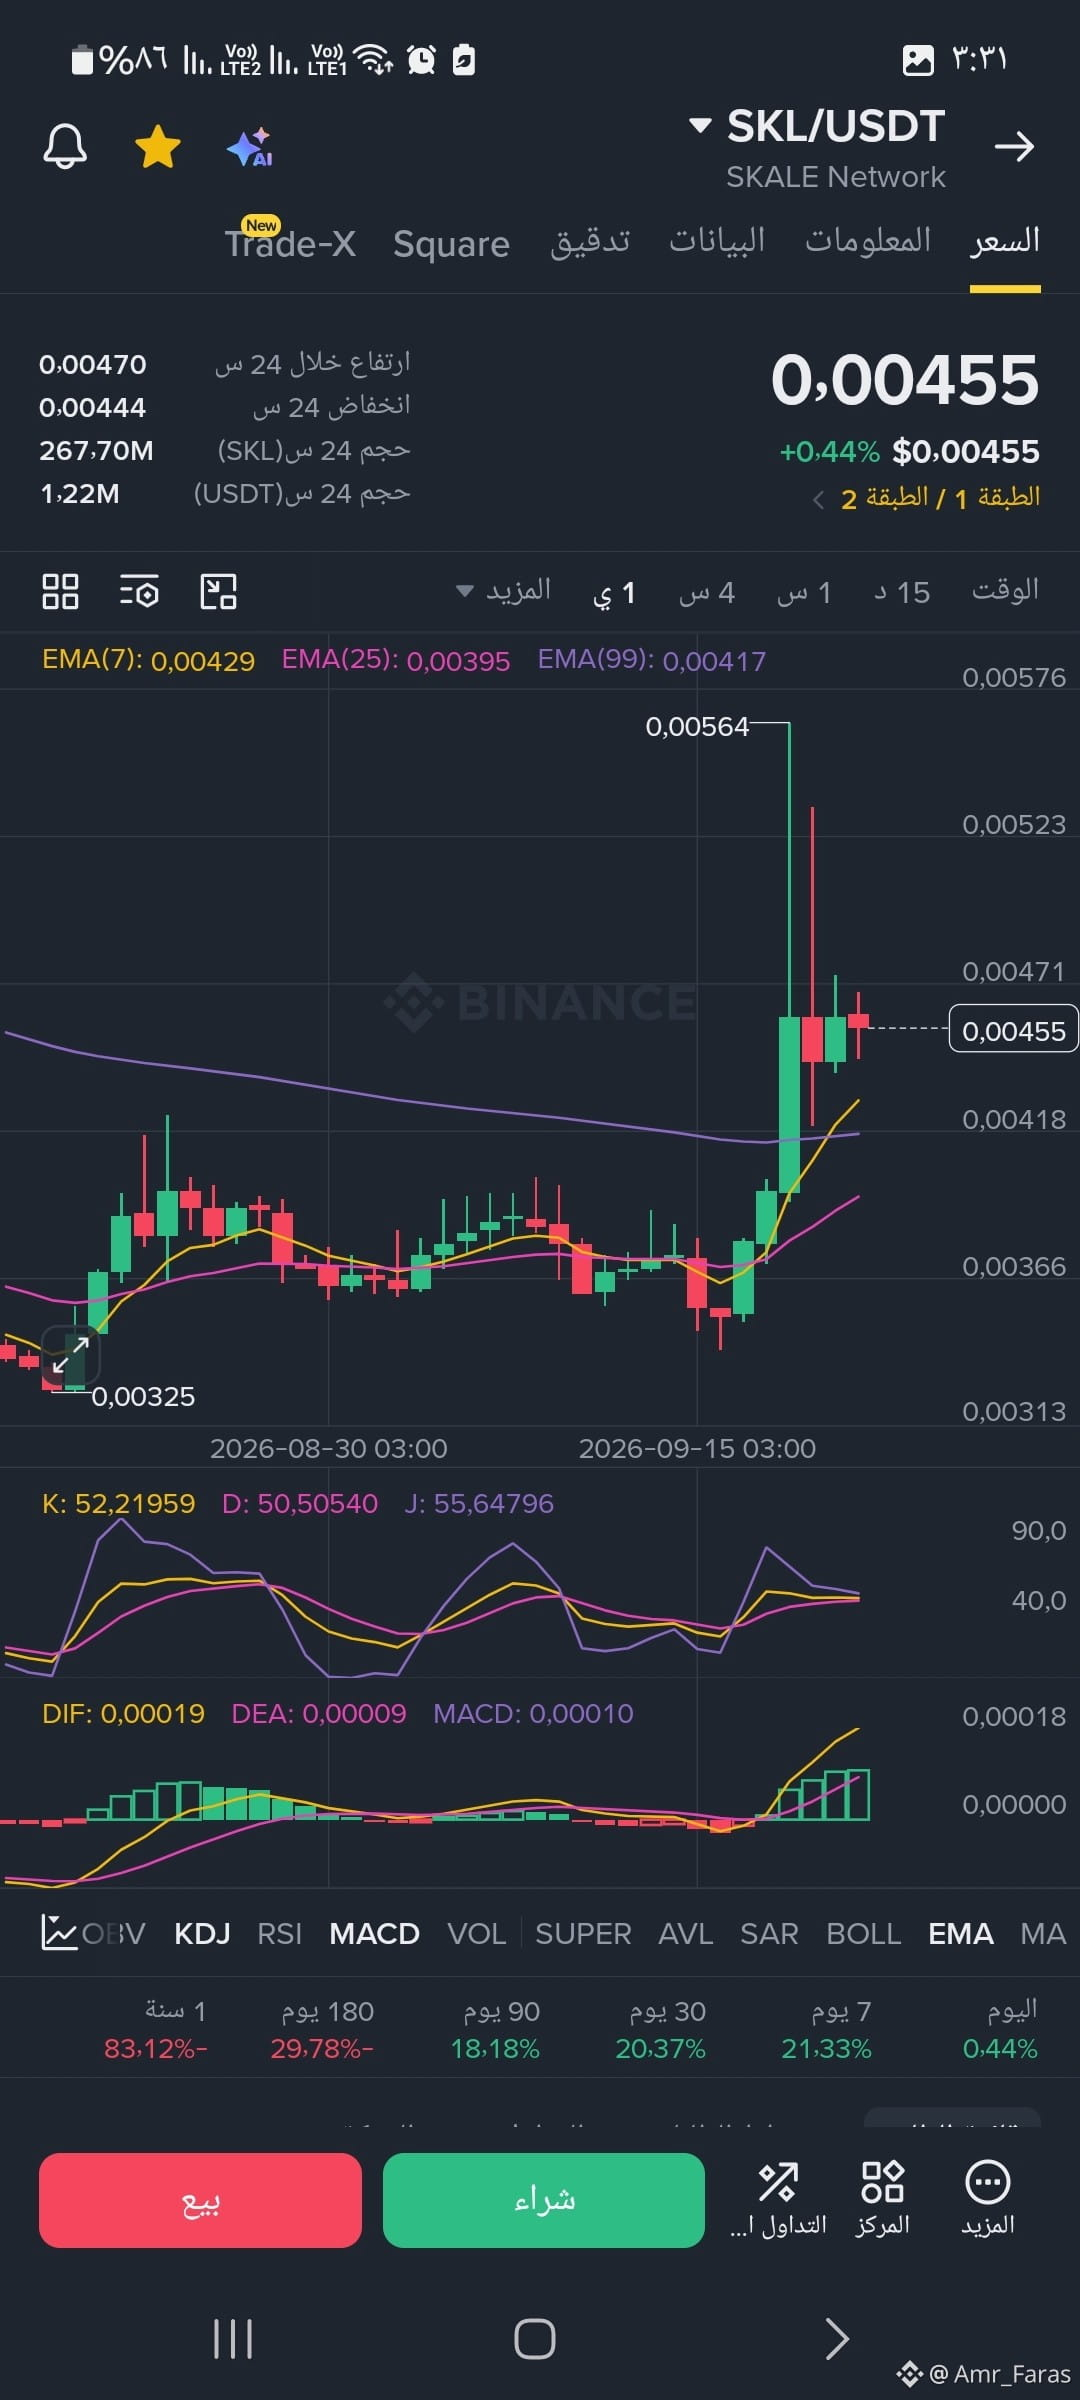
#SKL Study this coin’s neck well. In the coming period
!!!!!! 📋 Proposed Execution Plan (Two Purchase Scenarios):
Since the price has pulled back slightly from the temporary peak, you can split your entry as follows:
First Entry (Buy on Correction): Place a buy order near the EMA(7) midline—around the 0.00430 - 0.00425 USDT levels.
Second Entry (Buy the Breakout): If the price does not drop and breaks above the last high of 0.00564 USDT with a real candle, you can ride the new upward wave.
🎯 Set Targets and Stop Loss (Mandatory):
📊 First Target: 0.00560 USDT (retesting the previous peak and taking part of the profits).
📈 Second Target: 0.00680 - 0.00720 USDT (the next resistance levels on higher timeframes).
⚠️ Stop Loss: Close below the 0.00390 USDT level (breaking the EMA 25 and EMA 99 averages will completely end this wave and protect your capital from getting trapped).
#SKL Study this coin’s neck well. In the coming period
!!!!!! 📋 Proposed Execution Plan (Two Purchase Scenarios):
Since the price has pulled back slightly from the temporary peak, you can split your entry as follows:
First Entry (Buy on Correction): Place a buy order near the EMA(7) midline—around the 0.00430 - 0.00425 USDT levels.
Second Entry (Buy the Breakout): If the price does not drop and breaks above the last high of 0.00564 USDT with a real candle, you can ride the new upward wave.
🎯 Set Targets and Stop Loss (Mandatory):
📊 First Target: 0.00560 USDT (retesting the previous peak and taking part of the profits).
📈 Second Target: 0.00680 - 0.00720 USDT (the next resistance levels on higher timeframes).
⚠️ Stop Loss: Close below the 0.00390 USDT level (breaking the EMA 25 and EMA 99 averages will completely end this wave and protect your capital from getting trapped).
!!!!!! 📋 Proposed Execution Plan (Two Purchase Scenarios):
Since the price has pulled back slightly from the temporary peak, you can split your entry as follows:
First Entry (Buy on Correction): Place a buy order near the EMA(7) midline—around the 0.00430 - 0.00425 USDT levels.
Second Entry (Buy the Breakout): If the price does not drop and breaks above the last high of 0.00564 USDT with a real candle, you can ride the new upward wave.
🎯 Set Targets and Stop Loss (Mandatory):
📊 First Target: 0.00560 USDT (retesting the previous peak and taking part of the profits).
📈 Second Target: 0.00680 - 0.00720 USDT (the next resistance levels on higher timeframes).
⚠️ Stop Loss: Close below the 0.00390 USDT level (breaking the EMA 25 and EMA 99 averages will completely end this wave and protect your capital from getting trapped).
3
181
#Fetch_ai
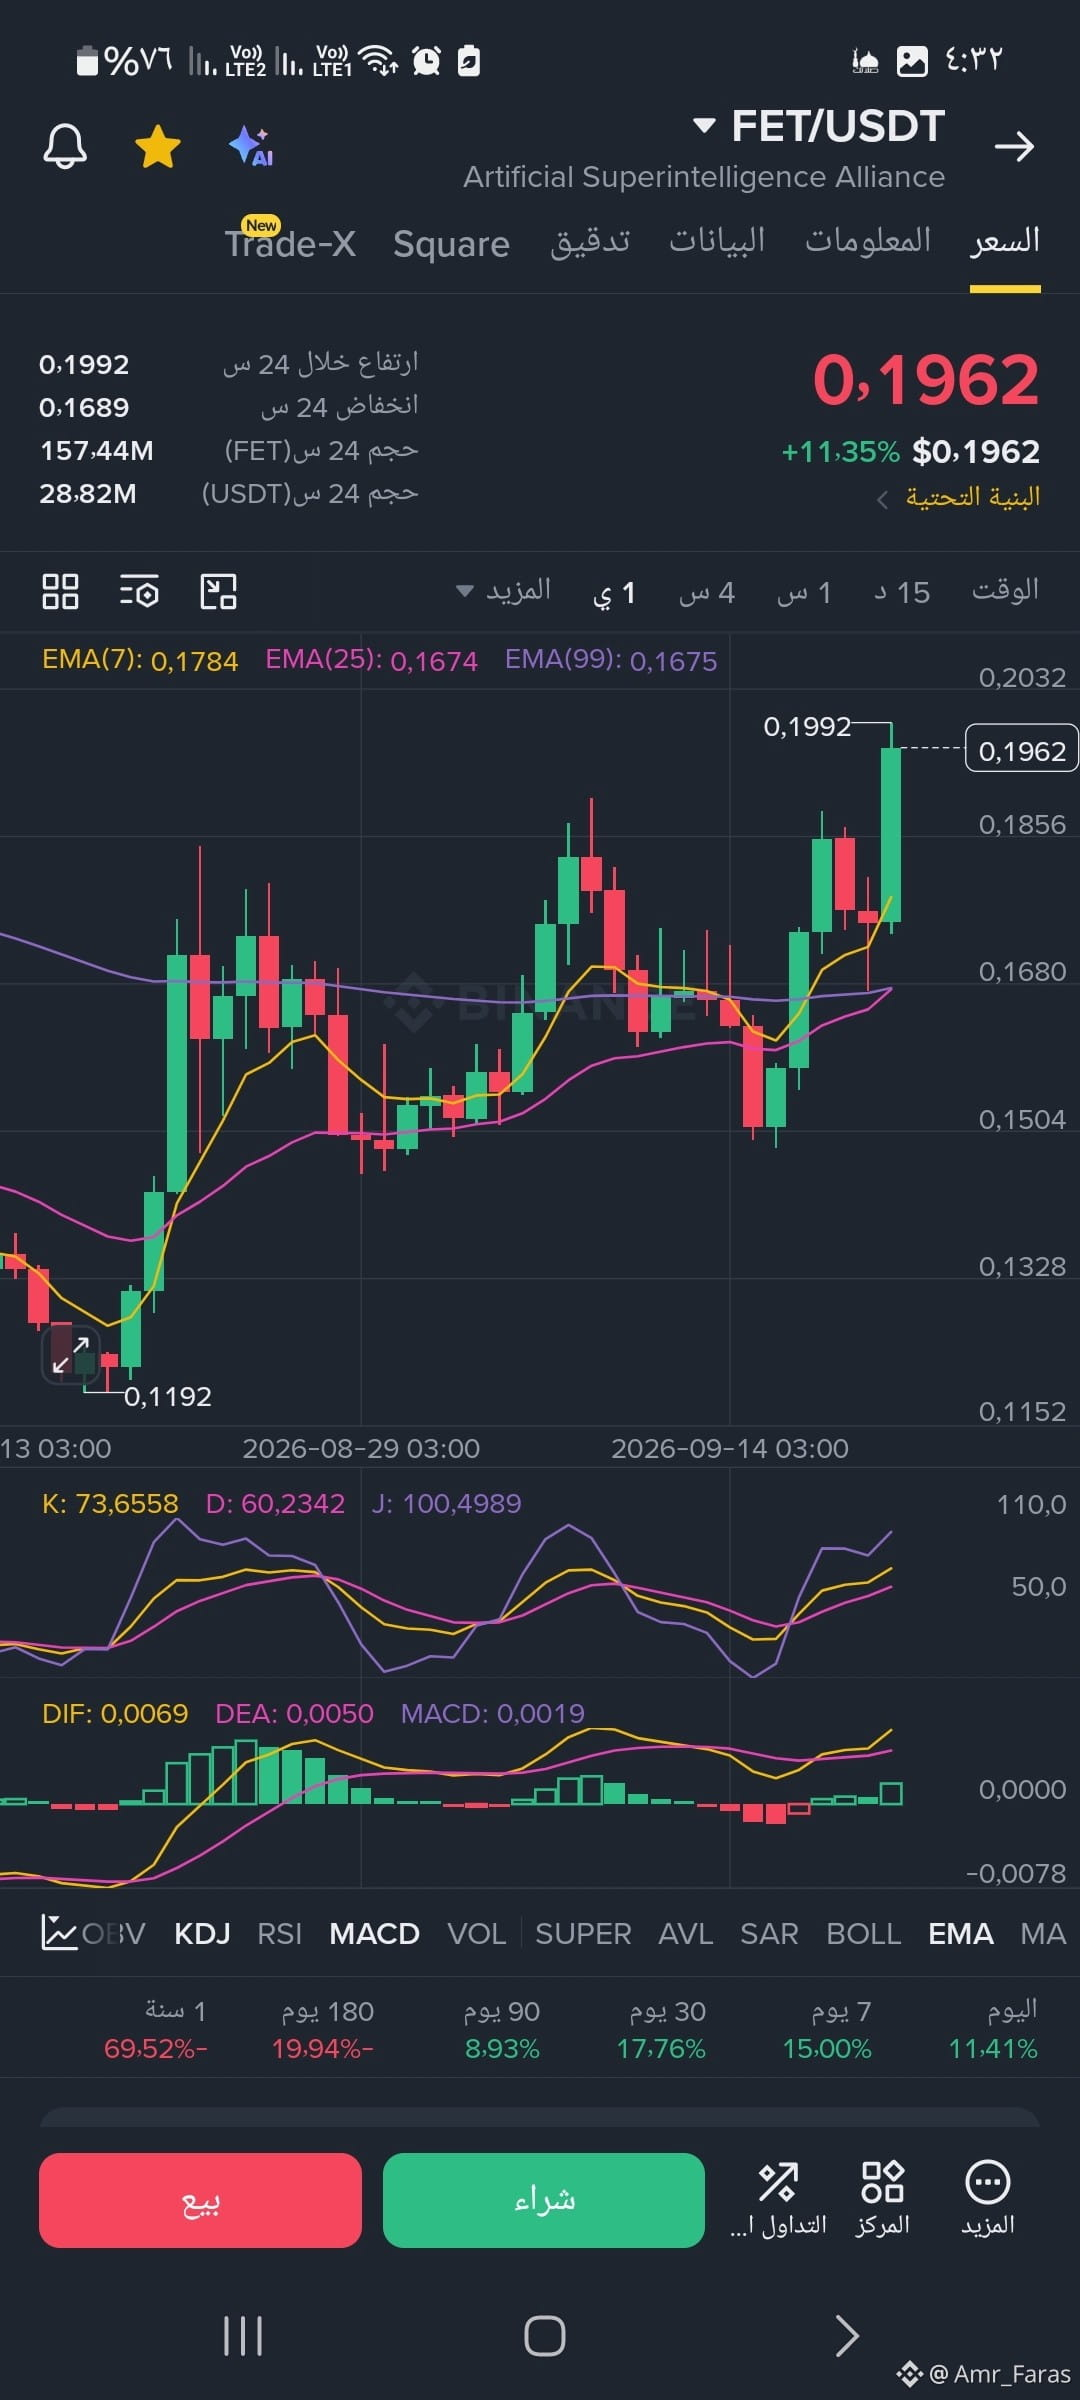
...Exponential Moving Averages (EMA)Positive Setup: The EMA(7) line, shown in yellow, is at the 0.1784 level and is trading above the EMA(25) line at 0.1674 and the EMA(99) line at 0.1675.Technical Significance: This arrangement (the fast average above the slow averages) confirms that buyers are currently in control. As long as the price remains stable above these averages, the uptrend remains intact. The moving-average zones (between 0.1670 and 0.1780) are considered excellent dynamic support areas in case of a pullback
.... Analysis of Momentum and LiquidityThe KDJ indicator (in the middle section):The current readings are very high: K: 73.65, D: 60.23, J: 100.49.Interpretation: The J line reaching the specified value reflects that the price has moved into overbought (Overbought) territory historically, when the J line pushes above the 100 level, it alerts traders to the possibility of a cooldown or corrective pullback due to profit-taking.The MACD indicator (in the lower section):The indicator shows a bullish upward crossover, with the DIF line (0.0069) moving above the DEA line (0.0050).Interpretation: The green histogram bars are moving in the positive zone above the zero line, confirming that buying momentum is still supported by the inflow of liquidity into the currency.
#Fetch_ai
...Exponential Moving Averages (EMA)Positive Setup: The EMA(7) line, shown in yellow, is at the 0.1784 level and is trading above the EMA(25) line at 0.1674 and the EMA(99) line at 0.1675.Technical Significance: This arrangement (the fast average above the slow averages) confirms that buyers are currently in control. As long as the price remains stable above these averages, the uptrend remains intact. The moving-average zones (between 0.1670 and 0.1780) are considered excellent dynamic support areas in case of a pullback
.... Analysis of Momentum and LiquidityThe KDJ indicator (in the middle section):The current readings are very high: K: 73.65, D: 60.23, J: 100.49.Interpretation: The J line reaching the specified value reflects that the price has moved into overbought (Overbought) territory historically, when the J line pushes above the 100 level, it alerts traders to the possibility of a cooldown or corrective pullback due to profit-taking.The MACD indicator (in the lower section):The indicator shows a bullish upward crossover, with the DIF line (0.0069) moving above the DEA line (0.0050).Interpretation: The green histogram bars are moving in the positive zone above the zero line, confirming that buying momentum is still supported by the inflow of liquidity into the currency.
...Exponential Moving Averages (EMA)Positive Setup: The EMA(7) line, shown in yellow, is at the 0.1784 level and is trading above the EMA(25) line at 0.1674 and the EMA(99) line at 0.1675.Technical Significance: This arrangement (the fast average above the slow averages) confirms that buyers are currently in control. As long as the price remains stable above these averages, the uptrend remains intact. The moving-average zones (between 0.1670 and 0.1780) are considered excellent dynamic support areas in case of a pullback
.... Analysis of Momentum and LiquidityThe KDJ indicator (in the middle section):The current readings are very high: K: 73.65, D: 60.23, J: 100.49.Interpretation: The J line reaching the specified value reflects that the price has moved into overbought (Overbought) territory historically, when the J line pushes above the 100 level, it alerts traders to the possibility of a cooldown or corrective pullback due to profit-taking.The MACD indicator (in the lower section):The indicator shows a bullish upward crossover, with the DIF line (0.0069) moving above the DEA line (0.0050).Interpretation: The green histogram bars are moving in the positive zone above the zero line, confirming that buying momentum is still supported by the inflow of liquidity into the currency.
2
418
#PHA
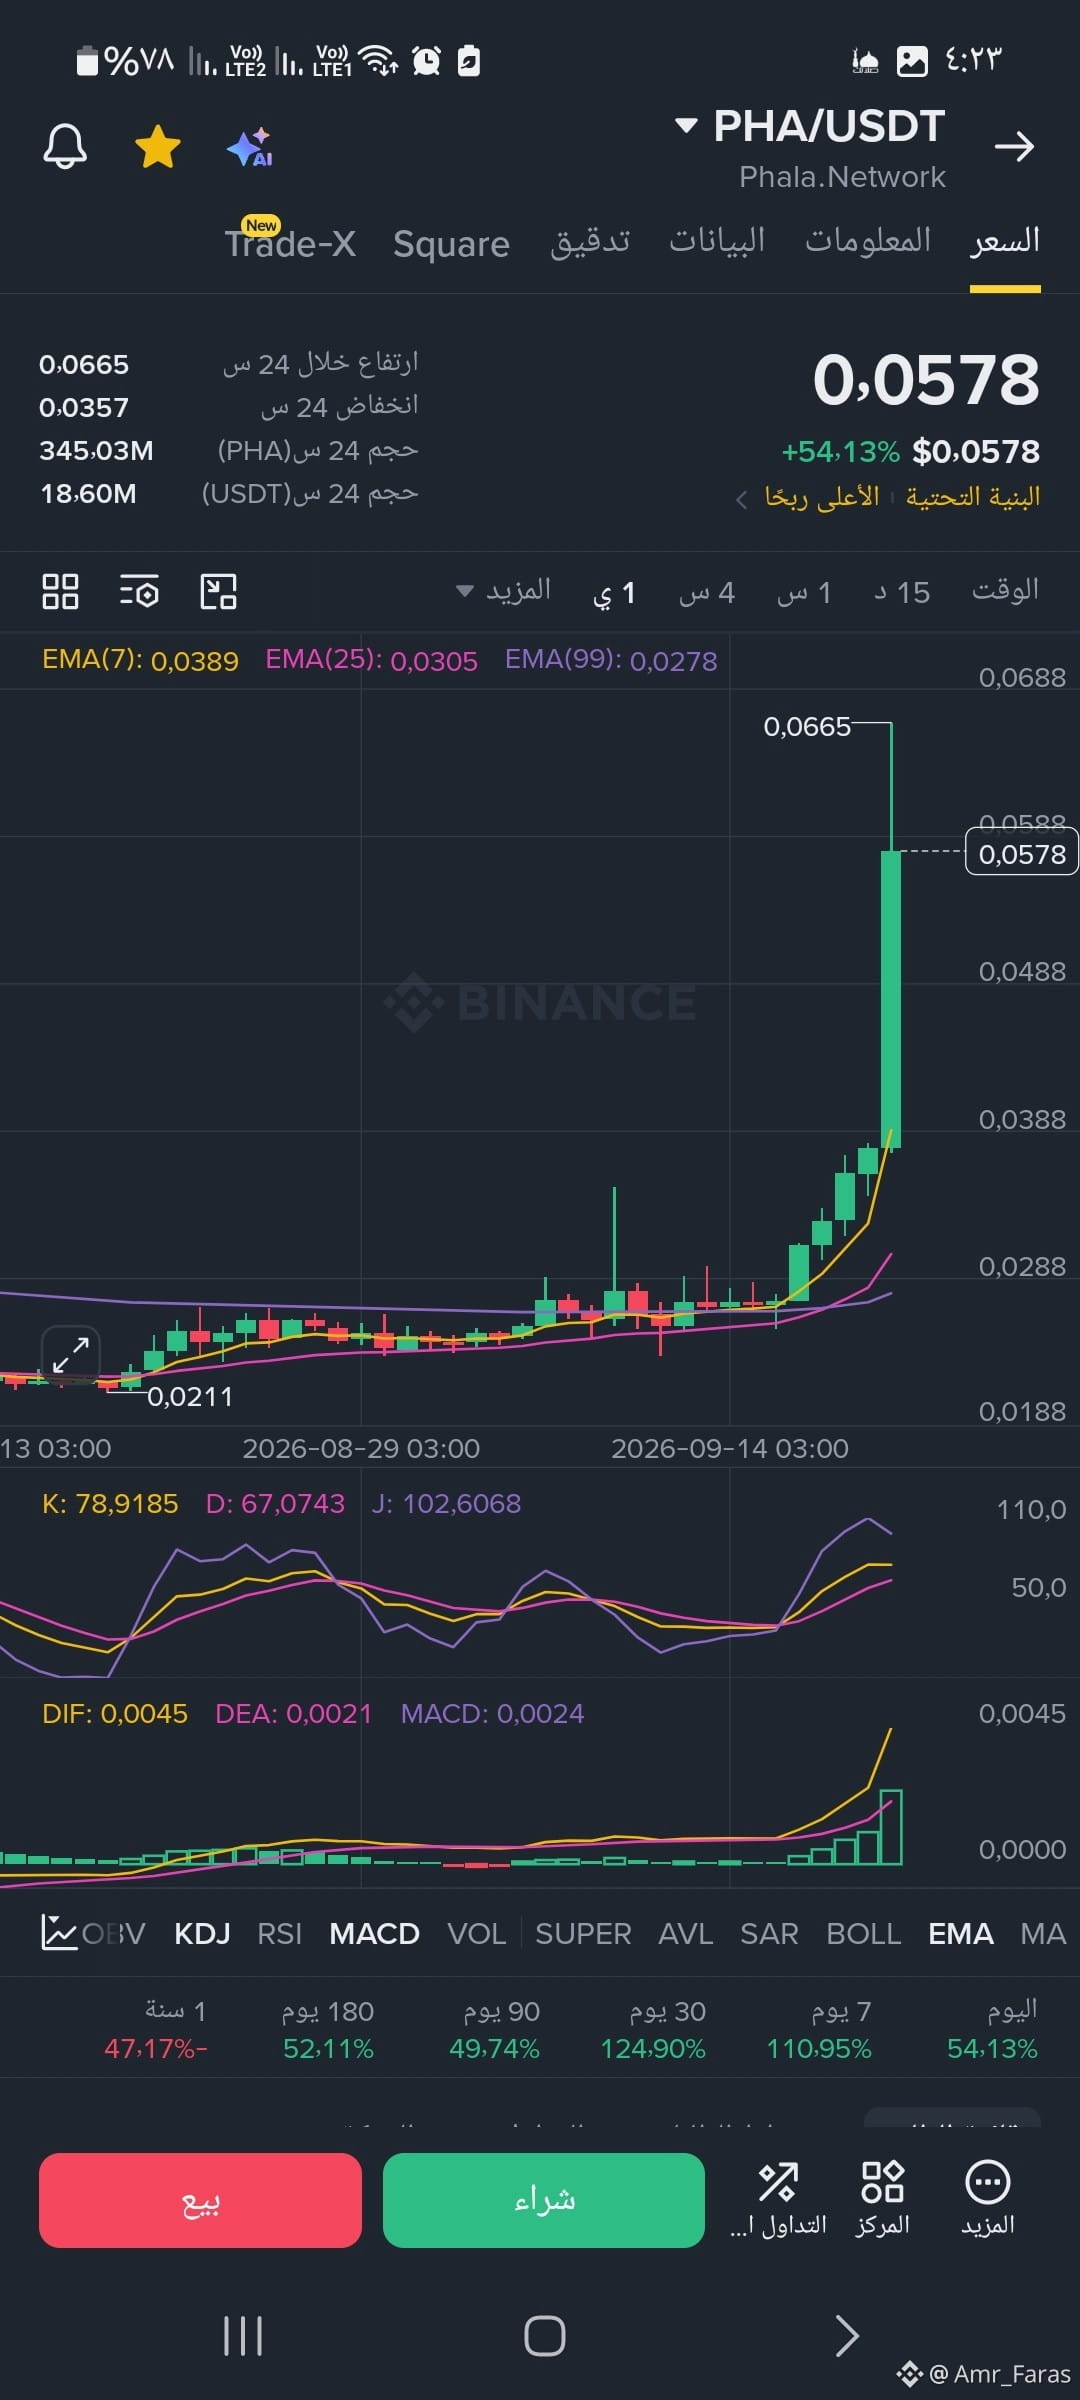
💡 The proposed strategic framework for dealing with this situation: If you are considering making an investment or trading decision based on this move, here is how to evaluate the opportunity in an engineering way to reduce risk: In the case of buying (Buy): Always wait until the price calms down and begins a "retest" of the previously breached support areas (such as nearby prior peak levels around 0.0450 or 0.0380). Buying at the current peak is an unresolved gamble. In the case of selling (Sell / Short): If you are trading futures, trying to "call the top" to open short-selling positions during this violent surge could be destructive to your account; wait for clear signs of weakness or a reversal candle on smaller timeframes (e.g., 15 minutes or 1 hour) before thinking about it.
#PHA
💡 The proposed strategic framework for dealing with this situation: If you are considering making an investment or trading decision based on this move, here is how to evaluate the opportunity in an engineering way to reduce risk: In the case of buying (Buy): Always wait until the price calms down and begins a "retest" of the previously breached support areas (such as nearby prior peak levels around 0.0450 or 0.0380). Buying at the current peak is an unresolved gamble. In the case of selling (Sell / Short): If you are trading futures, trying to "call the top" to open short-selling positions during this violent surge could be destructive to your account; wait for clear signs of weakness or a reversal candle on smaller timeframes (e.g., 15 minutes or 1 hour) before thinking about it.
💡 The proposed strategic framework for dealing with this situation: If you are considering making an investment or trading decision based on this move, here is how to evaluate the opportunity in an engineering way to reduce risk: In the case of buying (Buy): Always wait until the price calms down and begins a "retest" of the previously breached support areas (such as nearby prior peak levels around 0.0450 or 0.0380). Buying at the current peak is an unresolved gamble. In the case of selling (Sell / Short): If you are trading futures, trying to "call the top" to open short-selling positions during this violent surge could be destructive to your account; wait for clear signs of weakness or a reversal candle on smaller timeframes (e.g., 15 minutes or 1 hour) before thinking about it.
1
115
#SOMI
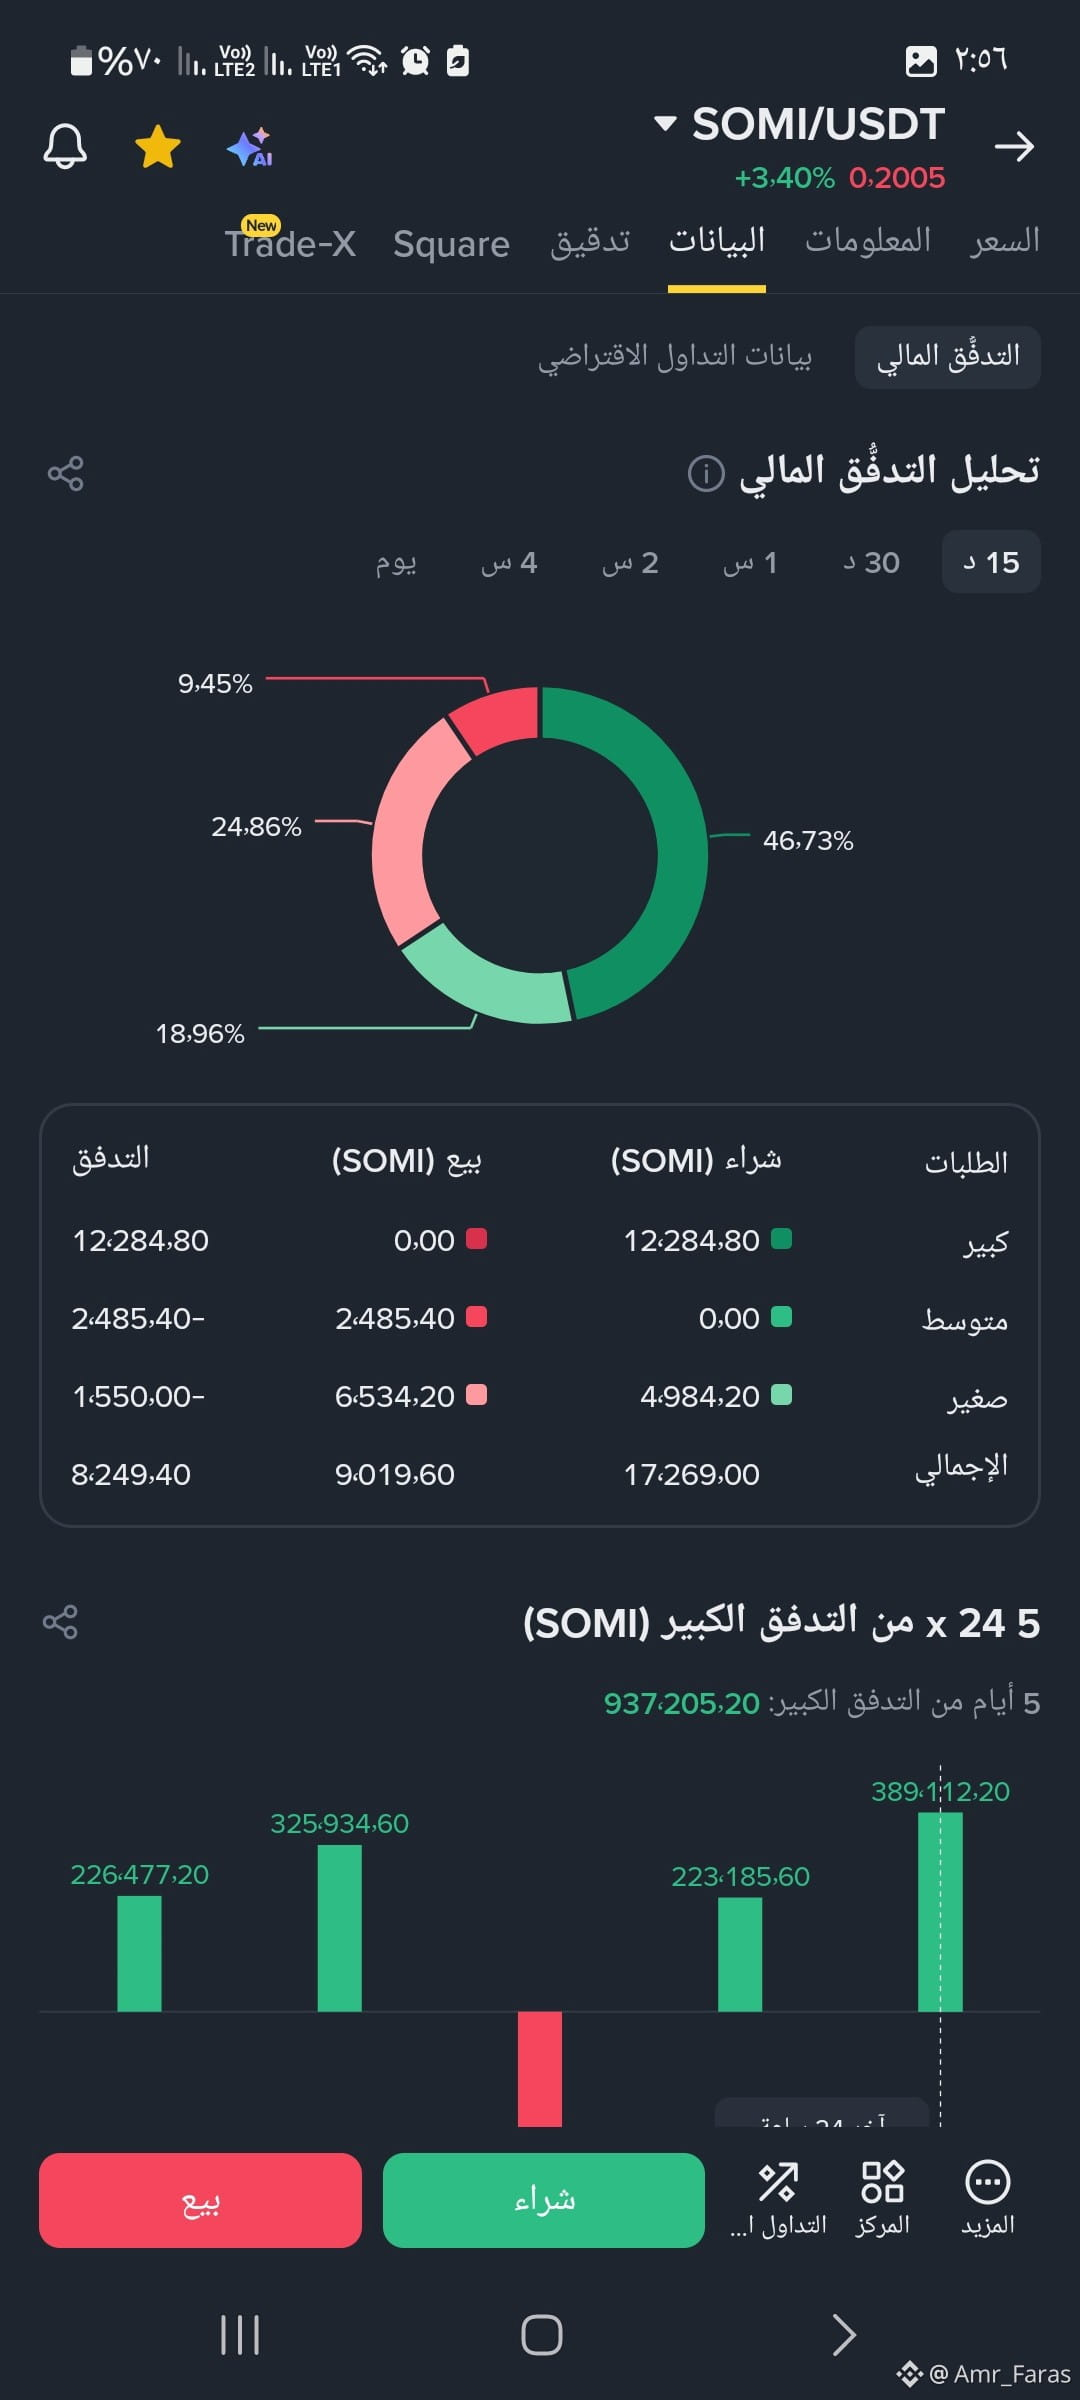
⚠️ Valuation Strategy and Risk ManagementAlthough the indicators show a “bullish sentiment” due to the inflow of large amounts of liquidity, you should be careful of the following traps:Whale Dump: Whales entering strongly may be followed by a “sudden dump” and rapid profit-taking, causing a sharp price drop if they decide to sell all at once.Slowdown in General Liquidity: Make sure to check the total trading volume (Volume) and the market cap (Market Cap) of the coin across platforms like CoinMarketCap to ensure these numbers are not the result of manipulation of a low-liquidity coin (Pump and Dump).Stop-Loss Orders: Do not enter any trade based only on the instantaneous liquidity flow without setting a strict stop-loss order (Stop-Loss) to protect your capital from sudden volatility.
#SOMI
⚠️ Valuation Strategy and Risk ManagementAlthough the indicators show a “bullish sentiment” due to the inflow of large amounts of liquidity, you should be careful of the following traps:Whale Dump: Whales entering strongly may be followed by a “sudden dump” and rapid profit-taking, causing a sharp price drop if they decide to sell all at once.Slowdown in General Liquidity: Make sure to check the total trading volume (Volume) and the market cap (Market Cap) of the coin across platforms like CoinMarketCap to ensure these numbers are not the result of manipulation of a low-liquidity coin (Pump and Dump).Stop-Loss Orders: Do not enter any trade based only on the instantaneous liquidity flow without setting a strict stop-loss order (Stop-Loss) to protect your capital from sudden volatility.
⚠️ Valuation Strategy and Risk ManagementAlthough the indicators show a “bullish sentiment” due to the inflow of large amounts of liquidity, you should be careful of the following traps:Whale Dump: Whales entering strongly may be followed by a “sudden dump” and rapid profit-taking, causing a sharp price drop if they decide to sell all at once.Slowdown in General Liquidity: Make sure to check the total trading volume (Volume) and the market cap (Market Cap) of the coin across platforms like CoinMarketCap to ensure these numbers are not the result of manipulation of a low-liquidity coin (Pump and Dump).Stop-Loss Orders: Do not enter any trade based only on the instantaneous liquidity flow without setting a strict stop-loss order (Stop-Loss) to protect your capital from sudden volatility.
1
221
#Near
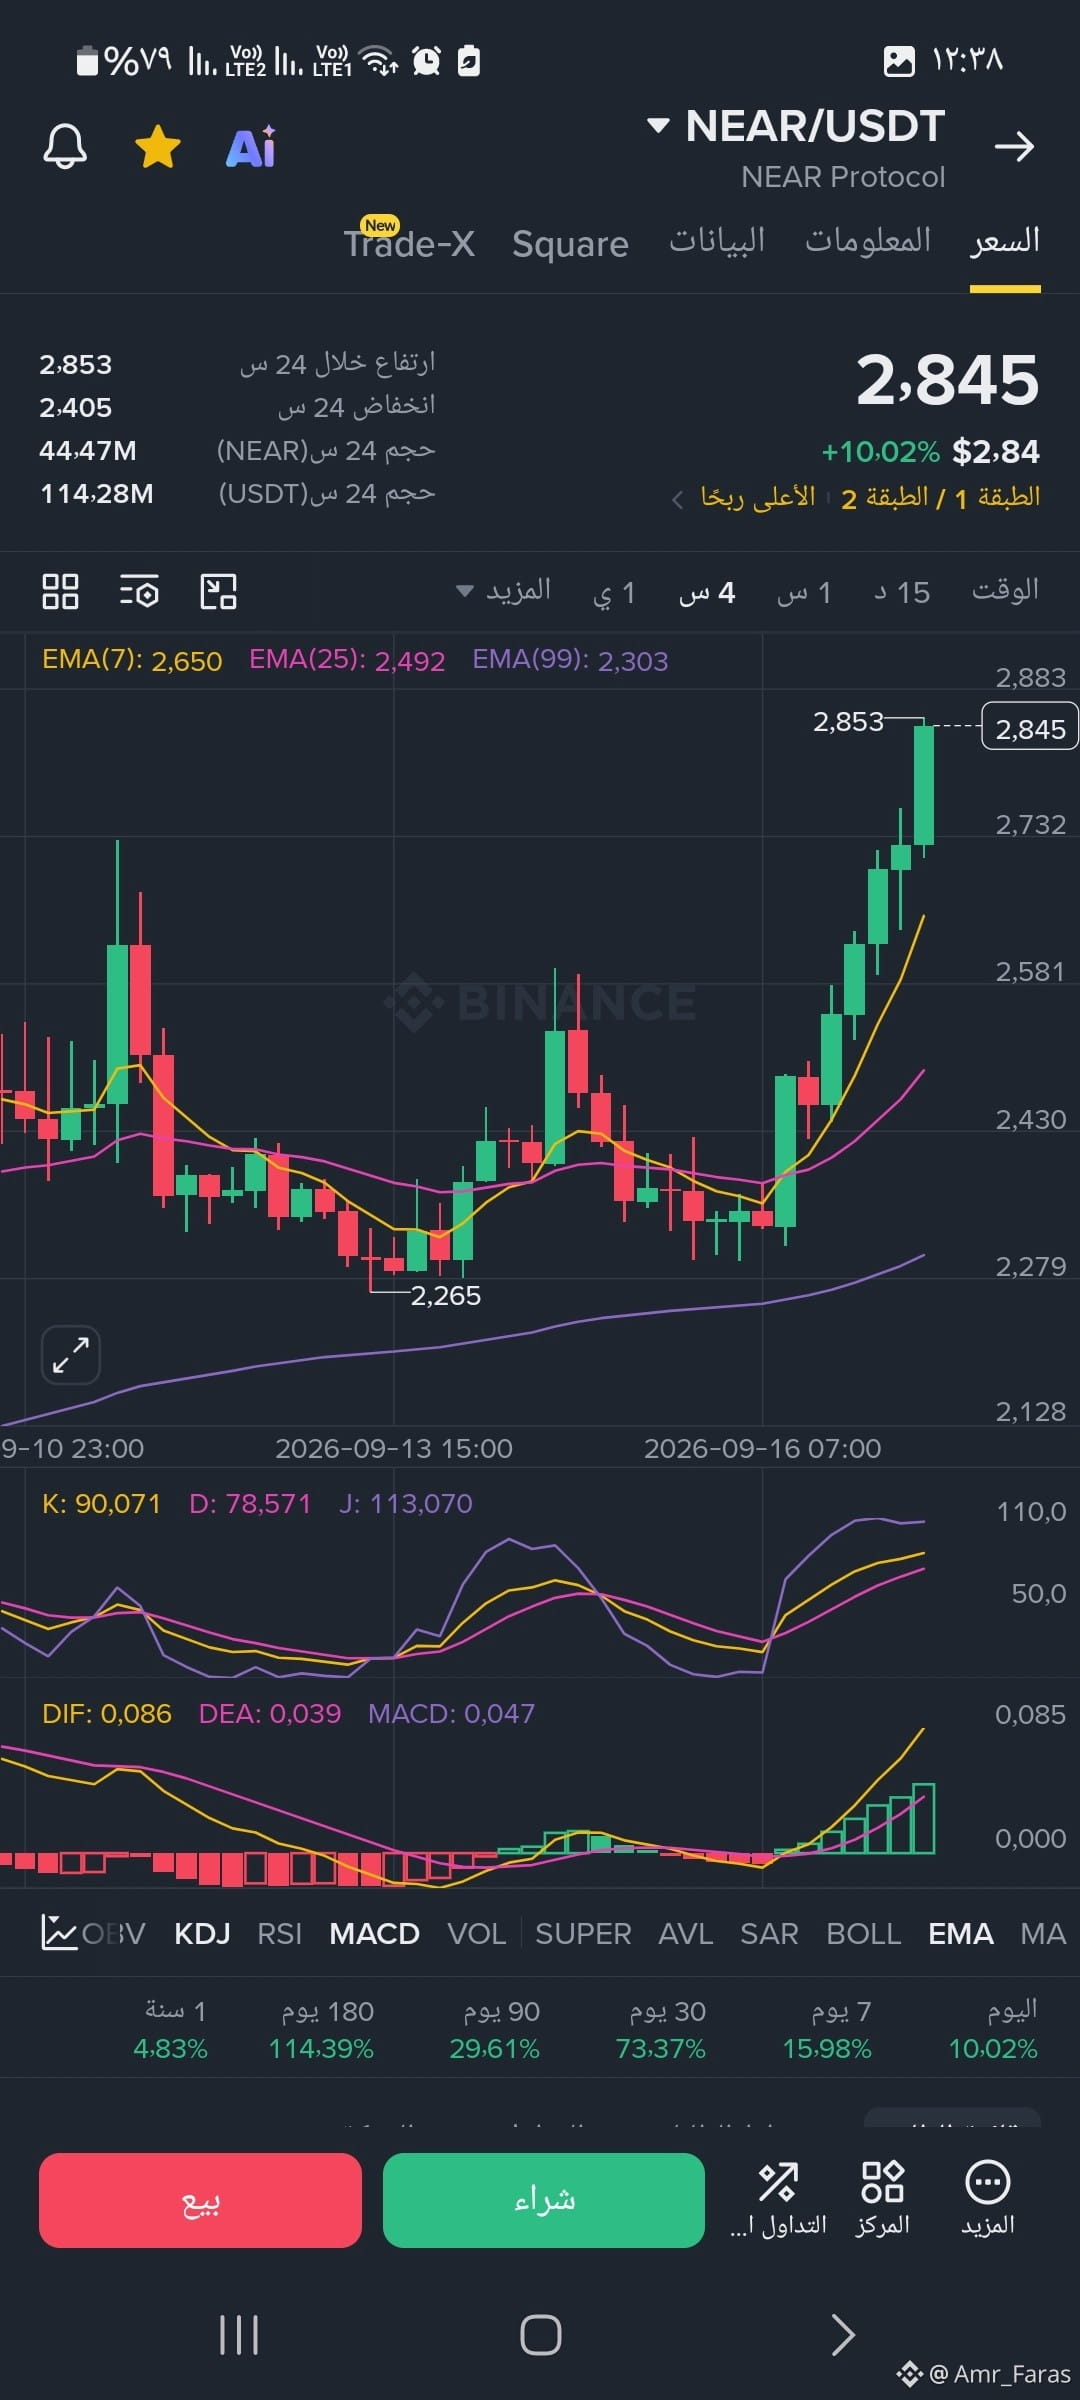
⚠️ Risk management warning Despite the absolute positivity of the candlesticks and the MACD indicator, the KDJ indicator is sending a warning signal about the possibility of being in overbought conditions. Strategically, buying at the highs immediately after a rapid 10% surge carries high risk; it may be wiser to wait for a retest of support levels (such as nearby EMA levels) or to monitor price action carefully to avoid sudden pullbacks
#Near
⚠️ Risk management warning Despite the absolute positivity of the candlesticks and the MACD indicator, the KDJ indicator is sending a warning signal about the possibility of being in overbought conditions. Strategically, buying at the highs immediately after a rapid 10% surge carries high risk; it may be wiser to wait for a retest of support levels (such as nearby EMA levels) or to monitor price action carefully to avoid sudden pullbacks
⚠️ Risk management warning Despite the absolute positivity of the candlesticks and the MACD indicator, the KDJ indicator is sending a warning signal about the possibility of being in overbought conditions. Strategically, buying at the highs immediately after a rapid 10% surge carries high risk; it may be wiser to wait for a retest of support levels (such as nearby EMA levels) or to monitor price action carefully to avoid sudden pullbacks
1
1.1k
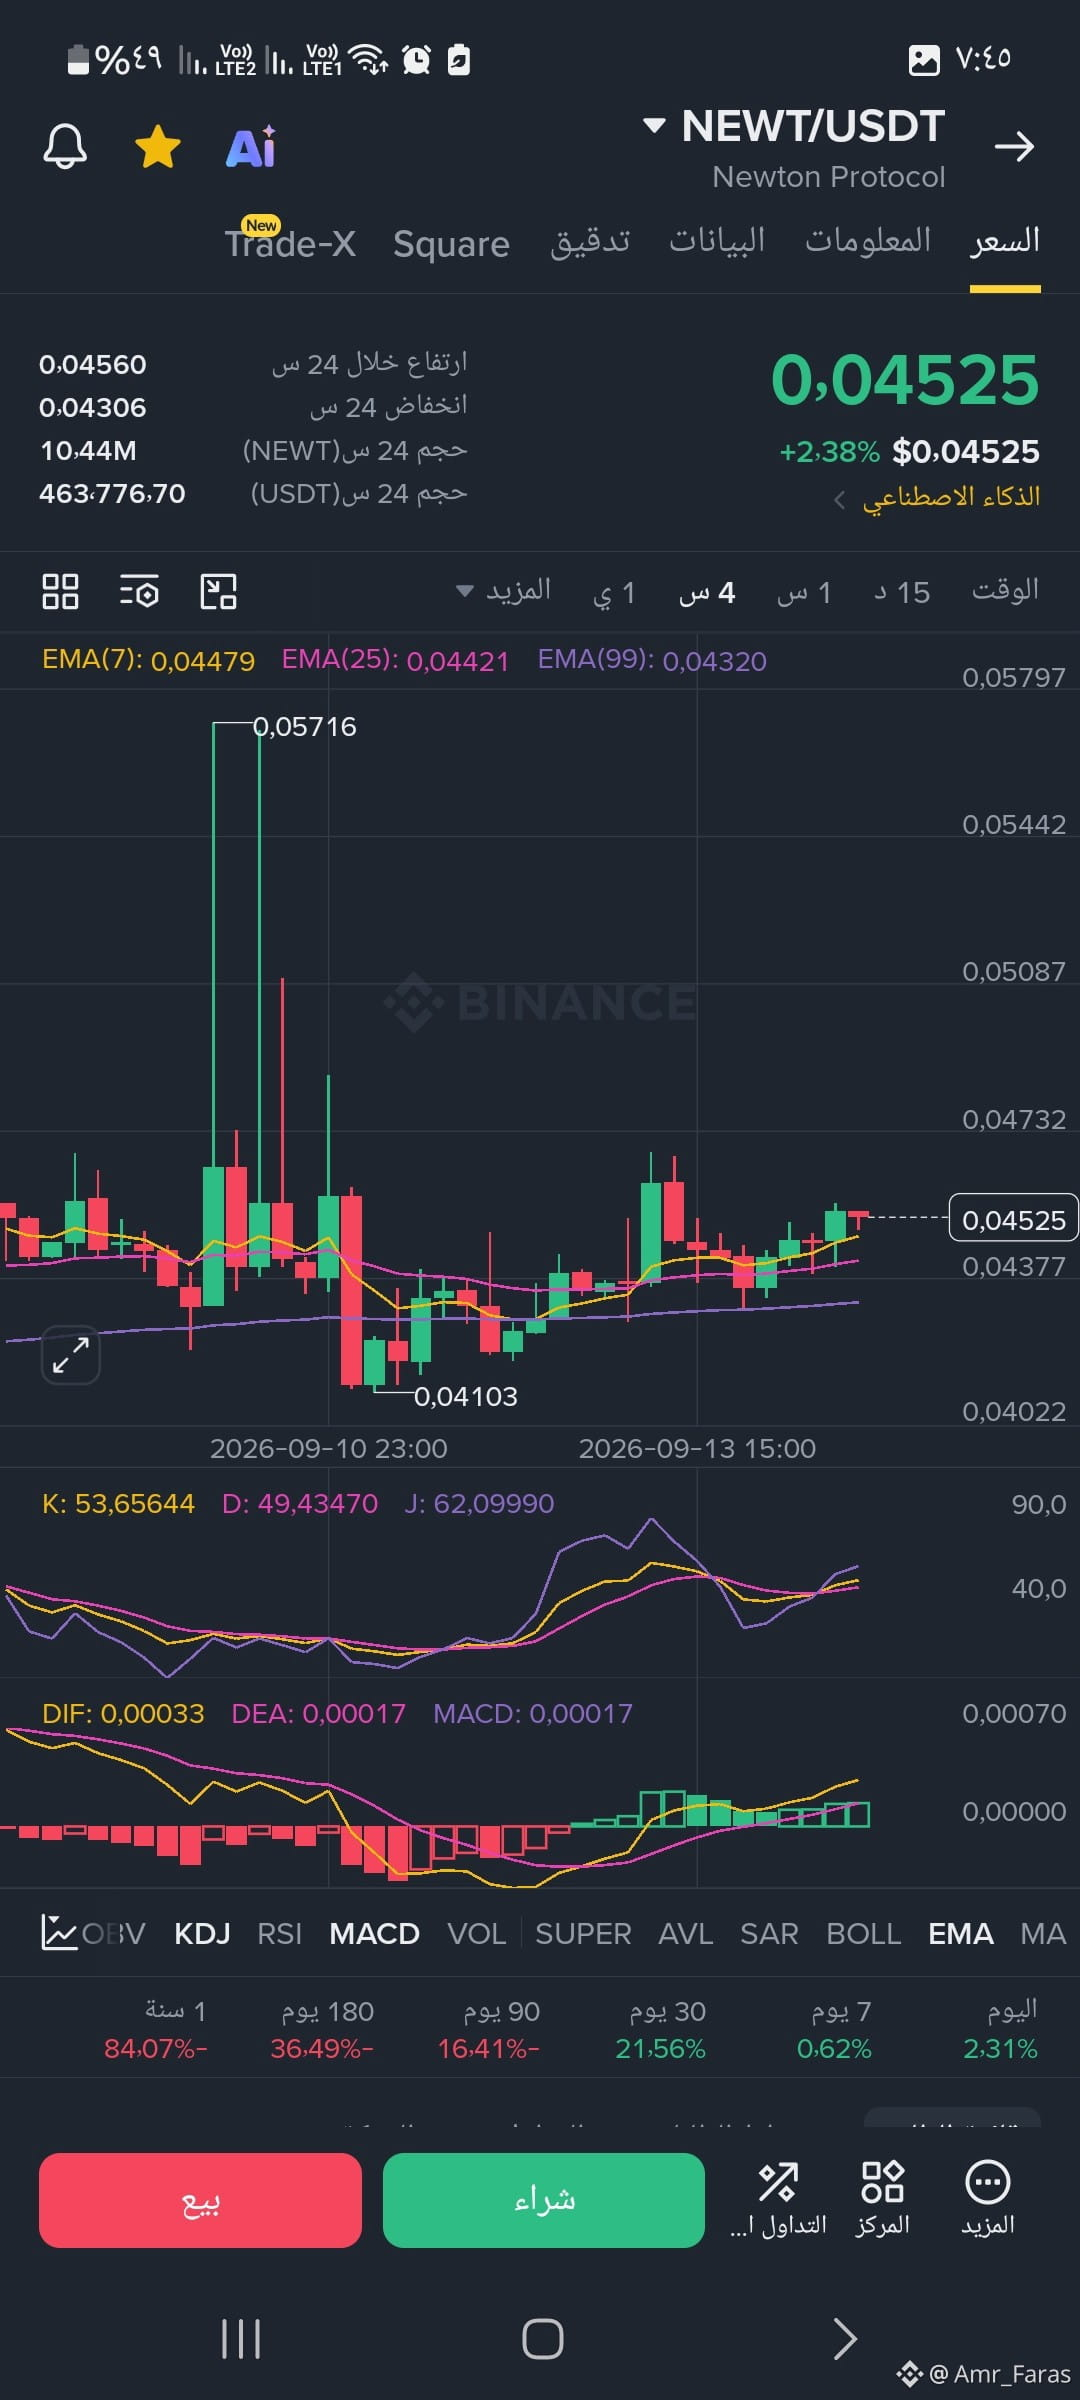
#Newt 🗒 The Expected ScenariosPositive Scenario (Bullish): Price stability and holding above the 0.04480 levels (EMA7 zone) with an increase in trading volume will open the door to testing the next resistance levels at 0.04732, then gradually moving toward the 0.0500 barrier.Negative Scenario (Bearish): If the price breaks the moving averages and closes below 0.04420, it may return to test the strong support area at the previous bottom around 0.04100.
#Newt 🗒 The Expected ScenariosPositive Scenario (Bullish): Price stability and holding above the 0.04480 levels (EMA7 zone) with an increase in trading volume will open the door to testing the next resistance levels at 0.04732, then gradually moving toward the 0.0500 barrier.Negative Scenario (Bearish): If the price breaks the moving averages and closes below 0.04420, it may return to test the strong support area at the previous bottom around 0.04100.
2
120
#solv
💡 Summary and strategic advice
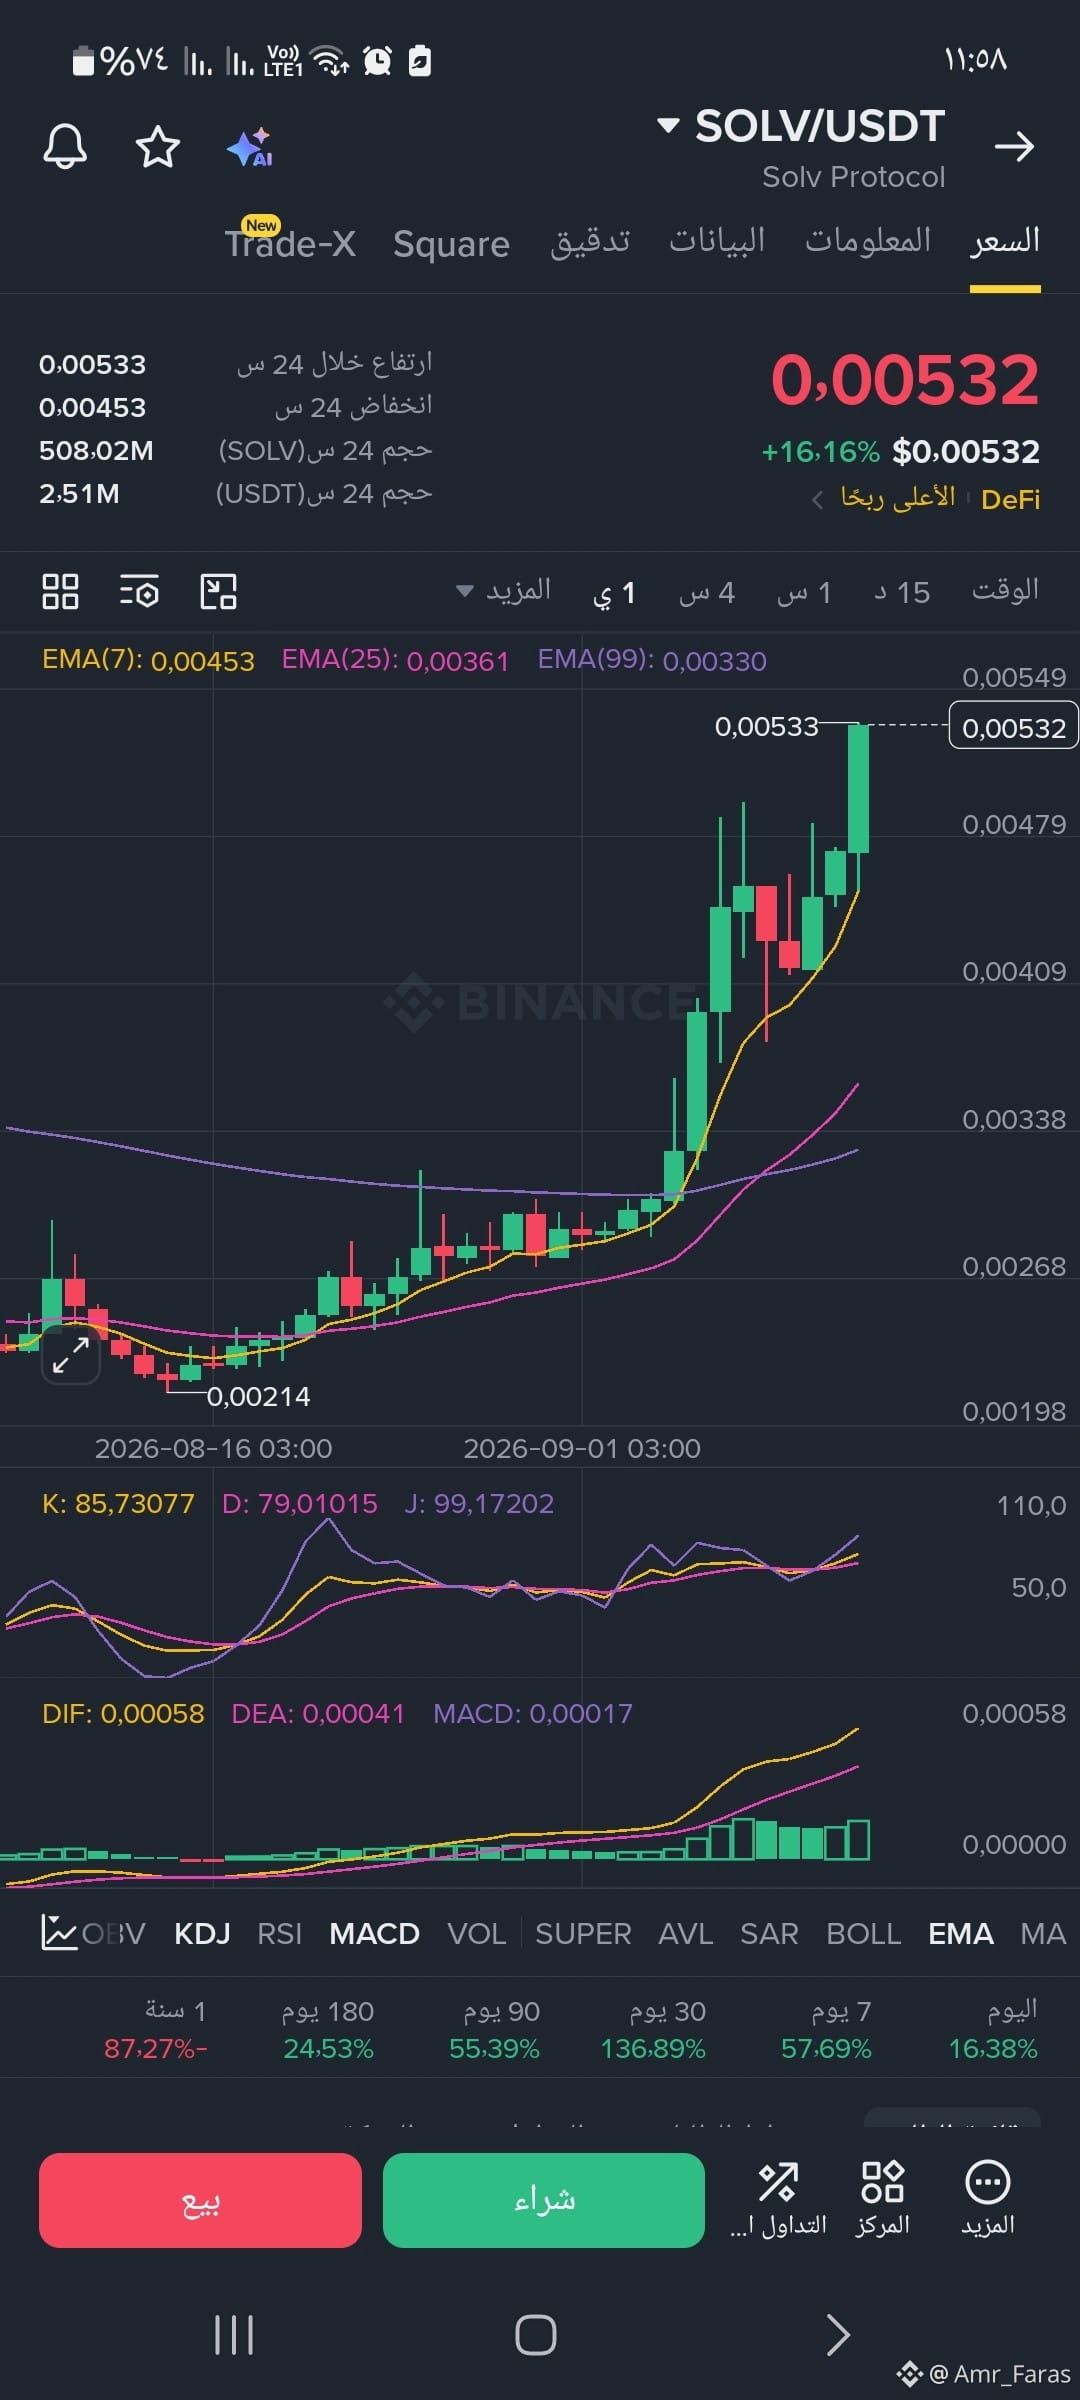
Current situation: The coin is in a strong bullish “price explosion” phase, but entering directly at these levels (0.00532) involves very high risk due to overbought conditions and the price being close to the peak (0.00533).
Correction scenario: It is very common, after such sharp vertical rises, for the price to begin a profit-taking process or a correction to test nearby support levels (such as EMA 7 at 0.00453).
Proposed action plan:
If you are out of the trade: It’s best not to chase the price (FOMO). Wait for a healthy pullback and a retest of support levels, or wait for a real breakout and firm confirmation above the current peak.
If you are in the trade: It may be wise to secure part of the profits or raise your “moving stop-loss” (Trailing Stop) to protect your gains in case the market suddenly reverses.
#solv
💡 Summary and strategic advice
Current situation: The coin is in a strong bullish “price explosion” phase, but entering directly at these levels (0.00532) involves very high risk due to overbought conditions and the price being close to the peak (0.00533).
Correction scenario: It is very common, after such sharp vertical rises, for the price to begin a profit-taking process or a correction to test nearby support levels (such as EMA 7 at 0.00453).
Proposed action plan:
If you are out of the trade: It’s best not to chase the price (FOMO). Wait for a healthy pullback and a retest of support levels, or wait for a real breakout and firm confirmation above the current peak.
If you are in the trade: It may be wise to secure part of the profits or raise your “moving stop-loss” (Trailing Stop) to protect your gains in case the market suddenly reverses.
💡 Summary and strategic advice
Current situation: The coin is in a strong bullish “price explosion” phase, but entering directly at these levels (0.00532) involves very high risk due to overbought conditions and the price being close to the peak (0.00533).
Correction scenario: It is very common, after such sharp vertical rises, for the price to begin a profit-taking process or a correction to test nearby support levels (such as EMA 7 at 0.00453).
Proposed action plan:
If you are out of the trade: It’s best not to chase the price (FOMO). Wait for a healthy pullback and a retest of support levels, or wait for a real breakout and firm confirmation above the current peak.
If you are in the trade: It may be wise to secure part of the profits or raise your “moving stop-loss” (Trailing Stop) to protect your gains in case the market suddenly reverses.
1
179
#GPS
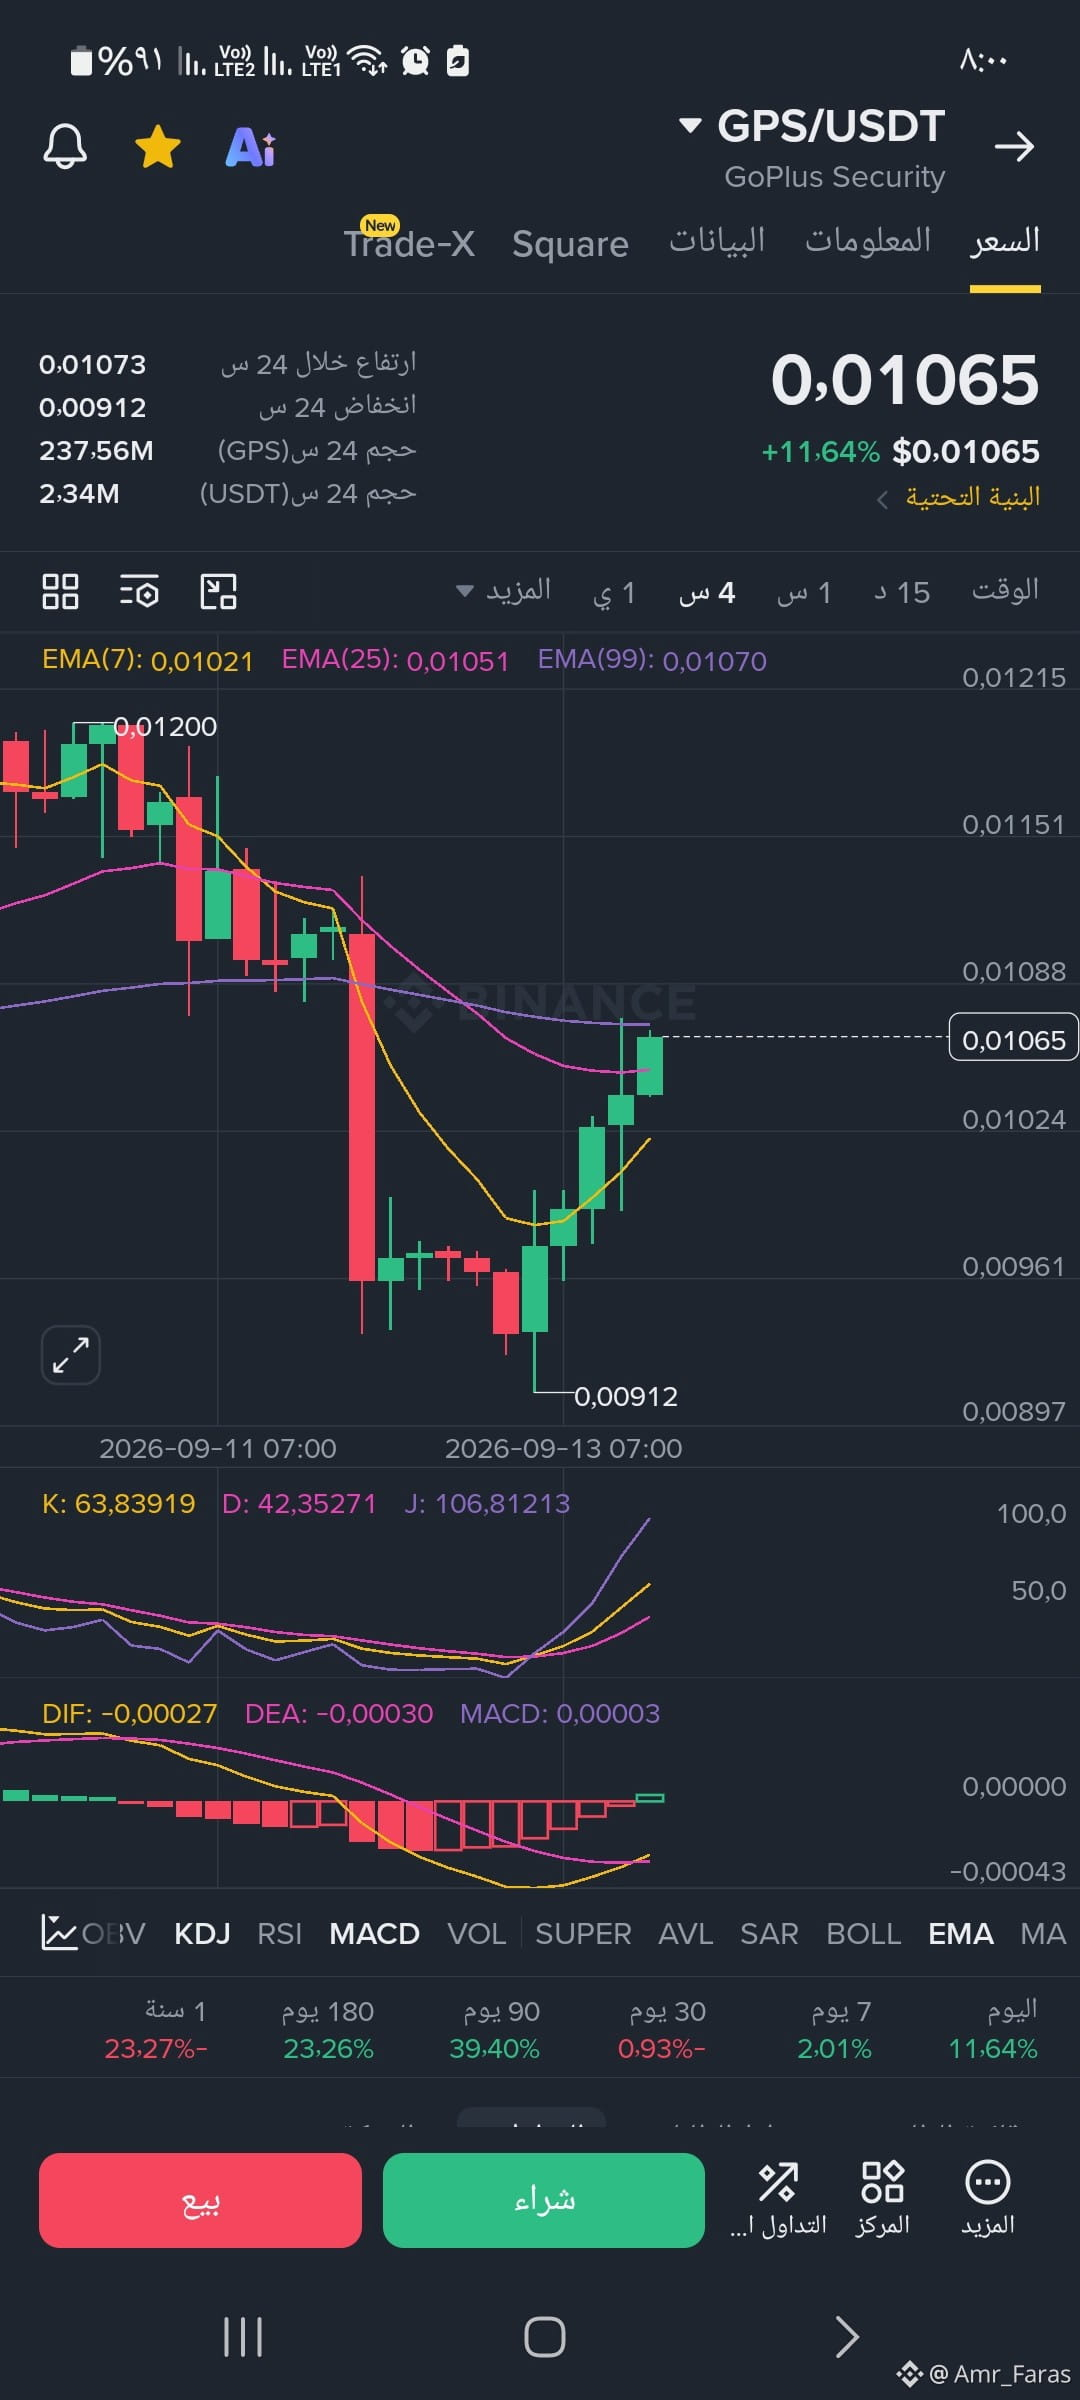
. Main Support and Resistance LevelsSupport Levels:0.01021: A nearby support (EMA 7 level).0.00961: A horizontal support level from which the price bounced visually during the decline.0.00912: The main and currently strongest support (the current liquidity low). Breaking this level means the strong sell-off will continue.Resistance Levels:0.01070: The immediate current resistance (EMA 99).0.01088: A previous horizontal resistance.0.01200: The previous main peak and a far-off target for buyers
#GPS
. Main Support and Resistance LevelsSupport Levels:0.01021: A nearby support (EMA 7 level).0.00961: A horizontal support level from which the price bounced visually during the decline.0.00912: The main and currently strongest support (the current liquidity low). Breaking this level means the strong sell-off will continue.Resistance Levels:0.01070: The immediate current resistance (EMA 99).0.01088: A previous horizontal resistance.0.01200: The previous main peak and a far-off target for buyers
. Main Support and Resistance LevelsSupport Levels:0.01021: A nearby support (EMA 7 level).0.00961: A horizontal support level from which the price bounced visually during the decline.0.00912: The main and currently strongest support (the current liquidity low). Breaking this level means the strong sell-off will continue.Resistance Levels:0.01070: The immediate current resistance (EMA 99).0.01088: A previous horizontal resistance.0.01200: The previous main peak and a far-off target for buyers
176
Log in to explore more content
Join global crypto users on Binance Square
⚡️ Get latest and useful information about crypto.
💬 Trusted by the world’s largest crypto exchange.
👍 Discover real insights from verified creators.
Email / Phone number