
#sei
sei
8.4M views
14,040 Discussing
Hot
Latest

·
--
Bullish
Partly True
🚨 SEI Update! 🔥
Tokenized U.S. Treasury holders on Sei are up 41% in just 90 days. 📈
Real-world asset adoption on Sei is growing fast. 👀
Could this be a bullish signal for $SEI? 🚀
#SEI #SuiNetwork #Crypto #RWA
$SEI
🚨 SEI Update! 🔥
Tokenized U.S. Treasury holders on Sei are up 41% in just 90 days. 📈
Real-world asset adoption on Sei is growing fast. 👀
Could this be a bullish signal for $SEI ? 🚀
#SEI #SuiNetwork #Crypto #RWA
$SEI
Tokenized U.S. Treasury holders on Sei are up 41% in just 90 days. 📈
Real-world asset adoption on Sei is growing fast. 👀
Could this be a bullish signal for $SEI ? 🚀
#SEI #SuiNetwork #Crypto #RWA
$SEI
H_M_100:
معروض كبير جدا صعب انها ترتفع
1
5
1.6k

·
--
🚨 $SEI
{future}(SEIUSDT)
DOWN 3.96% — LEVERAGE BUILDING?
💰 $0.0461 📊 Futures OI: ~$8.09M
🟢 Above $0.0485 = recovery watch 🔴 Below $0.0443 = breakdown risk
🔥 OI rising in tokens, but direction isn't confirmed.
SQUEEZE or SELLOFF? 👇
#SEI #OpenInterest #DYOR
🚨 $SEI
DOWN 3.96% — LEVERAGE BUILDING?
💰 $0.0461 📊 Futures OI: ~$8.09M
🟢 Above $0.0485 = recovery watch 🔴 Below $0.0443 = breakdown risk
🔥 OI rising in tokens, but direction isn't confirmed.
SQUEEZE or SELLOFF? 👇
#SEI #OpenInterest #DYOR
DOWN 3.96% — LEVERAGE BUILDING?
💰 $0.0461 📊 Futures OI: ~$8.09M
🟢 Above $0.0485 = recovery watch 🔴 Below $0.0443 = breakdown risk
🔥 OI rising in tokens, but direction isn't confirmed.
SQUEEZE or SELLOFF? 👇
#SEI #OpenInterest #DYOR
205

·
--
⚡ $SEI PREPARES FOR AN EXPLOSIVE VOLATILITY BREAKOUT AS BUYERS ABSORB SELL PRESSURE! 💥
Entry: 0.04736 ⚡
Target: 0.0477686 🚀
Order flow is showing clear compression, signaling an impending volatility expansion on $SEI before the next leg up. 📊 Smart money is quietly stacking bids right at the pivot, leaving late chasers at risk of getting caught off guard. ⚡
📌 Tight ranges like this usually resolve with rapid price movement once the overhead liquidity gets swept. 🌊 Are you positioning inside this range early or waiting for the breakout confirmation? 👇
⚠️ Not financial advice. Always manage your risk. 🛡️
🏷️ #SEI #Crypto #Trading #Breakout #Altcoins
🔥 💎
⚡ $SEI PREPARES FOR AN EXPLOSIVE VOLATILITY BREAKOUT AS BUYERS ABSORB SELL PRESSURE! 💥
Entry: 0.04736 ⚡
Target: 0.0477686 🚀
Order flow is showing clear compression, signaling an impending volatility expansion on $SEI before the next leg up. 📊 Smart money is quietly stacking bids right at the pivot, leaving late chasers at risk of getting caught off guard. ⚡
📌 Tight ranges like this usually resolve with rapid price movement once the overhead liquidity gets swept. 🌊 Are you positioning inside this range early or waiting for the breakout confirmation? 👇
⚠️ Not financial advice. Always manage your risk. 🛡️
🏷️ #SEI #Crypto #Trading #Breakout #Altcoins
🔥 💎
Entry: 0.04736 ⚡
Target: 0.0477686 🚀
Order flow is showing clear compression, signaling an impending volatility expansion on $SEI before the next leg up. 📊 Smart money is quietly stacking bids right at the pivot, leaving late chasers at risk of getting caught off guard. ⚡
📌 Tight ranges like this usually resolve with rapid price movement once the overhead liquidity gets swept. 🌊 Are you positioning inside this range early or waiting for the breakout confirmation? 👇
⚠️ Not financial advice. Always manage your risk. 🛡️
🏷️ #SEI #Crypto #Trading #Breakout #Altcoins
🔥 💎
8
·
--
NEXT-GEN LAYER 1 WARFARE HEATING UP ACROSS $SEI $MON AND $XPL ⚡ 🐂
Capital is rotating fast into execution-layer behemoths, with smart money quietly building positions before the next expansion phase. 📊 While $SEI continues to compress nicely above its key demand block, emerging plays like $MON and $XPL are drawing intense order flow from traders chasing high-throughput momentum. ⚡
The battle for Layer 1 dominance isn't just about theoretical TPS stats anymore—it's about real liquidity retention and ecosystem velocity. 💡 Which of these high-performance Layer 1s is leading your portfolio watchlist for the next leg up? 👇
⚠️ Not financial advice. Always manage your risk. 🛡️
🏷️ #SEI #Layer1 #Crypto #Altcoins
🔥 💎
NEXT-GEN LAYER 1 WARFARE HEATING UP ACROSS $SEI $MON AND $XPL ⚡ 🐂
Capital is rotating fast into execution-layer behemoths, with smart money quietly building positions before the next expansion phase. 📊 While $SEI continues to compress nicely above its key demand block, emerging plays like $MON and $XPL are drawing intense order flow from traders chasing high-throughput momentum. ⚡
The battle for Layer 1 dominance isn't just about theoretical TPS stats anymore—it's about real liquidity retention and ecosystem velocity. 💡 Which of these high-performance Layer 1s is leading your portfolio watchlist for the next leg up? 👇
⚠️ Not financial advice. Always manage your risk. 🛡️
🏷️ #SEI #Layer1 #Crypto #Altcoins
🔥 💎
Capital is rotating fast into execution-layer behemoths, with smart money quietly building positions before the next expansion phase. 📊 While $SEI continues to compress nicely above its key demand block, emerging plays like $MON and $XPL are drawing intense order flow from traders chasing high-throughput momentum. ⚡
The battle for Layer 1 dominance isn't just about theoretical TPS stats anymore—it's about real liquidity retention and ecosystem velocity. 💡 Which of these high-performance Layer 1s is leading your portfolio watchlist for the next leg up? 👇
⚠️ Not financial advice. Always manage your risk. 🛡️
🏷️ #SEI #Layer1 #Crypto #Altcoins
🔥 💎
16

·
--
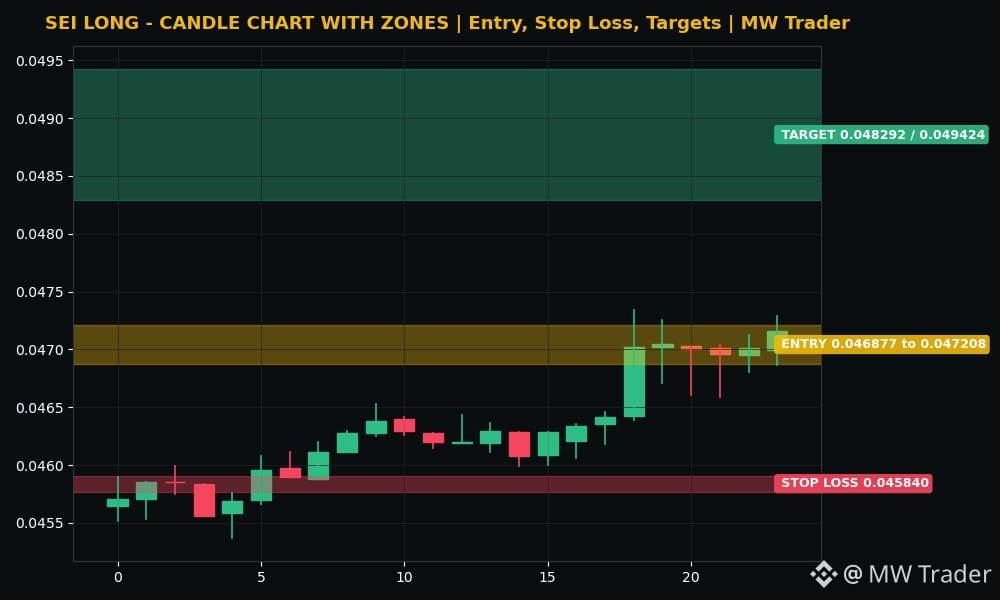
$SEI #SEI 🚀
Direction: LONG
Entry zone: 0.046877 to 0.047208
Stop loss: 0.045840
Target 1: 0.048292
Target 2: 0.049424
Sei is trading near 0.047160 dollars, up 3.98 percent in 24 hours while the whole market fell 3.42 percent, inside a range of 0.044316 to 0.047342 dollars, and the recent closes show a flat line at the highs, 0.047046, then 0.047007, then 0.046957, then 0.047017, then 0.047160. 🟢 My reading is that SEI held its gains all day instead of giving them back, which is what strength looks like in a red market, but a flat line at the top can break either way, so this is a momentum long with a hard stop, not a chase. A long from the current zone, with a stop below 0.045840, targets 0.048292 first and then 0.049424 if buyers push past the range high. A fall below 0.045840 kills the idea without debate.
Futures trading is risky. Trade small, use a stop loss, and do your own research. This is my reading, not a guaranteed signal.
Does SEI push to 0.048292 first, or fall below 0.045840? 🤔
Follow for more trades.
#Sei #Crypto #FuturesTrading #TradingSignals
$SEI #SEI 🚀
Direction: LONG
Entry zone: 0.046877 to 0.047208
Stop loss: 0.045840
Target 1: 0.048292
Target 2: 0.049424
Sei is trading near 0.047160 dollars, up 3.98 percent in 24 hours while the whole market fell 3.42 percent, inside a range of 0.044316 to 0.047342 dollars, and the recent closes show a flat line at the highs, 0.047046, then 0.047007, then 0.046957, then 0.047017, then 0.047160. 🟢 My reading is that SEI held its gains all day instead of giving them back, which is what strength looks like in a red market, but a flat line at the top can break either way, so this is a momentum long with a hard stop, not a chase. A long from the current zone, with a stop below 0.045840, targets 0.048292 first and then 0.049424 if buyers push past the range high. A fall below 0.045840 kills the idea without debate.
Futures trading is risky. Trade small, use a stop loss, and do your own research. This is my reading, not a guaranteed signal.
Does SEI push to 0.048292 first, or fall below 0.045840? 🤔
Follow for more trades.
#Sei #Crypto #FuturesTrading #TradingSignals
Direction: LONG
Entry zone: 0.046877 to 0.047208
Stop loss: 0.045840
Target 1: 0.048292
Target 2: 0.049424
Sei is trading near 0.047160 dollars, up 3.98 percent in 24 hours while the whole market fell 3.42 percent, inside a range of 0.044316 to 0.047342 dollars, and the recent closes show a flat line at the highs, 0.047046, then 0.047007, then 0.046957, then 0.047017, then 0.047160. 🟢 My reading is that SEI held its gains all day instead of giving them back, which is what strength looks like in a red market, but a flat line at the top can break either way, so this is a momentum long with a hard stop, not a chase. A long from the current zone, with a stop below 0.045840, targets 0.048292 first and then 0.049424 if buyers push past the range high. A fall below 0.045840 kills the idea without debate.
Futures trading is risky. Trade small, use a stop loss, and do your own research. This is my reading, not a guaranteed signal.
Does SEI push to 0.048292 first, or fall below 0.045840? 🤔
Follow for more trades.
#Sei #Crypto #FuturesTrading #TradingSignals
9

·
--
Bearish
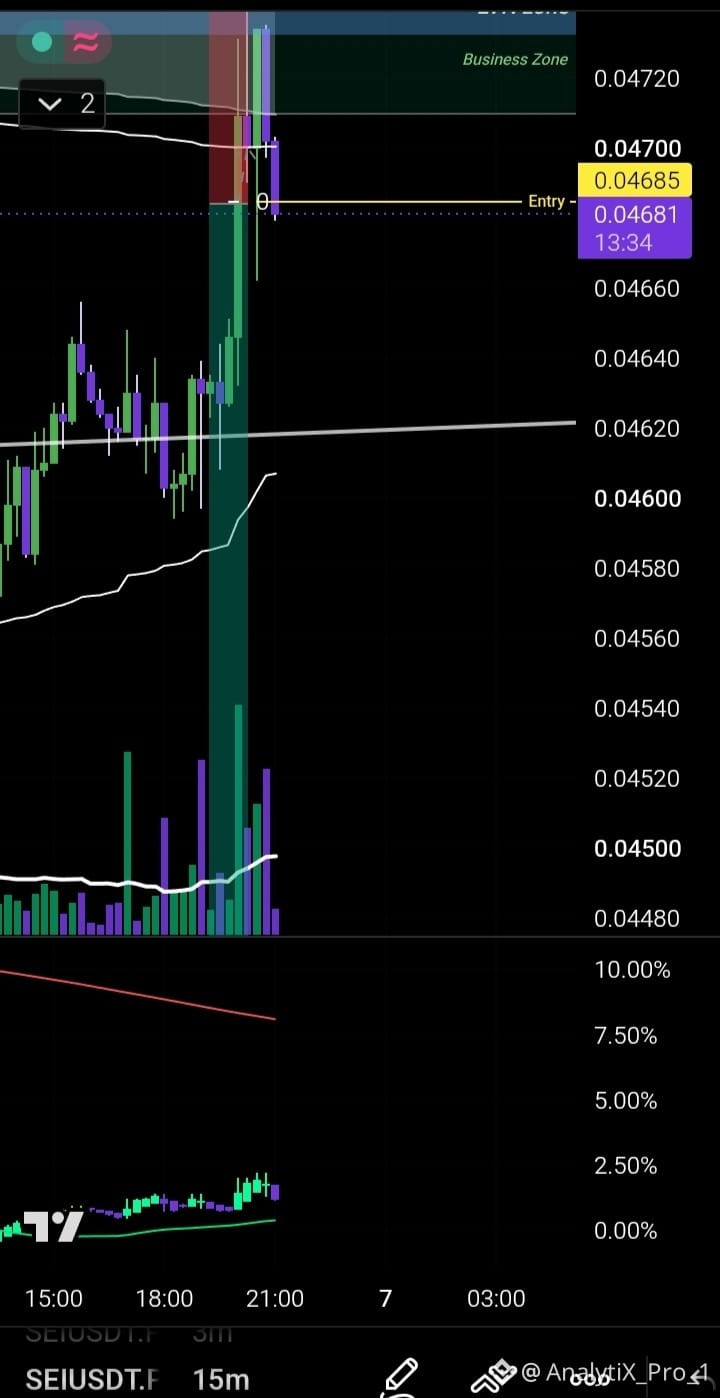
#SEI/USDT –✅️ short 🔴 SETUP 🔥
Leverage: 20x 💥🎯
Entry: Market Price 🚀 0.04685-0.04700〽️〽️
Take-Profit Targets 🎯
TP1: 0.04600 —
TP2: $ 0.04500 —
TP5: $ 0.04400— (Free ride after TP3) 🏄♂️
🔴Stop-Loss 0.04780 🛑
Risk/Reward = 1 : 3+ 💰
Position sizing: Max 2–3% of capital (20x is spicy, respect the risk!)
💸🏁Who’s jumping in with me? 👇
#WriteToEarnUpgrade #freesignal #Short✅ #Sei
$SEI
#SEI/USDT –✅️ short 🔴 SETUP 🔥
Leverage: 20x 💥🎯
Entry: Market Price 🚀 0.04685-0.04700〽️〽️
Take-Profit Targets 🎯
TP1: 0.04600 —
TP2: $ 0.04500 —
TP5: $ 0.04400— (Free ride after TP3) 🏄♂️
🔴Stop-Loss 0.04780 🛑
Risk/Reward = 1 : 3+ 💰
Position sizing: Max 2–3% of capital (20x is spicy, respect the risk!)
💸🏁Who’s jumping in with me? 👇
#WriteToEarnUpgrade #freesignal #Short✅ #Sei
$SEI
Leverage: 20x 💥🎯
Entry: Market Price 🚀 0.04685-0.04700〽️〽️
Take-Profit Targets 🎯
TP1: 0.04600 —
TP2: $ 0.04500 —
TP5: $ 0.04400— (Free ride after TP3) 🏄♂️
🔴Stop-Loss 0.04780 🛑
Risk/Reward = 1 : 3+ 💰
Position sizing: Max 2–3% of capital (20x is spicy, respect the risk!)
💸🏁Who’s jumping in with me? 👇
#WriteToEarnUpgrade #freesignal #Short✅ #Sei
$SEI
143

·
--
🚨 $SEI SUPPORT FLASHES RED AS SELLERS ROLL OVER KEY LIQUIDITY! 📉
Entry: 0.04672 ⚡
Target: 0.046456 🎯
📌 Bears are pressing hard on $SEI right at critical support, turning late buyers into fresh exit liquidity. 📉 Momentum indicators show relentless sell volume absorbing every weak bounce attempt as order books thin out below.
💡 If this key level snaps under pressure, expect a fast liquidity cascade toward lower support zones. 🌊 The order flow leans heavily bearish as distribution ramps up across high-volume timeframes. 💬 Are you shorting this breakdown or waiting for a relief retest? 👇
⚠️ Not financial advice. Always manage your risk. 🛡️
🏷️ #SEI #ShortSetup #Crypto #Breakdown #Trading
📉 🐻
🚨 $SEI SUPPORT FLASHES RED AS SELLERS ROLL OVER KEY LIQUIDITY! 📉
Entry: 0.04672 ⚡
Target: 0.046456 🎯
📌 Bears are pressing hard on $SEI right at critical support, turning late buyers into fresh exit liquidity. 📉 Momentum indicators show relentless sell volume absorbing every weak bounce attempt as order books thin out below.
💡 If this key level snaps under pressure, expect a fast liquidity cascade toward lower support zones. 🌊 The order flow leans heavily bearish as distribution ramps up across high-volume timeframes. 💬 Are you shorting this breakdown or waiting for a relief retest? 👇
⚠️ Not financial advice. Always manage your risk. 🛡️
🏷️ #SEI #ShortSetup #Crypto #Breakdown #Trading
📉 🐻
Entry: 0.04672 ⚡
Target: 0.046456 🎯
📌 Bears are pressing hard on $SEI right at critical support, turning late buyers into fresh exit liquidity. 📉 Momentum indicators show relentless sell volume absorbing every weak bounce attempt as order books thin out below.
💡 If this key level snaps under pressure, expect a fast liquidity cascade toward lower support zones. 🌊 The order flow leans heavily bearish as distribution ramps up across high-volume timeframes. 💬 Are you shorting this breakdown or waiting for a relief retest? 👇
⚠️ Not financial advice. Always manage your risk. 🛡️
🏷️ #SEI #ShortSetup #Crypto #Breakdown #Trading
📉 🐻
19

🔴 $SEI SHOWS HEAVY REJECTION AT RESISTANCE AS BEARISH MARKET STRUCTURE TAKES OVER 📉
Entry: 0.0462 - 0.0465 ⚡
Target: 0.04459 🎯
Stop Loss: 0.04726 ⚠️
Sellers are repeatedly defending the 0.0470 resistance level, creating a clean sequence of lower highs that signals buyer exhaustion. 📉 A decisive breakdown below 0.0462 clears the runway for a swift move down toward the 0.04459 liquidity pool.
📌 Momentum is shifting heavily to the downside as bids dry up near key overhead supply. 💡 With bears firmly controlling this structure, patience pays off when waiting for high-probability breakdown confirmation. 💬 Are you shorting this breakdown into target or waiting to catch a bounce lower? 👇
⚠️ Not financial advice. Always manage your risk. 🛡️
🏷️ #SEI #ShortSetup #CryptoTrading #Bearish #Altcoins
🔻 📉
🔴 $SEI SHOWS HEAVY REJECTION AT RESISTANCE AS BEARISH MARKET STRUCTURE TAKES OVER 📉
Entry: 0.0462 - 0.0465 ⚡
Target: 0.04459 🎯
Stop Loss: 0.04726 ⚠️
Sellers are repeatedly defending the 0.0470 resistance level, creating a clean sequence of lower highs that signals buyer exhaustion. 📉 A decisive breakdown below 0.0462 clears the runway for a swift move down toward the 0.04459 liquidity pool.
📌 Momentum is shifting heavily to the downside as bids dry up near key overhead supply. 💡 With bears firmly controlling this structure, patience pays off when waiting for high-probability breakdown confirmation. 💬 Are you shorting this breakdown into target or waiting to catch a bounce lower? 👇
⚠️ Not financial advice. Always manage your risk. 🛡️
🏷️ #SEI #ShortSetup #CryptoTrading #Bearish #Altcoins
🔻 📉
Entry: 0.0462 - 0.0465 ⚡
Target: 0.04459 🎯
Stop Loss: 0.04726 ⚠️
Sellers are repeatedly defending the 0.0470 resistance level, creating a clean sequence of lower highs that signals buyer exhaustion. 📉 A decisive breakdown below 0.0462 clears the runway for a swift move down toward the 0.04459 liquidity pool.
📌 Momentum is shifting heavily to the downside as bids dry up near key overhead supply. 💡 With bears firmly controlling this structure, patience pays off when waiting for high-probability breakdown confirmation. 💬 Are you shorting this breakdown into target or waiting to catch a bounce lower? 👇
⚠️ Not financial advice. Always manage your risk. 🛡️
🏷️ #SEI #ShortSetup #CryptoTrading #Bearish #Altcoins
🔻 📉
13

🔻 $SEI MARKET STRUCTURE BREAKS DOWN AS SELLERS PRESS FOR A DEEP FLUID DROP! 📉
Entry: 0.0462 - 0.0465 ⚡
Target: 0.04459 🚀
Stop Loss: 0.04726 ⚠️
$SEI is painting a textbook bearish sequence on the charts, printing lower highs continuously while capped firmly beneath the 0.0470 supply zone. Sellers are actively suffocating every minor attempt at a bounce, building immense sell-side pressure above current prices. 📉
A decisive slip below 0.0462 opens the floodgates straight into the 0.044x liquidity pocket. 📊 Order flow indicates an aggressive market unwind as trapped buyers run out of defense. 💡
💬 Are you riding this structural breakdown down to target or waiting for support to hold? 👇
⚠️ Not financial advice. Always manage your risk. 🛡️
🏷️ #SEI #ShortSetup #CryptoTrading #Bearish #Altcoins
🔻 🩸
🔻 $SEI MARKET STRUCTURE BREAKS DOWN AS SELLERS PRESS FOR A DEEP FLUID DROP! 📉
Entry: 0.0462 - 0.0465 ⚡
Target: 0.04459 🚀
Stop Loss: 0.04726 ⚠️
$SEI is painting a textbook bearish sequence on the charts, printing lower highs continuously while capped firmly beneath the 0.0470 supply zone. Sellers are actively suffocating every minor attempt at a bounce, building immense sell-side pressure above current prices. 📉
A decisive slip below 0.0462 opens the floodgates straight into the 0.044x liquidity pocket. 📊 Order flow indicates an aggressive market unwind as trapped buyers run out of defense. 💡
💬 Are you riding this structural breakdown down to target or waiting for support to hold? 👇
⚠️ Not financial advice. Always manage your risk. 🛡️
🏷️ #SEI #ShortSetup #CryptoTrading #Bearish #Altcoins
🔻 🩸
Entry: 0.0462 - 0.0465 ⚡
Target: 0.04459 🚀
Stop Loss: 0.04726 ⚠️
$SEI is painting a textbook bearish sequence on the charts, printing lower highs continuously while capped firmly beneath the 0.0470 supply zone. Sellers are actively suffocating every minor attempt at a bounce, building immense sell-side pressure above current prices. 📉
A decisive slip below 0.0462 opens the floodgates straight into the 0.044x liquidity pocket. 📊 Order flow indicates an aggressive market unwind as trapped buyers run out of defense. 💡
💬 Are you riding this structural breakdown down to target or waiting for support to hold? 👇
⚠️ Not financial advice. Always manage your risk. 🛡️
🏷️ #SEI #ShortSetup #CryptoTrading #Bearish #Altcoins
🔻 🩸
12

·
--

Article
$SEI Goes Parabolic! Massive Breakout Confirmed? 🚀🛑$SEI I is on a parabolic run, defying the broader market trend! 🚀
The price action is exceptionally strong. Is this the definitive breakout to a new All-Time High?
{spot}(SEIUSDT)
🏔️
Profit-taking or continuing to HODL for the moon? 👀
Volume is surging alongside the price, indicating massive institutional and retail interest. Be cautious, but don't ignore the momentum!
Let me know your strategy in the comments! 👇
#SEI #SeiNetwork #CryptoAlert #AltcoinSeason #Trading
$SEI Goes Parabolic! Massive Breakout Confirmed? 🚀🛑
$SEI I is on a parabolic run, defying the broader market trend! 🚀
The price action is exceptionally strong. Is this the definitive breakout to a new All-Time High?
🏔️
Profit-taking or continuing to HODL for the moon? 👀
Volume is surging alongside the price, indicating massive institutional and retail interest. Be cautious, but don't ignore the momentum!
Let me know your strategy in the comments! 👇
#SEI #SeiNetwork #CryptoAlert #AltcoinSeason #Trading
The price action is exceptionally strong. Is this the definitive breakout to a new All-Time High?
🏔️
Profit-taking or continuing to HODL for the moon? 👀
Volume is surging alongside the price, indicating massive institutional and retail interest. Be cautious, but don't ignore the momentum!
Let me know your strategy in the comments! 👇
#SEI #SeiNetwork #CryptoAlert #AltcoinSeason #Trading
6
2.7k

·
--
SEI buy pressure is strengthening.
Buy Share
15m 82.5% | 1h 45.9%
4h 52.2% | 12h 47.5% | 1D 41.4%
15m Flow
Buy $54.22K | Sell $11.50K
Net +$42.71K | B/S 4.71
Cash Share 0.1%
Market
12h 49.6% | 1D 46.9%
Order Book: Bid-heavy (1.28)
Buy-side flow is also supported by bid-heavy order-book depth.
RADAVOX Market Intelligence
#SEI #Crypto
SEI buy pressure is strengthening.
Buy Share
15m 82.5% | 1h 45.9%
4h 52.2% | 12h 47.5% | 1D 41.4%
15m Flow
Buy $54.22K | Sell $11.50K
Net +$42.71K | B/S 4.71
Cash Share 0.1%
Market
12h 49.6% | 1D 46.9%
Order Book: Bid-heavy (1.28)
Buy-side flow is also supported by bid-heavy order-book depth.
RADAVOX Market Intelligence
#SEI #Crypto
Buy Share
15m 82.5% | 1h 45.9%
4h 52.2% | 12h 47.5% | 1D 41.4%
15m Flow
Buy $54.22K | Sell $11.50K
Net +$42.71K | B/S 4.71
Cash Share 0.1%
Market
12h 49.6% | 1D 46.9%
Order Book: Bid-heavy (1.28)
Buy-side flow is also supported by bid-heavy order-book depth.
RADAVOX Market Intelligence
#SEI #Crypto
52


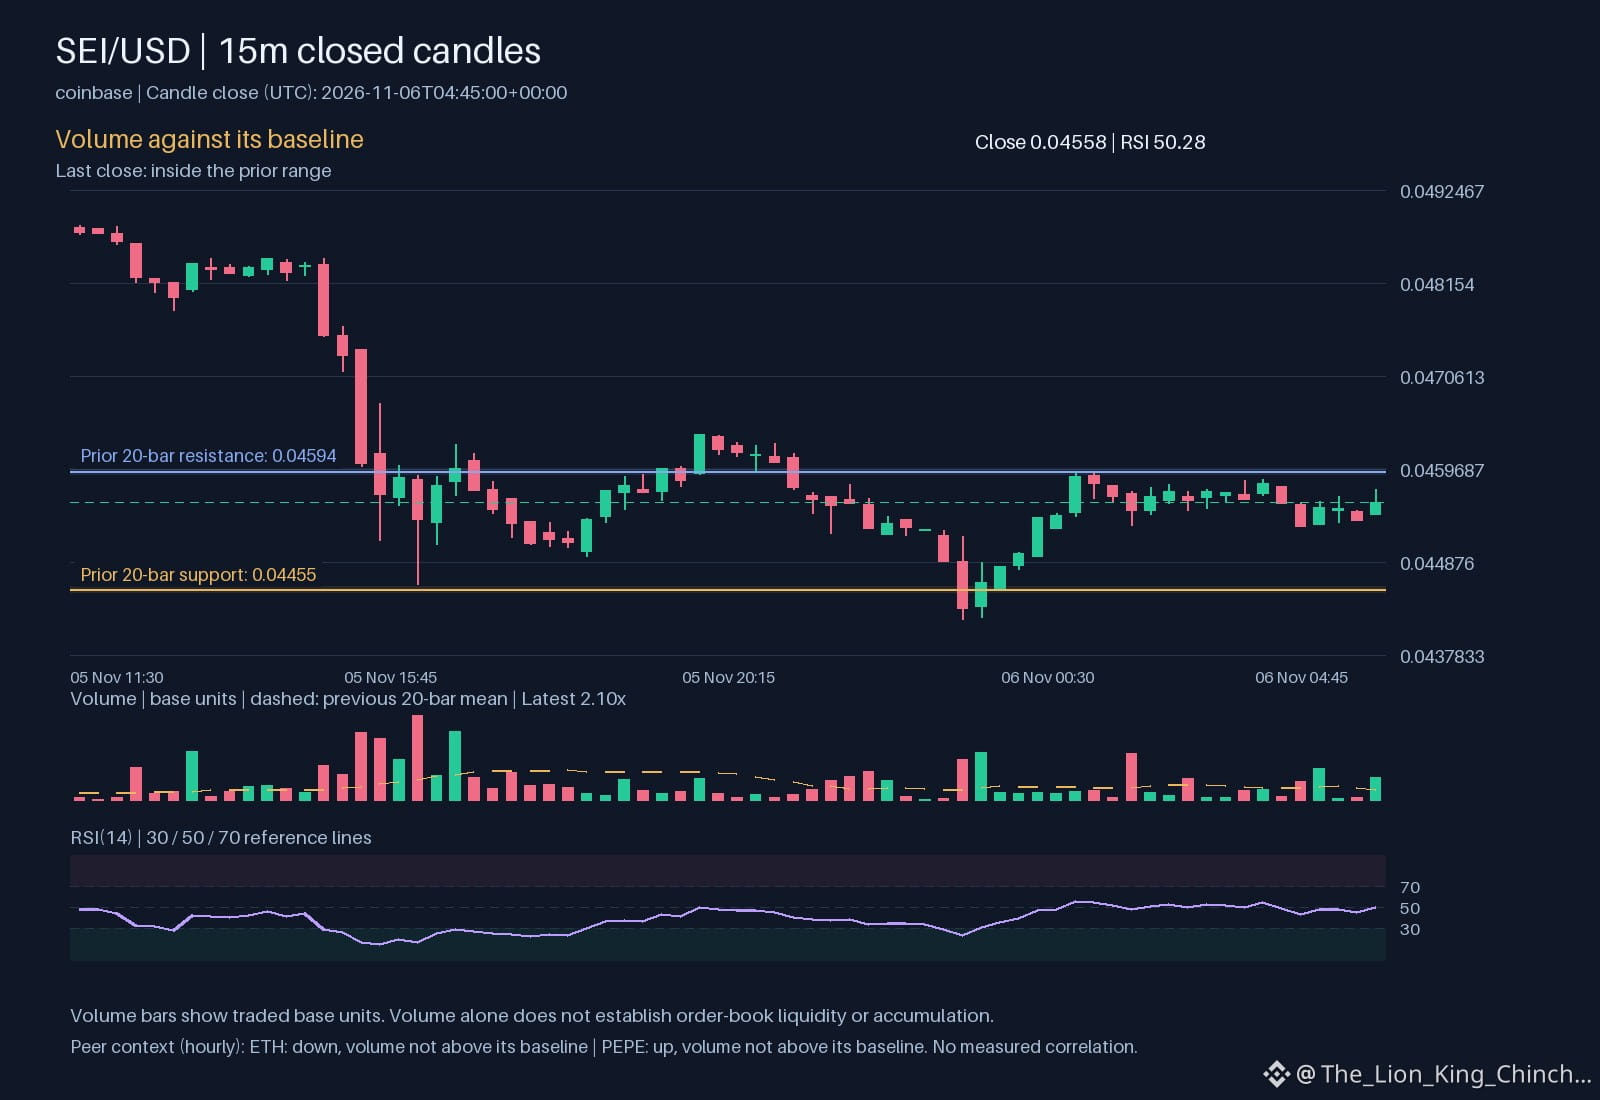
$SEI: Volume vs. Persistence
Primary Observation
SEI trades 0.04558 with hourly direction up. Volume sits 2.10417 above baseline. This suggests active buyers, but does not confirm trend durability. Peer Context
ETH moves down hourly with volume not above baseline. PEPE moves up hourly with volume not above baseline. These assets sit on the same venue. Shared direction does not mean correlation, rotation, sector membership or a common cause. The difference may reflect liquidity profiles or local order flow. Explaining Time Horizon
Hourly moves show short-term momentum changes. Daily trends reflect sustained participation. If SEI holds above 0.0455336 while volume stays elevated, the move gains structural support. However, if price reverts to 0.0464282 without follow-through, the initial impulse may have been transient. Comparison Limits
These observations describe state at a moment. They do not measure causality. Capital may not be rotating between these pairs; participants may simply be reacting to different local events. We cannot infer a market-wide leader from this snapshot. Reassessment Filter
Watch whether SEI maintains position relative to 0.0455336 during the next daily close. Look for volume behavior on the next hourly candle. If volume drops while price consolidates, test the previous thesis. If volume expands on breakout attempts, reassess strength. Use only verified next-step signals, not assumptions.
Probabilistic market research, not a recommendation or guaranteed return.
The comparison to keep in mind: $ETH has hourly direction down and volume not above its baseline; $PEPE has hourly direction up and volume not above its baseline. This alone does not establish correlation.
Which matters more in this comparison: direction or how the move holds?
#SEI #ETH #PEPE #CryptoWatchlist
$SEI : Volume vs. Persistence
Primary Observation
SEI trades 0.04558 with hourly direction up. Volume sits 2.10417 above baseline. This suggests active buyers, but does not confirm trend durability. Peer Context
ETH moves down hourly with volume not above baseline. PEPE moves up hourly with volume not above baseline. These assets sit on the same venue. Shared direction does not mean correlation, rotation, sector membership or a common cause. The difference may reflect liquidity profiles or local order flow. Explaining Time Horizon
Hourly moves show short-term momentum changes. Daily trends reflect sustained participation. If SEI holds above 0.0455336 while volume stays elevated, the move gains structural support. However, if price reverts to 0.0464282 without follow-through, the initial impulse may have been transient. Comparison Limits
These observations describe state at a moment. They do not measure causality. Capital may not be rotating between these pairs; participants may simply be reacting to different local events. We cannot infer a market-wide leader from this snapshot. Reassessment Filter
Watch whether SEI maintains position relative to 0.0455336 during the next daily close. Look for volume behavior on the next hourly candle. If volume drops while price consolidates, test the previous thesis. If volume expands on breakout attempts, reassess strength. Use only verified next-step signals, not assumptions.
Probabilistic market research, not a recommendation or guaranteed return.
The comparison to keep in mind: $ETH has hourly direction down and volume not above its baseline; $PEPE has hourly direction up and volume not above its baseline. This alone does not establish correlation.
Which matters more in this comparison: direction or how the move holds?
#SEI #ETH #PEPE #CryptoWatchlist
Primary Observation
SEI trades 0.04558 with hourly direction up. Volume sits 2.10417 above baseline. This suggests active buyers, but does not confirm trend durability. Peer Context
ETH moves down hourly with volume not above baseline. PEPE moves up hourly with volume not above baseline. These assets sit on the same venue. Shared direction does not mean correlation, rotation, sector membership or a common cause. The difference may reflect liquidity profiles or local order flow. Explaining Time Horizon
Hourly moves show short-term momentum changes. Daily trends reflect sustained participation. If SEI holds above 0.0455336 while volume stays elevated, the move gains structural support. However, if price reverts to 0.0464282 without follow-through, the initial impulse may have been transient. Comparison Limits
These observations describe state at a moment. They do not measure causality. Capital may not be rotating between these pairs; participants may simply be reacting to different local events. We cannot infer a market-wide leader from this snapshot. Reassessment Filter
Watch whether SEI maintains position relative to 0.0455336 during the next daily close. Look for volume behavior on the next hourly candle. If volume drops while price consolidates, test the previous thesis. If volume expands on breakout attempts, reassess strength. Use only verified next-step signals, not assumptions.
Probabilistic market research, not a recommendation or guaranteed return.
The comparison to keep in mind: $ETH has hourly direction down and volume not above its baseline; $PEPE has hourly direction up and volume not above its baseline. This alone does not establish correlation.
Which matters more in this comparison: direction or how the move holds?
#SEI #ETH #PEPE #CryptoWatchlist
35

🔻 $SEI HEAVY SELLING PRESSURE MOUNTS AT THE REJECTION LEVEL AS BREAKDOWN ACCELERATES! 📉
Entry: 0.04792 🔴
Target: 0.0475743 🎯
Sellers are aggressively defending this tight resistance zone, signaling a high-conviction order flow rejection on the lower timeframes. 📊 Momentum is rolling over swiftly as buyers fail to generate absorption volume above the pivot.
⚡ As liquidity sweeps lower, the path of least resistance points directly into the immediate downside targets. 📌 Bears are executing with surgical precision while supply builds above current price action. 💬 Are you positioning short with the smart money or waiting for a relief retest? 👇
⚠️ Not financial advice. Always manage your risk. 🛡️
🏷️ #SEI #ShortSetup #Crypto #Bearish #Trading
🎯 🐻
🔻 $SEI HEAVY SELLING PRESSURE MOUNTS AT THE REJECTION LEVEL AS BREAKDOWN ACCELERATES! 📉
Entry: 0.04792 🔴
Target: 0.0475743 🎯
Sellers are aggressively defending this tight resistance zone, signaling a high-conviction order flow rejection on the lower timeframes. 📊 Momentum is rolling over swiftly as buyers fail to generate absorption volume above the pivot.
⚡ As liquidity sweeps lower, the path of least resistance points directly into the immediate downside targets. 📌 Bears are executing with surgical precision while supply builds above current price action. 💬 Are you positioning short with the smart money or waiting for a relief retest? 👇
⚠️ Not financial advice. Always manage your risk. 🛡️
🏷️ #SEI #ShortSetup #Crypto #Bearish #Trading
🎯 🐻
Entry: 0.04792 🔴
Target: 0.0475743 🎯
Sellers are aggressively defending this tight resistance zone, signaling a high-conviction order flow rejection on the lower timeframes. 📊 Momentum is rolling over swiftly as buyers fail to generate absorption volume above the pivot.
⚡ As liquidity sweeps lower, the path of least resistance points directly into the immediate downside targets. 📌 Bears are executing with surgical precision while supply builds above current price action. 💬 Are you positioning short with the smart money or waiting for a relief retest? 👇
⚠️ Not financial advice. Always manage your risk. 🛡️
🏷️ #SEI #ShortSetup #Crypto #Bearish #Trading
🎯 🐻
4

·
--
$SEI looks ready to go up from here
Buyers are stepping in near today's low of $0.04466
Buying $SEI between 0.04497 and 0.04556
Invalid below 0.04427
Taking profit at 0.04720 0.04837 0.05012
Volume is solid at $2.9M today 🚀
Sitting inside the zone as I type this
Tap $SEI to buy
Last 7 days of my calls, 32 hit target and 66 hit stop
Taking it or watching it
#SEI #TradingSignals
$SEI looks ready to go up from here
Buyers are stepping in near today's low of $0.04466
Buying $SEI between 0.04497 and 0.04556
Invalid below 0.04427
Taking profit at 0.04720 0.04837 0.05012
Volume is solid at $2.9M today 🚀
Sitting inside the zone as I type this
Tap $SEI to buy
Last 7 days of my calls, 32 hit target and 66 hit stop
Taking it or watching it
#SEI #TradingSignals
Buyers are stepping in near today's low of $0.04466
Buying $SEI between 0.04497 and 0.04556
Invalid below 0.04427
Taking profit at 0.04720 0.04837 0.05012
Volume is solid at $2.9M today 🚀
Sitting inside the zone as I type this
Tap $SEI to buy
Last 7 days of my calls, 32 hit target and 66 hit stop
Taking it or watching it
#SEI #TradingSignals
9
$SEI: Shared Moves on the Same Venue
Price action at 0.04597 sits above the short-term trend marker at 0.0471614. The hourly direction points up. Volume reads 2.75041 which is above the baseline level. This signals active participation during the current session.
Peer observations show similar hourly moves. Both $ETH and $ZEC are also moving up with volume above their baselines. This alignment might suggest a broad market lift. However, shared direction is not correlation. It does not prove capital rotation or sector membership. The venue's shared liquidity only explains simultaneous price discovery, not causal links.
The key question is how the move holds. A direction change is easy to spot. Sustained volume is harder to fake. If $SEI maintains its position above 0.0481301 while peers stall, the advantage is structural. If all assets revert together, the move was likely just a sentiment pulse. This comparison cannot establish a common cause. It only maps concurrent behavior. Use this as a filter for follow-through, not a prediction. Reassess when one asset loses volume support while others keep climbing. That divergence offers the clearest signal of independent strength.
Probabilistic market research, not a recommendation or guaranteed return.
The comparison to keep in mind: $ETH has hourly direction up and volume above its baseline; $ZEC has hourly direction up and volume above its baseline. This alone does not establish correlation.
Which matters more in this comparison: direction or how the move holds?
#SEI #ETH #ZEC
$SEI : Shared Moves on the Same Venue
Price action at 0.04597 sits above the short-term trend marker at 0.0471614. The hourly direction points up. Volume reads 2.75041 which is above the baseline level. This signals active participation during the current session.
Peer observations show similar hourly moves. Both $ETH and $ZEC are also moving up with volume above their baselines. This alignment might suggest a broad market lift. However, shared direction is not correlation. It does not prove capital rotation or sector membership. The venue's shared liquidity only explains simultaneous price discovery, not causal links.
The key question is how the move holds. A direction change is easy to spot. Sustained volume is harder to fake. If $SEI maintains its position above 0.0481301 while peers stall, the advantage is structural. If all assets revert together, the move was likely just a sentiment pulse. This comparison cannot establish a common cause. It only maps concurrent behavior. Use this as a filter for follow-through, not a prediction. Reassess when one asset loses volume support while others keep climbing. That divergence offers the clearest signal of independent strength.
Probabilistic market research, not a recommendation or guaranteed return.
The comparison to keep in mind: $ETH has hourly direction up and volume above its baseline; $ZEC has hourly direction up and volume above its baseline. This alone does not establish correlation.
Which matters more in this comparison: direction or how the move holds?
#SEI #ETH #ZEC
Price action at 0.04597 sits above the short-term trend marker at 0.0471614. The hourly direction points up. Volume reads 2.75041 which is above the baseline level. This signals active participation during the current session.
Peer observations show similar hourly moves. Both $ETH and $ZEC are also moving up with volume above their baselines. This alignment might suggest a broad market lift. However, shared direction is not correlation. It does not prove capital rotation or sector membership. The venue's shared liquidity only explains simultaneous price discovery, not causal links.
The key question is how the move holds. A direction change is easy to spot. Sustained volume is harder to fake. If $SEI maintains its position above 0.0481301 while peers stall, the advantage is structural. If all assets revert together, the move was likely just a sentiment pulse. This comparison cannot establish a common cause. It only maps concurrent behavior. Use this as a filter for follow-through, not a prediction. Reassess when one asset loses volume support while others keep climbing. That divergence offers the clearest signal of independent strength.
Probabilistic market research, not a recommendation or guaranteed return.
The comparison to keep in mind: $ETH has hourly direction up and volume above its baseline; $ZEC has hourly direction up and volume above its baseline. This alone does not establish correlation.
Which matters more in this comparison: direction or how the move holds?
#SEI #ETH #ZEC
116
·
--
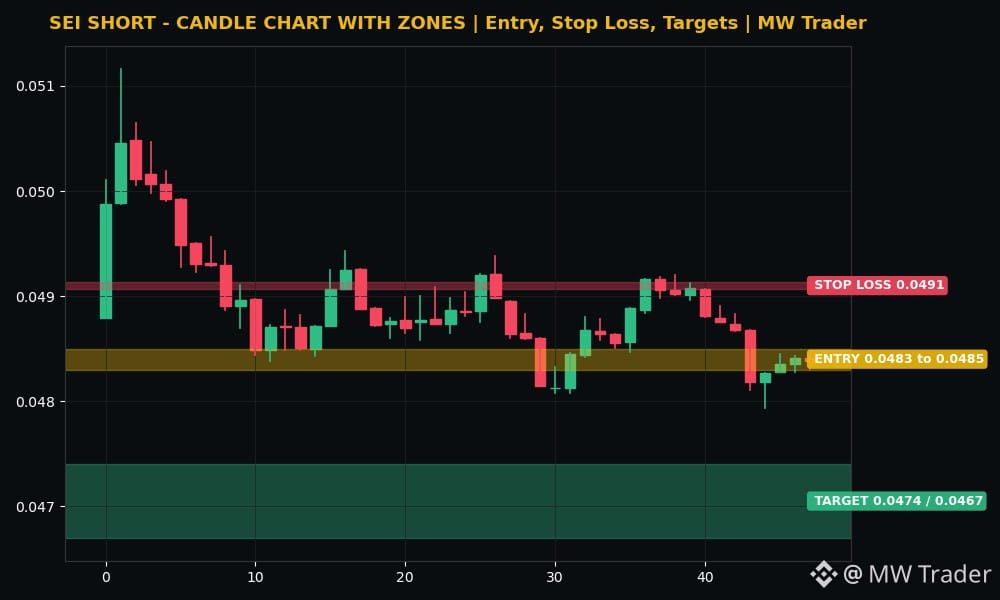
$SEI #SEI 📉
Direction: SHORT
Entry zone: 0.0483 to 0.0485
Stop loss: 0.0491
Target 1: 0.0474
Target 2: 0.0467
Sei is trading near 0.0484 dollars, inside a range of 0.0479 to 0.0512, and the recent hourly closes show a flat drift with no bounce, 0.0482, then 0.0483, then 0.0484, then 0.0484, then 0.0484. 🔴 My reading is that SEI is drifting toward the bottom of its range while Bitcoin cools under 80,000 dollars, because it gave back its earlier push toward 0.0512 and buyers have not defended the middle of the range. A short from the current zone, with a stop above 0.0491, targets 0.0474 first and then 0.0467 if sellers push through the range low. A rise above 0.0491 kills the idea without debate.
Futures trading is risky. Trade small, use a stop loss, and do your own research. This is my reading, not a guaranteed signal.
Does Sei fall to 0.0474 first, or rise above 0.0491? 🤔
Follow for more trades.
#Sei #Crypto #FuturesTrading #TradingSignals
$SEI #SEI 📉
Direction: SHORT
Entry zone: 0.0483 to 0.0485
Stop loss: 0.0491
Target 1: 0.0474
Target 2: 0.0467
Sei is trading near 0.0484 dollars, inside a range of 0.0479 to 0.0512, and the recent hourly closes show a flat drift with no bounce, 0.0482, then 0.0483, then 0.0484, then 0.0484, then 0.0484. 🔴 My reading is that SEI is drifting toward the bottom of its range while Bitcoin cools under 80,000 dollars, because it gave back its earlier push toward 0.0512 and buyers have not defended the middle of the range. A short from the current zone, with a stop above 0.0491, targets 0.0474 first and then 0.0467 if sellers push through the range low. A rise above 0.0491 kills the idea without debate.
Futures trading is risky. Trade small, use a stop loss, and do your own research. This is my reading, not a guaranteed signal.
Does Sei fall to 0.0474 first, or rise above 0.0491? 🤔
Follow for more trades.
#Sei #Crypto #FuturesTrading #TradingSignals
Direction: SHORT
Entry zone: 0.0483 to 0.0485
Stop loss: 0.0491
Target 1: 0.0474
Target 2: 0.0467
Sei is trading near 0.0484 dollars, inside a range of 0.0479 to 0.0512, and the recent hourly closes show a flat drift with no bounce, 0.0482, then 0.0483, then 0.0484, then 0.0484, then 0.0484. 🔴 My reading is that SEI is drifting toward the bottom of its range while Bitcoin cools under 80,000 dollars, because it gave back its earlier push toward 0.0512 and buyers have not defended the middle of the range. A short from the current zone, with a stop above 0.0491, targets 0.0474 first and then 0.0467 if sellers push through the range low. A rise above 0.0491 kills the idea without debate.
Futures trading is risky. Trade small, use a stop loss, and do your own research. This is my reading, not a guaranteed signal.
Does Sei fall to 0.0474 first, or rise above 0.0491? 🤔
Follow for more trades.
#Sei #Crypto #FuturesTrading #TradingSignals
14
$SEI: SEI: Missed Move, Learned Bias
The recent observation shows $SEI trading below support, the hourly direction is down, and volume sits above its baseline. This pattern triggers loss aversion, a bias where traders feel the pain of a missed profit more strongly than the fear of a loss. When price slips while volume spikes, the mind focuses on the lost upside and may push for a hurried re‑entry, hoping to recoup the missed move.
Loss aversion can distort research decisions. Instead of calmly reviewing the chart, a trader might anchor on the recent dip and ignore the broader context, such as the still‑elevated 3.07083 indicating genuine activity rather than a fleeting spike. The bias leads to a shortcut: entering a trade solely to avoid regret, rather than waiting for confirmation from a key level like 0.04783 or a reversal signal.
A practical self‑check is simple. Before placing a new order, ask yourself: “Am I acting because the price moved against me, or because the data supports a valid entry?” Write down the reason, step away for a few minutes, and then reassess the chart with fresh eyes. If the rationale remains data‑driven, proceed; if it feels driven by the sting of a missed move, consider waiting.
Probabilistic market research, not a recommendation or guaranteed return.
Would you keep the same rule after missing a move?
#SEI #TradingPsychology #CryptoLearning
$SEI : SEI: Missed Move, Learned Bias
The recent observation shows $SEI trading below support, the hourly direction is down, and volume sits above its baseline. This pattern triggers loss aversion, a bias where traders feel the pain of a missed profit more strongly than the fear of a loss. When price slips while volume spikes, the mind focuses on the lost upside and may push for a hurried re‑entry, hoping to recoup the missed move.
Loss aversion can distort research decisions. Instead of calmly reviewing the chart, a trader might anchor on the recent dip and ignore the broader context, such as the still‑elevated 3.07083 indicating genuine activity rather than a fleeting spike. The bias leads to a shortcut: entering a trade solely to avoid regret, rather than waiting for confirmation from a key level like 0.04783 or a reversal signal.
A practical self‑check is simple. Before placing a new order, ask yourself: “Am I acting because the price moved against me, or because the data supports a valid entry?” Write down the reason, step away for a few minutes, and then reassess the chart with fresh eyes. If the rationale remains data‑driven, proceed; if it feels driven by the sting of a missed move, consider waiting.
Probabilistic market research, not a recommendation or guaranteed return.
Would you keep the same rule after missing a move?
#SEI #TradingPsychology #CryptoLearning
The recent observation shows $SEI trading below support, the hourly direction is down, and volume sits above its baseline. This pattern triggers loss aversion, a bias where traders feel the pain of a missed profit more strongly than the fear of a loss. When price slips while volume spikes, the mind focuses on the lost upside and may push for a hurried re‑entry, hoping to recoup the missed move.
Loss aversion can distort research decisions. Instead of calmly reviewing the chart, a trader might anchor on the recent dip and ignore the broader context, such as the still‑elevated 3.07083 indicating genuine activity rather than a fleeting spike. The bias leads to a shortcut: entering a trade solely to avoid regret, rather than waiting for confirmation from a key level like 0.04783 or a reversal signal.
A practical self‑check is simple. Before placing a new order, ask yourself: “Am I acting because the price moved against me, or because the data supports a valid entry?” Write down the reason, step away for a few minutes, and then reassess the chart with fresh eyes. If the rationale remains data‑driven, proceed; if it feels driven by the sting of a missed move, consider waiting.
Probabilistic market research, not a recommendation or guaranteed return.
Would you keep the same rule after missing a move?
#SEI #TradingPsychology #CryptoLearning
40
·
--
$SEI looks ready to bounce up from here 🚀
RSI is at 52 so buyers still have room to run
Buy $SEI 0.04852 to 0.04891
SL 0.04776
Targets 0.05043 / 0.05150 / 0.05309
Trading volume is holding steady right at the seven day average
Price sits near the lower end of today's range at 0.04883
Sitting inside the zone as I type this
Tap $SEI to buy
#SEI #TradingSignals
$SEI looks ready to bounce up from here 🚀
RSI is at 52 so buyers still have room to run
Buy $SEI 0.04852 to 0.04891
SL 0.04776
Targets 0.05043 / 0.05150 / 0.05309
Trading volume is holding steady right at the seven day average
Price sits near the lower end of today's range at 0.04883
Sitting inside the zone as I type this
Tap $SEI to buy
#SEI #TradingSignals
RSI is at 52 so buyers still have room to run
Buy $SEI 0.04852 to 0.04891
SL 0.04776
Targets 0.05043 / 0.05150 / 0.05309
Trading volume is holding steady right at the seven day average
Price sits near the lower end of today's range at 0.04883
Sitting inside the zone as I type this
Tap $SEI to buy
#SEI #TradingSignals
1
39

·
--
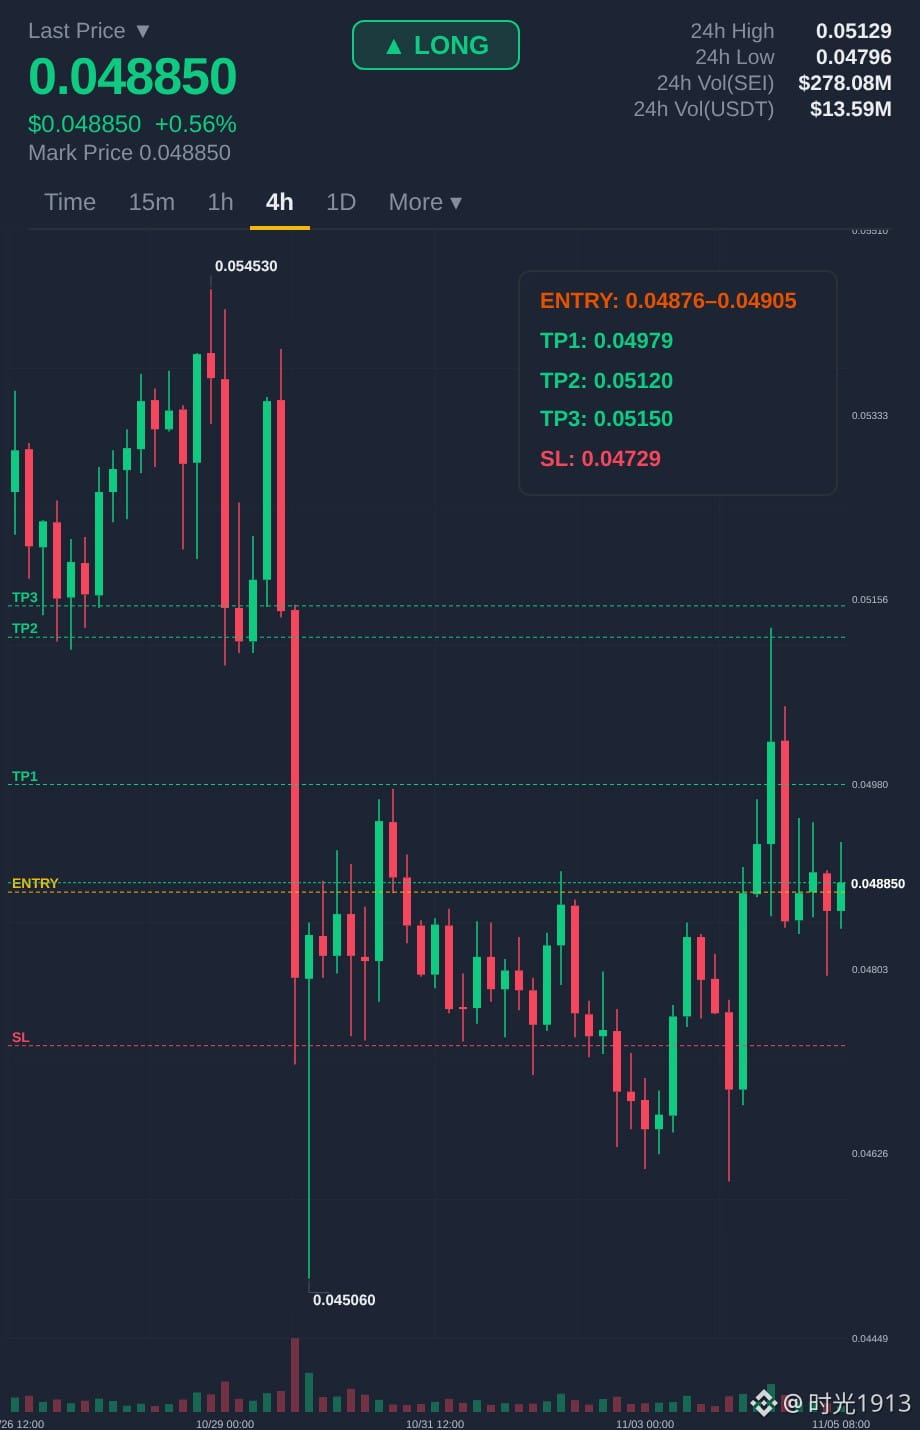
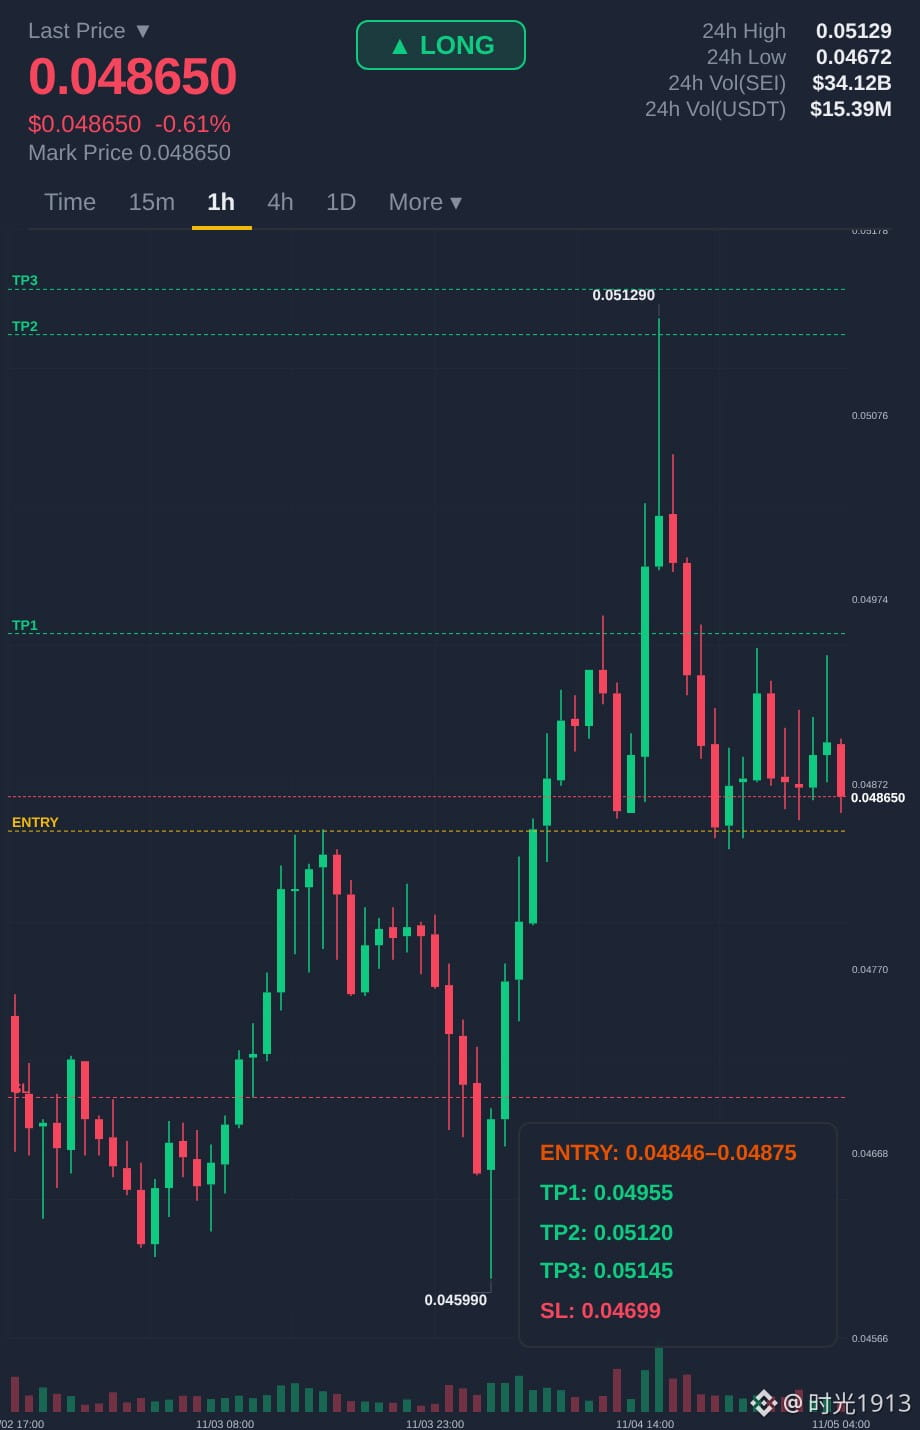
I'm opening a LONG on $SEI right here.
Entry: $0.048457 – $0.048748
TP: $0.049552 / $0.051198 / $0.051454
SL: $0.046994 👇🏻
We have support zone holding on the 1H chart, with funding at +0.010% suggesting crowded shorts, RSI: 51. Buyers stepping in at this level.
#SEI #NEAR #PENGU
Click here to go long $SEI
I'm opening a LONG on $SEI right here.
Entry: $0.048457 – $0.048748
TP: $0.049552 / $0.051198 / $0.051454
SL: $0.046994 👇🏻
We have support zone holding on the 1H chart, with funding at +0.010% suggesting crowded shorts, RSI: 51. Buyers stepping in at this level.
#SEI #NEAR #PENGU
Click here to go long $SEI
Entry: $0.048457 – $0.048748
TP: $0.049552 / $0.051198 / $0.051454
SL: $0.046994 👇🏻
We have support zone holding on the 1H chart, with funding at +0.010% suggesting crowded shorts, RSI: 51. Buyers stepping in at this level.
#SEI #NEAR #PENGU
Click here to go long $SEI
1
294
Log in to explore more content
Join global crypto users on Binance Square
⚡️ Get latest and useful information about crypto.
💬 Trusted by the world’s largest crypto exchange.
👍 Discover real insights from verified creators.
Email / Phone number
Trending Topics
1
#BitcoinRebounds$75KAsChipsLead
5,714 views
106 Discussing
2
#JobsReportRaisesHikeOdds
86,513 views
859 Discussing
3
#US Data Center Rules May Constrain AI Expansion
10,879 views
94 Discussing
4
#$2TWipedOutHedgeFundsFaceLiquidation
13,165 views
98 Discussing
5
#WillAnthropicListOnTime
11,712 views
242 Discussing
6
#USNovemberMichiganExpectationsIndexPrelimAt50.9
20,396 views
341 Discussing
7
#OilPlungesBelow$100
20,402 views
38 Discussing
8
#TradFiForBeginners
12,406 views
219 Discussing
9
#USMidtermsCouldShakeUpUS-IranTies
39,603 views
508 Discussing
10
#RussianCentralBankNamesBTCETHUSDTForNonQualifiedInvestors
760 views
11 Discussing