
Alpha RWA research
11 Posts

Alpha RWA research
Report
Block User
RWA/DeFi and Ai research
X : https://x.com/alphacyl
0 Following
99 Followers
11 Liked
Posts
All
Videos
Article
The Yield You Can Actually Buy: Reading the Basis Between Primary NAV and Secondary PriceIndependent Research | @alphacyl
Not financial advice.
I. Two Prices for One Token
A yield product publishes a yield that assumes you buy at NAV and hold through the issuer's redemption process. A secondary buyer pays a market price instead. The gap between that price and the redeemable value is the basis : b = P(secondary) / NAV(exit) − 1.
A buyer who holds until redemption earns the primary yield plus the discount closing. A buyer who later sells at the same basis earns the primary yield alone. The basis only pays if it moves between entry and exit, so its variance matters more than its level.
This paper argues that the basis is a market price for three things the primary yield leaves out: waiting time, access restrictions, and counterparty risk. I read it across sUSDe, #syrupusdc , USDY and the permissioned Treasury funds, and show where it is a clean signal and where it is noise.
II. Mechanism One: Measure Against the Right NAV
A basis is only as good as its denominator. @maplefinance 's pools keep two conversion rates: one for deposits that ignores unrealized losses, and one for withdrawals that deducts them, which stops depositors from gaming the timing around a known default.
governance.aave.com/t/arfc-onboard…
The withdrawal rate is exposed in the contract as `convertToExitAssets`, and it is the rate a redeemer actually receives (docs.maple.finance/llms-full.txt). A secondary price should be compared with that rate, not with the deposit rate.
Yield-versus-benchmark comparisons need the same care. A widely cited tokenization "discount" of seventy to eighty basis points is computed by subtracting a maturity matched Treasury yield from a product's published APY. A June 2026 preprint argues those two numbers use incompatible conventions: its reconciliations are individually signed and together of the order of tens of basis points, comparable to the headline discount, and of four products that met its data conditions, exactly one was admissible.
arxiv.org/html/2606.1382…
NBER working paper 35412 uses @DefiLlama pool yields from May 2024 to May 2026 and finds the pure issuer products priced at small negative premiums to the three month Treasury yield, consistent with management fees: BUIDL about −13 bps, #USTB about −22 bps and USYC about −49 bps.
nber.org/system/files/w…
So the stack has three layers: the T-bill benchmark, the primary NAV yield net of fees, and the secondary price. Each layer needs reconciled day counts, fees and accrual calendars before any gap is read as economics.
III. Mechanism Two: Who Closes the Gap
In #ETFs , authorized participants arbitrage the gap between price and NAV (invesco.com/apac/en/instit…). A BIS working paper adds that bond ETFs often trade at a premium or discount to NAV, and that a premium can persist while NAV lags the price, until NAV catches up.
bis.org/publ/work975.p…
For tokens, the arbitrageur needs primary access, and access varies sharply.
sUSDe unstakes through a cooldown, during which the holder earns no yield. @Ethena_Labs 's docs describe a cooldown that is now dynamic, between 1 and 7 days, set by governance according to reserve conditions (docs.ethena.fi/video-guides/h…). Arbitrageurs buy the discount, unstake, and wait, so the wait is the cost, and the discount tracks it.
governance.aave.com/t/llamarisk-in…
syrupUSDC exits through a first myin, vout queue, processed as liquidity becomes available (docs.maple.finance/legal/syrupusd…). Maple's docs say a queued withdrawal continues to earn interest until it is processed, and that anyone swapping on a DEX bears fees and slippage and earns nothing after the swap.
docs.maple.finance/syrupusdc-usdt…
One third party review claims that yield stops once a request is queued, which conflicts with Maple's own docs, so I used the docs. The same review puts typical processing at minutes to 2 days, with up to 30 days in low-liquidity cases.
curation.yearn.fi/report/maple-s…
USDY is permissioned for non-US investors with KYC, a $100,000 primary minimum and daily redemption.
rwa.xyz/assets/usdy
An August 2025 Arrakis review found its onchain liquidity shallow and fragmented, spread across orca , Camelot and @osmosiszone , with redemption queue based for whitelisted users.
arrakis.finance/blog/stress-te…
$BUIDL and $OUSG have no open AMM. One how to guide says BUIDL has a permissioned secondary market through @Securitize Markets ATS and that OUSG and USDY trade thinly on some DEX pools.
eco.com/support/en/art…
For primary only products, no public secondary price exists, so no public basis exists.
IV. Mechanism Three: Principal Tokens Write the Basis Down
@pendle_fi 's principal tokens (PTs) make the basis explicit. A PT trades at a discount to par and redeems at par at maturity, so the discount is a fixed yield. @LlamaRisk 's August 25, 2026 review of PT sUSDe 26NOV2026, 93 days from maturity, found an implied yield of 4.72% against an underlying sUSDe APY of 4.25%, a PT discount to par of 1.16%, and a 47 bp spread that it describes as the market premium for locking in a fixed rate.
governance.aave.com/t/direct-to-ai…
My check: a 1.16% discount over 93 days is about 4.6% to 4.7% annualized, which matches. In March, @LlamaRisk 's review of the June maturities showed PT sUSDe near 4.10% and PT-USDe near 3.01%.
governance.aave.com/t/direct-to-ai…
A PT therefore splits a product's yield into the floating rate and a market priced fixed rate premium, which is the kind of decomposition a secondary yield analysis wants.
V. Cases
Case One: the sUSDe cooldown as a natural experiment. LlamaRisk's March 13, 2026 review covered 607 daily observations under the 7-day cooldown. sUSDe traded at a mean deviation of −0.168% from fair value, with a maximum discount of −1.270% and a maximum premium of +0.079%, and it sat at a discount on 91.9% of days. LlamaRisk calls the discount the cost impatient sellers pay to bypass the wait.
governance.aave.com/t/llamarisk-in…
By its August 25 review the cooldown stood at one day. sUSDe traded at $1.2446 against an internal rate of 1.2449, with deviations ranging from +0.09% to −0.21% and a median of −0.02%.
governance.aave.com/t/direct-to-ai…
My arithmetic: at the 5.8% implied rate LlamaRisk reported in March, seven days of yield is about 0.111%, so the −0.168% mean discount was roughly 1.5 times the yield forgone. At August's 4.25% APY, one day of yield is about 0.012%, so the −0.02% median was roughly 1.7 times. The statistics and rates differ across the two periods, so I read it as an observation. In both regimes the discount ran a bit above the yield given up while waiting. The 1.27% maximum equals about 80 days of yield at 5.8%.
Case Two: syrupUSDC under stress. LlamaRisk's July 17, 2026 review found the @Uniswap v4 pool trading at a mean discount of about 9 bps to the internal rate. The largest deviation, 22 bps, came on April 20, 2026 during the KelpDAO exploit, and it returned to the usual level afterward. The same review measured that holders could swap 9.35 million syrupUSDC, worth up to $10.96 million, for USDC within 4% price impact, with liquidity dependent on a single provider and venue.
governance.aave.com/t/arfc-onboard…
On Base, an earlier review found a maximum deviation of 14 bps between the pool and the internal exit rate.
governance.aave.com/t/direct-to-ai…
A fast queue and a priced exit rate kept the basis in tens of basis points through a stress event.
Case Three: xUSD and a basis that measured credit. In November 2025, markets using hardcoded or "base value" feeds priced Stream's xUSD from reported backing and not from the spot price.
chaincatcher.com/en/article/221…
@eulerfinance markets on @Plasma carried $107 million of xUSD collateral at $1.27 while the market, per CoinShares, was screaming otherwise.
etp.coinshares.com/insights/the-n…
xUSD touched a low of $0.30 on @coingecko data.
yellow.com/news/xusd-stab…
One analysis puts MEVCapital 's exposure at $25.42 million with about $650,000 of bad debt, as its oracle held $1.26 against a $0.23 market price. It also reports that Elixir redeemed about 80% of other deUSD holders at 1:1.
techflowpost.com/en-US/article/…
elixir said on November 3 that it had full redemption rights at $1 with Stream.
thedefiant.io/news/defi/how-…
The holder with primary rights had a claim worth par, and the secondary holder had a price near thirty cents. The stated yield and NAV said nothing about that.
Case Four: USDY, where the basis is unreadable. On August 24, 2026, USDY showed a $2.16 billion market cap and $421,040 of 24-hour volume, about 0.02% of cap. Aggregator venue prints ranged from $1.00 to $1.14.
cryptoslate.com/?p=424087
A premium or discount measured on prints like these is noise. DefiLlama separately lists a USDY price near $1.15 and a native yield of 3.74%.
defillama.com/rwa/asset/USDY
VI. The Structural Question: Signal or Noise?
A basis carries signal when the secondary market is deep enough to price. For sUSDe and syrupUSDC, the data show a basis that moves with the exit mechanism: it narrowed when the cooldown shortened, and it stayed in tens of basis points through a stress event when the queue was fast. A pickup from a persistent discount also needs primary access. A buyer who cannot redeem earns the primary yield plus any basis change, and the discount pays only if it closes.
The basis carries noise when volume is a rounding error, as with USDY, or when the denominator is wrong. The academic cautions in Section II apply: reconcile conventions first, and treat a basis on thin prints as a flag to investigate.
A reader's method. For any yield token, (1) take the exit NAV, not the headline NAV; (2) take the secondary price from a pool with real depth; (3) compare the basis with the yield forgone over the redemption lag; (4) read a jump as credit.
VII. Where the Research Points
This paper's thesis is that the basis, tracked across products, is the market's price for waiting, access and credit, and that it belongs next to the headline yield. Four things to watch:
1. sUSDe's basis under the one day cooldown, and whether its median stays near −0.02%.
2. syrupUSDC's basis in a month when the withdrawal queue lengthens.
3. The first permissioned AMM pools for Treasury funds, which would give BUIDL and OUSG type products a public basis.
4. PT spreads as a term premium for RWA tokens beyond @ethena .
Independent research. Not financial advice. Always conduct your own due diligence.
The Yield You Can Actually Buy: Reading the Basis Between Primary NAV and Secondary Price
Independent Research | @alphacyl
Not financial advice.
I. Two Prices for One Token
A yield product publishes a yield that assumes you buy at NAV and hold through the issuer's redemption process. A secondary buyer pays a market price instead. The gap between that price and the redeemable value is the basis : b = P(secondary) / NAV(exit) − 1.
A buyer who holds until redemption earns the primary yield plus the discount closing. A buyer who later sells at the same basis earns the primary yield alone. The basis only pays if it moves between entry and exit, so its variance matters more than its level.
This paper argues that the basis is a market price for three things the primary yield leaves out: waiting time, access restrictions, and counterparty risk. I read it across sUSDe, #syrupusdc , USDY and the permissioned Treasury funds, and show where it is a clean signal and where it is noise.
II. Mechanism One: Measure Against the Right NAV
A basis is only as good as its denominator. @Maple Finance Official 's pools keep two conversion rates: one for deposits that ignores unrealized losses, and one for withdrawals that deducts them, which stops depositors from gaming the timing around a known default.
governance.aave.com/t/arfc-onboard…
The withdrawal rate is exposed in the contract as `convertToExitAssets`, and it is the rate a redeemer actually receives (docs.maple.finance/llms-full.txt). A secondary price should be compared with that rate, not with the deposit rate.
Yield-versus-benchmark comparisons need the same care. A widely cited tokenization "discount" of seventy to eighty basis points is computed by subtracting a maturity matched Treasury yield from a product's published APY. A June 2026 preprint argues those two numbers use incompatible conventions: its reconciliations are individually signed and together of the order of tens of basis points, comparable to the headline discount, and of four products that met its data conditions, exactly one was admissible.
arxiv.org/html/2606.1382…
NBER working paper 35412 uses @DefiLlama pool yields from May 2024 to May 2026 and finds the pure issuer products priced at small negative premiums to the three month Treasury yield, consistent with management fees: BUIDL about −13 bps, #USTB about −22 bps and USYC about −49 bps.
nber.org/system/files/w…
So the stack has three layers: the T-bill benchmark, the primary NAV yield net of fees, and the secondary price. Each layer needs reconciled day counts, fees and accrual calendars before any gap is read as economics.
III. Mechanism Two: Who Closes the Gap
In #ETFs , authorized participants arbitrage the gap between price and NAV (invesco.com/apac/en/instit…). A BIS working paper adds that bond ETFs often trade at a premium or discount to NAV, and that a premium can persist while NAV lags the price, until NAV catches up.
bis.org/publ/work975.p…
For tokens, the arbitrageur needs primary access, and access varies sharply.
sUSDe unstakes through a cooldown, during which the holder earns no yield. @Ethena Labs 's docs describe a cooldown that is now dynamic, between 1 and 7 days, set by governance according to reserve conditions (docs.ethena.fi/video-guides/h…). Arbitrageurs buy the discount, unstake, and wait, so the wait is the cost, and the discount tracks it.
governance.aave.com/t/llamarisk-in…
syrupUSDC exits through a first myin, vout queue, processed as liquidity becomes available (docs.maple.finance/legal/syrupusd…). Maple's docs say a queued withdrawal continues to earn interest until it is processed, and that anyone swapping on a DEX bears fees and slippage and earns nothing after the swap.
docs.maple.finance/syrupusdc-usdt…
One third party review claims that yield stops once a request is queued, which conflicts with Maple's own docs, so I used the docs. The same review puts typical processing at minutes to 2 days, with up to 30 days in low-liquidity cases.
curation.yearn.fi/report/maple-s…
USDY is permissioned for non-US investors with KYC, a $100,000 primary minimum and daily redemption.
rwa.xyz/assets/usdy
An August 2025 Arrakis review found its onchain liquidity shallow and fragmented, spread across orca , Camelot and @Osmosis Zone , with redemption queue based for whitelisted users.
arrakis.finance/blog/stress-te…
$BUIDL and $OUSG have no open AMM. One how to guide says BUIDL has a permissioned secondary market through @Securitize Markets ATS and that OUSG and USDY trade thinly on some DEX pools.
eco.com/support/en/art…
For primary only products, no public secondary price exists, so no public basis exists.
IV. Mechanism Three: Principal Tokens Write the Basis Down
@Pendle 's principal tokens (PTs) make the basis explicit. A PT trades at a discount to par and redeems at par at maturity, so the discount is a fixed yield. @LlamaRisk 's August 25, 2026 review of PT sUSDe 26NOV2026, 93 days from maturity, found an implied yield of 4.72% against an underlying sUSDe APY of 4.25%, a PT discount to par of 1.16%, and a 47 bp spread that it describes as the market premium for locking in a fixed rate.
governance.aave.com/t/direct-to-ai…
My check: a 1.16% discount over 93 days is about 4.6% to 4.7% annualized, which matches. In March, @LlamaRisk 's review of the June maturities showed PT sUSDe near 4.10% and PT-USDe near 3.01%.
governance.aave.com/t/direct-to-ai…
A PT therefore splits a product's yield into the floating rate and a market priced fixed rate premium, which is the kind of decomposition a secondary yield analysis wants.
V. Cases
Case One: the sUSDe cooldown as a natural experiment. LlamaRisk's March 13, 2026 review covered 607 daily observations under the 7-day cooldown. sUSDe traded at a mean deviation of −0.168% from fair value, with a maximum discount of −1.270% and a maximum premium of +0.079%, and it sat at a discount on 91.9% of days. LlamaRisk calls the discount the cost impatient sellers pay to bypass the wait.
governance.aave.com/t/llamarisk-in…
By its August 25 review the cooldown stood at one day. sUSDe traded at $1 .2446 against an internal rate of 1.2449, with deviations ranging from +0.09% to −0.21% and a median of −0.02%.
governance.aave.com/t/direct-to-ai…
My arithmetic: at the 5.8% implied rate LlamaRisk reported in March, seven days of yield is about 0.111%, so the −0.168% mean discount was roughly 1.5 times the yield forgone. At August's 4.25% APY, one day of yield is about 0.012%, so the −0.02% median was roughly 1.7 times. The statistics and rates differ across the two periods, so I read it as an observation. In both regimes the discount ran a bit above the yield given up while waiting. The 1.27% maximum equals about 80 days of yield at 5.8%.
Case Two: syrupUSDC under stress. LlamaRisk's July 17, 2026 review found the @Uniswap v4 pool trading at a mean discount of about 9 bps to the internal rate. The largest deviation, 22 bps, came on April 20, 2026 during the KelpDAO exploit, and it returned to the usual level afterward. The same review measured that holders could swap 9.35 million syrupUSDC, worth up to $10.96 million, for USDC within 4% price impact, with liquidity dependent on a single provider and venue.
governance.aave.com/t/arfc-onboard…
On Base, an earlier review found a maximum deviation of 14 bps between the pool and the internal exit rate.
governance.aave.com/t/direct-to-ai…
A fast queue and a priced exit rate kept the basis in tens of basis points through a stress event.
Case Three: xUSD and a basis that measured credit. In November 2025, markets using hardcoded or "base value" feeds priced Stream's xUSD from reported backing and not from the spot price.
chaincatcher.com/en/article/221…
@eulerfinance markets on @Plasma carried $107 million of xUSD collateral at $1 .27 while the market, per CoinShares, was screaming otherwise.
etp.coinshares.com/insights/the-n…
xUSD touched a low of $0.30 on @coingecko data.
yellow.com/news/xusd-stab…
One analysis puts MEVCapital 's exposure at $25.42 million with about $650,000 of bad debt, as its oracle held $1 .26 against a $0.23 market price. It also reports that Elixir redeemed about 80% of other deUSD holders at 1:1.
techflowpost.com/en-US/article/…
elixir said on November 3 that it had full redemption rights at $1 with Stream.
thedefiant.io/news/defi/how-…
The holder with primary rights had a claim worth par, and the secondary holder had a price near thirty cents. The stated yield and NAV said nothing about that.
Case Four: USDY, where the basis is unreadable. On August 24, 2026, USDY showed a $2.16 billion market cap and $421,040 of 24-hour volume, about 0.02% of cap. Aggregator venue prints ranged from $1 .00 to $1 .14.
cryptoslate.com/?p=424087
A premium or discount measured on prints like these is noise. DefiLlama separately lists a USDY price near $1 .15 and a native yield of 3.74%.
defillama.com/rwa/asset/USDY
VI. The Structural Question: Signal or Noise?
A basis carries signal when the secondary market is deep enough to price. For sUSDe and syrupUSDC, the data show a basis that moves with the exit mechanism: it narrowed when the cooldown shortened, and it stayed in tens of basis points through a stress event when the queue was fast. A pickup from a persistent discount also needs primary access. A buyer who cannot redeem earns the primary yield plus any basis change, and the discount pays only if it closes.
The basis carries noise when volume is a rounding error, as with USDY, or when the denominator is wrong. The academic cautions in Section II apply: reconcile conventions first, and treat a basis on thin prints as a flag to investigate.
A reader's method. For any yield token, (1) take the exit NAV, not the headline NAV; (2) take the secondary price from a pool with real depth; (3) compare the basis with the yield forgone over the redemption lag; (4) read a jump as credit.
VII. Where the Research Points
This paper's thesis is that the basis, tracked across products, is the market's price for waiting, access and credit, and that it belongs next to the headline yield. Four things to watch:
1. sUSDe's basis under the one day cooldown, and whether its median stays near −0.02%.
2. syrupUSDC's basis in a month when the withdrawal queue lengthens.
3. The first permissioned AMM pools for Treasury funds, which would give BUIDL and OUSG type products a public basis.
4. PT spreads as a term premium for RWA tokens beyond @ethena .
Independent research. Not financial advice. Always conduct your own due diligence.
Not financial advice.
I. Two Prices for One Token
A yield product publishes a yield that assumes you buy at NAV and hold through the issuer's redemption process. A secondary buyer pays a market price instead. The gap between that price and the redeemable value is the basis : b = P(secondary) / NAV(exit) − 1.
A buyer who holds until redemption earns the primary yield plus the discount closing. A buyer who later sells at the same basis earns the primary yield alone. The basis only pays if it moves between entry and exit, so its variance matters more than its level.
This paper argues that the basis is a market price for three things the primary yield leaves out: waiting time, access restrictions, and counterparty risk. I read it across sUSDe, #syrupusdc , USDY and the permissioned Treasury funds, and show where it is a clean signal and where it is noise.
II. Mechanism One: Measure Against the Right NAV
A basis is only as good as its denominator. @Maple Finance Official 's pools keep two conversion rates: one for deposits that ignores unrealized losses, and one for withdrawals that deducts them, which stops depositors from gaming the timing around a known default.
governance.aave.com/t/arfc-onboard…
The withdrawal rate is exposed in the contract as `convertToExitAssets`, and it is the rate a redeemer actually receives (docs.maple.finance/llms-full.txt). A secondary price should be compared with that rate, not with the deposit rate.
Yield-versus-benchmark comparisons need the same care. A widely cited tokenization "discount" of seventy to eighty basis points is computed by subtracting a maturity matched Treasury yield from a product's published APY. A June 2026 preprint argues those two numbers use incompatible conventions: its reconciliations are individually signed and together of the order of tens of basis points, comparable to the headline discount, and of four products that met its data conditions, exactly one was admissible.
arxiv.org/html/2606.1382…
NBER working paper 35412 uses @DefiLlama pool yields from May 2024 to May 2026 and finds the pure issuer products priced at small negative premiums to the three month Treasury yield, consistent with management fees: BUIDL about −13 bps, #USTB about −22 bps and USYC about −49 bps.
nber.org/system/files/w…
So the stack has three layers: the T-bill benchmark, the primary NAV yield net of fees, and the secondary price. Each layer needs reconciled day counts, fees and accrual calendars before any gap is read as economics.
III. Mechanism Two: Who Closes the Gap
In #ETFs , authorized participants arbitrage the gap between price and NAV (invesco.com/apac/en/instit…). A BIS working paper adds that bond ETFs often trade at a premium or discount to NAV, and that a premium can persist while NAV lags the price, until NAV catches up.
bis.org/publ/work975.p…
For tokens, the arbitrageur needs primary access, and access varies sharply.
sUSDe unstakes through a cooldown, during which the holder earns no yield. @Ethena Labs 's docs describe a cooldown that is now dynamic, between 1 and 7 days, set by governance according to reserve conditions (docs.ethena.fi/video-guides/h…). Arbitrageurs buy the discount, unstake, and wait, so the wait is the cost, and the discount tracks it.
governance.aave.com/t/llamarisk-in…
syrupUSDC exits through a first myin, vout queue, processed as liquidity becomes available (docs.maple.finance/legal/syrupusd…). Maple's docs say a queued withdrawal continues to earn interest until it is processed, and that anyone swapping on a DEX bears fees and slippage and earns nothing after the swap.
docs.maple.finance/syrupusdc-usdt…
One third party review claims that yield stops once a request is queued, which conflicts with Maple's own docs, so I used the docs. The same review puts typical processing at minutes to 2 days, with up to 30 days in low-liquidity cases.
curation.yearn.fi/report/maple-s…
USDY is permissioned for non-US investors with KYC, a $100,000 primary minimum and daily redemption.
rwa.xyz/assets/usdy
An August 2025 Arrakis review found its onchain liquidity shallow and fragmented, spread across orca , Camelot and @Osmosis Zone , with redemption queue based for whitelisted users.
arrakis.finance/blog/stress-te…
$BUIDL and $OUSG have no open AMM. One how to guide says BUIDL has a permissioned secondary market through @Securitize Markets ATS and that OUSG and USDY trade thinly on some DEX pools.
eco.com/support/en/art…
For primary only products, no public secondary price exists, so no public basis exists.
IV. Mechanism Three: Principal Tokens Write the Basis Down
@Pendle 's principal tokens (PTs) make the basis explicit. A PT trades at a discount to par and redeems at par at maturity, so the discount is a fixed yield. @LlamaRisk 's August 25, 2026 review of PT sUSDe 26NOV2026, 93 days from maturity, found an implied yield of 4.72% against an underlying sUSDe APY of 4.25%, a PT discount to par of 1.16%, and a 47 bp spread that it describes as the market premium for locking in a fixed rate.
governance.aave.com/t/direct-to-ai…
My check: a 1.16% discount over 93 days is about 4.6% to 4.7% annualized, which matches. In March, @LlamaRisk 's review of the June maturities showed PT sUSDe near 4.10% and PT-USDe near 3.01%.
governance.aave.com/t/direct-to-ai…
A PT therefore splits a product's yield into the floating rate and a market priced fixed rate premium, which is the kind of decomposition a secondary yield analysis wants.
V. Cases
Case One: the sUSDe cooldown as a natural experiment. LlamaRisk's March 13, 2026 review covered 607 daily observations under the 7-day cooldown. sUSDe traded at a mean deviation of −0.168% from fair value, with a maximum discount of −1.270% and a maximum premium of +0.079%, and it sat at a discount on 91.9% of days. LlamaRisk calls the discount the cost impatient sellers pay to bypass the wait.
governance.aave.com/t/llamarisk-in…
By its August 25 review the cooldown stood at one day. sUSDe traded at $1 .2446 against an internal rate of 1.2449, with deviations ranging from +0.09% to −0.21% and a median of −0.02%.
governance.aave.com/t/direct-to-ai…
My arithmetic: at the 5.8% implied rate LlamaRisk reported in March, seven days of yield is about 0.111%, so the −0.168% mean discount was roughly 1.5 times the yield forgone. At August's 4.25% APY, one day of yield is about 0.012%, so the −0.02% median was roughly 1.7 times. The statistics and rates differ across the two periods, so I read it as an observation. In both regimes the discount ran a bit above the yield given up while waiting. The 1.27% maximum equals about 80 days of yield at 5.8%.
Case Two: syrupUSDC under stress. LlamaRisk's July 17, 2026 review found the @Uniswap v4 pool trading at a mean discount of about 9 bps to the internal rate. The largest deviation, 22 bps, came on April 20, 2026 during the KelpDAO exploit, and it returned to the usual level afterward. The same review measured that holders could swap 9.35 million syrupUSDC, worth up to $10.96 million, for USDC within 4% price impact, with liquidity dependent on a single provider and venue.
governance.aave.com/t/arfc-onboard…
On Base, an earlier review found a maximum deviation of 14 bps between the pool and the internal exit rate.
governance.aave.com/t/direct-to-ai…
A fast queue and a priced exit rate kept the basis in tens of basis points through a stress event.
Case Three: xUSD and a basis that measured credit. In November 2025, markets using hardcoded or "base value" feeds priced Stream's xUSD from reported backing and not from the spot price.
chaincatcher.com/en/article/221…
@eulerfinance markets on @Plasma carried $107 million of xUSD collateral at $1 .27 while the market, per CoinShares, was screaming otherwise.
etp.coinshares.com/insights/the-n…
xUSD touched a low of $0.30 on @coingecko data.
yellow.com/news/xusd-stab…
One analysis puts MEVCapital 's exposure at $25.42 million with about $650,000 of bad debt, as its oracle held $1 .26 against a $0.23 market price. It also reports that Elixir redeemed about 80% of other deUSD holders at 1:1.
techflowpost.com/en-US/article/…
elixir said on November 3 that it had full redemption rights at $1 with Stream.
thedefiant.io/news/defi/how-…
The holder with primary rights had a claim worth par, and the secondary holder had a price near thirty cents. The stated yield and NAV said nothing about that.
Case Four: USDY, where the basis is unreadable. On August 24, 2026, USDY showed a $2.16 billion market cap and $421,040 of 24-hour volume, about 0.02% of cap. Aggregator venue prints ranged from $1 .00 to $1 .14.
cryptoslate.com/?p=424087
A premium or discount measured on prints like these is noise. DefiLlama separately lists a USDY price near $1 .15 and a native yield of 3.74%.
defillama.com/rwa/asset/USDY
VI. The Structural Question: Signal or Noise?
A basis carries signal when the secondary market is deep enough to price. For sUSDe and syrupUSDC, the data show a basis that moves with the exit mechanism: it narrowed when the cooldown shortened, and it stayed in tens of basis points through a stress event when the queue was fast. A pickup from a persistent discount also needs primary access. A buyer who cannot redeem earns the primary yield plus any basis change, and the discount pays only if it closes.
The basis carries noise when volume is a rounding error, as with USDY, or when the denominator is wrong. The academic cautions in Section II apply: reconcile conventions first, and treat a basis on thin prints as a flag to investigate.
A reader's method. For any yield token, (1) take the exit NAV, not the headline NAV; (2) take the secondary price from a pool with real depth; (3) compare the basis with the yield forgone over the redemption lag; (4) read a jump as credit.
VII. Where the Research Points
This paper's thesis is that the basis, tracked across products, is the market's price for waiting, access and credit, and that it belongs next to the headline yield. Four things to watch:
1. sUSDe's basis under the one day cooldown, and whether its median stays near −0.02%.
2. syrupUSDC's basis in a month when the withdrawal queue lengthens.
3. The first permissioned AMM pools for Treasury funds, which would give BUIDL and OUSG type products a public basis.
4. PT spreads as a term premium for RWA tokens beyond @ethena .
Independent research. Not financial advice. Always conduct your own due diligence.
803

Article
2021 vs 2026: Is Bitcoin Repeating History, or Has the Market Fundamentally ChangedIndependent Research | @AlphaCyl
The central question behind this research is whether $BTC Bitcoin is experiencing another familiar market cycle transition or whether the forces shaping its current market have changed enough to make comparisons with 2021 misleading.
I want to examine this through market structure, liquidity, institutional participation, leverage, regulation, investor behaviour and Bitcoin's relationship with traditional financial markets.
One distinction will guide the entire analysis: similar price behaviour does not necessarily mean similar market conditions. To establish whether history is repeating, we need to compare the forces producing the price movements, not simply the charts.
I. THE PRICE SIMILARITY: WHAT THE CHARTS ACTUALLY SHOW
The 2021 bull market reached its November all-time high at approximately $68,789 on November 10. Bitcoin subsequently declined, closing the year at approximately $46,306. CoinGlass
https://www.coinglass.com/currencies/BTC/historical-data/2021?utm_source=chatgpt.com
However, the November peak was not the first major correction of that cycle.
In April 2021, Bitcoin had already reached approximately $64,000 before falling sharply in May. The market experienced a correction exceeding 50%, followed by several months of recovery and a new all time high in November.
This matters because 2021 demonstrated that a substantial correction did not immediately terminate the bull market.
Now consider the current cycle.
Bitcoin reached approximately $126,198 on October 6, 2025. By November 21, 2026, its price had fallen to approximately $55,830, representing a drawdown of roughly 55.8% from that high. @Coinglasse +1
https://www.coinglass.com/currencies/BTC/historical-data/2025?utm_source=chatgpt.com
The 2021 May June figure is an approximate peak to trough correction. The November December figure uses Glassnode's December 2021 reported drawdown from the November ATH. The 2026 figure uses the October 2025 ATH and November 21, 2026 price.
There is a resemblance in the magnitude of the corrections, but the market's position in the cycle is different.
The October 2025 high occurred approximately 18 months after the April 2024 halving. The November 2021 high also occurred roughly 18 months after the May 2020 halving. Bitcoin +2
https://www.coinglass.com/currencies/BTC/historical-data/2025?utm_source=chatgpt.com
This is an interesting historical alignment.
Both cycles experienced a major price peak around 18 months after their respective halvings. However, the current November 2026 market is already more than a year removed from its October 2025 high.
My interpretation: Bitcoin has followed a comparable post-halving peak timeline, but the present decline has progressed into a much deeper drawdown. The four-year cycle remains a useful historical reference, not a reliable timetable for predicting the next bottom.
II. THE LIQUIDITY ENVIRONMENT: 2021 AND 2026 ARE DIFFERENT MARKETS
One of the biggest differences between these periods is the monetary environment.
In November 2021, the Federal Reserve maintained its federal funds target range at 0–0.25%.
It had also begun tapering its asset purchases, reducing monthly Treasury and mortgage-backed securities purchases by $10 billion and $5 billion, respectively. The Fed still described financial conditions as accommodative.
https://www.federalreserve.gov/newsevents/pressreleases/monetary20211103a.htm
https://www.federalreserve.gov/monetarypolicy/fomcminutes20211103.htm
This is important because Bitcoin's 2021 rally developed during an environment of exceptionally low interest rates, substantial central-bank support and abundant liquidity.
By comparison, the Federal Reserve's November 2026 data show:
Federal funds target range: 3.75–4.00%.
September PCE inflation: 3.6%.
October unemployment: 4.1%.
https://www.federalreserve.gov/
The Fed's October meeting minutes, published November 18, provide additional context on its current monetary policy considerations. federalreserve.gov
The difference is substantial.
In 2021, investors could access relatively inexpensive capital while searching for assets offering higher returns. Bitcoin and other speculative assets benefited from that environment.
In 2026, capital has a higher opportunity cost. Investors can earn returns from traditional fixed-income instruments without necessarily accepting Bitcoin's volatility.
This changes the investment decision.
When interest rates are elevated, Bitcoin must compete more directly for capital. Investors have to consider whether the expected return justifies the volatility and potential drawdown.
There is also a second consideration: monetary tightening does not affect Bitcoin in isolation. It can influence equity valuations, borrowing costs, dollar liquidity, leveraged positions and the willingness of investors to hold speculative assets.
The current decline has coincided with concerns about AI valuations, the profitability of infrastructure spending and rising borrowing costs. Reuters reported that these concerns were affecting technology stocks and broader risk assets alongside crypto.
https://www.reuters.com/business/bitcoin-falls-357-56814-2026-11-21/
This provides evidence of a broader risk repricing rather than a purely crypto specific event.
III. INSTITUTIONAL PARTICIPATION: THE BIGGEST STRUCTURAL CHANGE
Perhaps the most important difference between 2021 and 2026 is who now participates in Bitcoin's market.
In 2021, institutional adoption was already developing. Tesla, #MicroStrategy and other companies had introduced corporate Bitcoin treasury strategies. CME Bitcoin futures also provided regulated institutional exposure.
However, the US spot Bitcoin ETF market did not yet exist.
That changed in January 2024, when US spot Bitcoin ETFs began trading.
The result is a fundamentally different capital distribution system.
Investors can now obtain Bitcoin exposure through regulated investment products without directly managing private keys, operating exchange accounts or holding Bitcoin themselves.
This has expanded access through wealth managers, financial advisers and traditional investment platforms.
Consider the institutional ownership data.
According to Galaxy Research's analysis of Q3 2026 SEC Form 13F filings:
- Reporting investment managers held a record 356,491 BTC-equivalent across US spot Bitcoin ETPs as of September 30.
- They added 49,229 BTC-equivalent during Q3, reversing the 47,054 BTC-equivalent they had sold across the preceding three quarters.
- 2,166 managers reported holdings, an increase of 191 from the previous quarter.
https://www.galaxy.com/insights/research/bitcoin-etp-13f-institutional-holdings-q3-2026-wealth-channel-wells-fargo
These are meaningful figures.
But they require careful interpretation.
Form 13F reports qualifying long positions at quarter end. It does not reveal all short positions, derivatives exposure or the complete economic intentions of the reporting institutions.
A fund reporting Bitcoin ETF ownership could have an offsetting position elsewhere.
Consequently, institutional ownership figures cannot automatically be interpreted as directional bullish exposure.
The more interesting question is whether institutional access has changed Bitcoin's sensitivity to traditional financial markets.
I believe this deserves serious attention.
The ETF structure connects Bitcoin demand to portfolio allocations, wealth-management decisions, risk limits and traditional investment flows.
It also introduces another channel through which capital can leave the market.
IV. ARE INSTITUTIONS SELLING #bitcoin ?
This is where the current market becomes particularly interesting.
There is evidence of institutional selling, but the data also shows that institutional behaviour is not uniform.
@CoinDesk Research's October 2026 institutional adoption report found that:
- Combined ETP and digital-asset treasury exposure declined 10.3% to $279 billion.
- ETPs recorded $1.86 billion in net outflows.
- Corporate digital-asset treasuries added approximately $1.16 billion to their holdings.
- Bitcoin ETPs still recorded $87.4 million in October net inflows.
https://www.coindesk.com/research/digital-assets-institutional-adoption-report-october-2026
The report also estimated that publicly traded ETPs and digital asset treasury companies collectively represented approximately 13.7% of Bitcoin's circulating supply.
That is a considerable structural change compared with 2021.
But November brought a more pronounced deterioration in ETF flows.
By November 20, US spot Bitcoin #ETFs had recorded approximately $3.47 billion in net outflows for the month. The November 19 session alone produced $582.2 million in net redemptions.
https://www.theblock.co/news/markets/2026-11-20-us-spot-bitcoin-etfs-see-582-million-in-daily-net-outflows-as-november-total-nears-3-5-billion-444217
These figures indicate a meaningful reduction in ETF demand.
However, there is a distinction between three things:
- Institutions reducing exposure through ETF redemptions.
- Corporate treasuries selling Bitcoin from their balance sheets.
- Institutional investors maintaining Bitcoin exposure while hedging through derivatives.
They are different transactions with different implications.
For example, an ETF redemption can result in the fund selling Bitcoin to meet the redemption process. But it does not establish that the asset manager itself has changed its long term view of Bitcoin.
Likewise, a reduction in the dollar value of corporate Bitcoin holdings can result from falling prices rather than actual BTC sales.
This distinction is supported by October's institutional data, where much of the reduction in exposure was valuation driven.
The evidence supports institutional repositioning and weakening ETF demand. It does not yet establish a coordinated institutional exit from Bitcoin.
V. LEVERAGE AND MARKET STRUCTURE: HAVE WE LEARNED ANYTHING?
Bitcoin's 2021 market was heavily influenced by derivatives positioning.
Glassnode's December 2021 market review reported that Bitcoin futures open interest had nearly doubled over the year, increasing by $9.57 billion, or 97%.
The same research documented a major liquidation event in early December, when Bitcoin fell approximately $8,800 in one day and more than $5.4 billion in futures contracts were forcibly closed.
https://research.glassnode.com/the-week-onchain-week-52-2021/
This illustrates an important characteristic of crypto markets: price declines can become self-reinforcing when leveraged traders are forced to close positions.
Consider the mechanics:
- Bitcoin declines and leveraged long positions lose collateral.
- Exchanges liquidate positions that no longer meet margin requirements.
- Liquidations generate additional selling pressure.
- Prices decline further, exposing additional leveraged positions.
- The process can develop into a liquidation cascade.
This mechanism existed in 2021 and remains relevant in 2026.
However, we should not assume that the current market has the same leverage profile simply because prices are falling.
A proper comparison requires contemporaneous futures open interest, funding rates, perpetual futures basis, options positioning and liquidation data.
The distinction between spot selling and forced derivatives liquidation is particularly important for traders.
A market experiencing heavy spot distribution has a different underlying demand problem from one experiencing a temporary derivatives-driven liquidation cascade.
VI. THE STABLECOIN ECONOMY: A MUCH LARGER MARKET
Another structural difference is the growth of stablecoins.
According to CoinDesk Research's February 2026 industry report, stablecoin market capitalization had exceeded $300 billion, compared with less than $50 billion in early 2020.
The same report estimated that weekly stablecoin transaction volumes averaged approximately $60 billion, compared with around $30 billion during the previous cycle.
https://www.coindesk.com/research/digital-assets-2026-above-the-noise?
2020 figure represents an approximate upper reference of less than $50B; 2026 is reported as exceeding $300B. coindesk.com
Why does this matter?
Stablecoins provide settlement liquidity, trading collateral and a dollar denominated medium of exchange across crypto markets.
Their growth indicates that the ecosystem has developed a substantially larger liquidity infrastructure.
But there is an important qualification.
Stablecoin market capitalization does not equal capital waiting to purchase Bitcoin.
Stablecoins also support payments, exchange settlement, DeFi lending, liquidity pools and cross-border transfers. Some balances remain inactive or are held for purposes unrelated to directional Bitcoin investment.
Therefore, a larger stablecoin economy improves the potential capacity of crypto markets, but it does not guarantee immediate demand for BTC.
This is one area where the 2026 market has stronger underlying infrastructure than 2021, even while Bitcoin's price performance has deteriorated.
VII. REGULATION: IS GOVERNMENT POLICY REPEATING THE 2021 STORY?
Regulatory uncertainty affected Bitcoin in 2021, but the circumstances were different.
One of the most significant events was China's crackdown on cryptocurrency mining and related activities.
The restrictions triggered a major geographical redistribution of Bitcoin mining operations. Glassnode's 2021 review documented an approximately 53% mining shutdown during the migration, followed by a substantial recovery in network hash rate by year-end.
https://research.glassnode.com/the-week-onchain-week-52-2021/
That episode demonstrated that government policy could materially affect Bitcoin's mining industry, infrastructure and market sentiment.
But it did not give China control over Bitcoin's monetary policy or transaction rules.
The network continued operating.
In 2026, the regulatory environment is more developed, particularly in the United States.
Bitcoin has regulated exchange traded products, more established institutional custody channels and a broader financial services infrastructure.
However, regulatory uncertainty remains relevant.
Reuters identified political and regulatory risks following the November 2026 US midterm elections as one of several concerns affecting crypto markets.
https://www.reuters.com/business/bitcoin-falls-357-56814-2026-11-21/
We should separate three regulatory effects:
- Market access: Rules affecting whether banks, funds and investment platforms can provide crypto services.
- Capital movement: Rules affecting custody, taxation, stablecoins and institutional participation.
- Market confidence: Political uncertainty that changes expectations about the future operating environment.
These can influence Bitcoin's price without changing the underlying protocol.
There is currently insufficient evidence to attribute the November decline primarily to government attempts to control Bitcoin.
Regulatory uncertainty is a factor worth monitoring, but the contemporaneous evidence also points to macroeconomic pressure, ETF redemptions and declining risk appetite.
VIII. WHAT HAS ACTUALLY CHANGED BETWEEN THE TWO CYCLES?
The comparison becomes clearer when we separate Bitcoin's market structure from its underlying infrastructure.
Sources:
https://www.federalreserve.gov/newsevents/pressreleases/monetary20211103a.htm
https://www.federalreserve.gov/
https://www.coindesk.com/research/digital-assets-2026-above-the-noise
https://research.glassnode.com/the-week-onchain-week-52-2021/
https://www.galaxy.com/insights/research/bitcoin-etp-13f-institutional-holdings-q3-2026-wealth-channel-wells-fargo?
The table reveals something important.
Bitcoin has become more integrated into traditional financial markets, but that integration has introduced additional channels through which macroeconomic conditions and portfolio decisions can influence its price.
A larger market does not automatically mean a less volatile market.
A deeper capital base does not guarantee that investors will maintain their allocations during periods of uncertainty.
And institutional ownership does not eliminate the possibility of substantial drawdowns.
IX. SO, ARE WE REPEATING 2021?
My conclusion is that Bitcoin is repeating some of the historical cycle characteristics, but the market itself has fundamentally changed.
There are three important similarities.
First, cycle timing. Both the November 2021 and October 2025 peaks occurred approximately 18 months after their respective halvings.
Second, leverage and liquidity. Both markets demonstrate how changes in risk appetite, derivatives positioning and liquidity can accelerate price declines.
Third, institutional and macroeconomic influences. Both cycles were affected by monetary policy and changing investor expectations, although the channels through which those forces operate have expanded considerably.
But the differences are more consequential.
The 2021 market developed in an exceptionally accommodative monetary environment, with relatively limited institutional investment infrastructure.
The 2026 market has a much larger stablecoin economy, regulated spot ETFs, corporate Bitcoin treasuries and significantly deeper connections to traditional financial markets.
Yet these developments have not prevented a drawdown exceeding 55% from the October 2025 high.
That raises an important question about Bitcoin's evolving investment proposition.
Institutional adoption has expanded access and created additional sources of demand. It has also connected Bitcoin more closely to conventional portfolio allocation decisions.
When institutional investors reduce risk, Bitcoin can experience selling pressure alongside equities and other risk assets.
This does not invalidate Bitcoin's monetary properties or long-term investment thesis. It does mean that its market behaviour must be understood through a broader financial framework.
What traders should monitor next
Rather than relying on historical cycle predictions alone, I would monitor these indicators:
These indicators should be evaluated together. No single one establishes that a market bottom or recovery has arrived.
X. THE FINAL THESIS
Bitcoin's current decline deserves to be examined beyond the familiar four-year cycle narrative.
The 2021 market was shaped by retail speculation, expanding derivatives exposure, pandemic-era liquidity and an emerging institutional market.
The 2026 market operates with a substantially different financial architecture. ETFs, corporate treasuries, stablecoins, institutional custody and traditional investment platforms now play much larger roles.
But institutional participation has not made Bitcoin immune to traditional financial conditions. If anything, it has created additional transmission channels between conventional markets and crypto.
The current evidence points to weakening ETF demand, a more restrictive monetary environment than in 2021, and a broader reassessment of risk assets. Corporate accumulation and institutional ownership data also demonstrate that capital is not moving in one direction.
I would therefore resist declaring that the four-year cycle has been invalidated or that Bitcoin must repeat the 2021–2022 bear market.
The more useful conclusion is that historical cycle patterns remain relevant, but the market structure producing them has evolved.
Bitcoin has become more institutional without becoming less exposed to market risk.
And that may be the most important distinction traders need to understand when comparing 2021 with 2026.
Independent research. Not financial advice. Data and market conditions referenced through November 21, 2026.
Research references and verification
[CoinGlass – Bitcoin historical price data, 2021](https://www.coinglass.com/currencies/BTC/historical-data/2021)
[CoinGlass – Bitcoin historical price data, 2025–2026](https://www.coinglass.com/currencies/BTC/historical-data/2025).
[Glassnode – The Week Onchain, Week 52, 2021](https://research.glassnode.com/the-week-onchain-week-52-2021/).
[Glassnode – The Week Onchain, Week 49, 2021](https://research.glassnode.com/week-onchain-week-49-2021/).
[Federal Reserve – November 3, 2021 FOMC statement](https://www.federalreserve.gov/newsevents/pressreleases/monetary20211103a.htm).
[Federal Reserve – Current economic indicators, November 2026](https://www.federalreserve.gov/).
[Galaxy Research – Institutional Holdings of Bitcoin ETPs Reach New All-Time High, November 19,](https://www.galaxy.com/insights/research/bitcoin-etp-13f-institutional-holdings-q3-2026-wealth-channel-wells-fargo).
[CoinDesk Research – Digital Assets Institutional Adoption, October 2026](https://www.coindesk.com/research/digital-assets-institutional-adoption-report-october-2026?).
[CoinDesk Research – Digital Assets 2026: Above the Noise](https://www.coindesk.com/research/digital-assets-2026-above-the-noise).
[Reuters – Bitcoin falls to its lowest in two years, November 21, 2026](https://www.reuters.com/business/bitcoin-falls-357-56814-2026-11-21/).
2021 vs 2026: Is Bitcoin Repeating History, or Has the Market Fundamentally Changed
Independent Research | @AlphaCyl
The central question behind this research is whether $BTC Bitcoin is experiencing another familiar market cycle transition or whether the forces shaping its current market have changed enough to make comparisons with 2021 misleading.
I want to examine this through market structure, liquidity, institutional participation, leverage, regulation, investor behaviour and Bitcoin's relationship with traditional financial markets.
One distinction will guide the entire analysis: similar price behaviour does not necessarily mean similar market conditions. To establish whether history is repeating, we need to compare the forces producing the price movements, not simply the charts.
I. THE PRICE SIMILARITY: WHAT THE CHARTS ACTUALLY SHOW
The 2021 bull market reached its November all-time high at approximately $68,789 on November 10. Bitcoin subsequently declined, closing the year at approximately $46,306. CoinGlass
https://www.coinglass.com/currencies/BTC/historical-data/2021?utm_source=chatgpt.com
However, the November peak was not the first major correction of that cycle.
In April 2021, Bitcoin had already reached approximately $64,000 before falling sharply in May. The market experienced a correction exceeding 50%, followed by several months of recovery and a new all time high in November.
This matters because 2021 demonstrated that a substantial correction did not immediately terminate the bull market.
Now consider the current cycle.
Bitcoin reached approximately $126,198 on October 6, 2025. By November 21, 2026, its price had fallen to approximately $55,830, representing a drawdown of roughly 55.8% from that high. @Coinglass +1
https://www.coinglass.com/currencies/BTC/historical-data/2025?utm_source=chatgpt.com
The 2021 May June figure is an approximate peak to trough correction. The November December figure uses Glassnode's December 2021 reported drawdown from the November ATH. The 2026 figure uses the October 2025 ATH and November 21, 2026 price.
There is a resemblance in the magnitude of the corrections, but the market's position in the cycle is different.
The October 2025 high occurred approximately 18 months after the April 2024 halving. The November 2021 high also occurred roughly 18 months after the May 2020 halving. Bitcoin +2
https://www.coinglass.com/currencies/BTC/historical-data/2025?utm_source=chatgpt.com
This is an interesting historical alignment.
Both cycles experienced a major price peak around 18 months after their respective halvings. However, the current November 2026 market is already more than a year removed from its October 2025 high.
My interpretation: Bitcoin has followed a comparable post-halving peak timeline, but the present decline has progressed into a much deeper drawdown. The four-year cycle remains a useful historical reference, not a reliable timetable for predicting the next bottom.
II. THE LIQUIDITY ENVIRONMENT: 2021 AND 2026 ARE DIFFERENT MARKETS
One of the biggest differences between these periods is the monetary environment.
In November 2021, the Federal Reserve maintained its federal funds target range at 0–0.25%.
It had also begun tapering its asset purchases, reducing monthly Treasury and mortgage-backed securities purchases by $10 billion and $5 billion, respectively. The Fed still described financial conditions as accommodative.
https://www.federalreserve.gov/newsevents/pressreleases/monetary20211103a.htm
https://www.federalreserve.gov/monetarypolicy/fomcminutes20211103.htm
This is important because Bitcoin's 2021 rally developed during an environment of exceptionally low interest rates, substantial central-bank support and abundant liquidity.
By comparison, the Federal Reserve's November 2026 data show:
Federal funds target range: 3.75–4.00%.
September PCE inflation: 3.6%.
October unemployment: 4.1%.
https://www.federalreserve.gov/
The Fed's October meeting minutes, published November 18, provide additional context on its current monetary policy considerations. federalreserve.gov
The difference is substantial.
In 2021, investors could access relatively inexpensive capital while searching for assets offering higher returns. Bitcoin and other speculative assets benefited from that environment.
In 2026, capital has a higher opportunity cost. Investors can earn returns from traditional fixed-income instruments without necessarily accepting Bitcoin's volatility.
This changes the investment decision.
When interest rates are elevated, Bitcoin must compete more directly for capital. Investors have to consider whether the expected return justifies the volatility and potential drawdown.
There is also a second consideration: monetary tightening does not affect Bitcoin in isolation. It can influence equity valuations, borrowing costs, dollar liquidity, leveraged positions and the willingness of investors to hold speculative assets.
The current decline has coincided with concerns about AI valuations, the profitability of infrastructure spending and rising borrowing costs. Reuters reported that these concerns were affecting technology stocks and broader risk assets alongside crypto.
https://www.reuters.com/business/bitcoin-falls-357-56814-2026-11-21/
This provides evidence of a broader risk repricing rather than a purely crypto specific event.
III. INSTITUTIONAL PARTICIPATION: THE BIGGEST STRUCTURAL CHANGE
Perhaps the most important difference between 2021 and 2026 is who now participates in Bitcoin's market.
In 2021, institutional adoption was already developing. Tesla, #MicroStrategy and other companies had introduced corporate Bitcoin treasury strategies. CME Bitcoin futures also provided regulated institutional exposure.
However, the US spot Bitcoin ETF market did not yet exist.
That changed in January 2024, when US spot Bitcoin ETFs began trading.
The result is a fundamentally different capital distribution system.
Investors can now obtain Bitcoin exposure through regulated investment products without directly managing private keys, operating exchange accounts or holding Bitcoin themselves.
This has expanded access through wealth managers, financial advisers and traditional investment platforms.
Consider the institutional ownership data.
According to Galaxy Research's analysis of Q3 2026 SEC Form 13F filings:
- Reporting investment managers held a record 356,491 BTC-equivalent across US spot Bitcoin ETPs as of September 30.
- They added 49,229 BTC-equivalent during Q3, reversing the 47,054 BTC-equivalent they had sold across the preceding three quarters.
- 2,166 managers reported holdings, an increase of 191 from the previous quarter.
https://www.galaxy.com/insights/research/bitcoin-etp-13f-institutional-holdings-q3-2026-wealth-channel-wells-fargo
These are meaningful figures.
But they require careful interpretation.
Form 13F reports qualifying long positions at quarter end. It does not reveal all short positions, derivatives exposure or the complete economic intentions of the reporting institutions.
A fund reporting Bitcoin ETF ownership could have an offsetting position elsewhere.
Consequently, institutional ownership figures cannot automatically be interpreted as directional bullish exposure.
The more interesting question is whether institutional access has changed Bitcoin's sensitivity to traditional financial markets.
I believe this deserves serious attention.
The ETF structure connects Bitcoin demand to portfolio allocations, wealth-management decisions, risk limits and traditional investment flows.
It also introduces another channel through which capital can leave the market.
IV. ARE INSTITUTIONS SELLING #bitcoin ?
This is where the current market becomes particularly interesting.
There is evidence of institutional selling, but the data also shows that institutional behaviour is not uniform.
@CoinDesk Research's October 2026 institutional adoption report found that:
- Combined ETP and digital-asset treasury exposure declined 10.3% to $279 billion.
- ETPs recorded $1.86 billion in net outflows.
- Corporate digital-asset treasuries added approximately $1.16 billion to their holdings.
- Bitcoin ETPs still recorded $87.4 million in October net inflows.
https://www.coindesk.com/research/digital-assets-institutional-adoption-report-october-2026
The report also estimated that publicly traded ETPs and digital asset treasury companies collectively represented approximately 13.7% of Bitcoin's circulating supply.
That is a considerable structural change compared with 2021.
But November brought a more pronounced deterioration in ETF flows.
By November 20, US spot Bitcoin #ETFs had recorded approximately $3.47 billion in net outflows for the month. The November 19 session alone produced $582.2 million in net redemptions.
https://www.theblock.co/news/markets/2026-11-20-us-spot-bitcoin-etfs-see-582-million-in-daily-net-outflows-as-november-total-nears-3-5-billion-444217
These figures indicate a meaningful reduction in ETF demand.
However, there is a distinction between three things:
- Institutions reducing exposure through ETF redemptions.
- Corporate treasuries selling Bitcoin from their balance sheets.
- Institutional investors maintaining Bitcoin exposure while hedging through derivatives.
They are different transactions with different implications.
For example, an ETF redemption can result in the fund selling Bitcoin to meet the redemption process. But it does not establish that the asset manager itself has changed its long term view of Bitcoin.
Likewise, a reduction in the dollar value of corporate Bitcoin holdings can result from falling prices rather than actual BTC sales.
This distinction is supported by October's institutional data, where much of the reduction in exposure was valuation driven.
The evidence supports institutional repositioning and weakening ETF demand. It does not yet establish a coordinated institutional exit from Bitcoin.
V. LEVERAGE AND MARKET STRUCTURE: HAVE WE LEARNED ANYTHING?
Bitcoin's 2021 market was heavily influenced by derivatives positioning.
Glassnode's December 2021 market review reported that Bitcoin futures open interest had nearly doubled over the year, increasing by $9.57 billion, or 97%.
The same research documented a major liquidation event in early December, when Bitcoin fell approximately $8,800 in one day and more than $5.4 billion in futures contracts were forcibly closed.
https://research.glassnode.com/the-week-onchain-week-52-2021/
This illustrates an important characteristic of crypto markets: price declines can become self-reinforcing when leveraged traders are forced to close positions.
Consider the mechanics:
- Bitcoin declines and leveraged long positions lose collateral.
- Exchanges liquidate positions that no longer meet margin requirements.
- Liquidations generate additional selling pressure.
- Prices decline further, exposing additional leveraged positions.
- The process can develop into a liquidation cascade.
This mechanism existed in 2021 and remains relevant in 2026.
However, we should not assume that the current market has the same leverage profile simply because prices are falling.
A proper comparison requires contemporaneous futures open interest, funding rates, perpetual futures basis, options positioning and liquidation data.
The distinction between spot selling and forced derivatives liquidation is particularly important for traders.
A market experiencing heavy spot distribution has a different underlying demand problem from one experiencing a temporary derivatives-driven liquidation cascade.
VI. THE STABLECOIN ECONOMY: A MUCH LARGER MARKET
Another structural difference is the growth of stablecoins.
According to CoinDesk Research's February 2026 industry report, stablecoin market capitalization had exceeded $300 billion, compared with less than $50 billion in early 2020.
The same report estimated that weekly stablecoin transaction volumes averaged approximately $60 billion, compared with around $30 billion during the previous cycle.
https://www.coindesk.com/research/digital-assets-2026-above-the-noise?
2020 figure represents an approximate upper reference of less than $50B; 2026 is reported as exceeding $300B. coindesk.com
Why does this matter?
Stablecoins provide settlement liquidity, trading collateral and a dollar denominated medium of exchange across crypto markets.
Their growth indicates that the ecosystem has developed a substantially larger liquidity infrastructure.
But there is an important qualification.
Stablecoin market capitalization does not equal capital waiting to purchase Bitcoin.
Stablecoins also support payments, exchange settlement, DeFi lending, liquidity pools and cross-border transfers. Some balances remain inactive or are held for purposes unrelated to directional Bitcoin investment.
Therefore, a larger stablecoin economy improves the potential capacity of crypto markets, but it does not guarantee immediate demand for BTC.
This is one area where the 2026 market has stronger underlying infrastructure than 2021, even while Bitcoin's price performance has deteriorated.
VII. REGULATION: IS GOVERNMENT POLICY REPEATING THE 2021 STORY?
Regulatory uncertainty affected Bitcoin in 2021, but the circumstances were different.
One of the most significant events was China's crackdown on cryptocurrency mining and related activities.
The restrictions triggered a major geographical redistribution of Bitcoin mining operations. Glassnode's 2021 review documented an approximately 53% mining shutdown during the migration, followed by a substantial recovery in network hash rate by year-end.
https://research.glassnode.com/the-week-onchain-week-52-2021/
That episode demonstrated that government policy could materially affect Bitcoin's mining industry, infrastructure and market sentiment.
But it did not give China control over Bitcoin's monetary policy or transaction rules.
The network continued operating.
In 2026, the regulatory environment is more developed, particularly in the United States.
Bitcoin has regulated exchange traded products, more established institutional custody channels and a broader financial services infrastructure.
However, regulatory uncertainty remains relevant.
Reuters identified political and regulatory risks following the November 2026 US midterm elections as one of several concerns affecting crypto markets.
https://www.reuters.com/business/bitcoin-falls-357-56814-2026-11-21/
We should separate three regulatory effects:
- Market access: Rules affecting whether banks, funds and investment platforms can provide crypto services.
- Capital movement: Rules affecting custody, taxation, stablecoins and institutional participation.
- Market confidence: Political uncertainty that changes expectations about the future operating environment.
These can influence Bitcoin's price without changing the underlying protocol.
There is currently insufficient evidence to attribute the November decline primarily to government attempts to control Bitcoin.
Regulatory uncertainty is a factor worth monitoring, but the contemporaneous evidence also points to macroeconomic pressure, ETF redemptions and declining risk appetite.
VIII. WHAT HAS ACTUALLY CHANGED BETWEEN THE TWO CYCLES?
The comparison becomes clearer when we separate Bitcoin's market structure from its underlying infrastructure.
Sources:
https://www.federalreserve.gov/newsevents/pressreleases/monetary20211103a.htm
https://www.federalreserve.gov/
https://www.coindesk.com/research/digital-assets-2026-above-the-noise
https://research.glassnode.com/the-week-onchain-week-52-2021/
https://www.galaxy.com/insights/research/bitcoin-etp-13f-institutional-holdings-q3-2026-wealth-channel-wells-fargo?
The table reveals something important.
Bitcoin has become more integrated into traditional financial markets, but that integration has introduced additional channels through which macroeconomic conditions and portfolio decisions can influence its price.
A larger market does not automatically mean a less volatile market.
A deeper capital base does not guarantee that investors will maintain their allocations during periods of uncertainty.
And institutional ownership does not eliminate the possibility of substantial drawdowns.
IX. SO, ARE WE REPEATING 2021?
My conclusion is that Bitcoin is repeating some of the historical cycle characteristics, but the market itself has fundamentally changed.
There are three important similarities.
First, cycle timing. Both the November 2021 and October 2025 peaks occurred approximately 18 months after their respective halvings.
Second, leverage and liquidity. Both markets demonstrate how changes in risk appetite, derivatives positioning and liquidity can accelerate price declines.
Third, institutional and macroeconomic influences. Both cycles were affected by monetary policy and changing investor expectations, although the channels through which those forces operate have expanded considerably.
But the differences are more consequential.
The 2021 market developed in an exceptionally accommodative monetary environment, with relatively limited institutional investment infrastructure.
The 2026 market has a much larger stablecoin economy, regulated spot ETFs, corporate Bitcoin treasuries and significantly deeper connections to traditional financial markets.
Yet these developments have not prevented a drawdown exceeding 55% from the October 2025 high.
That raises an important question about Bitcoin's evolving investment proposition.
Institutional adoption has expanded access and created additional sources of demand. It has also connected Bitcoin more closely to conventional portfolio allocation decisions.
When institutional investors reduce risk, Bitcoin can experience selling pressure alongside equities and other risk assets.
This does not invalidate Bitcoin's monetary properties or long-term investment thesis. It does mean that its market behaviour must be understood through a broader financial framework.
What traders should monitor next
Rather than relying on historical cycle predictions alone, I would monitor these indicators:
These indicators should be evaluated together. No single one establishes that a market bottom or recovery has arrived.
X. THE FINAL THESIS
Bitcoin's current decline deserves to be examined beyond the familiar four-year cycle narrative.
The 2021 market was shaped by retail speculation, expanding derivatives exposure, pandemic-era liquidity and an emerging institutional market.
The 2026 market operates with a substantially different financial architecture. ETFs, corporate treasuries, stablecoins, institutional custody and traditional investment platforms now play much larger roles.
But institutional participation has not made Bitcoin immune to traditional financial conditions. If anything, it has created additional transmission channels between conventional markets and crypto.
The current evidence points to weakening ETF demand, a more restrictive monetary environment than in 2021, and a broader reassessment of risk assets. Corporate accumulation and institutional ownership data also demonstrate that capital is not moving in one direction.
I would therefore resist declaring that the four-year cycle has been invalidated or that Bitcoin must repeat the 2021–2022 bear market.
The more useful conclusion is that historical cycle patterns remain relevant, but the market structure producing them has evolved.
Bitcoin has become more institutional without becoming less exposed to market risk.
And that may be the most important distinction traders need to understand when comparing 2021 with 2026.
Independent research. Not financial advice. Data and market conditions referenced through November 21, 2026.
Research references and verification
[CoinGlass – Bitcoin historical price data, 2021](https://www.coinglass.com/currencies/BTC/historical-data/2021)
[CoinGlass – Bitcoin historical price data, 2025–2026](https://www.coinglass.com/currencies/BTC/historical-data/2025).
[Glassnode – The Week Onchain, Week 52, 2021](https://research.glassnode.com/the-week-onchain-week-52-2021/).
[Glassnode – The Week Onchain, Week 49, 2021](https://research.glassnode.com/week-onchain-week-49-2021/).
[Federal Reserve – November 3, 2021 FOMC statement](https://www.federalreserve.gov/newsevents/pressreleases/monetary20211103a.htm).
[Federal Reserve – Current economic indicators, November 2026](https://www.federalreserve.gov/).
[Galaxy Research – Institutional Holdings of Bitcoin ETPs Reach New All-Time High, November 19,](https://www.galaxy.com/insights/research/bitcoin-etp-13f-institutional-holdings-q3-2026-wealth-channel-wells-fargo).
[CoinDesk Research – Digital Assets Institutional Adoption, October 2026](https://www.coindesk.com/research/digital-assets-institutional-adoption-report-october-2026?).
[CoinDesk Research – Digital Assets 2026: Above the Noise](https://www.coindesk.com/research/digital-assets-2026-above-the-noise).
[Reuters – Bitcoin falls to its lowest in two years, November 21, 2026](https://www.reuters.com/business/bitcoin-falls-357-56814-2026-11-21/).
The central question behind this research is whether $BTC Bitcoin is experiencing another familiar market cycle transition or whether the forces shaping its current market have changed enough to make comparisons with 2021 misleading.
I want to examine this through market structure, liquidity, institutional participation, leverage, regulation, investor behaviour and Bitcoin's relationship with traditional financial markets.
One distinction will guide the entire analysis: similar price behaviour does not necessarily mean similar market conditions. To establish whether history is repeating, we need to compare the forces producing the price movements, not simply the charts.
I. THE PRICE SIMILARITY: WHAT THE CHARTS ACTUALLY SHOW
The 2021 bull market reached its November all-time high at approximately $68,789 on November 10. Bitcoin subsequently declined, closing the year at approximately $46,306. CoinGlass
https://www.coinglass.com/currencies/BTC/historical-data/2021?utm_source=chatgpt.com
However, the November peak was not the first major correction of that cycle.
In April 2021, Bitcoin had already reached approximately $64,000 before falling sharply in May. The market experienced a correction exceeding 50%, followed by several months of recovery and a new all time high in November.
This matters because 2021 demonstrated that a substantial correction did not immediately terminate the bull market.
Now consider the current cycle.
Bitcoin reached approximately $126,198 on October 6, 2025. By November 21, 2026, its price had fallen to approximately $55,830, representing a drawdown of roughly 55.8% from that high. @Coinglass +1
https://www.coinglass.com/currencies/BTC/historical-data/2025?utm_source=chatgpt.com
The 2021 May June figure is an approximate peak to trough correction. The November December figure uses Glassnode's December 2021 reported drawdown from the November ATH. The 2026 figure uses the October 2025 ATH and November 21, 2026 price.
There is a resemblance in the magnitude of the corrections, but the market's position in the cycle is different.
The October 2025 high occurred approximately 18 months after the April 2024 halving. The November 2021 high also occurred roughly 18 months after the May 2020 halving. Bitcoin +2
https://www.coinglass.com/currencies/BTC/historical-data/2025?utm_source=chatgpt.com
This is an interesting historical alignment.
Both cycles experienced a major price peak around 18 months after their respective halvings. However, the current November 2026 market is already more than a year removed from its October 2025 high.
My interpretation: Bitcoin has followed a comparable post-halving peak timeline, but the present decline has progressed into a much deeper drawdown. The four-year cycle remains a useful historical reference, not a reliable timetable for predicting the next bottom.
II. THE LIQUIDITY ENVIRONMENT: 2021 AND 2026 ARE DIFFERENT MARKETS
One of the biggest differences between these periods is the monetary environment.
In November 2021, the Federal Reserve maintained its federal funds target range at 0–0.25%.
It had also begun tapering its asset purchases, reducing monthly Treasury and mortgage-backed securities purchases by $10 billion and $5 billion, respectively. The Fed still described financial conditions as accommodative.
https://www.federalreserve.gov/newsevents/pressreleases/monetary20211103a.htm
https://www.federalreserve.gov/monetarypolicy/fomcminutes20211103.htm
This is important because Bitcoin's 2021 rally developed during an environment of exceptionally low interest rates, substantial central-bank support and abundant liquidity.
By comparison, the Federal Reserve's November 2026 data show:
Federal funds target range: 3.75–4.00%.
September PCE inflation: 3.6%.
October unemployment: 4.1%.
https://www.federalreserve.gov/
The Fed's October meeting minutes, published November 18, provide additional context on its current monetary policy considerations. federalreserve.gov
The difference is substantial.
In 2021, investors could access relatively inexpensive capital while searching for assets offering higher returns. Bitcoin and other speculative assets benefited from that environment.
In 2026, capital has a higher opportunity cost. Investors can earn returns from traditional fixed-income instruments without necessarily accepting Bitcoin's volatility.
This changes the investment decision.
When interest rates are elevated, Bitcoin must compete more directly for capital. Investors have to consider whether the expected return justifies the volatility and potential drawdown.
There is also a second consideration: monetary tightening does not affect Bitcoin in isolation. It can influence equity valuations, borrowing costs, dollar liquidity, leveraged positions and the willingness of investors to hold speculative assets.
The current decline has coincided with concerns about AI valuations, the profitability of infrastructure spending and rising borrowing costs. Reuters reported that these concerns were affecting technology stocks and broader risk assets alongside crypto.
https://www.reuters.com/business/bitcoin-falls-357-56814-2026-11-21/
This provides evidence of a broader risk repricing rather than a purely crypto specific event.
III. INSTITUTIONAL PARTICIPATION: THE BIGGEST STRUCTURAL CHANGE
Perhaps the most important difference between 2021 and 2026 is who now participates in Bitcoin's market.
In 2021, institutional adoption was already developing. Tesla, #MicroStrategy and other companies had introduced corporate Bitcoin treasury strategies. CME Bitcoin futures also provided regulated institutional exposure.
However, the US spot Bitcoin ETF market did not yet exist.
That changed in January 2024, when US spot Bitcoin ETFs began trading.
The result is a fundamentally different capital distribution system.
Investors can now obtain Bitcoin exposure through regulated investment products without directly managing private keys, operating exchange accounts or holding Bitcoin themselves.
This has expanded access through wealth managers, financial advisers and traditional investment platforms.
Consider the institutional ownership data.
According to Galaxy Research's analysis of Q3 2026 SEC Form 13F filings:
- Reporting investment managers held a record 356,491 BTC-equivalent across US spot Bitcoin ETPs as of September 30.
- They added 49,229 BTC-equivalent during Q3, reversing the 47,054 BTC-equivalent they had sold across the preceding three quarters.
- 2,166 managers reported holdings, an increase of 191 from the previous quarter.
https://www.galaxy.com/insights/research/bitcoin-etp-13f-institutional-holdings-q3-2026-wealth-channel-wells-fargo
These are meaningful figures.
But they require careful interpretation.
Form 13F reports qualifying long positions at quarter end. It does not reveal all short positions, derivatives exposure or the complete economic intentions of the reporting institutions.
A fund reporting Bitcoin ETF ownership could have an offsetting position elsewhere.
Consequently, institutional ownership figures cannot automatically be interpreted as directional bullish exposure.
The more interesting question is whether institutional access has changed Bitcoin's sensitivity to traditional financial markets.
I believe this deserves serious attention.
The ETF structure connects Bitcoin demand to portfolio allocations, wealth-management decisions, risk limits and traditional investment flows.
It also introduces another channel through which capital can leave the market.
IV. ARE INSTITUTIONS SELLING #bitcoin ?
This is where the current market becomes particularly interesting.
There is evidence of institutional selling, but the data also shows that institutional behaviour is not uniform.
@CoinDesk Research's October 2026 institutional adoption report found that:
- Combined ETP and digital-asset treasury exposure declined 10.3% to $279 billion.
- ETPs recorded $1.86 billion in net outflows.
- Corporate digital-asset treasuries added approximately $1.16 billion to their holdings.
- Bitcoin ETPs still recorded $87.4 million in October net inflows.
https://www.coindesk.com/research/digital-assets-institutional-adoption-report-october-2026
The report also estimated that publicly traded ETPs and digital asset treasury companies collectively represented approximately 13.7% of Bitcoin's circulating supply.
That is a considerable structural change compared with 2021.
But November brought a more pronounced deterioration in ETF flows.
By November 20, US spot Bitcoin #ETFs had recorded approximately $3.47 billion in net outflows for the month. The November 19 session alone produced $582.2 million in net redemptions.
https://www.theblock.co/news/markets/2026-11-20-us-spot-bitcoin-etfs-see-582-million-in-daily-net-outflows-as-november-total-nears-3-5-billion-444217
These figures indicate a meaningful reduction in ETF demand.
However, there is a distinction between three things:
- Institutions reducing exposure through ETF redemptions.
- Corporate treasuries selling Bitcoin from their balance sheets.
- Institutional investors maintaining Bitcoin exposure while hedging through derivatives.
They are different transactions with different implications.
For example, an ETF redemption can result in the fund selling Bitcoin to meet the redemption process. But it does not establish that the asset manager itself has changed its long term view of Bitcoin.
Likewise, a reduction in the dollar value of corporate Bitcoin holdings can result from falling prices rather than actual BTC sales.
This distinction is supported by October's institutional data, where much of the reduction in exposure was valuation driven.
The evidence supports institutional repositioning and weakening ETF demand. It does not yet establish a coordinated institutional exit from Bitcoin.
V. LEVERAGE AND MARKET STRUCTURE: HAVE WE LEARNED ANYTHING?
Bitcoin's 2021 market was heavily influenced by derivatives positioning.
Glassnode's December 2021 market review reported that Bitcoin futures open interest had nearly doubled over the year, increasing by $9.57 billion, or 97%.
The same research documented a major liquidation event in early December, when Bitcoin fell approximately $8,800 in one day and more than $5.4 billion in futures contracts were forcibly closed.
https://research.glassnode.com/the-week-onchain-week-52-2021/
This illustrates an important characteristic of crypto markets: price declines can become self-reinforcing when leveraged traders are forced to close positions.
Consider the mechanics:
- Bitcoin declines and leveraged long positions lose collateral.
- Exchanges liquidate positions that no longer meet margin requirements.
- Liquidations generate additional selling pressure.
- Prices decline further, exposing additional leveraged positions.
- The process can develop into a liquidation cascade.
This mechanism existed in 2021 and remains relevant in 2026.
However, we should not assume that the current market has the same leverage profile simply because prices are falling.
A proper comparison requires contemporaneous futures open interest, funding rates, perpetual futures basis, options positioning and liquidation data.
The distinction between spot selling and forced derivatives liquidation is particularly important for traders.
A market experiencing heavy spot distribution has a different underlying demand problem from one experiencing a temporary derivatives-driven liquidation cascade.
VI. THE STABLECOIN ECONOMY: A MUCH LARGER MARKET
Another structural difference is the growth of stablecoins.
According to CoinDesk Research's February 2026 industry report, stablecoin market capitalization had exceeded $300 billion, compared with less than $50 billion in early 2020.
The same report estimated that weekly stablecoin transaction volumes averaged approximately $60 billion, compared with around $30 billion during the previous cycle.
https://www.coindesk.com/research/digital-assets-2026-above-the-noise?
2020 figure represents an approximate upper reference of less than $50B; 2026 is reported as exceeding $300B. coindesk.com
Why does this matter?
Stablecoins provide settlement liquidity, trading collateral and a dollar denominated medium of exchange across crypto markets.
Their growth indicates that the ecosystem has developed a substantially larger liquidity infrastructure.
But there is an important qualification.
Stablecoin market capitalization does not equal capital waiting to purchase Bitcoin.
Stablecoins also support payments, exchange settlement, DeFi lending, liquidity pools and cross-border transfers. Some balances remain inactive or are held for purposes unrelated to directional Bitcoin investment.
Therefore, a larger stablecoin economy improves the potential capacity of crypto markets, but it does not guarantee immediate demand for BTC.
This is one area where the 2026 market has stronger underlying infrastructure than 2021, even while Bitcoin's price performance has deteriorated.
VII. REGULATION: IS GOVERNMENT POLICY REPEATING THE 2021 STORY?
Regulatory uncertainty affected Bitcoin in 2021, but the circumstances were different.
One of the most significant events was China's crackdown on cryptocurrency mining and related activities.
The restrictions triggered a major geographical redistribution of Bitcoin mining operations. Glassnode's 2021 review documented an approximately 53% mining shutdown during the migration, followed by a substantial recovery in network hash rate by year-end.
https://research.glassnode.com/the-week-onchain-week-52-2021/
That episode demonstrated that government policy could materially affect Bitcoin's mining industry, infrastructure and market sentiment.
But it did not give China control over Bitcoin's monetary policy or transaction rules.
The network continued operating.
In 2026, the regulatory environment is more developed, particularly in the United States.
Bitcoin has regulated exchange traded products, more established institutional custody channels and a broader financial services infrastructure.
However, regulatory uncertainty remains relevant.
Reuters identified political and regulatory risks following the November 2026 US midterm elections as one of several concerns affecting crypto markets.
https://www.reuters.com/business/bitcoin-falls-357-56814-2026-11-21/
We should separate three regulatory effects:
- Market access: Rules affecting whether banks, funds and investment platforms can provide crypto services.
- Capital movement: Rules affecting custody, taxation, stablecoins and institutional participation.
- Market confidence: Political uncertainty that changes expectations about the future operating environment.
These can influence Bitcoin's price without changing the underlying protocol.
There is currently insufficient evidence to attribute the November decline primarily to government attempts to control Bitcoin.
Regulatory uncertainty is a factor worth monitoring, but the contemporaneous evidence also points to macroeconomic pressure, ETF redemptions and declining risk appetite.
VIII. WHAT HAS ACTUALLY CHANGED BETWEEN THE TWO CYCLES?
The comparison becomes clearer when we separate Bitcoin's market structure from its underlying infrastructure.
Sources:
https://www.federalreserve.gov/newsevents/pressreleases/monetary20211103a.htm
https://www.federalreserve.gov/
https://www.coindesk.com/research/digital-assets-2026-above-the-noise
https://research.glassnode.com/the-week-onchain-week-52-2021/
https://www.galaxy.com/insights/research/bitcoin-etp-13f-institutional-holdings-q3-2026-wealth-channel-wells-fargo?
The table reveals something important.
Bitcoin has become more integrated into traditional financial markets, but that integration has introduced additional channels through which macroeconomic conditions and portfolio decisions can influence its price.
A larger market does not automatically mean a less volatile market.
A deeper capital base does not guarantee that investors will maintain their allocations during periods of uncertainty.
And institutional ownership does not eliminate the possibility of substantial drawdowns.
IX. SO, ARE WE REPEATING 2021?
My conclusion is that Bitcoin is repeating some of the historical cycle characteristics, but the market itself has fundamentally changed.
There are three important similarities.
First, cycle timing. Both the November 2021 and October 2025 peaks occurred approximately 18 months after their respective halvings.
Second, leverage and liquidity. Both markets demonstrate how changes in risk appetite, derivatives positioning and liquidity can accelerate price declines.
Third, institutional and macroeconomic influences. Both cycles were affected by monetary policy and changing investor expectations, although the channels through which those forces operate have expanded considerably.
But the differences are more consequential.
The 2021 market developed in an exceptionally accommodative monetary environment, with relatively limited institutional investment infrastructure.
The 2026 market has a much larger stablecoin economy, regulated spot ETFs, corporate Bitcoin treasuries and significantly deeper connections to traditional financial markets.
Yet these developments have not prevented a drawdown exceeding 55% from the October 2025 high.
That raises an important question about Bitcoin's evolving investment proposition.
Institutional adoption has expanded access and created additional sources of demand. It has also connected Bitcoin more closely to conventional portfolio allocation decisions.
When institutional investors reduce risk, Bitcoin can experience selling pressure alongside equities and other risk assets.
This does not invalidate Bitcoin's monetary properties or long-term investment thesis. It does mean that its market behaviour must be understood through a broader financial framework.
What traders should monitor next
Rather than relying on historical cycle predictions alone, I would monitor these indicators:
These indicators should be evaluated together. No single one establishes that a market bottom or recovery has arrived.
X. THE FINAL THESIS
Bitcoin's current decline deserves to be examined beyond the familiar four-year cycle narrative.
The 2021 market was shaped by retail speculation, expanding derivatives exposure, pandemic-era liquidity and an emerging institutional market.
The 2026 market operates with a substantially different financial architecture. ETFs, corporate treasuries, stablecoins, institutional custody and traditional investment platforms now play much larger roles.
But institutional participation has not made Bitcoin immune to traditional financial conditions. If anything, it has created additional transmission channels between conventional markets and crypto.
The current evidence points to weakening ETF demand, a more restrictive monetary environment than in 2021, and a broader reassessment of risk assets. Corporate accumulation and institutional ownership data also demonstrate that capital is not moving in one direction.
I would therefore resist declaring that the four-year cycle has been invalidated or that Bitcoin must repeat the 2021–2022 bear market.
The more useful conclusion is that historical cycle patterns remain relevant, but the market structure producing them has evolved.
Bitcoin has become more institutional without becoming less exposed to market risk.
And that may be the most important distinction traders need to understand when comparing 2021 with 2026.
Independent research. Not financial advice. Data and market conditions referenced through November 21, 2026.
Research references and verification
[CoinGlass – Bitcoin historical price data, 2021](https://www.coinglass.com/currencies/BTC/historical-data/2021)
[CoinGlass – Bitcoin historical price data, 2025–2026](https://www.coinglass.com/currencies/BTC/historical-data/2025).
[Glassnode – The Week Onchain, Week 52, 2021](https://research.glassnode.com/the-week-onchain-week-52-2021/).
[Glassnode – The Week Onchain, Week 49, 2021](https://research.glassnode.com/week-onchain-week-49-2021/).
[Federal Reserve – November 3, 2021 FOMC statement](https://www.federalreserve.gov/newsevents/pressreleases/monetary20211103a.htm).
[Federal Reserve – Current economic indicators, November 2026](https://www.federalreserve.gov/).
[Galaxy Research – Institutional Holdings of Bitcoin ETPs Reach New All-Time High, November 19,](https://www.galaxy.com/insights/research/bitcoin-etp-13f-institutional-holdings-q3-2026-wealth-channel-wells-fargo).
[CoinDesk Research – Digital Assets Institutional Adoption, October 2026](https://www.coindesk.com/research/digital-assets-institutional-adoption-report-october-2026?).
[CoinDesk Research – Digital Assets 2026: Above the Noise](https://www.coindesk.com/research/digital-assets-2026-above-the-noise).
[Reuters – Bitcoin falls to its lowest in two years, November 21, 2026](https://www.reuters.com/business/bitcoin-falls-357-56814-2026-11-21/).
2
731
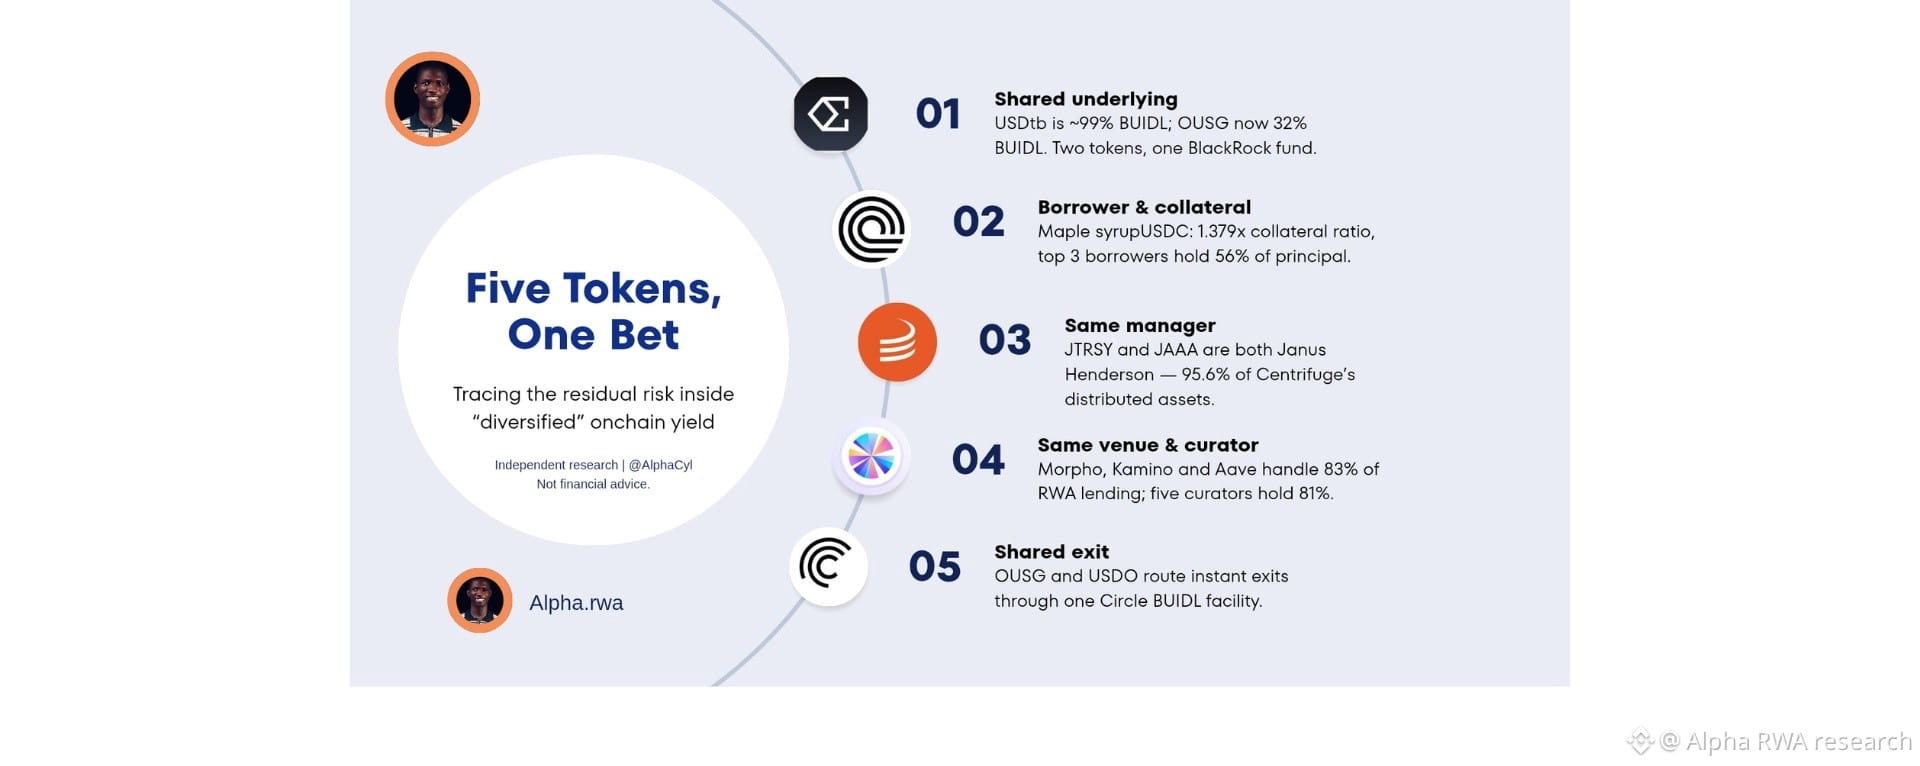
Article
Five Tokens, One Bet: Tracing the Residual Risk Inside "Diversified" Onchain YieldIndependent Research |
Not financial Advice
I. Counting Products Is Not Counting Risks
A yield product looks diversified when its dashboard lists several tokens from several issuers. An allocator measures diversification by independent risk factors: who holds the asset, who services it, who lends against it, and where the exit sits. When two tokens share an underlying fund, a custodian or a venue, the dashboard counts two positions and the portfolio holds one exposure.
This paper argues that most onchain "diversified" yield strategies combine products that share an underlying fund, a borrower, a curator or a venue, and that the shared layer is where the remaining risk sits. I trace six places this shows up, each with a disclosed number, and finish with a five question look through test.
II. Layer One: The Shared Underlying
Take @Ethena_Labs 's $USDtb. An August 31, 2026 reserve examination (@Deloitte , via @Anchorage ) listed $525,205,527 in $BUIDL and $5,214,126 in bank demand deposits, so about 99% of reserves were BUIDL. A holder of USDtb is a holder of one #blackRock fund.pharos.watch/stablecoin/usd…
The overlap spreads. A DeFi guide lists BUIDL as backing USDtb, feeding Frax's sFRAX reserves, sitting in @sparkfinance 's allocator behind $sUSDS , serving as margin collateral at FalconX, and underpinning @OndoFinance 's $OUSG .
The OUSG case shows how a product page can lag its holdings. AltStreet's reading of Ondo's page on October 23, 2026 shows $319.4 million of underlying assets: State Street's SWEEP at 47.49%, BUIDL at 31.96%, Franklin's BENJI at 12.18%, Fidelity's FYOXX at 7.38%, and about 1% cash. RWA.xyz's page still says OUSG primarily holds BUIDL, and the same AltStreet piece notes that Ondo's FAQ still describes the portfolio as mostly BUIDL. The holdings table changed, and the descriptions did not. Even after the shift, all four sleeves are tokenized government money funds, so their shared exposure is the Treasury bill and repo market.
altstreet.investments/guides/superst…
Now ahttps://app.rwa.xyz/assets/ousg
hypothetical "diversified" vault with five tokens: $USDtb 30%, $OUSG 25%, $syrupUSDC 20%, sUSDS 15% and $JAAA 10%. On the disclosed figures, USDtb contributes about 29.7% BUIDL (30% × 0.99) and OUSG about 8.0% (25% × 0.3196), so BUIDL alone is roughly 37.7% of the vault before looking through sUSDS. The top level weights give a Herfindahl index of 2,250, or 4.4 effective positions. The look through leaves fewer independent exposures than that.
III. Layer Two: The Borrower and the Collateral
@maplefinance 's syrupUSDC shows the credit version. @LlamaRisk 's July 17, 2026 analysis for @aave governance measured the USDC open term book at $1,330 million of principal against $1,834 million of collateral, a ratio of 1.379x. The top three borrowers hold 56% of principal and the top five hold 77%. The largest, at $345 million or 26.0%, posted $PYUSD and USTB as collateral. A yield product backed by loans therefore holds collateral that is itself a tokenized Treasury product, which other sleeves may also hold.
governance.aave.com/t/arfc-onboard…
The same analysis lists the top holders of syrupUSDC: @SkyEcosystem 's AML proxy at 45.19% of supply, a cross chain pool at 18.98%, @Morpho at 10.05% and @grovedotfinance at 7.39%. @Dune 's May 2026 count found that $522 million of Maple's $1.8 billion syrup market capitalization is deployed across five venues, making one asset family nearly 30% of all RWAs in DeFi. The Yearn curation report from February 2026 split Maple's collateral as BTC at about 54%, XRP at 25.38% and USTB at 16%.
governance.aave.com/t/arfc-onboard…
dune.com/blog/tokenized…
IV. Layer Three: The Same Manager Under Different Allocators
@centrifuge 's $JTRSY and $JAAA are both Janus Henderson funds. A July 2026 snapshot found they made up 95.6% of Centrifuge's distributed assets, with Grove holding about $895 million across the two and @ethena allocating $250 million to $JAAA.ETF in June 2026. Grove's June 2025 launch came with a $1 billion allocation from Sky to JAAA. Several "diversified" allocators therefore share one underlying manager.
businesswire.com/news/home/2025…
V. Layer Four: The Same Venue and the Same Curator
Dune's April 2026 count put RWAs deposited into DeFi lending at about $2.7 billion, roughly 10% of $27 billion, with credit near 80% of deposits against 17% of AUM, and @Morpho , @KaminoFinance and @aave handling 83% of RWA lending activity.
dune.com/blog/the-rise-…
cryptobriefing.com/dune-report-to…
@RWA_xyz 's November 2 analysis traced the curators. Of $6.1 billion supplied to Morpho's variable rate stablecoin markets on October 28, 2026, the five largest curators (@SteakhouseFi , @SentoraHQ , @gauntlet_xyz , @SparkDao and @RockawayX ) oversee $5.0 billion, or 81%. Markets accepting tokenized collateral took $2.4 billion. The same report puts aggregate utilization near 90%, since about $5.5 billion is already borrowed. CoinbaseLend and Robinhood Earn both route into Steakhouse curated Morpho vaults, and Spark and Grove supply through that curator layer as well. Steakhouse also incubated Grove. A depositor who picks Coinbase, Robinhood or Sky for "diversification" meets one curator layer under three brands.
app.rwa.xyz/blog/the-lende…
VI. Cases
Case One: @StreamDefi and @elixir , November 2025. The loss started with an "external fund manager" and reached lenders through shared collateral. Elixir lent $68 million in $USDC to Stream, about 65% of deUSD's backing. Stream held roughly 90% of the deUSD supply, so Elixir's backing was a loan to its largest holder. Analysts at YAM mapped about $285 million of debt across @eulerfinance , @SiloFinance , @MorphoLabs ho and @GearboxProtocol , with @MEVCapital , @Re7Capital and TelosC among the exposed curators. Gauntlet had no xUSD exposure but paused some markets because of the Elixir contagion. RWA.xyz adds that fixed price oracles in affected markets did not reflect the decline, so liquidations did not trigger and lenders took bad debt. Several vaults chose different curators and the same collateral.
theblock.co/amp/post/37749…
Case Two: USDtb and the regulators' question. The OCC's March 2026 proposal floated a 20% cap on tokenized reserve assets, and @BlackRock argued that risk depends on credit quality, duration and liquidity and not on whether an asset is held on a ledger. The final rule of October 21 permits tokenized reserves if they carry the same legal rights, drops prescriptive portfolio requirements, and limits exposure to a single counterparty to 40% of reserve assets, subject to exceptions. BlackRock had asked the OCC to confirm that issuers need not look through fund holdings when applying that limit to fund custodians or service providers. I did not find how the final rule resolves that point.
natlawreview.com/article/occ-is…
theblock.co/news/business/…
Case Three: a shared exit. From @Ondo 's April 2025 post and @OpenEden_X 's docs: OUSG and $USDO route instant exits through the same Circle facility for $BUIDL , and that facility had 23 hours of limited availability on March 27, 2025. The two products show up as separate lines on a dashboard and as one dependency in an outage.
VII. The Structural Question: Is Overlap Always Bad?
Not always. A Treasury bill fund from BlackRock is a lower risk place to concentrate than a thinly examined yield wrapper, and Spark's 2024 selection process shows allocators choosing winners on purpose. A single large underlying can be defensible if it is disclosed.
The risk in this paper comes from overlap the buyer cannot see. The dashboard says five tokens while the holdings table says three funds, two operators and one curator. Stream is the cost of that gap in a bad credit. A look through is cheap by comparison. Counts of tokens or issuers should not be shown as diversification until the shared layers are netted out.
The look through test. For any "diversified" yield product, ask five questions:
1. After look-through, which three underlying exposures are largest?
2. Which single operator (transfer agent, custodian, redemption facility) sits in the exit path for most sleeves?
3. Do two sleeves share a borrower, a collateral asset, or a manager?
4. What share of supply sits on one venue or with one curator?
5. Does the vault's accounting and oracle treatment differ by sleeve, or does one pricing assumption cover several?
VIII. Where the Research Points
This paper's thesis is that disclosure will move from product lists toward look-through exposures, because the shared layers are now measurable. Three things to watch:
1. How the OCC applies its 40% single counterparty limit to fund shares, and whether look-through becomes a requirement.
2. Whether vault curators publish netted exposure by underlying manager and operator.
3. Whether Morpho's utilization near 90% pushes lenders to price shared-collateral risk.
Independent research. Not financial advice. Always conduct your own due diligence.
Sources: protocol and issuer documents, governance, analytics publishers
- Business Wire, Grove launch (June 25, 2025); Centrifuge blog
- governance.aave.com/t/arfc-onboard… (LlamaRisk, July 17, 2026)
- app.rwa.xyz/blog/the-lende… (Nov 2, 2026)
- dune.com/blog/the-rise-…; dune.com/blog/tokenized…; dune.com/rwa-report
- Pharos USDtb page (Anchorage/Deloitte reserve report, Aug 2026)
- OCC final GENIUS rule summary, natlawreview.com (Oct 2026); The Block, BlackRock comment letter (May 2, 2026)
- curation.yearn.fi/report/maple-s…
Five Tokens, One Bet: Tracing the Residual Risk Inside "Diversified" Onchain Yield
Independent Research |
Not financial Advice
I. Counting Products Is Not Counting Risks
A yield product looks diversified when its dashboard lists several tokens from several issuers. An allocator measures diversification by independent risk factors: who holds the asset, who services it, who lends against it, and where the exit sits. When two tokens share an underlying fund, a custodian or a venue, the dashboard counts two positions and the portfolio holds one exposure.
This paper argues that most onchain "diversified" yield strategies combine products that share an underlying fund, a borrower, a curator or a venue, and that the shared layer is where the remaining risk sits. I trace six places this shows up, each with a disclosed number, and finish with a five question look through test.
II. Layer One: The Shared Underlying
Take @Ethena Labs 's $USDtb. An August 31, 2026 reserve examination (@Deloitte , via @Anchorage ) listed $525,205,527 in $BUIDL and $5,214,126 in bank demand deposits, so about 99% of reserves were BUIDL. A holder of USDtb is a holder of one #blackRock fund.pharos.watch/stablecoin/usd…
The overlap spreads. A DeFi guide lists BUIDL as backing USDtb, feeding Frax's sFRAX reserves, sitting in @sparkfinance 's allocator behind $sUSDS , serving as margin collateral at FalconX, and underpinning @Ondo Finance 's $OUSG .
The OUSG case shows how a product page can lag its holdings. AltStreet's reading of Ondo's page on October 23, 2026 shows $319.4 million of underlying assets: State Street's SWEEP at 47.49%, BUIDL at 31.96%, Franklin's BENJI at 12.18%, Fidelity's FYOXX at 7.38%, and about 1% cash. RWA.xyz's page still says OUSG primarily holds BUIDL, and the same AltStreet piece notes that Ondo's FAQ still describes the portfolio as mostly BUIDL. The holdings table changed, and the descriptions did not. Even after the shift, all four sleeves are tokenized government money funds, so their shared exposure is the Treasury bill and repo market.
altstreet.investments/guides/superst…
Now ahttps://app.rwa.xyz/assets/ousg
hypothetical "diversified" vault with five tokens: $USDtb 30%, $OUSG 25%, $syrupUSDC 20%, sUSDS 15% and $JAAA 10%. On the disclosed figures, USDtb contributes about 29.7% BUIDL (30% × 0.99) and OUSG about 8.0% (25% × 0.3196), so BUIDL alone is roughly 37.7% of the vault before looking through sUSDS. The top level weights give a Herfindahl index of 2,250, or 4.4 effective positions. The look through leaves fewer independent exposures than that.
III. Layer Two: The Borrower and the Collateral
@Maple Finance Official 's syrupUSDC shows the credit version. @LlamaRisk 's July 17, 2026 analysis for @aave governance measured the USDC open term book at $1 ,330 million of principal against $1 ,834 million of collateral, a ratio of 1.379x. The top three borrowers hold 56% of principal and the top five hold 77%. The largest, at $345 million or 26.0%, posted $PYUSD and USTB as collateral. A yield product backed by loans therefore holds collateral that is itself a tokenized Treasury product, which other sleeves may also hold.
governance.aave.com/t/arfc-onboard…
The same analysis lists the top holders of syrupUSDC: @SkyEcosystem 's AML proxy at 45.19% of supply, a cross chain pool at 18.98%, @Morpho at 10.05% and @grovedotfinance at 7.39%. @Dune 's May 2026 count found that $522 million of Maple's $1 .8 billion syrup market capitalization is deployed across five venues, making one asset family nearly 30% of all RWAs in DeFi. The Yearn curation report from February 2026 split Maple's collateral as BTC at about 54%, XRP at 25.38% and USTB at 16%.
governance.aave.com/t/arfc-onboard…
dune.com/blog/tokenized…
IV. Layer Three: The Same Manager Under Different Allocators
@centrifuge 's $JTRSY and $JAAA are both Janus Henderson funds. A July 2026 snapshot found they made up 95.6% of Centrifuge's distributed assets, with Grove holding about $895 million across the two and @ethena allocating $250 million to $JAAA.ETF in June 2026. Grove's June 2025 launch came with a $1 billion allocation from Sky to JAAA. Several "diversified" allocators therefore share one underlying manager.
businesswire.com/news/home/2025…
V. Layer Four: The Same Venue and the Same Curator
Dune's April 2026 count put RWAs deposited into DeFi lending at about $2.7 billion, roughly 10% of $27 billion, with credit near 80% of deposits against 17% of AUM, and @Morpho , @KaminoFinance and @aave handling 83% of RWA lending activity.
dune.com/blog/the-rise-…
cryptobriefing.com/dune-report-to…
@RWA_xyz 's November 2 analysis traced the curators. Of $6.1 billion supplied to Morpho's variable rate stablecoin markets on October 28, 2026, the five largest curators (@SteakhouseFi , @SentoraHQ , @gauntlet_xyz , @SparkDao and @RockawayX ) oversee $5.0 billion, or 81%. Markets accepting tokenized collateral took $2.4 billion. The same report puts aggregate utilization near 90%, since about $5.5 billion is already borrowed. CoinbaseLend and Robinhood Earn both route into Steakhouse curated Morpho vaults, and Spark and Grove supply through that curator layer as well. Steakhouse also incubated Grove. A depositor who picks Coinbase, Robinhood or Sky for "diversification" meets one curator layer under three brands.
app.rwa.xyz/blog/the-lende…
VI. Cases
Case One: @StreamDefi and @elixir , November 2025. The loss started with an "external fund manager" and reached lenders through shared collateral. Elixir lent $68 million in $USDC to Stream, about 65% of deUSD's backing. Stream held roughly 90% of the deUSD supply, so Elixir's backing was a loan to its largest holder. Analysts at YAM mapped about $285 million of debt across @eulerfinance , @SiloFinance , @Morpho Labs 🦋 ho and @GearboxProtocol , with @MEVCapital , @Re7Capital and TelosC among the exposed curators. Gauntlet had no xUSD exposure but paused some markets because of the Elixir contagion. RWA.xyz adds that fixed price oracles in affected markets did not reflect the decline, so liquidations did not trigger and lenders took bad debt. Several vaults chose different curators and the same collateral.
theblock.co/amp/post/37749…
Case Two: USDtb and the regulators' question. The OCC's March 2026 proposal floated a 20% cap on tokenized reserve assets, and @BlackRock argued that risk depends on credit quality, duration and liquidity and not on whether an asset is held on a ledger. The final rule of October 21 permits tokenized reserves if they carry the same legal rights, drops prescriptive portfolio requirements, and limits exposure to a single counterparty to 40% of reserve assets, subject to exceptions. BlackRock had asked the OCC to confirm that issuers need not look through fund holdings when applying that limit to fund custodians or service providers. I did not find how the final rule resolves that point.
natlawreview.com/article/occ-is…
theblock.co/news/business/…
Case Three: a shared exit. From @Ondo 's April 2025 post and @OpenEden_X 's docs: OUSG and $USDO route instant exits through the same Circle facility for $BUIDL , and that facility had 23 hours of limited availability on March 27, 2025. The two products show up as separate lines on a dashboard and as one dependency in an outage.
VII. The Structural Question: Is Overlap Always Bad?
Not always. A Treasury bill fund from BlackRock is a lower risk place to concentrate than a thinly examined yield wrapper, and Spark's 2024 selection process shows allocators choosing winners on purpose. A single large underlying can be defensible if it is disclosed.
The risk in this paper comes from overlap the buyer cannot see. The dashboard says five tokens while the holdings table says three funds, two operators and one curator. Stream is the cost of that gap in a bad credit. A look through is cheap by comparison. Counts of tokens or issuers should not be shown as diversification until the shared layers are netted out.
The look through test. For any "diversified" yield product, ask five questions:
1. After look-through, which three underlying exposures are largest?
2. Which single operator (transfer agent, custodian, redemption facility) sits in the exit path for most sleeves?
3. Do two sleeves share a borrower, a collateral asset, or a manager?
4. What share of supply sits on one venue or with one curator?
5. Does the vault's accounting and oracle treatment differ by sleeve, or does one pricing assumption cover several?
VIII. Where the Research Points
This paper's thesis is that disclosure will move from product lists toward look-through exposures, because the shared layers are now measurable. Three things to watch:
1. How the OCC applies its 40% single counterparty limit to fund shares, and whether look-through becomes a requirement.
2. Whether vault curators publish netted exposure by underlying manager and operator.
3. Whether Morpho's utilization near 90% pushes lenders to price shared-collateral risk.
Independent research. Not financial advice. Always conduct your own due diligence.
Sources: protocol and issuer documents, governance, analytics publishers
- Business Wire, Grove launch (June 25, 2025); Centrifuge blog
- governance.aave.com/t/arfc-onboard… (LlamaRisk, July 17, 2026)
- app.rwa.xyz/blog/the-lende… (Nov 2, 2026)
- dune.com/blog/the-rise-…; dune.com/blog/tokenized…; dune.com/rwa-report
- Pharos USDtb page (Anchorage/Deloitte reserve report, Aug 2026)
- OCC final GENIUS rule summary, natlawreview.com (Oct 2026); The Block, BlackRock comment letter (May 2, 2026)
- curation.yearn.fi/report/maple-s…
Not financial Advice
I. Counting Products Is Not Counting Risks
A yield product looks diversified when its dashboard lists several tokens from several issuers. An allocator measures diversification by independent risk factors: who holds the asset, who services it, who lends against it, and where the exit sits. When two tokens share an underlying fund, a custodian or a venue, the dashboard counts two positions and the portfolio holds one exposure.
This paper argues that most onchain "diversified" yield strategies combine products that share an underlying fund, a borrower, a curator or a venue, and that the shared layer is where the remaining risk sits. I trace six places this shows up, each with a disclosed number, and finish with a five question look through test.
II. Layer One: The Shared Underlying
Take @Ethena Labs 's $USDtb. An August 31, 2026 reserve examination (@Deloitte , via @Anchorage ) listed $525,205,527 in $BUIDL and $5,214,126 in bank demand deposits, so about 99% of reserves were BUIDL. A holder of USDtb is a holder of one #blackRock fund.pharos.watch/stablecoin/usd…
The overlap spreads. A DeFi guide lists BUIDL as backing USDtb, feeding Frax's sFRAX reserves, sitting in @sparkfinance 's allocator behind $sUSDS , serving as margin collateral at FalconX, and underpinning @Ondo Finance 's $OUSG .
The OUSG case shows how a product page can lag its holdings. AltStreet's reading of Ondo's page on October 23, 2026 shows $319.4 million of underlying assets: State Street's SWEEP at 47.49%, BUIDL at 31.96%, Franklin's BENJI at 12.18%, Fidelity's FYOXX at 7.38%, and about 1% cash. RWA.xyz's page still says OUSG primarily holds BUIDL, and the same AltStreet piece notes that Ondo's FAQ still describes the portfolio as mostly BUIDL. The holdings table changed, and the descriptions did not. Even after the shift, all four sleeves are tokenized government money funds, so their shared exposure is the Treasury bill and repo market.
altstreet.investments/guides/superst…
Now ahttps://app.rwa.xyz/assets/ousg
hypothetical "diversified" vault with five tokens: $USDtb 30%, $OUSG 25%, $syrupUSDC 20%, sUSDS 15% and $JAAA 10%. On the disclosed figures, USDtb contributes about 29.7% BUIDL (30% × 0.99) and OUSG about 8.0% (25% × 0.3196), so BUIDL alone is roughly 37.7% of the vault before looking through sUSDS. The top level weights give a Herfindahl index of 2,250, or 4.4 effective positions. The look through leaves fewer independent exposures than that.
III. Layer Two: The Borrower and the Collateral
@Maple Finance Official 's syrupUSDC shows the credit version. @LlamaRisk 's July 17, 2026 analysis for @aave governance measured the USDC open term book at $1 ,330 million of principal against $1 ,834 million of collateral, a ratio of 1.379x. The top three borrowers hold 56% of principal and the top five hold 77%. The largest, at $345 million or 26.0%, posted $PYUSD and USTB as collateral. A yield product backed by loans therefore holds collateral that is itself a tokenized Treasury product, which other sleeves may also hold.
governance.aave.com/t/arfc-onboard…
The same analysis lists the top holders of syrupUSDC: @SkyEcosystem 's AML proxy at 45.19% of supply, a cross chain pool at 18.98%, @Morpho at 10.05% and @grovedotfinance at 7.39%. @Dune 's May 2026 count found that $522 million of Maple's $1 .8 billion syrup market capitalization is deployed across five venues, making one asset family nearly 30% of all RWAs in DeFi. The Yearn curation report from February 2026 split Maple's collateral as BTC at about 54%, XRP at 25.38% and USTB at 16%.
governance.aave.com/t/arfc-onboard…
dune.com/blog/tokenized…
IV. Layer Three: The Same Manager Under Different Allocators
@centrifuge 's $JTRSY and $JAAA are both Janus Henderson funds. A July 2026 snapshot found they made up 95.6% of Centrifuge's distributed assets, with Grove holding about $895 million across the two and @ethena allocating $250 million to $JAAA.ETF in June 2026. Grove's June 2025 launch came with a $1 billion allocation from Sky to JAAA. Several "diversified" allocators therefore share one underlying manager.
businesswire.com/news/home/2025…
V. Layer Four: The Same Venue and the Same Curator
Dune's April 2026 count put RWAs deposited into DeFi lending at about $2.7 billion, roughly 10% of $27 billion, with credit near 80% of deposits against 17% of AUM, and @Morpho , @KaminoFinance and @aave handling 83% of RWA lending activity.
dune.com/blog/the-rise-…
cryptobriefing.com/dune-report-to…
@RWA_xyz 's November 2 analysis traced the curators. Of $6.1 billion supplied to Morpho's variable rate stablecoin markets on October 28, 2026, the five largest curators (@SteakhouseFi , @SentoraHQ , @gauntlet_xyz , @SparkDao and @RockawayX ) oversee $5.0 billion, or 81%. Markets accepting tokenized collateral took $2.4 billion. The same report puts aggregate utilization near 90%, since about $5.5 billion is already borrowed. CoinbaseLend and Robinhood Earn both route into Steakhouse curated Morpho vaults, and Spark and Grove supply through that curator layer as well. Steakhouse also incubated Grove. A depositor who picks Coinbase, Robinhood or Sky for "diversification" meets one curator layer under three brands.
app.rwa.xyz/blog/the-lende…
VI. Cases
Case One: @StreamDefi and @elixir , November 2025. The loss started with an "external fund manager" and reached lenders through shared collateral. Elixir lent $68 million in $USDC to Stream, about 65% of deUSD's backing. Stream held roughly 90% of the deUSD supply, so Elixir's backing was a loan to its largest holder. Analysts at YAM mapped about $285 million of debt across @eulerfinance , @SiloFinance , @Morpho Labs 🦋 ho and @GearboxProtocol , with @MEVCapital , @Re7Capital and TelosC among the exposed curators. Gauntlet had no xUSD exposure but paused some markets because of the Elixir contagion. RWA.xyz adds that fixed price oracles in affected markets did not reflect the decline, so liquidations did not trigger and lenders took bad debt. Several vaults chose different curators and the same collateral.
theblock.co/amp/post/37749…
Case Two: USDtb and the regulators' question. The OCC's March 2026 proposal floated a 20% cap on tokenized reserve assets, and @BlackRock argued that risk depends on credit quality, duration and liquidity and not on whether an asset is held on a ledger. The final rule of October 21 permits tokenized reserves if they carry the same legal rights, drops prescriptive portfolio requirements, and limits exposure to a single counterparty to 40% of reserve assets, subject to exceptions. BlackRock had asked the OCC to confirm that issuers need not look through fund holdings when applying that limit to fund custodians or service providers. I did not find how the final rule resolves that point.
natlawreview.com/article/occ-is…
theblock.co/news/business/…
Case Three: a shared exit. From @Ondo 's April 2025 post and @OpenEden_X 's docs: OUSG and $USDO route instant exits through the same Circle facility for $BUIDL , and that facility had 23 hours of limited availability on March 27, 2025. The two products show up as separate lines on a dashboard and as one dependency in an outage.
VII. The Structural Question: Is Overlap Always Bad?
Not always. A Treasury bill fund from BlackRock is a lower risk place to concentrate than a thinly examined yield wrapper, and Spark's 2024 selection process shows allocators choosing winners on purpose. A single large underlying can be defensible if it is disclosed.
The risk in this paper comes from overlap the buyer cannot see. The dashboard says five tokens while the holdings table says three funds, two operators and one curator. Stream is the cost of that gap in a bad credit. A look through is cheap by comparison. Counts of tokens or issuers should not be shown as diversification until the shared layers are netted out.
The look through test. For any "diversified" yield product, ask five questions:
1. After look-through, which three underlying exposures are largest?
2. Which single operator (transfer agent, custodian, redemption facility) sits in the exit path for most sleeves?
3. Do two sleeves share a borrower, a collateral asset, or a manager?
4. What share of supply sits on one venue or with one curator?
5. Does the vault's accounting and oracle treatment differ by sleeve, or does one pricing assumption cover several?
VIII. Where the Research Points
This paper's thesis is that disclosure will move from product lists toward look-through exposures, because the shared layers are now measurable. Three things to watch:
1. How the OCC applies its 40% single counterparty limit to fund shares, and whether look-through becomes a requirement.
2. Whether vault curators publish netted exposure by underlying manager and operator.
3. Whether Morpho's utilization near 90% pushes lenders to price shared-collateral risk.
Independent research. Not financial advice. Always conduct your own due diligence.
Sources: protocol and issuer documents, governance, analytics publishers
- Business Wire, Grove launch (June 25, 2025); Centrifuge blog
- governance.aave.com/t/arfc-onboard… (LlamaRisk, July 17, 2026)
- app.rwa.xyz/blog/the-lende… (Nov 2, 2026)
- dune.com/blog/the-rise-…; dune.com/blog/tokenized…; dune.com/rwa-report
- Pharos USDtb page (Anchorage/Deloitte reserve report, Aug 2026)
- OCC final GENIUS rule summary, natlawreview.com (Oct 2026); The Block, BlackRock comment letter (May 2, 2026)
- curation.yearn.fi/report/maple-s…
BLKUS-2.33%
JAAAETF-0.03%
1
1
1.1k
The institutional value of tokenization may emerge before secondary markets ever scale.
Consider what happens when a security already held within #DTCC can be mobilized as collateral across financing, repo and margin workflows without leaving the depository.
The underlying asset remains where it is. Its ability to move, support obligations and participate in multiple financial workflows changes.
That is a significant shift in capital efficiency. The next question is how much idle capital institutions can unlock when collateral mobility becomes faster, programmable and interoperable.
The institutional value of tokenization may emerge before secondary markets ever scale.
Consider what happens when a security already held within #DTCC can be mobilized as collateral across financing, repo and margin workflows without leaving the depository.
The underlying asset remains where it is. Its ability to move, support obligations and participate in multiple financial workflows changes.
That is a significant shift in capital efficiency. The next question is how much idle capital institutions can unlock when collateral mobility becomes faster, programmable and interoperable.
Consider what happens when a security already held within #DTCC can be mobilized as collateral across financing, repo and margin workflows without leaving the depository.
The underlying asset remains where it is. Its ability to move, support obligations and participate in multiple financial workflows changes.
That is a significant shift in capital efficiency. The next question is how much idle capital institutions can unlock when collateral mobility becomes faster, programmable and interoperable.
1
1
415
Article
THE FIRST JOB OF A DTC DIGITAL TWIN: Collateral Mobility Before Secondary TradingTHE FIRST JOB OF A DTC DIGITAL TWIN: Collateral Mobility Before Secondary Trading
Independent Research | @AlphaCyl
I. The Asset Does Not Need to Leave DTC
The most important development in #DTCC tokenization programme may have little to do with secondary trading.
On October 28, 2026, The Depository Trust Company (DTC), a subsidiary of the Depository Trust & Clearing Corporation (DTCC), launched its Tokenization Service. The service allows eligible participants to convert securities already held at DTC into tokenized representations that can move between registered digital wallets.
DTCC holds more than $114 trillion in securities. Its stated objectives for tokenization include greater liquidity, collateral mobility and capital efficiency. The July 15 production event had already tested collateral pledges, securities lending, Treasury repo, equity delivery versus payment (DVP) and central counterparty (CCP) margin workflows.
The launch initially supports 34 securities, representing approximately $30 trillion in assets under custody. Twenty DTC Participants have signed agreements to access the service.
The interesting part is the structure.
The underlying securities remain within DTC. The token represents the corresponding security entitlement, while DTC maintains the official record of token movements and holdings through its LedgerScan infrastructure.
This paper argues that collateral mobility may become the first economically significant use case for DTC’s digital twins. The immediate opportunity is to make securities already held within the depository easier to deploy across financing, margin and collateral arrangements, without requiring their full withdrawal from DTC.
That is a narrower proposition than the usual argument that tokenization will produce continuous securities trading. It is also a more practical starting point for institutional adoption.
dtcc.com/press-releases…
dtcc.com/press-releases…
II. What DTC Actually Tokenizes
The first distinction is between the underlying security and the entitlement represented by its token.
In the traditional U.S. securities holding structure, DTC operates as the central securities depository. Securities are generally registered in the name of Cede & Co., DTC’s nominee, while DTC Participants maintain securities entitlements through their accounts.
The tokenization service introduces another way to represent and transfer those entitlements.
The process works in four stages:
1. A DTC Participant registers a digital wallet on a supported blockchain and submits a Tokenization Instruction for an eligible security held in its DTC account.
2. DTC applies its existing risk controls. Once the instruction is accepted, the relevant securities are debited from the Participant’s account and credited to DTC’s Digital Omnibus Account.
3. DTC’s ComposerX Factory system mints a token representing the corresponding security entitlement and delivers it to the registered wallet.
4. LedgerScan monitors blockchain movements and records the location of the tokens. Its record constitutes DTC’s official books and records for tokenized entitlements.
The Digital Omnibus Account is particularly important.
It holds the underlying traditional securities represented by the tokens. Those securities cannot be transferred out of the omnibus account until the corresponding tokens have been burned.
This is the control against double spending.
A Participant cannot transfer the token to another wallet and separately instruct DTC to transfer the same underlying security through its traditional books. The token movement or an authorized conversion back into book entry form must account for the entitlement.
The legal registration of the underlying securities also remains in Cede & Co.’s name.
Consequently, the digital twin gives the entitlement a blockchain based transfer mechanism while retaining the existing depository relationship.
There is another important distinction concerning the holder.
Only DTC Participants can register wallets under the #SecGov framework. A Participant may manage client sub wallets, but the DTC Participant associated with the registered wallet remains the entitlement holder of record in DTC’s system.
This means the service provides a new way for institutional participants to manage and distribute their securities entitlements. It does not automatically turn every individual wallet holder into a directly registered shareholder.
The SEC’s December 11, 2025 no action letter describes this arrangement in detail.
sec.gov/files/tm/no-ac…
dtcclearning.com/helpfiles/dda/…
III. Mechanism One: Turning a Security Into Mobile Collateral
Collateral mobility concerns how quickly an institution can make an asset available to satisfy an obligation.
A bank may hold Treasury securities, equities or other eligible instruments while simultaneously facing margin requirements, financing needs and obligations to multiple counterparties.
The problem is often location and availability.
An institution may have sufficient assets on its balance sheet but still face delays in making those assets available to the counterparty that needs them. The securities may sit with a custodian, within a particular settlement infrastructure or inside a collateral arrangement that requires several operational steps before they can be redeployed.
A tokenized entitlement introduces a different movement mechanism.
Consider a hypothetical dealer holding $100 million in eligible U.S. Treasury securities at DTC.
The dealer needs to satisfy a margin obligation with an external counterparty.
Under the traditional arrangement, the movement of securities may involve instructions between custodians, collateral agents and settlement infrastructure, together with eligibility checks, reconciliation and confirmation.
Under a tokenized arrangement:
- The dealer converts the eligible Treasury position into tokenized entitlements.
-The tokens are delivered to a registered wallet.
-The dealer transfers the relevant tokens to the counterparty’s registered wallet.
-The receiving institution can verify the movement through the blockchain and DTC’s associated records.
-The collateral arrangement governs the obligation, valuation, haircut and conditions for release.
The underlying securities remain within DTC’s Digital Omnibus Account throughout the tokenized holding period.
The operational advantage comes from moving the entitlement through a shared digital infrastructure rather than repeatedly processing movements through disconnected systems.
This can reduce the time spent waiting for confirmation, reconciling positions and coordinating transfers between institutions.
The distinction matters because collateral mobility can create economic value even when the underlying security never enters a public trading market.
A Treasury that can be mobilized more efficiently may support financing, margin and liquidity requirements across multiple institutional relationships.
The asset becomes more useful through its ability to move.
IV. Mechanism Two: The Difference Between DTC Tokenization and Collateral AppChain
There are two related DTCC initiatives that need to be separated.
The first is the DTC Tokenization Service.
It provides the mechanism for converting eligible securities held at DTC into tokenized entitlements, registering wallets, minting and burning tokens, and recording their movements.
The second is the DTCC Collateral AppChain.
It is a shared infrastructure platform designed to coordinate collateral management across providers, receivers, managers, triparty agents and custodians.
The distinction is important.
Tokenization gives the security entitlement a digital representation that can move between approved wallets.
Collateral infrastructure determines how that asset can be deployed against an obligation.
That second layer requires additional information and processes:
- Asset eligibility.
- Market valuation.
- Collateral haircuts.
- Margin requirements.
- Counterparty agreements.
- Allocation and substitution rules.
- Settlement and release conditions.
DTCC announced its collaboration with @chainlink on May 12 to integrate the #Chainlink Runtime Environment (CRE) and data standard into Collateral AppChain.
The integration is intended to support data and orchestration for asset pricing, valuations, eligibility, margining, collateral optimization and settlement.
This is significant because a token transfer alone cannot determine whether an asset satisfies a particular collateral requirement.
A receiving institution may accept one Treasury security at a particular haircut while rejecting an equity with the same market value. The collateral system must understand the agreement and the risk attached to each instrument.
The AppChain is designed to coordinate those decisions and movements through shared infrastructure.
DTCC has described its objective as supporting 24/7, near real-time collateral management across markets and blockchains.
Its May announcement targeted Q4 2026 for the AppChain’s production launch.
The two products therefore address different parts of the same operational problem: one makes eligible DTC securities mobile in digital form, while the other coordinates how collateral is identified, valued and deployed.
dtcc.com/press-releases…
dtcc.com/products-and-s…
V. Three Cases From Production
Case One: #JPMorgan and CME Group, July 15
One of the clearest demonstrations of collateral mobility came during DTCC’s July production event.
At 9:00 a.m. ET, J.P. Morgan successfully converted its position in the Invesco QQQ Trust (QQQ) into a tokenized asset.
At 10:45 a.m., J.P. Morgan successfully posted tokenized assets to satisfy central counterparty margin requirements with CME Group.
The significance is the destination of the asset.
The tokenized securities were being used in an established institutional margin workflow rather than simply being transferred between digital wallets for demonstration purposes.
This connects DTC held securities with the collateral requirements of a major derivatives clearing infrastructure.
DTCC’s production record identifies the transaction as one of the day’s major demonstrations of tokenized collateral mobility.
An important qualification: DTCC identifies the CCP margin workflow as operating through its separate Collateral AppChain product. The demonstration therefore validates the interaction between DTC-tokenized assets and collateral infrastructure, rather than proving that DTC itself has started assigning collateral value to tokens in its own risk-management system.
dtcc.com/products-and-s…
Case Two: The First Onchain U.S. Treasury Repo, July 2026
Temple Digital Group announced on July 27 that it had executed a live onchain U.S. Treasury repo transaction using the DTCC Tokenization Service.
The transaction involved a tokenized representation of a U.S. Treasury security financed against Circle’s USDCx on the Canton Network.
Temple’s institutional RFQ platform coordinated the transaction.
DRW and HIFI participated as principals, while Marex acted as prime broker and settlement agent.
#Hifi also confirmed its involvement in two onchain Treasury repo transactions during the July production initiative, executed through Temple Digital Group and Tradeweb.
The cash leg involved converting USD from a fiat account into USDC and then USDCx on #CantonNetwork . The Treasury and cash legs settled against each other in the digital environment.
The important feature was the separation of the underlying security from its digital movement.
The Treasury remained within DTC’s existing book entry framework while its tokenized representation participated in the financing transaction.
This is a particularly useful example because repo is fundamentally a financing arrangement.
One party provides securities and receives cash, with an agreement to reverse the transaction at a later date.
Tokenized securities can make the delivery and return of collateral more efficient, while tokenized cash can provide the corresponding payment leg.
The transaction also demonstrates why securities tokenization and digital money need to develop together.
A tokenized Treasury can move onchain, but the financing transaction still requires a reliable cash settlement instrument.
templedigitalgroup.com/news/temple-di…
templedigitalgroup.com/news/introduci…
Case Three: The Great Collateral Experiment, 2025
DTCC’s collateral mobility thesis predates the current Tokenization Service.
In 2025, DTCC organized the Great Collateral Experiment to test how distributed ledger technology could improve collateral management across institutions.
The experiment demonstrated the movement of tokenized assets through smart contracts incorporating collateral eligibility rules, haircut calculations and minimum transfer requirements.
DTCC’s retrospective published on April 29, 2026, reported that processes that traditionally took hours or a full business day were compressed into seconds during the demonstration.
The experiment also showed how participants could obtain immediate visibility into collateral movements rather than waiting for settlement confirmation.
This matters because collateral management involves more than transferring securities.
A margin call must be communicated, the collateral must satisfy agreed eligibility requirements, the receiving institution must obtain control, and the relevant records must be updated.
The experiment tested how these activities could be coordinated through shared infrastructure.
It also established an important foundation for the subsequent Collateral AppChain initiative.
The 2025 experiment and the July 2026 DTC production event are separate milestones. The former tested broader tokenized collateral infrastructure; the latter demonstrated production transactions involving securities tokenized through DTC.
dtcc.com/insights/2026/…
VI. The Economic Case: What Faster Collateral Actually Saves
The business case for collateral mobility comes down to the cost of holding assets in the wrong place or waiting for them to become available.
Institutions maintain liquidity buffers to meet unexpected funding requirements and margin calls.
Some assets remain idle because moving them between counterparties or jurisdictions takes time. Others require financing while the institution waits for collateral to settle.
Tokenized collateral can reduce these inefficiencies by allowing institutions to deploy assets closer to the moment they are needed.
DTCC and Finadium examined this opportunity in their May 2026 paper, Collateral Infrastructure for Tokenized Capital Markets.
One of the central use cases is intraday repo.
Intraday repo allows institutions to obtain secured funding for shorter periods rather than relying on overnight financing or carrying larger liquidity buffers throughout the day.
The paper compares daylight overdraft costs, using a 50-basis point Federal Reserve rate floor plus intermediary spreads, with intraday repo pricing of approximately 30–40 basis points.
Under that scenario, intraday repo could reduce funding costs by up to half.
The paper also cites @jpmorgan research suggesting that intraday repo could reduce operational costs by 56% compared with traditional funding sources across settlement risk, suboptimal capital management and data transmission errors.
DTCC provides another illustrative calculation.
In one model, applying Collateral AppChain to 15% of wholesale funding exposures, with a starting Liquidity Coverage Ratio of 130%, could reduce required High Quality Liquid Assets by 17%.
These figures are modeled scenarios, not savings already realized by DTCC participants.
The distinction matters. The economic benefit depends on how much funding activity moves onto the infrastructure, the assets accepted, the costs of implementation and the extent to which institutions can redeploy released capital.
The same paper estimates that an institution adopting the infrastructure could free approximately $150 million in capital and generate $9 million in incremental bank-wide revenue during its first year under one set of assumptions.
By year three, a scenario assuming 25% of business activity had moved to the platform estimated $1.9 billion in freed up capital and $225 million in incremental revenue.
These projections illustrate the potential scale of the opportunity. They should be treated as scenario analysis rather than observed financial results.
dtcc.com/-/media/collat…
VII. The Structural Limitation: A Token Is Not Automatically Eligible Collateral
There is an important restriction within the SEC’s authorization that changes how DTC’s tokenization service should be understood.
Under the December 11, 2025 no action letter, DTC does not assign tokenized entitlements collateral value or settlement value when calculating a Participant’s Net Debit Cap or Collateral Monitor.
These are part of DTC’s existing risk management framework.
The restriction means that a tokenized security cannot simply be counted as collateral within DTC’s own risk calculations because it exists on a blockchain.
This creates an important distinction between two types of collateral use.
External collateral use
A counterparty, clearing institution or financing provider may accept a DTC tokenized entitlement under its own eligibility rules, agreements and risk controls.
The July production transactions demonstrated this broader possibility.
DTC’s internal risk management
DTC does not assign these tokens collateral or settlement value for its own Net Debit Cap and Collateral Monitor calculations under the authorized framework.
The two arrangements operate under different rules.
There are also operational restrictions.
Only approved wallets can receive tokens. DTC screens registered wallets for OFAC compliance, and Participants remain responsible for the AML/KYC requirements associated with their customers.
DTC also retains administrative capabilities, including the ability to reverse certain token movements and recover tokens in cases involving loss, theft or erroneous entries.
The SEC authorization itself is limited.
The December 2025 letter provides a no action position for the specified service and regulatory provisions. It does not constitute blanket SEC approval of every possible tokenized securities activity.
The authorization runs for three years from the service’s launch.
These restrictions show that institutional adoption is being built around controlled access, recognized ownership records and existing financial market safeguards.
SEC No-Action Letter, December 11, 2025.
DTCC Tokenization Service FAQ.
sec.gov/files/tm/no-ac…
dtcc.com/-/media/Files/…
VIII. The Other Risk: Faster Settlement Can Change the Economics of Netting
There is another question worth examining before treating faster collateral movement as an automatic improvement.
Traditional financial institutions often benefit from netting.
A dealer may have multiple repo transactions with different counterparties. Rather than settling every gross obligation independently, the institution can offset incoming and outgoing cash and securities movements, reducing the amount that actually needs to settle.
Faster settlement can reduce the time assets spend in transit, but it can also reduce opportunities to net transactions.
The @IMFNews examined this tension in Chapter 3 of its October 2026 Global Financial Stability Report, Scaling Tokenization: New Efficiencies, New Vulnerabilities.
Its analysis highlights that shorter settlement cycles can increase gross bilateral settlement requirements when transactions that previously offset against one another must settle individually.
Programmable batching may help preserve some netting benefits by grouping transactions before settlement.
This introduces a trade off between immediate settlement and settlement efficiency.
The IMF also reports that tokenized repo activity averages approximately $303 billion in daily volume, while the traditional U.S. repo market handles roughly $13 trillion daily.
Despite the substantial tokenized activity, much of it remains concentrated among affiliated entities and private platforms.
The lesson for DTC is that moving securities faster does not automatically create a more efficient financing market.
The infrastructure must preserve the economic benefits of existing market arrangements while reducing unnecessary operational friction.
Tokenized collateral must also maintain reliable valuation, enforceable security interests, settlement finality and clear procedures for default and collateral release.
IMF, Global Financial Stability Report, October 2026, Chapter 3.
IMF, What Is Needed for Tokenization to Deliver, October 8, 2026.
imf.org/en/Publication…
imf.org/en/blogs/artic…
IX. Where the Research Points
The central thesis is that collateral mobility may provide the strongest initial economic justification for DTC’s digital twins.
The July production event demonstrated that DTC held securities could enter collateral pledges, CCP margin workflows, securities lending and Treasury repo transactions.
The October 28 launch has now established the service as a live institutional offering, with 20 Participants signed up and 34 securities available for tokenization at launch.
However, the real measure of adoption will be how frequently these securities are deployed across financing and collateral arrangements, and whether the resulting operational improvements translate into measurable balance-sheet benefits.
Three developments deserve particular attention:
1. The scale of collateral deployment.
How much DTC tokenized securities value moves into actual collateral arrangements? The number of tokenized assets alone will tell us little about their economic utilization.
2. The integration between DTC and Collateral AppChain.
Whether institutions can coordinate eligibility, valuation, margining and collateral movements across multiple counterparties and networks will determine how much value the combined infrastructure can deliver.
3. The expansion of collateral acceptance.
The next important development is the number of clearing institutions, financing providers and collateral managers willing to accept DTC tokenized entitlements under their existing risk frameworks.
There is also a fourth question: whether the same security entitlement can move between traditional and digital financing arrangements without creating additional settlement, reconciliation or liquidity costs.
The future value of DTC’s digital twins will depend heavily on the answers.
Tokenization gives the security another way to move. Collateral mobility gives that movement an economic purpose.
The first major institutional benefit may come from making existing securities work harder across financial markets, rather than creating an entirely new secondary trading market around them
THE FIRST JOB OF A DTC DIGITAL TWIN: Collateral Mobility Before Secondary Trading
THE FIRST JOB OF A DTC DIGITAL TWIN: Collateral Mobility Before Secondary Trading
Independent Research | @AlphaCyl
I. The Asset Does Not Need to Leave DTC
The most important development in #DTCC tokenization programme may have little to do with secondary trading.
On October 28, 2026, The Depository Trust Company (DTC), a subsidiary of the Depository Trust & Clearing Corporation (DTCC), launched its Tokenization Service. The service allows eligible participants to convert securities already held at DTC into tokenized representations that can move between registered digital wallets.
DTCC holds more than $114 trillion in securities. Its stated objectives for tokenization include greater liquidity, collateral mobility and capital efficiency. The July 15 production event had already tested collateral pledges, securities lending, Treasury repo, equity delivery versus payment (DVP) and central counterparty (CCP) margin workflows.
The launch initially supports 34 securities, representing approximately $30 trillion in assets under custody. Twenty DTC Participants have signed agreements to access the service.
The interesting part is the structure.
The underlying securities remain within DTC. The token represents the corresponding security entitlement, while DTC maintains the official record of token movements and holdings through its LedgerScan infrastructure.
This paper argues that collateral mobility may become the first economically significant use case for DTC’s digital twins. The immediate opportunity is to make securities already held within the depository easier to deploy across financing, margin and collateral arrangements, without requiring their full withdrawal from DTC.
That is a narrower proposition than the usual argument that tokenization will produce continuous securities trading. It is also a more practical starting point for institutional adoption.
dtcc.com/press-releases…
dtcc.com/press-releases…
II. What DTC Actually Tokenizes
The first distinction is between the underlying security and the entitlement represented by its token.
In the traditional U.S. securities holding structure, DTC operates as the central securities depository. Securities are generally registered in the name of Cede & Co., DTC’s nominee, while DTC Participants maintain securities entitlements through their accounts.
The tokenization service introduces another way to represent and transfer those entitlements.
The process works in four stages:
1. A DTC Participant registers a digital wallet on a supported blockchain and submits a Tokenization Instruction for an eligible security held in its DTC account.
2. DTC applies its existing risk controls. Once the instruction is accepted, the relevant securities are debited from the Participant’s account and credited to DTC’s Digital Omnibus Account.
3. DTC’s ComposerX Factory system mints a token representing the corresponding security entitlement and delivers it to the registered wallet.
4. LedgerScan monitors blockchain movements and records the location of the tokens. Its record constitutes DTC’s official books and records for tokenized entitlements.
The Digital Omnibus Account is particularly important.
It holds the underlying traditional securities represented by the tokens. Those securities cannot be transferred out of the omnibus account until the corresponding tokens have been burned.
This is the control against double spending.
A Participant cannot transfer the token to another wallet and separately instruct DTC to transfer the same underlying security through its traditional books. The token movement or an authorized conversion back into book entry form must account for the entitlement.
The legal registration of the underlying securities also remains in Cede & Co.’s name.
Consequently, the digital twin gives the entitlement a blockchain based transfer mechanism while retaining the existing depository relationship.
There is another important distinction concerning the holder.
Only DTC Participants can register wallets under the #SecGov framework. A Participant may manage client sub wallets, but the DTC Participant associated with the registered wallet remains the entitlement holder of record in DTC’s system.
This means the service provides a new way for institutional participants to manage and distribute their securities entitlements. It does not automatically turn every individual wallet holder into a directly registered shareholder.
The SEC’s December 11, 2025 no action letter describes this arrangement in detail.
sec.gov/files/tm/no-ac…
dtcclearning.com/helpfiles/dda/…
III. Mechanism One: Turning a Security Into Mobile Collateral
Collateral mobility concerns how quickly an institution can make an asset available to satisfy an obligation.
A bank may hold Treasury securities, equities or other eligible instruments while simultaneously facing margin requirements, financing needs and obligations to multiple counterparties.
The problem is often location and availability.
An institution may have sufficient assets on its balance sheet but still face delays in making those assets available to the counterparty that needs them. The securities may sit with a custodian, within a particular settlement infrastructure or inside a collateral arrangement that requires several operational steps before they can be redeployed.
A tokenized entitlement introduces a different movement mechanism.
Consider a hypothetical dealer holding $100 million in eligible U.S. Treasury securities at DTC.
The dealer needs to satisfy a margin obligation with an external counterparty.
Under the traditional arrangement, the movement of securities may involve instructions between custodians, collateral agents and settlement infrastructure, together with eligibility checks, reconciliation and confirmation.
Under a tokenized arrangement:
- The dealer converts the eligible Treasury position into tokenized entitlements.
-The tokens are delivered to a registered wallet.
-The dealer transfers the relevant tokens to the counterparty’s registered wallet.
-The receiving institution can verify the movement through the blockchain and DTC’s associated records.
-The collateral arrangement governs the obligation, valuation, haircut and conditions for release.
The underlying securities remain within DTC’s Digital Omnibus Account throughout the tokenized holding period.
The operational advantage comes from moving the entitlement through a shared digital infrastructure rather than repeatedly processing movements through disconnected systems.
This can reduce the time spent waiting for confirmation, reconciling positions and coordinating transfers between institutions.
The distinction matters because collateral mobility can create economic value even when the underlying security never enters a public trading market.
A Treasury that can be mobilized more efficiently may support financing, margin and liquidity requirements across multiple institutional relationships.
The asset becomes more useful through its ability to move.
IV. Mechanism Two: The Difference Between DTC Tokenization and Collateral AppChain
There are two related DTCC initiatives that need to be separated.
The first is the DTC Tokenization Service.
It provides the mechanism for converting eligible securities held at DTC into tokenized entitlements, registering wallets, minting and burning tokens, and recording their movements.
The second is the DTCC Collateral AppChain.
It is a shared infrastructure platform designed to coordinate collateral management across providers, receivers, managers, triparty agents and custodians.
The distinction is important.
Tokenization gives the security entitlement a digital representation that can move between approved wallets.
Collateral infrastructure determines how that asset can be deployed against an obligation.
That second layer requires additional information and processes:
- Asset eligibility.
- Market valuation.
- Collateral haircuts.
- Margin requirements.
- Counterparty agreements.
- Allocation and substitution rules.
- Settlement and release conditions.
DTCC announced its collaboration with @chainlink on May 12 to integrate the #Chainlink Runtime Environment (CRE) and data standard into Collateral AppChain.
The integration is intended to support data and orchestration for asset pricing, valuations, eligibility, margining, collateral optimization and settlement.
This is significant because a token transfer alone cannot determine whether an asset satisfies a particular collateral requirement.
A receiving institution may accept one Treasury security at a particular haircut while rejecting an equity with the same market value. The collateral system must understand the agreement and the risk attached to each instrument.
The AppChain is designed to coordinate those decisions and movements through shared infrastructure.
DTCC has described its objective as supporting 24/7, near real-time collateral management across markets and blockchains.
Its May announcement targeted Q4 2026 for the AppChain’s production launch.
The two products therefore address different parts of the same operational problem: one makes eligible DTC securities mobile in digital form, while the other coordinates how collateral is identified, valued and deployed.
dtcc.com/press-releases…
dtcc.com/products-and-s…
V. Three Cases From Production
Case One: #JPMorgan and CME Group, July 15
One of the clearest demonstrations of collateral mobility came during DTCC’s July production event.
At 9:00 a.m. ET, J.P. Morgan successfully converted its position in the Invesco QQQ Trust (QQQ) into a tokenized asset.
At 10:45 a.m., J.P. Morgan successfully posted tokenized assets to satisfy central counterparty margin requirements with CME Group.
The significance is the destination of the asset.
The tokenized securities were being used in an established institutional margin workflow rather than simply being transferred between digital wallets for demonstration purposes.
This connects DTC held securities with the collateral requirements of a major derivatives clearing infrastructure.
DTCC’s production record identifies the transaction as one of the day’s major demonstrations of tokenized collateral mobility.
An important qualification: DTCC identifies the CCP margin workflow as operating through its separate Collateral AppChain product. The demonstration therefore validates the interaction between DTC-tokenized assets and collateral infrastructure, rather than proving that DTC itself has started assigning collateral value to tokens in its own risk-management system.
dtcc.com/products-and-s…
Case Two: The First Onchain U.S. Treasury Repo, July 2026
Temple Digital Group announced on July 27 that it had executed a live onchain U.S. Treasury repo transaction using the DTCC Tokenization Service.
The transaction involved a tokenized representation of a U.S. Treasury security financed against Circle’s USDCx on the Canton Network.
Temple’s institutional RFQ platform coordinated the transaction.
DRW and HIFI participated as principals, while Marex acted as prime broker and settlement agent.
#Hifi also confirmed its involvement in two onchain Treasury repo transactions during the July production initiative, executed through Temple Digital Group and Tradeweb.
The cash leg involved converting USD from a fiat account into USDC and then USDCx on #CantonNetwork . The Treasury and cash legs settled against each other in the digital environment.
The important feature was the separation of the underlying security from its digital movement.
The Treasury remained within DTC’s existing book entry framework while its tokenized representation participated in the financing transaction.
This is a particularly useful example because repo is fundamentally a financing arrangement.
One party provides securities and receives cash, with an agreement to reverse the transaction at a later date.
Tokenized securities can make the delivery and return of collateral more efficient, while tokenized cash can provide the corresponding payment leg.
The transaction also demonstrates why securities tokenization and digital money need to develop together.
A tokenized Treasury can move onchain, but the financing transaction still requires a reliable cash settlement instrument.
templedigitalgroup.com/news/temple-di…
templedigitalgroup.com/news/introduci…
Case Three: The Great Collateral Experiment, 2025
DTCC’s collateral mobility thesis predates the current Tokenization Service.
In 2025, DTCC organized the Great Collateral Experiment to test how distributed ledger technology could improve collateral management across institutions.
The experiment demonstrated the movement of tokenized assets through smart contracts incorporating collateral eligibility rules, haircut calculations and minimum transfer requirements.
DTCC’s retrospective published on April 29, 2026, reported that processes that traditionally took hours or a full business day were compressed into seconds during the demonstration.
The experiment also showed how participants could obtain immediate visibility into collateral movements rather than waiting for settlement confirmation.
This matters because collateral management involves more than transferring securities.
A margin call must be communicated, the collateral must satisfy agreed eligibility requirements, the receiving institution must obtain control, and the relevant records must be updated.
The experiment tested how these activities could be coordinated through shared infrastructure.
It also established an important foundation for the subsequent Collateral AppChain initiative.
The 2025 experiment and the July 2026 DTC production event are separate milestones. The former tested broader tokenized collateral infrastructure; the latter demonstrated production transactions involving securities tokenized through DTC.
dtcc.com/insights/2026/…
VI. The Economic Case: What Faster Collateral Actually Saves
The business case for collateral mobility comes down to the cost of holding assets in the wrong place or waiting for them to become available.
Institutions maintain liquidity buffers to meet unexpected funding requirements and margin calls.
Some assets remain idle because moving them between counterparties or jurisdictions takes time. Others require financing while the institution waits for collateral to settle.
Tokenized collateral can reduce these inefficiencies by allowing institutions to deploy assets closer to the moment they are needed.
DTCC and Finadium examined this opportunity in their May 2026 paper, Collateral Infrastructure for Tokenized Capital Markets.
One of the central use cases is intraday repo.
Intraday repo allows institutions to obtain secured funding for shorter periods rather than relying on overnight financing or carrying larger liquidity buffers throughout the day.
The paper compares daylight overdraft costs, using a 50-basis point Federal Reserve rate floor plus intermediary spreads, with intraday repo pricing of approximately 30–40 basis points.
Under that scenario, intraday repo could reduce funding costs by up to half.
The paper also cites @jpmorgan research suggesting that intraday repo could reduce operational costs by 56% compared with traditional funding sources across settlement risk, suboptimal capital management and data transmission errors.
DTCC provides another illustrative calculation.
In one model, applying Collateral AppChain to 15% of wholesale funding exposures, with a starting Liquidity Coverage Ratio of 130%, could reduce required High Quality Liquid Assets by 17%.
These figures are modeled scenarios, not savings already realized by DTCC participants.
The distinction matters. The economic benefit depends on how much funding activity moves onto the infrastructure, the assets accepted, the costs of implementation and the extent to which institutions can redeploy released capital.
The same paper estimates that an institution adopting the infrastructure could free approximately $150 million in capital and generate $9 million in incremental bank-wide revenue during its first year under one set of assumptions.
By year three, a scenario assuming 25% of business activity had moved to the platform estimated $1.9 billion in freed up capital and $225 million in incremental revenue.
These projections illustrate the potential scale of the opportunity. They should be treated as scenario analysis rather than observed financial results.
dtcc.com/-/media/collat…
VII. The Structural Limitation: A Token Is Not Automatically Eligible Collateral
There is an important restriction within the SEC’s authorization that changes how DTC’s tokenization service should be understood.
Under the December 11, 2025 no action letter, DTC does not assign tokenized entitlements collateral value or settlement value when calculating a Participant’s Net Debit Cap or Collateral Monitor.
These are part of DTC’s existing risk management framework.
The restriction means that a tokenized security cannot simply be counted as collateral within DTC’s own risk calculations because it exists on a blockchain.
This creates an important distinction between two types of collateral use.
External collateral use
A counterparty, clearing institution or financing provider may accept a DTC tokenized entitlement under its own eligibility rules, agreements and risk controls.
The July production transactions demonstrated this broader possibility.
DTC’s internal risk management
DTC does not assign these tokens collateral or settlement value for its own Net Debit Cap and Collateral Monitor calculations under the authorized framework.
The two arrangements operate under different rules.
There are also operational restrictions.
Only approved wallets can receive tokens. DTC screens registered wallets for OFAC compliance, and Participants remain responsible for the AML/KYC requirements associated with their customers.
DTC also retains administrative capabilities, including the ability to reverse certain token movements and recover tokens in cases involving loss, theft or erroneous entries.
The SEC authorization itself is limited.
The December 2025 letter provides a no action position for the specified service and regulatory provisions. It does not constitute blanket SEC approval of every possible tokenized securities activity.
The authorization runs for three years from the service’s launch.
These restrictions show that institutional adoption is being built around controlled access, recognized ownership records and existing financial market safeguards.
SEC No-Action Letter, December 11, 2025.
DTCC Tokenization Service FAQ.
sec.gov/files/tm/no-ac…
dtcc.com/-/media/Files/…
VIII. The Other Risk: Faster Settlement Can Change the Economics of Netting
There is another question worth examining before treating faster collateral movement as an automatic improvement.
Traditional financial institutions often benefit from netting.
A dealer may have multiple repo transactions with different counterparties. Rather than settling every gross obligation independently, the institution can offset incoming and outgoing cash and securities movements, reducing the amount that actually needs to settle.
Faster settlement can reduce the time assets spend in transit, but it can also reduce opportunities to net transactions.
The @IMFNews examined this tension in Chapter 3 of its October 2026 Global Financial Stability Report, Scaling Tokenization: New Efficiencies, New Vulnerabilities.
Its analysis highlights that shorter settlement cycles can increase gross bilateral settlement requirements when transactions that previously offset against one another must settle individually.
Programmable batching may help preserve some netting benefits by grouping transactions before settlement.
This introduces a trade off between immediate settlement and settlement efficiency.
The IMF also reports that tokenized repo activity averages approximately $303 billion in daily volume, while the traditional U.S. repo market handles roughly $13 trillion daily.
Despite the substantial tokenized activity, much of it remains concentrated among affiliated entities and private platforms.
The lesson for DTC is that moving securities faster does not automatically create a more efficient financing market.
The infrastructure must preserve the economic benefits of existing market arrangements while reducing unnecessary operational friction.
Tokenized collateral must also maintain reliable valuation, enforceable security interests, settlement finality and clear procedures for default and collateral release.
IMF, Global Financial Stability Report, October 2026, Chapter 3.
IMF, What Is Needed for Tokenization to Deliver, October 8, 2026.
imf.org/en/Publication…
imf.org/en/blogs/artic…
IX. Where the Research Points
The central thesis is that collateral mobility may provide the strongest initial economic justification for DTC’s digital twins.
The July production event demonstrated that DTC held securities could enter collateral pledges, CCP margin workflows, securities lending and Treasury repo transactions.
The October 28 launch has now established the service as a live institutional offering, with 20 Participants signed up and 34 securities available for tokenization at launch.
However, the real measure of adoption will be how frequently these securities are deployed across financing and collateral arrangements, and whether the resulting operational improvements translate into measurable balance-sheet benefits.
Three developments deserve particular attention:
1. The scale of collateral deployment.
How much DTC tokenized securities value moves into actual collateral arrangements? The number of tokenized assets alone will tell us little about their economic utilization.
2. The integration between DTC and Collateral AppChain.
Whether institutions can coordinate eligibility, valuation, margining and collateral movements across multiple counterparties and networks will determine how much value the combined infrastructure can deliver.
3. The expansion of collateral acceptance.
The next important development is the number of clearing institutions, financing providers and collateral managers willing to accept DTC tokenized entitlements under their existing risk frameworks.
There is also a fourth question: whether the same security entitlement can move between traditional and digital financing arrangements without creating additional settlement, reconciliation or liquidity costs.
The future value of DTC’s digital twins will depend heavily on the answers.
Tokenization gives the security another way to move. Collateral mobility gives that movement an economic purpose.
The first major institutional benefit may come from making existing securities work harder across financial markets, rather than creating an entirely new secondary trading market around them
Independent Research | @AlphaCyl
I. The Asset Does Not Need to Leave DTC
The most important development in #DTCC tokenization programme may have little to do with secondary trading.
On October 28, 2026, The Depository Trust Company (DTC), a subsidiary of the Depository Trust & Clearing Corporation (DTCC), launched its Tokenization Service. The service allows eligible participants to convert securities already held at DTC into tokenized representations that can move between registered digital wallets.
DTCC holds more than $114 trillion in securities. Its stated objectives for tokenization include greater liquidity, collateral mobility and capital efficiency. The July 15 production event had already tested collateral pledges, securities lending, Treasury repo, equity delivery versus payment (DVP) and central counterparty (CCP) margin workflows.
The launch initially supports 34 securities, representing approximately $30 trillion in assets under custody. Twenty DTC Participants have signed agreements to access the service.
The interesting part is the structure.
The underlying securities remain within DTC. The token represents the corresponding security entitlement, while DTC maintains the official record of token movements and holdings through its LedgerScan infrastructure.
This paper argues that collateral mobility may become the first economically significant use case for DTC’s digital twins. The immediate opportunity is to make securities already held within the depository easier to deploy across financing, margin and collateral arrangements, without requiring their full withdrawal from DTC.
That is a narrower proposition than the usual argument that tokenization will produce continuous securities trading. It is also a more practical starting point for institutional adoption.
dtcc.com/press-releases…
dtcc.com/press-releases…
II. What DTC Actually Tokenizes
The first distinction is between the underlying security and the entitlement represented by its token.
In the traditional U.S. securities holding structure, DTC operates as the central securities depository. Securities are generally registered in the name of Cede & Co., DTC’s nominee, while DTC Participants maintain securities entitlements through their accounts.
The tokenization service introduces another way to represent and transfer those entitlements.
The process works in four stages:
1. A DTC Participant registers a digital wallet on a supported blockchain and submits a Tokenization Instruction for an eligible security held in its DTC account.
2. DTC applies its existing risk controls. Once the instruction is accepted, the relevant securities are debited from the Participant’s account and credited to DTC’s Digital Omnibus Account.
3. DTC’s ComposerX Factory system mints a token representing the corresponding security entitlement and delivers it to the registered wallet.
4. LedgerScan monitors blockchain movements and records the location of the tokens. Its record constitutes DTC’s official books and records for tokenized entitlements.
The Digital Omnibus Account is particularly important.
It holds the underlying traditional securities represented by the tokens. Those securities cannot be transferred out of the omnibus account until the corresponding tokens have been burned.
This is the control against double spending.
A Participant cannot transfer the token to another wallet and separately instruct DTC to transfer the same underlying security through its traditional books. The token movement or an authorized conversion back into book entry form must account for the entitlement.
The legal registration of the underlying securities also remains in Cede & Co.’s name.
Consequently, the digital twin gives the entitlement a blockchain based transfer mechanism while retaining the existing depository relationship.
There is another important distinction concerning the holder.
Only DTC Participants can register wallets under the #SecGov framework. A Participant may manage client sub wallets, but the DTC Participant associated with the registered wallet remains the entitlement holder of record in DTC’s system.
This means the service provides a new way for institutional participants to manage and distribute their securities entitlements. It does not automatically turn every individual wallet holder into a directly registered shareholder.
The SEC’s December 11, 2025 no action letter describes this arrangement in detail.
sec.gov/files/tm/no-ac…
dtcclearning.com/helpfiles/dda/…
III. Mechanism One: Turning a Security Into Mobile Collateral
Collateral mobility concerns how quickly an institution can make an asset available to satisfy an obligation.
A bank may hold Treasury securities, equities or other eligible instruments while simultaneously facing margin requirements, financing needs and obligations to multiple counterparties.
The problem is often location and availability.
An institution may have sufficient assets on its balance sheet but still face delays in making those assets available to the counterparty that needs them. The securities may sit with a custodian, within a particular settlement infrastructure or inside a collateral arrangement that requires several operational steps before they can be redeployed.
A tokenized entitlement introduces a different movement mechanism.
Consider a hypothetical dealer holding $100 million in eligible U.S. Treasury securities at DTC.
The dealer needs to satisfy a margin obligation with an external counterparty.
Under the traditional arrangement, the movement of securities may involve instructions between custodians, collateral agents and settlement infrastructure, together with eligibility checks, reconciliation and confirmation.
Under a tokenized arrangement:
- The dealer converts the eligible Treasury position into tokenized entitlements.
-The tokens are delivered to a registered wallet.
-The dealer transfers the relevant tokens to the counterparty’s registered wallet.
-The receiving institution can verify the movement through the blockchain and DTC’s associated records.
-The collateral arrangement governs the obligation, valuation, haircut and conditions for release.
The underlying securities remain within DTC’s Digital Omnibus Account throughout the tokenized holding period.
The operational advantage comes from moving the entitlement through a shared digital infrastructure rather than repeatedly processing movements through disconnected systems.
This can reduce the time spent waiting for confirmation, reconciling positions and coordinating transfers between institutions.
The distinction matters because collateral mobility can create economic value even when the underlying security never enters a public trading market.
A Treasury that can be mobilized more efficiently may support financing, margin and liquidity requirements across multiple institutional relationships.
The asset becomes more useful through its ability to move.
IV. Mechanism Two: The Difference Between DTC Tokenization and Collateral AppChain
There are two related DTCC initiatives that need to be separated.
The first is the DTC Tokenization Service.
It provides the mechanism for converting eligible securities held at DTC into tokenized entitlements, registering wallets, minting and burning tokens, and recording their movements.
The second is the DTCC Collateral AppChain.
It is a shared infrastructure platform designed to coordinate collateral management across providers, receivers, managers, triparty agents and custodians.
The distinction is important.
Tokenization gives the security entitlement a digital representation that can move between approved wallets.
Collateral infrastructure determines how that asset can be deployed against an obligation.
That second layer requires additional information and processes:
- Asset eligibility.
- Market valuation.
- Collateral haircuts.
- Margin requirements.
- Counterparty agreements.
- Allocation and substitution rules.
- Settlement and release conditions.
DTCC announced its collaboration with @chainlink on May 12 to integrate the #Chainlink Runtime Environment (CRE) and data standard into Collateral AppChain.
The integration is intended to support data and orchestration for asset pricing, valuations, eligibility, margining, collateral optimization and settlement.
This is significant because a token transfer alone cannot determine whether an asset satisfies a particular collateral requirement.
A receiving institution may accept one Treasury security at a particular haircut while rejecting an equity with the same market value. The collateral system must understand the agreement and the risk attached to each instrument.
The AppChain is designed to coordinate those decisions and movements through shared infrastructure.
DTCC has described its objective as supporting 24/7, near real-time collateral management across markets and blockchains.
Its May announcement targeted Q4 2026 for the AppChain’s production launch.
The two products therefore address different parts of the same operational problem: one makes eligible DTC securities mobile in digital form, while the other coordinates how collateral is identified, valued and deployed.
dtcc.com/press-releases…
dtcc.com/products-and-s…
V. Three Cases From Production
Case One: #JPMorgan and CME Group, July 15
One of the clearest demonstrations of collateral mobility came during DTCC’s July production event.
At 9:00 a.m. ET, J.P. Morgan successfully converted its position in the Invesco QQQ Trust (QQQ) into a tokenized asset.
At 10:45 a.m., J.P. Morgan successfully posted tokenized assets to satisfy central counterparty margin requirements with CME Group.
The significance is the destination of the asset.
The tokenized securities were being used in an established institutional margin workflow rather than simply being transferred between digital wallets for demonstration purposes.
This connects DTC held securities with the collateral requirements of a major derivatives clearing infrastructure.
DTCC’s production record identifies the transaction as one of the day’s major demonstrations of tokenized collateral mobility.
An important qualification: DTCC identifies the CCP margin workflow as operating through its separate Collateral AppChain product. The demonstration therefore validates the interaction between DTC-tokenized assets and collateral infrastructure, rather than proving that DTC itself has started assigning collateral value to tokens in its own risk-management system.
dtcc.com/products-and-s…
Case Two: The First Onchain U.S. Treasury Repo, July 2026
Temple Digital Group announced on July 27 that it had executed a live onchain U.S. Treasury repo transaction using the DTCC Tokenization Service.
The transaction involved a tokenized representation of a U.S. Treasury security financed against Circle’s USDCx on the Canton Network.
Temple’s institutional RFQ platform coordinated the transaction.
DRW and HIFI participated as principals, while Marex acted as prime broker and settlement agent.
#Hifi also confirmed its involvement in two onchain Treasury repo transactions during the July production initiative, executed through Temple Digital Group and Tradeweb.
The cash leg involved converting USD from a fiat account into USDC and then USDCx on #CantonNetwork . The Treasury and cash legs settled against each other in the digital environment.
The important feature was the separation of the underlying security from its digital movement.
The Treasury remained within DTC’s existing book entry framework while its tokenized representation participated in the financing transaction.
This is a particularly useful example because repo is fundamentally a financing arrangement.
One party provides securities and receives cash, with an agreement to reverse the transaction at a later date.
Tokenized securities can make the delivery and return of collateral more efficient, while tokenized cash can provide the corresponding payment leg.
The transaction also demonstrates why securities tokenization and digital money need to develop together.
A tokenized Treasury can move onchain, but the financing transaction still requires a reliable cash settlement instrument.
templedigitalgroup.com/news/temple-di…
templedigitalgroup.com/news/introduci…
Case Three: The Great Collateral Experiment, 2025
DTCC’s collateral mobility thesis predates the current Tokenization Service.
In 2025, DTCC organized the Great Collateral Experiment to test how distributed ledger technology could improve collateral management across institutions.
The experiment demonstrated the movement of tokenized assets through smart contracts incorporating collateral eligibility rules, haircut calculations and minimum transfer requirements.
DTCC’s retrospective published on April 29, 2026, reported that processes that traditionally took hours or a full business day were compressed into seconds during the demonstration.
The experiment also showed how participants could obtain immediate visibility into collateral movements rather than waiting for settlement confirmation.
This matters because collateral management involves more than transferring securities.
A margin call must be communicated, the collateral must satisfy agreed eligibility requirements, the receiving institution must obtain control, and the relevant records must be updated.
The experiment tested how these activities could be coordinated through shared infrastructure.
It also established an important foundation for the subsequent Collateral AppChain initiative.
The 2025 experiment and the July 2026 DTC production event are separate milestones. The former tested broader tokenized collateral infrastructure; the latter demonstrated production transactions involving securities tokenized through DTC.
dtcc.com/insights/2026/…
VI. The Economic Case: What Faster Collateral Actually Saves
The business case for collateral mobility comes down to the cost of holding assets in the wrong place or waiting for them to become available.
Institutions maintain liquidity buffers to meet unexpected funding requirements and margin calls.
Some assets remain idle because moving them between counterparties or jurisdictions takes time. Others require financing while the institution waits for collateral to settle.
Tokenized collateral can reduce these inefficiencies by allowing institutions to deploy assets closer to the moment they are needed.
DTCC and Finadium examined this opportunity in their May 2026 paper, Collateral Infrastructure for Tokenized Capital Markets.
One of the central use cases is intraday repo.
Intraday repo allows institutions to obtain secured funding for shorter periods rather than relying on overnight financing or carrying larger liquidity buffers throughout the day.
The paper compares daylight overdraft costs, using a 50-basis point Federal Reserve rate floor plus intermediary spreads, with intraday repo pricing of approximately 30–40 basis points.
Under that scenario, intraday repo could reduce funding costs by up to half.
The paper also cites @jpmorgan research suggesting that intraday repo could reduce operational costs by 56% compared with traditional funding sources across settlement risk, suboptimal capital management and data transmission errors.
DTCC provides another illustrative calculation.
In one model, applying Collateral AppChain to 15% of wholesale funding exposures, with a starting Liquidity Coverage Ratio of 130%, could reduce required High Quality Liquid Assets by 17%.
These figures are modeled scenarios, not savings already realized by DTCC participants.
The distinction matters. The economic benefit depends on how much funding activity moves onto the infrastructure, the assets accepted, the costs of implementation and the extent to which institutions can redeploy released capital.
The same paper estimates that an institution adopting the infrastructure could free approximately $150 million in capital and generate $9 million in incremental bank-wide revenue during its first year under one set of assumptions.
By year three, a scenario assuming 25% of business activity had moved to the platform estimated $1.9 billion in freed up capital and $225 million in incremental revenue.
These projections illustrate the potential scale of the opportunity. They should be treated as scenario analysis rather than observed financial results.
dtcc.com/-/media/collat…
VII. The Structural Limitation: A Token Is Not Automatically Eligible Collateral
There is an important restriction within the SEC’s authorization that changes how DTC’s tokenization service should be understood.
Under the December 11, 2025 no action letter, DTC does not assign tokenized entitlements collateral value or settlement value when calculating a Participant’s Net Debit Cap or Collateral Monitor.
These are part of DTC’s existing risk management framework.
The restriction means that a tokenized security cannot simply be counted as collateral within DTC’s own risk calculations because it exists on a blockchain.
This creates an important distinction between two types of collateral use.
External collateral use
A counterparty, clearing institution or financing provider may accept a DTC tokenized entitlement under its own eligibility rules, agreements and risk controls.
The July production transactions demonstrated this broader possibility.
DTC’s internal risk management
DTC does not assign these tokens collateral or settlement value for its own Net Debit Cap and Collateral Monitor calculations under the authorized framework.
The two arrangements operate under different rules.
There are also operational restrictions.
Only approved wallets can receive tokens. DTC screens registered wallets for OFAC compliance, and Participants remain responsible for the AML/KYC requirements associated with their customers.
DTC also retains administrative capabilities, including the ability to reverse certain token movements and recover tokens in cases involving loss, theft or erroneous entries.
The SEC authorization itself is limited.
The December 2025 letter provides a no action position for the specified service and regulatory provisions. It does not constitute blanket SEC approval of every possible tokenized securities activity.
The authorization runs for three years from the service’s launch.
These restrictions show that institutional adoption is being built around controlled access, recognized ownership records and existing financial market safeguards.
SEC No-Action Letter, December 11, 2025.
DTCC Tokenization Service FAQ.
sec.gov/files/tm/no-ac…
dtcc.com/-/media/Files/…
VIII. The Other Risk: Faster Settlement Can Change the Economics of Netting
There is another question worth examining before treating faster collateral movement as an automatic improvement.
Traditional financial institutions often benefit from netting.
A dealer may have multiple repo transactions with different counterparties. Rather than settling every gross obligation independently, the institution can offset incoming and outgoing cash and securities movements, reducing the amount that actually needs to settle.
Faster settlement can reduce the time assets spend in transit, but it can also reduce opportunities to net transactions.
The @IMFNews examined this tension in Chapter 3 of its October 2026 Global Financial Stability Report, Scaling Tokenization: New Efficiencies, New Vulnerabilities.
Its analysis highlights that shorter settlement cycles can increase gross bilateral settlement requirements when transactions that previously offset against one another must settle individually.
Programmable batching may help preserve some netting benefits by grouping transactions before settlement.
This introduces a trade off between immediate settlement and settlement efficiency.
The IMF also reports that tokenized repo activity averages approximately $303 billion in daily volume, while the traditional U.S. repo market handles roughly $13 trillion daily.
Despite the substantial tokenized activity, much of it remains concentrated among affiliated entities and private platforms.
The lesson for DTC is that moving securities faster does not automatically create a more efficient financing market.
The infrastructure must preserve the economic benefits of existing market arrangements while reducing unnecessary operational friction.
Tokenized collateral must also maintain reliable valuation, enforceable security interests, settlement finality and clear procedures for default and collateral release.
IMF, Global Financial Stability Report, October 2026, Chapter 3.
IMF, What Is Needed for Tokenization to Deliver, October 8, 2026.
imf.org/en/Publication…
imf.org/en/blogs/artic…
IX. Where the Research Points
The central thesis is that collateral mobility may provide the strongest initial economic justification for DTC’s digital twins.
The July production event demonstrated that DTC held securities could enter collateral pledges, CCP margin workflows, securities lending and Treasury repo transactions.
The October 28 launch has now established the service as a live institutional offering, with 20 Participants signed up and 34 securities available for tokenization at launch.
However, the real measure of adoption will be how frequently these securities are deployed across financing and collateral arrangements, and whether the resulting operational improvements translate into measurable balance-sheet benefits.
Three developments deserve particular attention:
1. The scale of collateral deployment.
How much DTC tokenized securities value moves into actual collateral arrangements? The number of tokenized assets alone will tell us little about their economic utilization.
2. The integration between DTC and Collateral AppChain.
Whether institutions can coordinate eligibility, valuation, margining and collateral movements across multiple counterparties and networks will determine how much value the combined infrastructure can deliver.
3. The expansion of collateral acceptance.
The next important development is the number of clearing institutions, financing providers and collateral managers willing to accept DTC tokenized entitlements under their existing risk frameworks.
There is also a fourth question: whether the same security entitlement can move between traditional and digital financing arrangements without creating additional settlement, reconciliation or liquidity costs.
The future value of DTC’s digital twins will depend heavily on the answers.
Tokenization gives the security another way to move. Collateral mobility gives that movement an economic purpose.
The first major institutional benefit may come from making existing securities work harder across financial markets, rather than creating an entirely new secondary trading market around them
2
914
·
--
Bearish
$BTC monthly: sitting just above the old 60k zone, liquidity drying up
Monthly candle is red and we still haven’t tagged the nearest real support from the 2023 early 2024 range (roughly 61–62k). Price is hanging around 64.6–64.7k after the run to 126k.
Back then the market was thinner, less regulated, and mostly retail + a few funds. Volatility was high because positioning was smaller and flows were easier to move. That environment is gone. More institutions are in, more rules exist, and the hacks haven’t stopped. The expectation was that this would add depth and slow the swings. Instead the tape has become quieter on the way down and the order books feel thinner again.
The 126k area attracted the big interest. Once that interest cooled, the same participants who pushed it higher have less incentive to defend lower levels aggressively. Monthly structure is now below the faster MAs and volume has stepped down. The 60–62k pocket was a major magnet in the previous cycle; price has respected it as a floor before. We’re close enough that a proper test is still on the table if selling continues.
Not calling a breakdown yet just noting that the character of the market has shifted and the liquidity that was available on the way up is no longer obvious on the way down. Watching how this monthly closes relative to that old range.
$BTC monthly: sitting just above the old 60k zone, liquidity drying up
Monthly candle is red and we still haven’t tagged the nearest real support from the 2023 early 2024 range (roughly 61–62k). Price is hanging around 64.6–64.7k after the run to 126k.
Back then the market was thinner, less regulated, and mostly retail + a few funds. Volatility was high because positioning was smaller and flows were easier to move. That environment is gone. More institutions are in, more rules exist, and the hacks haven’t stopped. The expectation was that this would add depth and slow the swings. Instead the tape has become quieter on the way down and the order books feel thinner again.
The 126k area attracted the big interest. Once that interest cooled, the same participants who pushed it higher have less incentive to defend lower levels aggressively. Monthly structure is now below the faster MAs and volume has stepped down. The 60–62k pocket was a major magnet in the previous cycle; price has respected it as a floor before. We’re close enough that a proper test is still on the table if selling continues.
Not calling a breakdown yet just noting that the character of the market has shifted and the liquidity that was available on the way up is no longer obvious on the way down. Watching how this monthly closes relative to that old range.
Monthly candle is red and we still haven’t tagged the nearest real support from the 2023 early 2024 range (roughly 61–62k). Price is hanging around 64.6–64.7k after the run to 126k.
Back then the market was thinner, less regulated, and mostly retail + a few funds. Volatility was high because positioning was smaller and flows were easier to move. That environment is gone. More institutions are in, more rules exist, and the hacks haven’t stopped. The expectation was that this would add depth and slow the swings. Instead the tape has become quieter on the way down and the order books feel thinner again.
The 126k area attracted the big interest. Once that interest cooled, the same participants who pushed it higher have less incentive to defend lower levels aggressively. Monthly structure is now below the faster MAs and volume has stepped down. The 60–62k pocket was a major magnet in the previous cycle; price has respected it as a floor before. We’re close enough that a proper test is still on the table if selling continues.
Not calling a breakdown yet just noting that the character of the market has shifted and the liquidity that was available on the way up is no longer obvious on the way down. Watching how this monthly closes relative to that old range.
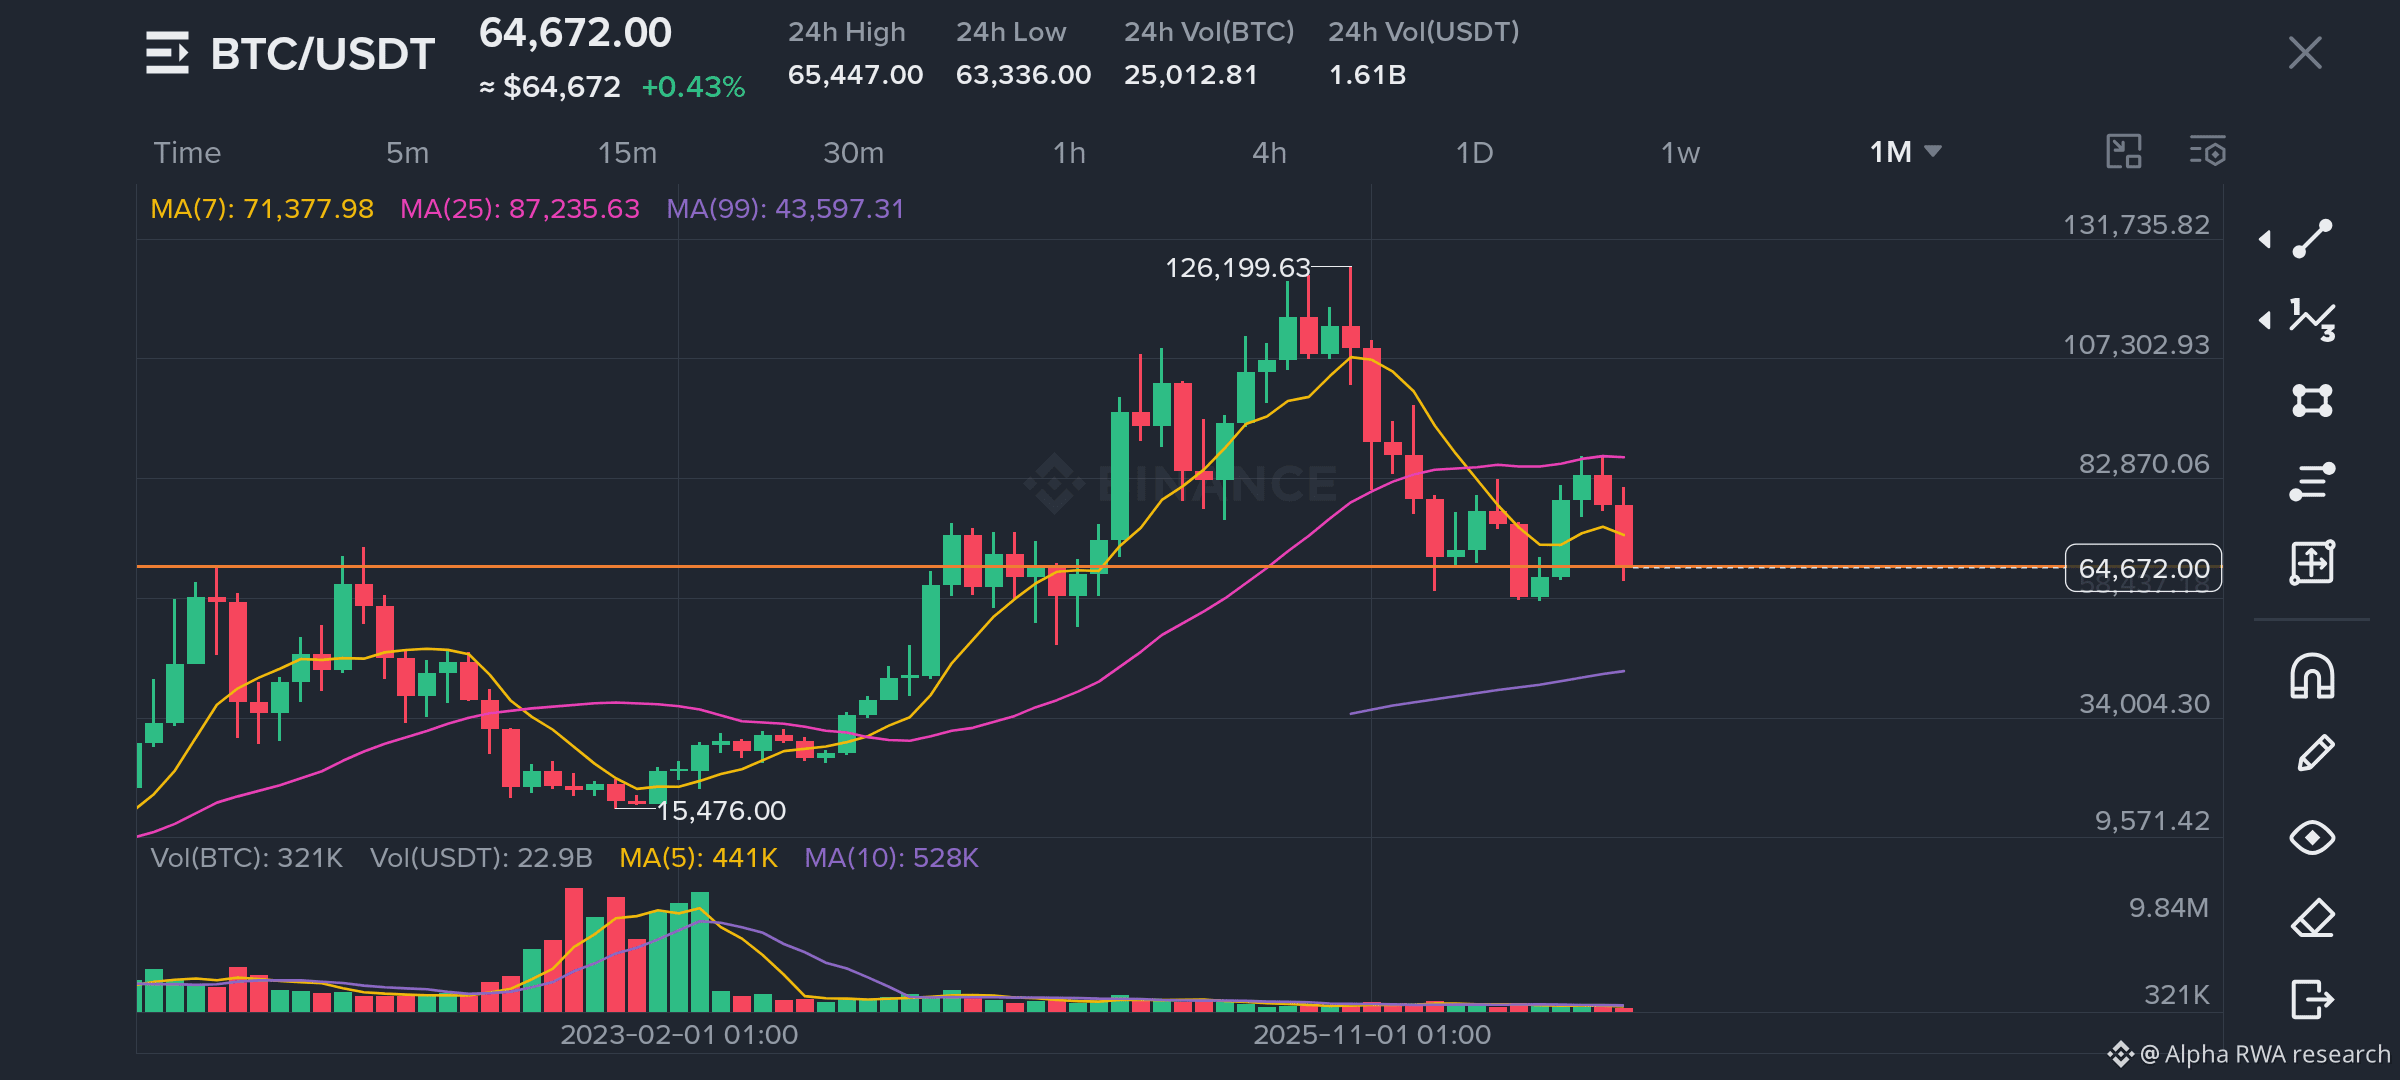
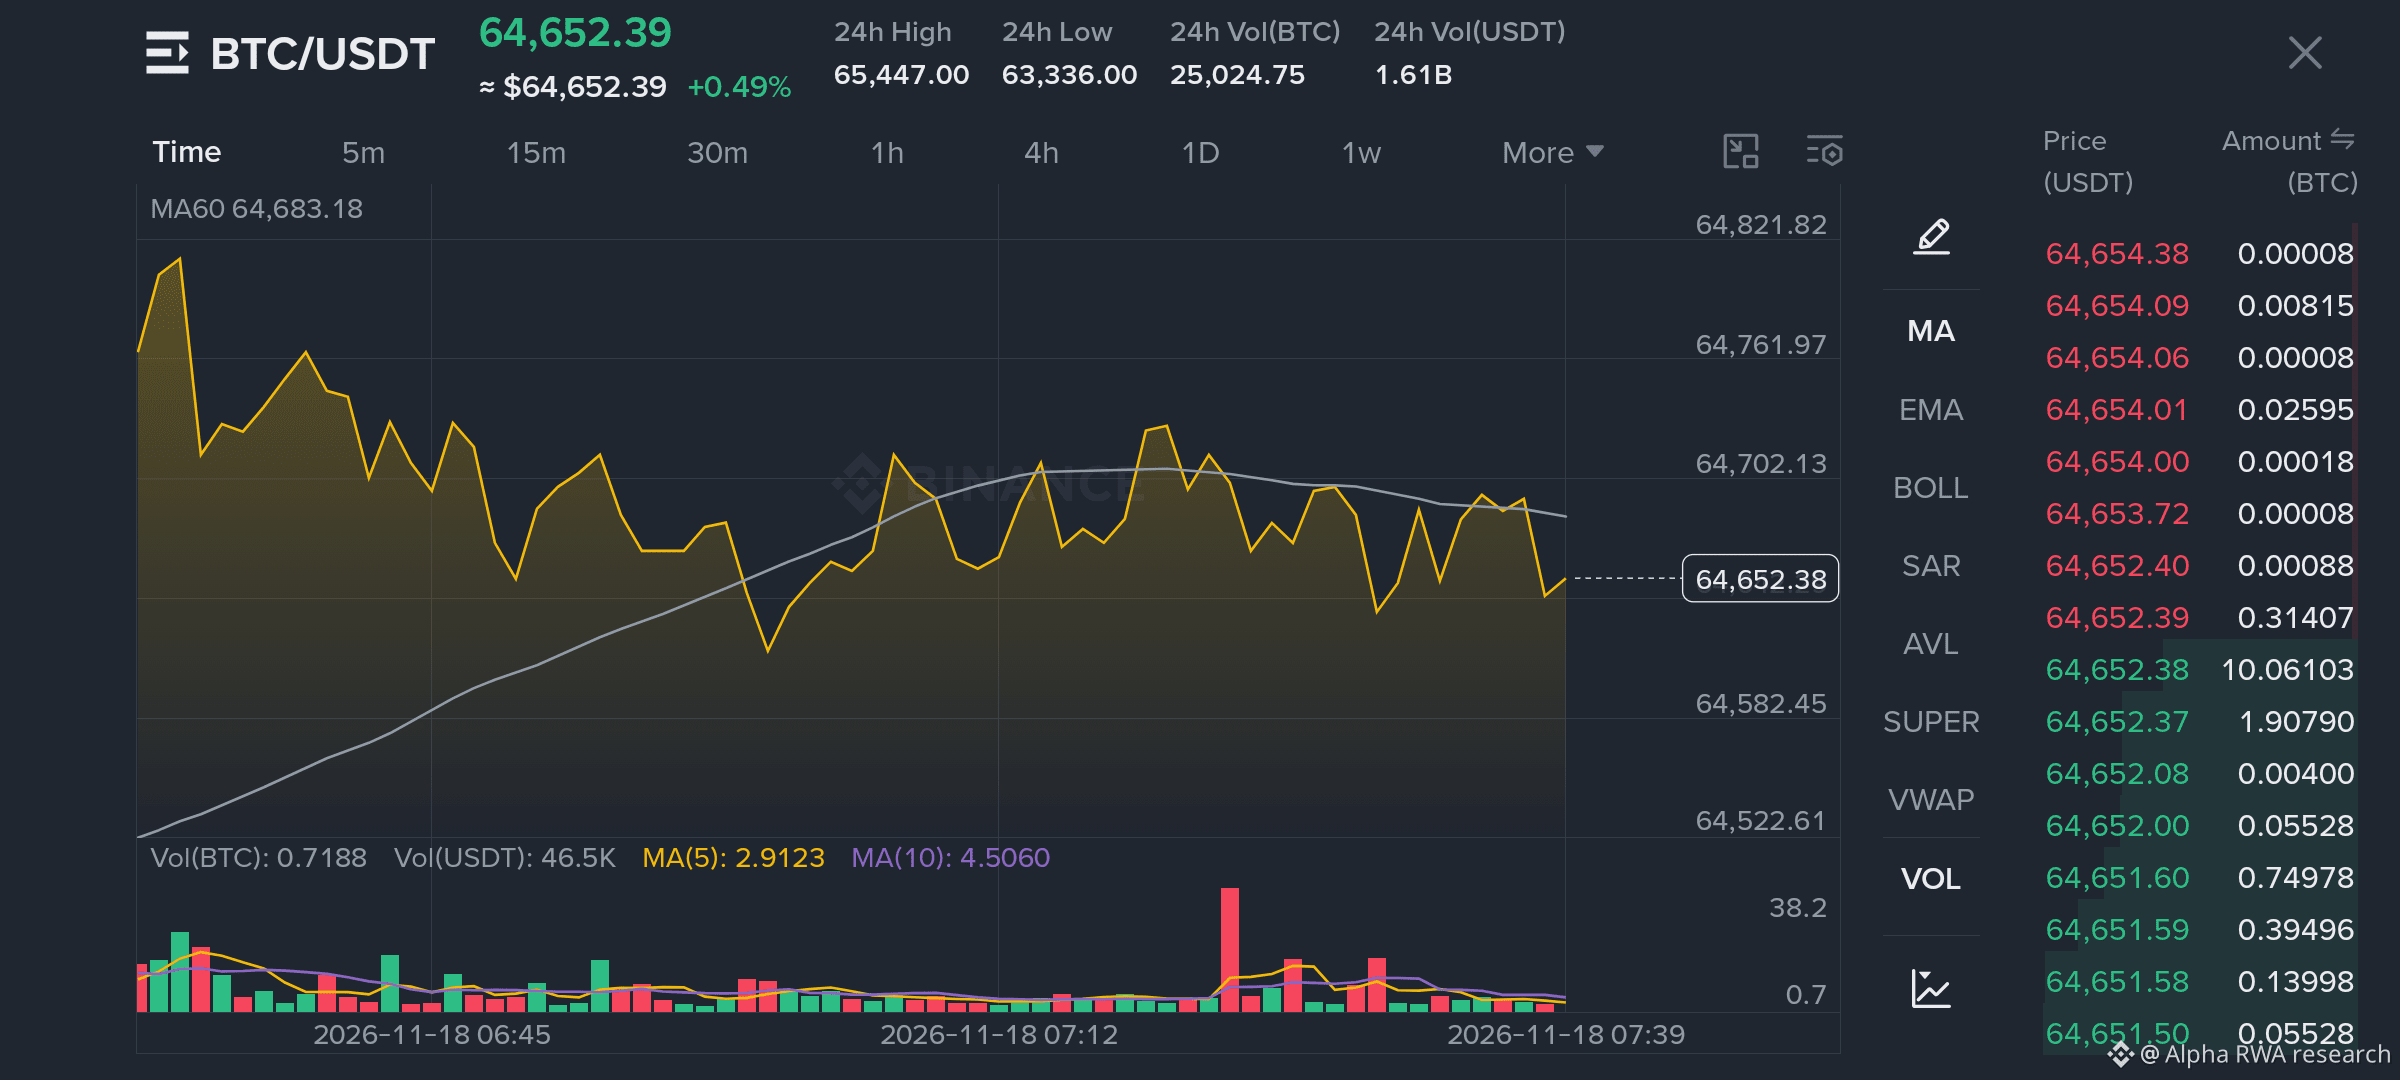
1
575
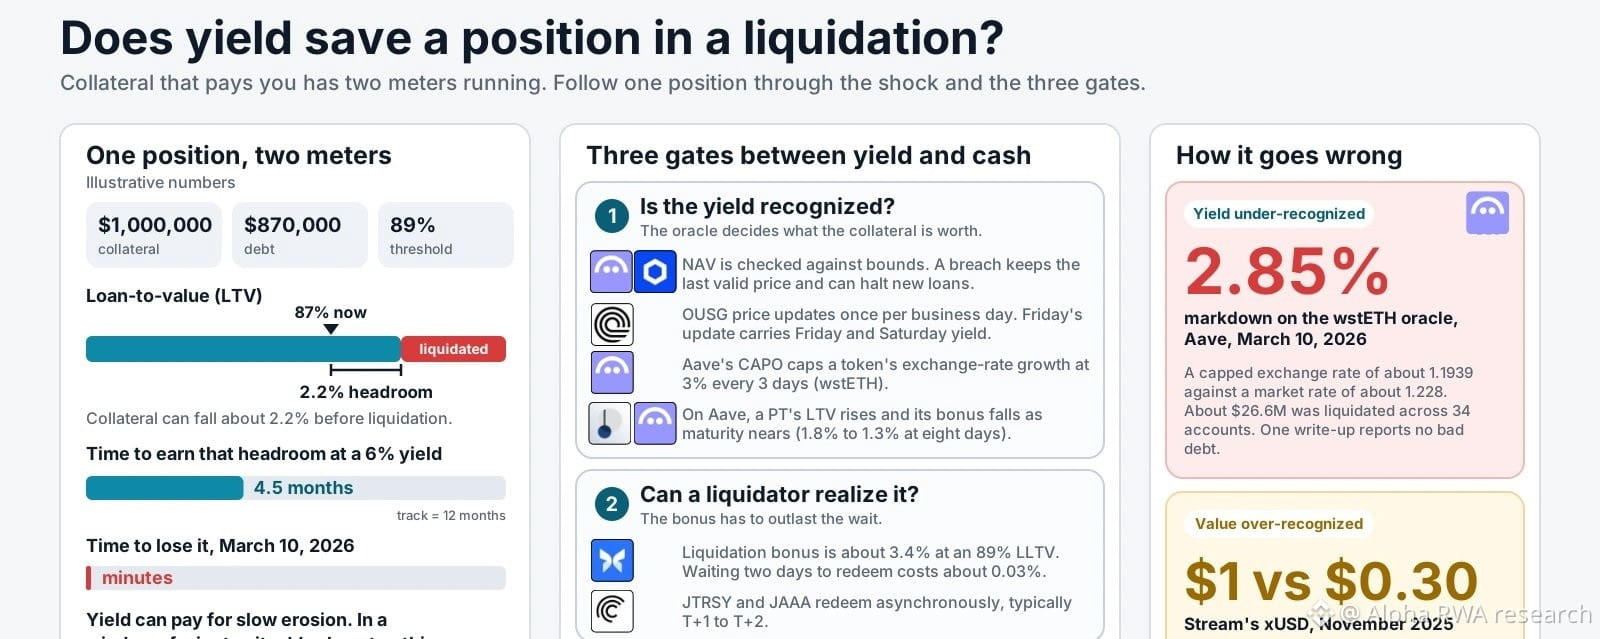
Article
When the Collateral Pays You: Yield, Debt and the Liquidation EngineWhen the Collateral Pays You: Yield, Debt and the Liquidation Engine
I. Two Meters Running
A loan against yield bearing collateral has two meters running. The collateral’s value rises as yield accrues. The debt rises as interest accrues. Health is collateral value times the liquidation threshold, divided by debt, and both sides of that fraction move every day.
This paper argues that the accrual itself is small next to the risks around it. Three questions decide whether yield helps a position: whether the oracle recognizes the yield, whether the liquidator can realize it, and whether the liquidator is allowed to reach it.
The arithmetic shows how small the accrual is. At an illustrative 3.5% yield, a 1% markdown in collateral value takes about 3.4 months of yield to earn back. Take a $JAAA.ETF style market, where a governance proposal lifted the liquidation threshold from 86% to 89%. A borrower at an 87% LTV has about 2.2% of headroom, and at an illustrative 6% yield that headroom is about 4.5 months of income. Yield can compensate for slow erosion. In a liquidation window of minutes it adds almost nothing.
II. Mechanism One: How the Oracle Recognizes Yield
Four designs show different answers.
NAV with bounds (#AAVE Horizon). When an issuer reports a new NAV, the #Chainlink network checks it against preset upper and lower bounds before publishing it onchain. aave.com/docs/aave-v3/h… If the report falls outside the bounds, the update is rejected and the oracle keeps reporting the last valid price. Any breach also prompts the emergency multisig to halt new loan originations until the cause is found. The design chooses to keep a stale price over acting on a bad one.
github-users.yhajoa.workers.dev/aave/aave-v3-h…
aave.com/docs/aave-v3/h…
Discrete issuer cadence (OUSG). #ONDO updates the onchain price once every business day, aiming for 4 to 6 p.m. ET, and says the manual process can run late. The Friday update includes the yield for Friday and Saturday, and whoever holds the token at the update gets the yield. At 3.5% that is roughly one basis point a day, so the oracle’s flat spot between updates costs almost nothing in yield terms. The rest of the weekend is a price shock window with no new NAV.
docs.ondo.finance/qualified-acce…
A cap on growth (#AAVE #CAPO , wstETH). CAPO limits how fast a yield bearing token’s exchange rate can grow. It stores a snapshot ratio and timestamp, and onchain rules cap the snapshot ratio’s increase at 3% every 3 days. This design recognizes yield by modeling its maximum speed.
governance.aave.com/t/post-mortem-…
Accretion to par (#PENDLE PTs on Aave).
Chaos Labs’ framework raises the LTV and liquidation threshold, and lowers the liquidation bonus, as a PT approaches maturity. A June 2026 Risk Steward update for PT $USDE 18JUN2026, eight days from maturity, put the model implied discount near 0.06%, raised LTV and LT by 0.1 point each, and cut the bonus from 1.8% to 1.3%. Here the yield is a schedule, and the risk parameters follow it.
governance.aave.com/t/arfc-pendle-…
III. Mechanism Two: What the Liquidator Receives
A liquidator on #morpho repays debt and seizes collateral plus a fixed incentive. The incentive factor is the smaller of 1.15 and 1 divided by (0.3 × LLTV + 0.7), and the whole amount goes to the liquidator with no protocol fee. At an 89% LLTV that is about 3.4%. docs.morpho.org/learn/concepts… A liquidator who then waits two days to redeem at a 5% funding cost pays about 0.03%. In calm conditions the bonus far exceeds the carry cost. Its job is to cover the case where redemption stalls, which is a gating risk that a price volatility bonus was not built for.
governance.aave.com/t/arfc-horizon…
Reaching the collateral is a second constraint. On #AAVE Horizon, RWA liquidators, typically market makers, must meet issuer defined investor requirements to liquidate collateral or redeem the RWAs. A comparison of tokenized collateral lending quotes @eulerfinance Securitize vaults as failing the collateral transfer if the recipient is not approved. A liquidation can fail at the token’s transfer check, so the accrued yield inside the token is out of reach for most wallets. SentoraHQ research frames the resulting risk as NAV latency, settlement delays and the capacity of approved liquidators, on top of price volatility.
sentora.com/research/artic…
protofire.io/guides/lending…
Redemption timing adds to it. One RWA liquidity guide describes @centrifuge JTRSY and $JAAA.ETF as ERC-7540 products that settle asynchronously, typically at T+1 to T+2.
coinpaprika.com/education/rwa-…
IV. Mechanism Three: Distribution Style Changes What Is “Accrued”
Yield can reach a holder as a rising price, a growing balance, or a monthly or daily airdrop of new tokens. For collateral accounting the distinction decides what sits in the token at the moment of seizure. An accumulating token carries its accrued yield in its price. A token that distributes yield as new tokens leaves the undistributed portion off the balance until the next payment. SteakhouseFi BUIDL overview warns that in kind distributions may cause similar integration issues to rebasing tokens. BUIDL’s move to daily payment, announced in January 2025, shrank that gap from up to a month to about a day.
kitchen.steakhouse.financial/p/blackrock-bu…
V. Cases
Case One: Aave’s CAPO error, March 10, 2026 (yield under-recognized). A newly deployed CAPO Risk Agent pushed a parameter update that depressed the wstETH oracle price by about 2.85% and triggered roughly $26.6 million of liquidations. The oracle reported a capped exchange rate near 1.1939 against a market rate near 1.228, and about 10,938 wstETH was liquidated across 34 accounts. One incident write up reports no attacker and no bad debt. governance.aave.com/t/post-mortem-… The mechanism was a mismatch between two stored values: the ratio was rate limited and the timestamp was not. The model of yield growth fell behind real yield growth, and at tight LT bands a 2.85% error exceeds the headroom.
theblock.co/news/ecosystem…
smartcontractshacking.com/hacks/aave-v3-…
Case Two: StreamDefi xUSD, November 2025 (value over recognized). The opposite failure. On @MorphoLabs , eulerfinance and SiloFinance , vaults priced xUSD at a fixed $1 while its market price collapsed, so the liquidations that should have unwound the loans never triggered. xUSD traded near $0.30 on secondary markets. A yield bearing wrapper backed by an opaque off chain strategy, priced at a hardcoded number, had no liquidation engine looking at its real value. Figures for losses and bad debt differ across sources, so I avoid quoting a total.
pharos.watch/learn/case-stu…
startupfortune.com/sp-global-laun…
Case Three: an issuer side change. @Securitize January 2025 shift to daily BUIDL dividends changed what a collateral lender sees on a given day without any protocol touching its own code. The issuer’s accounting model is part of the lender’s risk model.
VI. The Structural Question: Buffer or Carry?
Yield works as a buffer only over long periods. Over a weekend, a debt rate above the asset yield drifts a position by about one basis point. The practical reasons to model yield are narrower. A stale baseline can create false liquidations, as with CAPO. A schedule can tighten parameters toward maturity, as with PTs. And a hardcoded price removes the engine’s ability to see a loss at all.
The three approaches line up as follows. Horizon style bounded NAV treats the issuer’s number as the truth within a corridor and halts new borrowing on a breach. PT style schedules turn yield into a time based risk parameter. Hardcoded pricing avoids false liquidations at the cost of missing real ones.
Dune analysis of Horizon summarizes the shift: liquidation risk moves from price volatility toward operational factors like NAV timeliness and oracle integrity.
dune.com/blog/dune-dige…
VII. Where the Research Points
This paper’s thesis is that lenders on yield bearing RWAs should price three things next to LTV: how often the NAV updates, how fast the token can be turned into cash by an eligible liquidator, and how the issuer pays yield. Three things to watch:
1.The first sizable liquidation of an RWA position on a permissioned market, and how the liquidator exits.
2.Whether other lenders adopt maturity or cadence aware parameter schedules the way Aave did for PTs.
3.Whether the set of eligible liquidators for issuer-gated collateral widens or stays concentrated in a few market makers.
Independent research. Not financial advice. Always conduct your own due diligence
When the Collateral Pays You: Yield, Debt and the Liquidation Engine
When the Collateral Pays You: Yield, Debt and the Liquidation Engine
I. Two Meters Running
A loan against yield bearing collateral has two meters running. The collateral’s value rises as yield accrues. The debt rises as interest accrues. Health is collateral value times the liquidation threshold, divided by debt, and both sides of that fraction move every day.
This paper argues that the accrual itself is small next to the risks around it. Three questions decide whether yield helps a position: whether the oracle recognizes the yield, whether the liquidator can realize it, and whether the liquidator is allowed to reach it.
The arithmetic shows how small the accrual is. At an illustrative 3.5% yield, a 1% markdown in collateral value takes about 3.4 months of yield to earn back. Take a $JAAA.ETF style market, where a governance proposal lifted the liquidation threshold from 86% to 89%. A borrower at an 87% LTV has about 2.2% of headroom, and at an illustrative 6% yield that headroom is about 4.5 months of income. Yield can compensate for slow erosion. In a liquidation window of minutes it adds almost nothing.
II. Mechanism One: How the Oracle Recognizes Yield
Four designs show different answers.
NAV with bounds (#AAVE Horizon). When an issuer reports a new NAV, the #Chainlink network checks it against preset upper and lower bounds before publishing it onchain. aave.com/docs/aave-v3/h… If the report falls outside the bounds, the update is rejected and the oracle keeps reporting the last valid price. Any breach also prompts the emergency multisig to halt new loan originations until the cause is found. The design chooses to keep a stale price over acting on a bad one.
github-users.yhajoa.workers.dev/aave/aave-v3-h…
aave.com/docs/aave-v3/h…
Discrete issuer cadence (OUSG). #ONDO updates the onchain price once every business day, aiming for 4 to 6 p.m. ET, and says the manual process can run late. The Friday update includes the yield for Friday and Saturday, and whoever holds the token at the update gets the yield. At 3.5% that is roughly one basis point a day, so the oracle’s flat spot between updates costs almost nothing in yield terms. The rest of the weekend is a price shock window with no new NAV.
docs.ondo.finance/qualified-acce…
A cap on growth (#AAVE #CAPO , wstETH). CAPO limits how fast a yield bearing token’s exchange rate can grow. It stores a snapshot ratio and timestamp, and onchain rules cap the snapshot ratio’s increase at 3% every 3 days. This design recognizes yield by modeling its maximum speed.
governance.aave.com/t/post-mortem-…
Accretion to par (#PENDLE PTs on Aave).
Chaos Labs’ framework raises the LTV and liquidation threshold, and lowers the liquidation bonus, as a PT approaches maturity. A June 2026 Risk Steward update for PT $USDE 18JUN2026, eight days from maturity, put the model implied discount near 0.06%, raised LTV and LT by 0.1 point each, and cut the bonus from 1.8% to 1.3%. Here the yield is a schedule, and the risk parameters follow it.
governance.aave.com/t/arfc-pendle-…
III. Mechanism Two: What the Liquidator Receives
A liquidator on #morpho repays debt and seizes collateral plus a fixed incentive. The incentive factor is the smaller of 1.15 and 1 divided by (0.3 × LLTV + 0.7), and the whole amount goes to the liquidator with no protocol fee. At an 89% LLTV that is about 3.4%. docs.morpho.org/learn/concepts… A liquidator who then waits two days to redeem at a 5% funding cost pays about 0.03%. In calm conditions the bonus far exceeds the carry cost. Its job is to cover the case where redemption stalls, which is a gating risk that a price volatility bonus was not built for.
governance.aave.com/t/arfc-horizon…
Reaching the collateral is a second constraint. On #AAVE Horizon, RWA liquidators, typically market makers, must meet issuer defined investor requirements to liquidate collateral or redeem the RWAs. A comparison of tokenized collateral lending quotes @eulerfinance Securitize vaults as failing the collateral transfer if the recipient is not approved. A liquidation can fail at the token’s transfer check, so the accrued yield inside the token is out of reach for most wallets. SentoraHQ research frames the resulting risk as NAV latency, settlement delays and the capacity of approved liquidators, on top of price volatility.
sentora.com/research/artic…
protofire.io/guides/lending…
Redemption timing adds to it. One RWA liquidity guide describes @centrifuge JTRSY and $JAAA.ETF as ERC-7540 products that settle asynchronously, typically at T+1 to T+2.
coinpaprika.com/education/rwa-…
IV. Mechanism Three: Distribution Style Changes What Is “Accrued”
Yield can reach a holder as a rising price, a growing balance, or a monthly or daily airdrop of new tokens. For collateral accounting the distinction decides what sits in the token at the moment of seizure. An accumulating token carries its accrued yield in its price. A token that distributes yield as new tokens leaves the undistributed portion off the balance until the next payment. SteakhouseFi BUIDL overview warns that in kind distributions may cause similar integration issues to rebasing tokens. BUIDL’s move to daily payment, announced in January 2025, shrank that gap from up to a month to about a day.
kitchen.steakhouse.financial/p/blackrock-bu…
V. Cases
Case One: Aave’s CAPO error, March 10, 2026 (yield under-recognized). A newly deployed CAPO Risk Agent pushed a parameter update that depressed the wstETH oracle price by about 2.85% and triggered roughly $26.6 million of liquidations. The oracle reported a capped exchange rate near 1.1939 against a market rate near 1.228, and about 10,938 wstETH was liquidated across 34 accounts. One incident write up reports no attacker and no bad debt. governance.aave.com/t/post-mortem-… The mechanism was a mismatch between two stored values: the ratio was rate limited and the timestamp was not. The model of yield growth fell behind real yield growth, and at tight LT bands a 2.85% error exceeds the headroom.
theblock.co/news/ecosystem…
smartcontractshacking.com/hacks/aave-v3-…
Case Two: StreamDefi xUSD, November 2025 (value over recognized). The opposite failure. On @Morpho Labs 🦋 , eulerfinance and SiloFinance , vaults priced xUSD at a fixed $1 while its market price collapsed, so the liquidations that should have unwound the loans never triggered. xUSD traded near $0.30 on secondary markets. A yield bearing wrapper backed by an opaque off chain strategy, priced at a hardcoded number, had no liquidation engine looking at its real value. Figures for losses and bad debt differ across sources, so I avoid quoting a total.
pharos.watch/learn/case-stu…
startupfortune.com/sp-global-laun…
Case Three: an issuer side change. @Securitize January 2025 shift to daily BUIDL dividends changed what a collateral lender sees on a given day without any protocol touching its own code. The issuer’s accounting model is part of the lender’s risk model.
VI. The Structural Question: Buffer or Carry?
Yield works as a buffer only over long periods. Over a weekend, a debt rate above the asset yield drifts a position by about one basis point. The practical reasons to model yield are narrower. A stale baseline can create false liquidations, as with CAPO. A schedule can tighten parameters toward maturity, as with PTs. And a hardcoded price removes the engine’s ability to see a loss at all.
The three approaches line up as follows. Horizon style bounded NAV treats the issuer’s number as the truth within a corridor and halts new borrowing on a breach. PT style schedules turn yield into a time based risk parameter. Hardcoded pricing avoids false liquidations at the cost of missing real ones.
Dune analysis of Horizon summarizes the shift: liquidation risk moves from price volatility toward operational factors like NAV timeliness and oracle integrity.
dune.com/blog/dune-dige…
VII. Where the Research Points
This paper’s thesis is that lenders on yield bearing RWAs should price three things next to LTV: how often the NAV updates, how fast the token can be turned into cash by an eligible liquidator, and how the issuer pays yield. Three things to watch:
1.The first sizable liquidation of an RWA position on a permissioned market, and how the liquidator exits.
2.Whether other lenders adopt maturity or cadence aware parameter schedules the way Aave did for PTs.
3.Whether the set of eligible liquidators for issuer-gated collateral widens or stays concentrated in a few market makers.
Independent research. Not financial advice. Always conduct your own due diligence
I. Two Meters Running
A loan against yield bearing collateral has two meters running. The collateral’s value rises as yield accrues. The debt rises as interest accrues. Health is collateral value times the liquidation threshold, divided by debt, and both sides of that fraction move every day.
This paper argues that the accrual itself is small next to the risks around it. Three questions decide whether yield helps a position: whether the oracle recognizes the yield, whether the liquidator can realize it, and whether the liquidator is allowed to reach it.
The arithmetic shows how small the accrual is. At an illustrative 3.5% yield, a 1% markdown in collateral value takes about 3.4 months of yield to earn back. Take a $JAAA.ETF style market, where a governance proposal lifted the liquidation threshold from 86% to 89%. A borrower at an 87% LTV has about 2.2% of headroom, and at an illustrative 6% yield that headroom is about 4.5 months of income. Yield can compensate for slow erosion. In a liquidation window of minutes it adds almost nothing.
II. Mechanism One: How the Oracle Recognizes Yield
Four designs show different answers.
NAV with bounds (#AAVE Horizon). When an issuer reports a new NAV, the #Chainlink network checks it against preset upper and lower bounds before publishing it onchain. aave.com/docs/aave-v3/h… If the report falls outside the bounds, the update is rejected and the oracle keeps reporting the last valid price. Any breach also prompts the emergency multisig to halt new loan originations until the cause is found. The design chooses to keep a stale price over acting on a bad one.
github-users.yhajoa.workers.dev/aave/aave-v3-h…
aave.com/docs/aave-v3/h…
Discrete issuer cadence (OUSG). #ONDO updates the onchain price once every business day, aiming for 4 to 6 p.m. ET, and says the manual process can run late. The Friday update includes the yield for Friday and Saturday, and whoever holds the token at the update gets the yield. At 3.5% that is roughly one basis point a day, so the oracle’s flat spot between updates costs almost nothing in yield terms. The rest of the weekend is a price shock window with no new NAV.
docs.ondo.finance/qualified-acce…
A cap on growth (#AAVE #CAPO , wstETH). CAPO limits how fast a yield bearing token’s exchange rate can grow. It stores a snapshot ratio and timestamp, and onchain rules cap the snapshot ratio’s increase at 3% every 3 days. This design recognizes yield by modeling its maximum speed.
governance.aave.com/t/post-mortem-…
Accretion to par (#PENDLE PTs on Aave).
Chaos Labs’ framework raises the LTV and liquidation threshold, and lowers the liquidation bonus, as a PT approaches maturity. A June 2026 Risk Steward update for PT $USDE 18JUN2026, eight days from maturity, put the model implied discount near 0.06%, raised LTV and LT by 0.1 point each, and cut the bonus from 1.8% to 1.3%. Here the yield is a schedule, and the risk parameters follow it.
governance.aave.com/t/arfc-pendle-…
III. Mechanism Two: What the Liquidator Receives
A liquidator on #morpho repays debt and seizes collateral plus a fixed incentive. The incentive factor is the smaller of 1.15 and 1 divided by (0.3 × LLTV + 0.7), and the whole amount goes to the liquidator with no protocol fee. At an 89% LLTV that is about 3.4%. docs.morpho.org/learn/concepts… A liquidator who then waits two days to redeem at a 5% funding cost pays about 0.03%. In calm conditions the bonus far exceeds the carry cost. Its job is to cover the case where redemption stalls, which is a gating risk that a price volatility bonus was not built for.
governance.aave.com/t/arfc-horizon…
Reaching the collateral is a second constraint. On #AAVE Horizon, RWA liquidators, typically market makers, must meet issuer defined investor requirements to liquidate collateral or redeem the RWAs. A comparison of tokenized collateral lending quotes @eulerfinance Securitize vaults as failing the collateral transfer if the recipient is not approved. A liquidation can fail at the token’s transfer check, so the accrued yield inside the token is out of reach for most wallets. SentoraHQ research frames the resulting risk as NAV latency, settlement delays and the capacity of approved liquidators, on top of price volatility.
sentora.com/research/artic…
protofire.io/guides/lending…
Redemption timing adds to it. One RWA liquidity guide describes @centrifuge JTRSY and $JAAA.ETF as ERC-7540 products that settle asynchronously, typically at T+1 to T+2.
coinpaprika.com/education/rwa-…
IV. Mechanism Three: Distribution Style Changes What Is “Accrued”
Yield can reach a holder as a rising price, a growing balance, or a monthly or daily airdrop of new tokens. For collateral accounting the distinction decides what sits in the token at the moment of seizure. An accumulating token carries its accrued yield in its price. A token that distributes yield as new tokens leaves the undistributed portion off the balance until the next payment. SteakhouseFi BUIDL overview warns that in kind distributions may cause similar integration issues to rebasing tokens. BUIDL’s move to daily payment, announced in January 2025, shrank that gap from up to a month to about a day.
kitchen.steakhouse.financial/p/blackrock-bu…
V. Cases
Case One: Aave’s CAPO error, March 10, 2026 (yield under-recognized). A newly deployed CAPO Risk Agent pushed a parameter update that depressed the wstETH oracle price by about 2.85% and triggered roughly $26.6 million of liquidations. The oracle reported a capped exchange rate near 1.1939 against a market rate near 1.228, and about 10,938 wstETH was liquidated across 34 accounts. One incident write up reports no attacker and no bad debt. governance.aave.com/t/post-mortem-… The mechanism was a mismatch between two stored values: the ratio was rate limited and the timestamp was not. The model of yield growth fell behind real yield growth, and at tight LT bands a 2.85% error exceeds the headroom.
theblock.co/news/ecosystem…
smartcontractshacking.com/hacks/aave-v3-…
Case Two: StreamDefi xUSD, November 2025 (value over recognized). The opposite failure. On @Morpho Labs 🦋 , eulerfinance and SiloFinance , vaults priced xUSD at a fixed $1 while its market price collapsed, so the liquidations that should have unwound the loans never triggered. xUSD traded near $0.30 on secondary markets. A yield bearing wrapper backed by an opaque off chain strategy, priced at a hardcoded number, had no liquidation engine looking at its real value. Figures for losses and bad debt differ across sources, so I avoid quoting a total.
pharos.watch/learn/case-stu…
startupfortune.com/sp-global-laun…
Case Three: an issuer side change. @Securitize January 2025 shift to daily BUIDL dividends changed what a collateral lender sees on a given day without any protocol touching its own code. The issuer’s accounting model is part of the lender’s risk model.
VI. The Structural Question: Buffer or Carry?
Yield works as a buffer only over long periods. Over a weekend, a debt rate above the asset yield drifts a position by about one basis point. The practical reasons to model yield are narrower. A stale baseline can create false liquidations, as with CAPO. A schedule can tighten parameters toward maturity, as with PTs. And a hardcoded price removes the engine’s ability to see a loss at all.
The three approaches line up as follows. Horizon style bounded NAV treats the issuer’s number as the truth within a corridor and halts new borrowing on a breach. PT style schedules turn yield into a time based risk parameter. Hardcoded pricing avoids false liquidations at the cost of missing real ones.
Dune analysis of Horizon summarizes the shift: liquidation risk moves from price volatility toward operational factors like NAV timeliness and oracle integrity.
dune.com/blog/dune-dige…
VII. Where the Research Points
This paper’s thesis is that lenders on yield bearing RWAs should price three things next to LTV: how often the NAV updates, how fast the token can be turned into cash by an eligible liquidator, and how the issuer pays yield. Three things to watch:
1.The first sizable liquidation of an RWA position on a permissioned market, and how the liquidator exits.
2.Whether other lenders adopt maturity or cadence aware parameter schedules the way Aave did for PTs.
3.Whether the set of eligible liquidators for issuer-gated collateral widens or stays concentrated in a few market makers.
Independent research. Not financial advice. Always conduct your own due diligence
2
2
951
Log in to explore more content
Join global crypto users on Binance Square
⚡️ Get latest and useful information about crypto.
💬 Trusted by the world’s largest crypto exchange.
👍 Discover real insights from verified creators.
Email / Phone number
Trending Topics
BTCReboundsAbove$60KAmidWhaleDipBuying
60,513 views
302 Discussing
Abraxas Capital, Other Whales Buy the BTC Dip as Bitcoin Briefly Reclaims $60,000
Binance News
·33 Likes
·66.7k views
SolanaSets2027RoadmapToDoubleComputeCapacity
45,056 views
870 Discussing
CaliforniaNvidiaProbeExaminesPotentialCriminalViolations
11,909 views
116 Discussing