
Abo-Khalid-Dobal
10k Posts

Abo-Khalid-Dobal
Report
Block User
2.2K+ Following
519 Followers
1.1K+ Liked
Posts
All
Quotes
·
--
Bullish
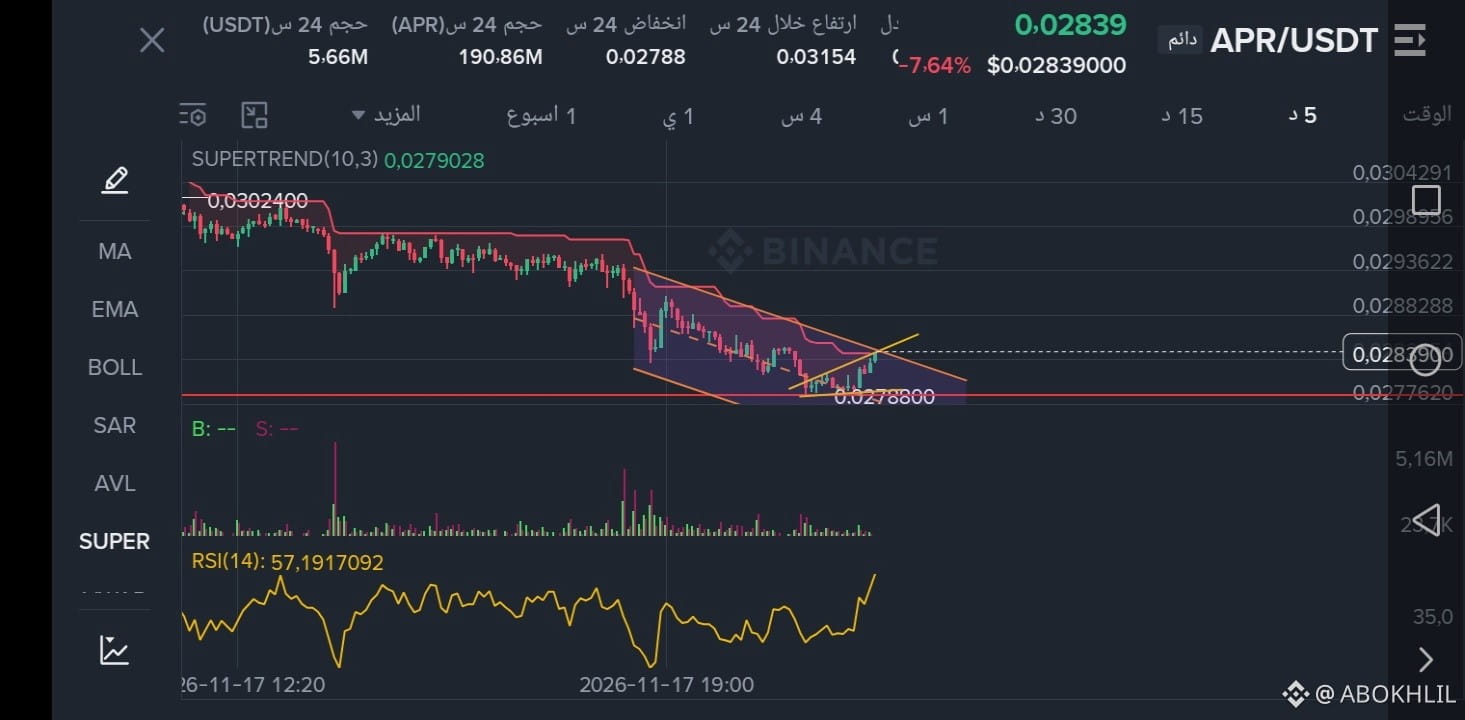
APR: Descending wedge and breakout nearby
Current price: 0.02839$
24h change: -7.64%
24h high: 0.03154$
24h low: 0.02788$
Trading volume: 5.66M$
$APR Clear descending wedge chart
📊 SuperTrend: 0.02790$ — red, but the price is above it = about to turn green
📊 RSI: 57.19 = above 50 = strong buying momentum!
📊 Price: 0.02839$ = sitting at the wedge ceiling of 0.02882$
Resistance:
1. 0.02882$ = wedge ceiling — breakout = takeoff!
2. 0.02936$
3. 0.03154$ = 24h high
Support:
1. 0.02790$ = SuperTrend
2. 0.02788$ = 24h low — breaking it = wedge failure
A breakout above 0.02882$ = heads to 0.03024$!
A break below 0.02788$ = price drops again
Do you expect $APR
{future}(APRUSDT)
to break the wedge upward or break the low downward?
For monitoring
From the bottom. Personal opinion and analysis.
#APR
#Crypto
#Binance
#APRUSDT
APR: Descending wedge and breakout nearby
Current price: 0.02839$
24h change: -7.64%
24h high: 0.03154$
24h low: 0.02788$
Trading volume: 5.66M$
$APR Clear descending wedge chart
📊 SuperTrend: 0.02790$ — red, but the price is above it = about to turn green
📊 RSI: 57.19 = above 50 = strong buying momentum!
📊 Price: 0.02839$ = sitting at the wedge ceiling of 0.02882$
Resistance:
1. 0.02882$ = wedge ceiling — breakout = takeoff!
2. 0.02936$
3. 0.03154$ = 24h high
Support:
1. 0.02790$ = SuperTrend
2. 0.02788$ = 24h low — breaking it = wedge failure
A breakout above 0.02882$ = heads to 0.03024$!
A break below 0.02788$ = price drops again
Do you expect $APR
to break the wedge upward or break the low downward?
For monitoring
From the bottom. Personal opinion and analysis.
#APR
#Crypto
#Binance
#APRUSDT
Current price: 0.02839$
24h change: -7.64%
24h high: 0.03154$
24h low: 0.02788$
Trading volume: 5.66M$
$APR Clear descending wedge chart
📊 SuperTrend: 0.02790$ — red, but the price is above it = about to turn green
📊 RSI: 57.19 = above 50 = strong buying momentum!
📊 Price: 0.02839$ = sitting at the wedge ceiling of 0.02882$
Resistance:
1. 0.02882$ = wedge ceiling — breakout = takeoff!
2. 0.02936$
3. 0.03154$ = 24h high
Support:
1. 0.02790$ = SuperTrend
2. 0.02788$ = 24h low — breaking it = wedge failure
A breakout above 0.02882$ = heads to 0.03024$!
A break below 0.02788$ = price drops again
Do you expect $APR
to break the wedge upward or break the low downward?
For monitoring
From the bottom. Personal opinion and analysis.
#APR
#Crypto
#Binance
#APRUSDT
6
·
--
Bullish
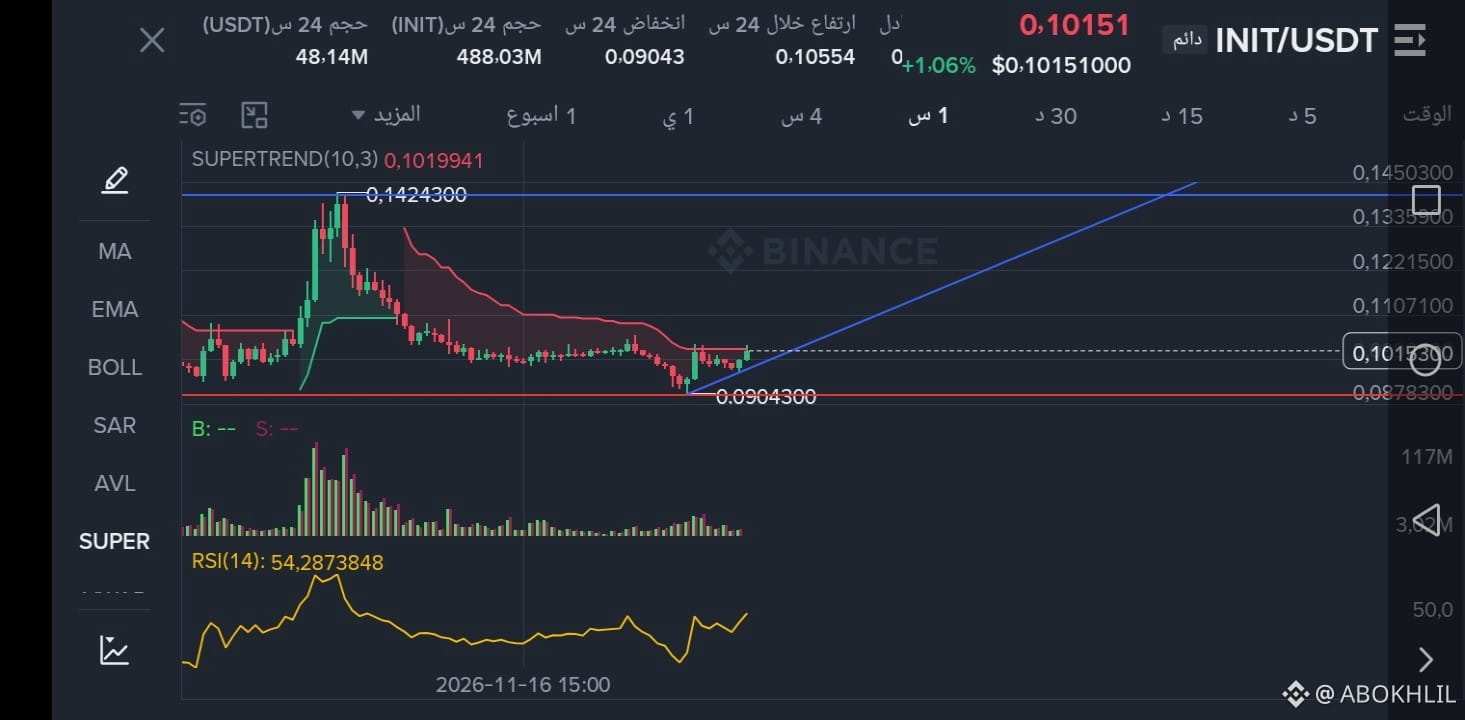
#INIT From here, closing and confirmation are necessary—the spark of an upswing
$INIT
{future}(INITUSDT)
Rocket... flying!
Good luck; just my personal opinion.
#INIT From here, closing and confirmation are necessary—the spark of an upswing
$INIT
Rocket... flying!
Good luck; just my personal opinion.
$INIT
Rocket... flying!
Good luck; just my personal opinion.
14
·
--
Bullish
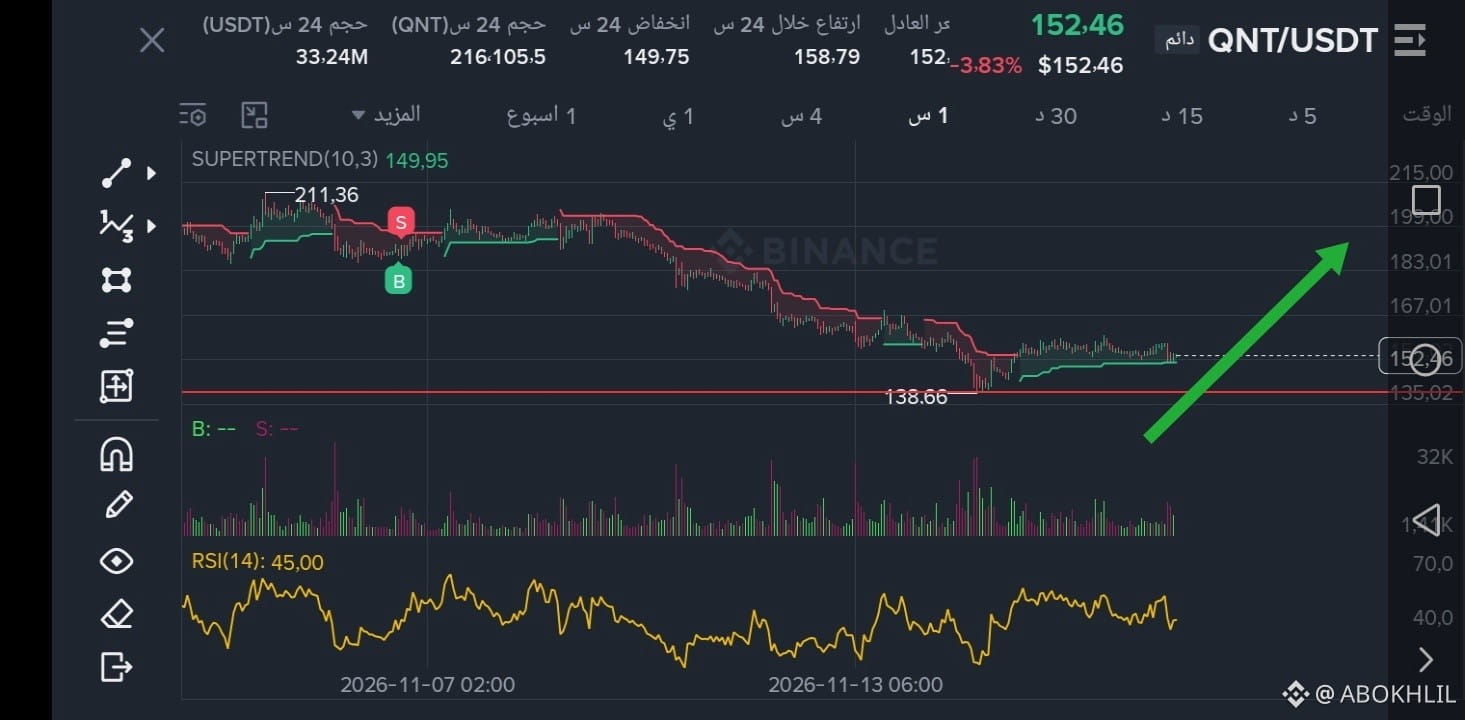
👀 QNT: Building a new bottom... and this bottom could be the launchpad upward...
Price now: 152.46$
24h change: -3.83%
24h high: 158.79$
24h low: 149.75$
Trading volume: 33.24M$
After dropping from 211.36$ to 138.66$, it started accumulating $QNT
📊 SuperTrend: 149.95$ Green = short-term trend has turned bullish
Price is above
📊 RSI: 45.00 = below 50 = still needs strength; it needs to break above 50 to rise
Resistance:
1. 158.79$ = accumulation ceiling — breakout = takeoff
2. 167.01$
3. 183.01$
Support:
1. 149.95$ = SuperTrend
2. 138.66$ = crash low
Break above 158.79$ = moves to 167$, then 183$
Break below 149.75$ = returns to 138.66$
$QNT
{future}(QNTUSDT)
Analysis and suggestion, not financial advice. Good luck!
#QNT
#Crypto
#QNT/USDT
#QNTUSDT
#QNT500
👀 QNT: Building a new bottom... and this bottom could be the launchpad upward...
Price now: 152.46$
24h change: -3.83%
24h high: 158.79$
24h low: 149.75$
Trading volume: 33.24M$
After dropping from 211.36$ to 138.66$, it started accumulating $QNT
📊 SuperTrend: 149.95$ Green = short-term trend has turned bullish
Price is above
📊 RSI: 45.00 = below 50 = still needs strength; it needs to break above 50 to rise
Resistance:
1. 158.79$ = accumulation ceiling — breakout = takeoff
2. 167.01$
3. 183.01$
Support:
1. 149.95$ = SuperTrend
2. 138.66$ = crash low
Break above 158.79$ = moves to 167$, then 183$
Break below 149.75$ = returns to 138.66$
$QNT
Analysis and suggestion, not financial advice. Good luck!
#QNT
#Crypto
#QNT/USDT
#QNTUSDT
#QNT500
Price now: 152.46$
24h change: -3.83%
24h high: 158.79$
24h low: 149.75$
Trading volume: 33.24M$
After dropping from 211.36$ to 138.66$, it started accumulating $QNT
📊 SuperTrend: 149.95$ Green = short-term trend has turned bullish
Price is above
📊 RSI: 45.00 = below 50 = still needs strength; it needs to break above 50 to rise
Resistance:
1. 158.79$ = accumulation ceiling — breakout = takeoff
2. 167.01$
3. 183.01$
Support:
1. 149.95$ = SuperTrend
2. 138.66$ = crash low
Break above 158.79$ = moves to 167$, then 183$
Break below 149.75$ = returns to 138.66$
$QNT
Analysis and suggestion, not financial advice. Good luck!
#QNT
#Crypto
#QNT/USDT
#QNTUSDT
#QNT500
1
8
·
--
Bullish
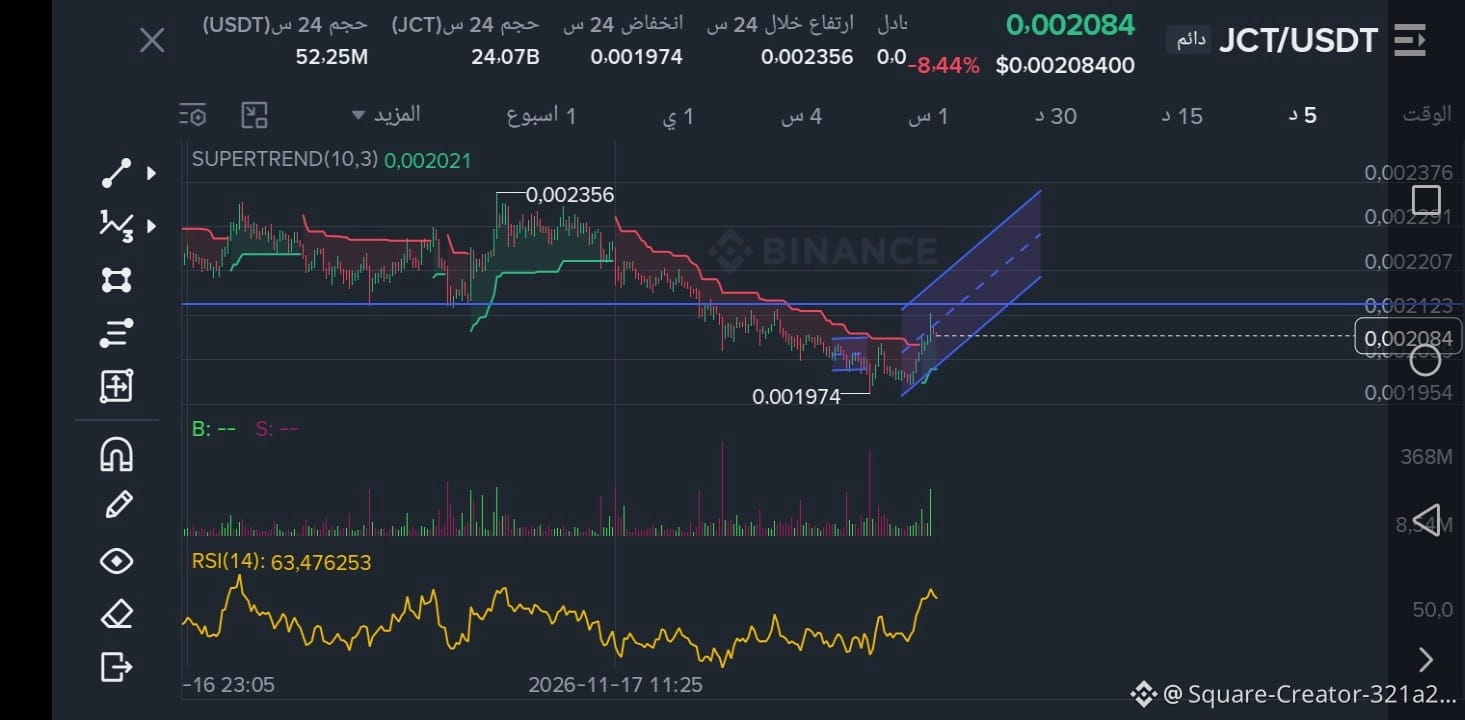
JCT has finally started to reverse
Price now: $0.002084
24h change: -8.44%
24h high: $0.002356
24h low: $0.001974
Trading volume: $52.25M
After breaking $0.002015, it made a false break to $0.001974, then bounced $JCT strongly
📊 SuperTrend: $0.002021 turned from red to green = first bullish reversal
📊 RSI: rose from 33 to 63.47 = buying momentum exploded!
📊 Price: inside a new ascending channel
Resistance:
1. $0.002123 = channel ceiling
2. $0.002356 = 24h high
3. $0.002444
Support:
1. $0.002021 = SuperTrend
2. $0.001974 = false-break low
Holding above $0.002021 + breaking through $0.002123 = the way is clear to $0.002356!
$JCT
{future}(JCTUSDT)
From here, the rise and the real reversal... God willing.
Just analysis and personal opinion..
#JCT
#Crypto
#Binance
#JCTUSDT
JCT has finally started to reverse
Price now: $0.002084
24h change: -8.44%
24h high: $0.002356
24h low: $0.001974
Trading volume: $52.25M
After breaking $0.002015, it made a false break to $0.001974, then bounced $JCT strongly
📊 SuperTrend: $0.002021 turned from red to green = first bullish reversal
📊 RSI: rose from 33 to 63.47 = buying momentum exploded!
📊 Price: inside a new ascending channel
Resistance:
1. $0.002123 = channel ceiling
2. $0.002356 = 24h high
3. $0.002444
Support:
1. $0.002021 = SuperTrend
2. $0.001974 = false-break low
Holding above $0.002021 + breaking through $0.002123 = the way is clear to $0.002356!
$JCT
From here, the rise and the real reversal... God willing.
Just analysis and personal opinion..
#JCT
#Crypto
#Binance
#JCTUSDT
Price now: $0.002084
24h change: -8.44%
24h high: $0.002356
24h low: $0.001974
Trading volume: $52.25M
After breaking $0.002015, it made a false break to $0.001974, then bounced $JCT strongly
📊 SuperTrend: $0.002021 turned from red to green = first bullish reversal
📊 RSI: rose from 33 to 63.47 = buying momentum exploded!
📊 Price: inside a new ascending channel
Resistance:
1. $0.002123 = channel ceiling
2. $0.002356 = 24h high
3. $0.002444
Support:
1. $0.002021 = SuperTrend
2. $0.001974 = false-break low
Holding above $0.002021 + breaking through $0.002123 = the way is clear to $0.002356!
$JCT
From here, the rise and the real reversal... God willing.
Just analysis and personal opinion..
#JCT
#Crypto
#Binance
#JCTUSDT
1
23
·
--
Bearish
#BTC
#BTC走势分析
#btc70k
#BTC突破7万大关
#BTC☀
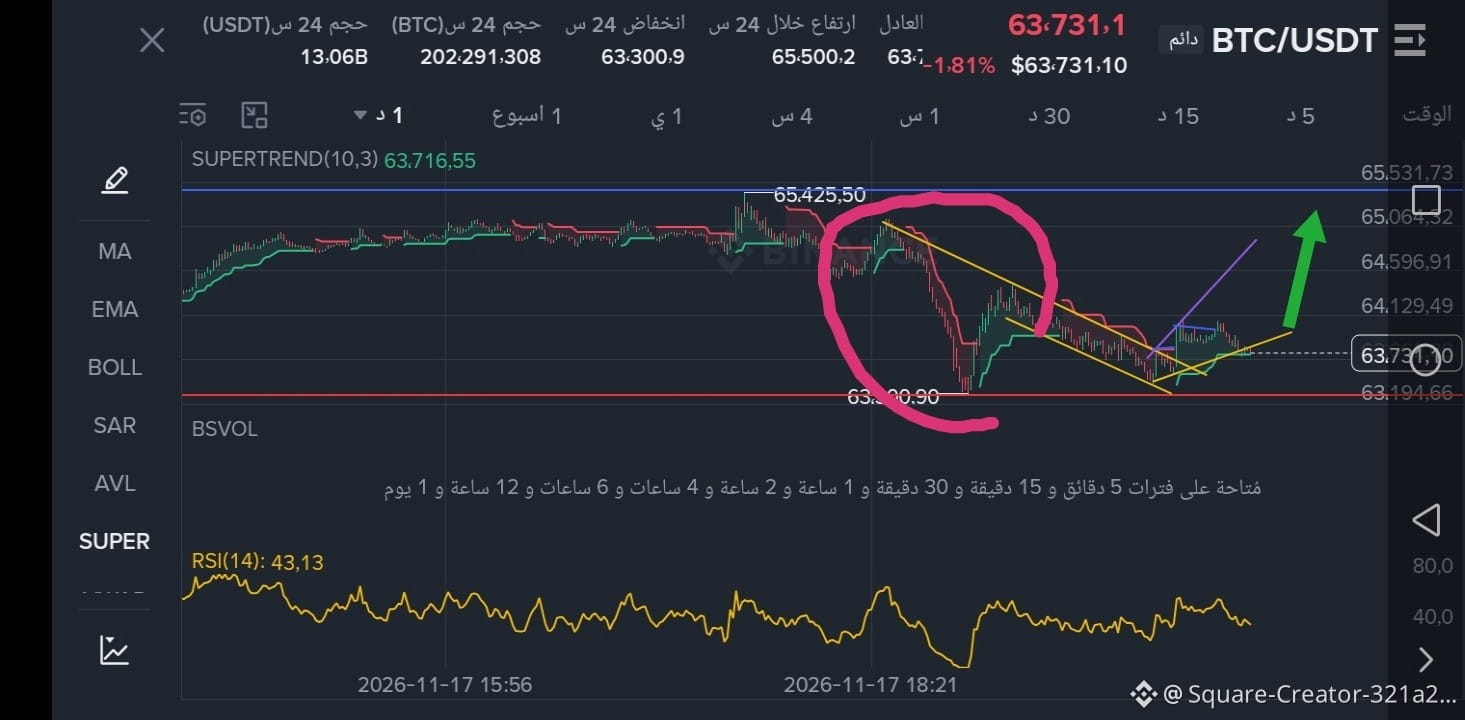
(The sea has no mercy on an inexperienced swimmer)
Perhaps 63.000 is the new bottom for Bitcoin.
And the theory that after every major drop comes a sudden rise.
I hope the ascending wedge is a reliable sign that Bitcoin is taking off from this new bottom.
$BTC
{future}(BTCUSDT)
A major drop and very slow upward fluctuation from this bottom.
Just analysis and a suggestion, not financial advice.
Good luck to everyone.
#BTC
#BTC走势分析
#btc70k
#BTC突破7万大关
#BTC☀
(The sea has no mercy on an inexperienced swimmer)
Perhaps 63.000 is the new bottom for Bitcoin.
And the theory that after every major drop comes a sudden rise.
I hope the ascending wedge is a reliable sign that Bitcoin is taking off from this new bottom.
$BTC
A major drop and very slow upward fluctuation from this bottom.
Just analysis and a suggestion, not financial advice.
Good luck to everyone.
#BTC走势分析
#btc70k
#BTC突破7万大关
#BTC☀
(The sea has no mercy on an inexperienced swimmer)
Perhaps 63.000 is the new bottom for Bitcoin.
And the theory that after every major drop comes a sudden rise.
I hope the ascending wedge is a reliable sign that Bitcoin is taking off from this new bottom.
$BTC
A major drop and very slow upward fluctuation from this bottom.
Just analysis and a suggestion, not financial advice.
Good luck to everyone.
1
5
·
--
Bullish
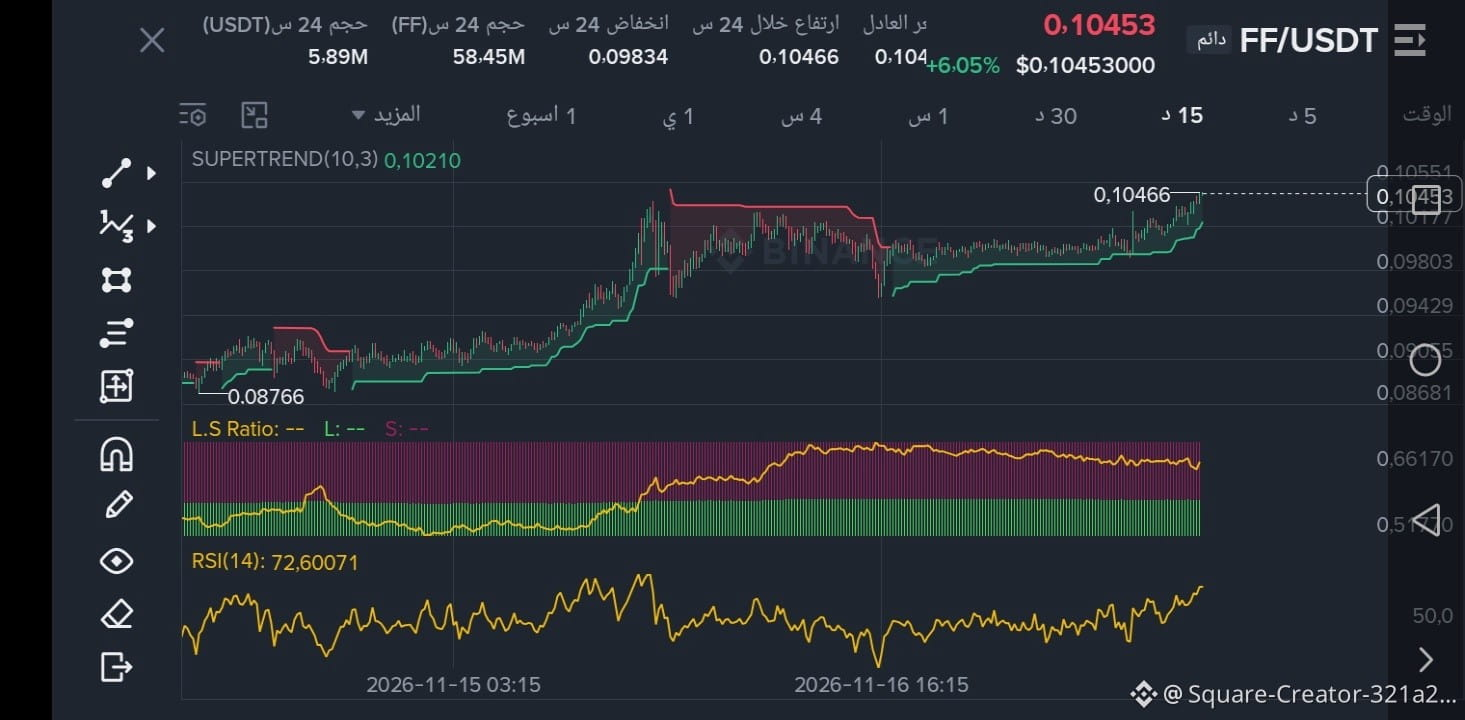
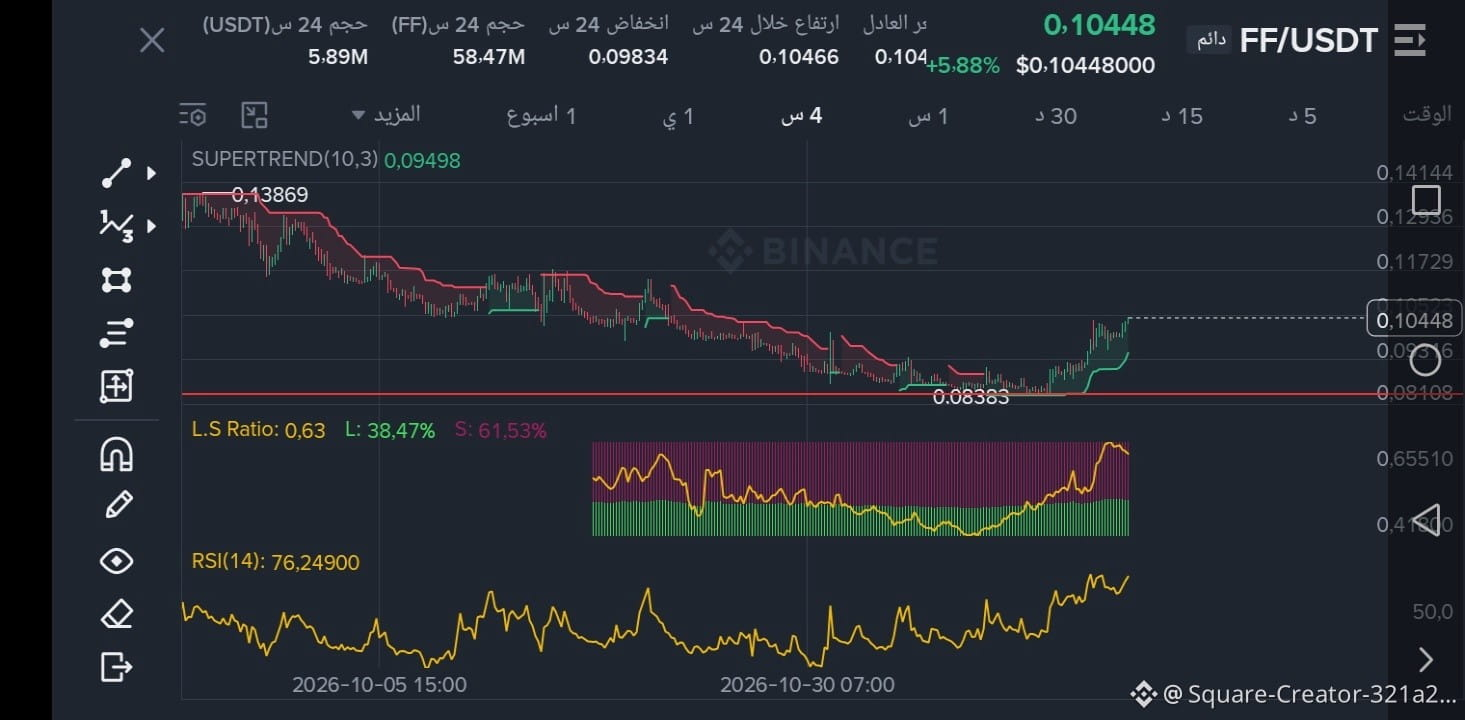
🔥🔥 FF... coming up, worth following and keeping an eye on
Price now: 0.10402$
24h change: +4.95%
24h high: 0.10433$
24h low: 0.09834$
Trading volume: 5.87M$
📊 SuperTrend: 0.10257$ Green = uptrend
📊 RSI: 63.23 = strong buying momentum, still far from overbought
📊 L.S Ratio: 0.63 = 61.32% SHORT! = fuel for a Short Squeeze
Price is now sitting at the 0.10433$ high
Resistance
1. 0.10433$ = 24h high
2. 0.11000$
3. 0.12000$
Support:
1. 0.10257$ = SuperTrend
2. 0.09834$ = 24h low
A breakout above 0.10433$ = a launch to 0.11$ due to SHORT liquidations
Do you expect $FF
#ff
{future}(FFUSDT)
the rally to continue?
Just analysis, good luck
#FF
#Crypto
#Binance
#FFUSDT
🔥🔥 FF... coming up, worth following and keeping an eye on
Price now: 0.10402$
24h change: +4.95%
24h high: 0.10433$
24h low: 0.09834$
Trading volume: 5.87M$
📊 SuperTrend: 0.10257$ Green = uptrend
📊 RSI: 63.23 = strong buying momentum, still far from overbought
📊 L.S Ratio: 0.63 = 61.32% SHORT! = fuel for a Short Squeeze
Price is now sitting at the 0.10433$ high
Resistance
1. 0.10433$ = 24h high
2. 0.11000$
3. 0.12000$
Support:
1. 0.10257$ = SuperTrend
2. 0.09834$ = 24h low
A breakout above 0.10433$ = a launch to 0.11$ due to SHORT liquidations
Do you expect $FF
#ff
the rally to continue?
Just analysis, good luck
#FF
#Crypto
#Binance
#FFUSDT
Price now: 0.10402$
24h change: +4.95%
24h high: 0.10433$
24h low: 0.09834$
Trading volume: 5.87M$
📊 SuperTrend: 0.10257$ Green = uptrend
📊 RSI: 63.23 = strong buying momentum, still far from overbought
📊 L.S Ratio: 0.63 = 61.32% SHORT! = fuel for a Short Squeeze
Price is now sitting at the 0.10433$ high
Resistance
1. 0.10433$ = 24h high
2. 0.11000$
3. 0.12000$
Support:
1. 0.10257$ = SuperTrend
2. 0.09834$ = 24h low
A breakout above 0.10433$ = a launch to 0.11$ due to SHORT liquidations
Do you expect $FF
#ff
the rally to continue?
Just analysis, good luck
#FF
#Crypto
#Binance
#FFUSDT
1
12
·
--
Bullish
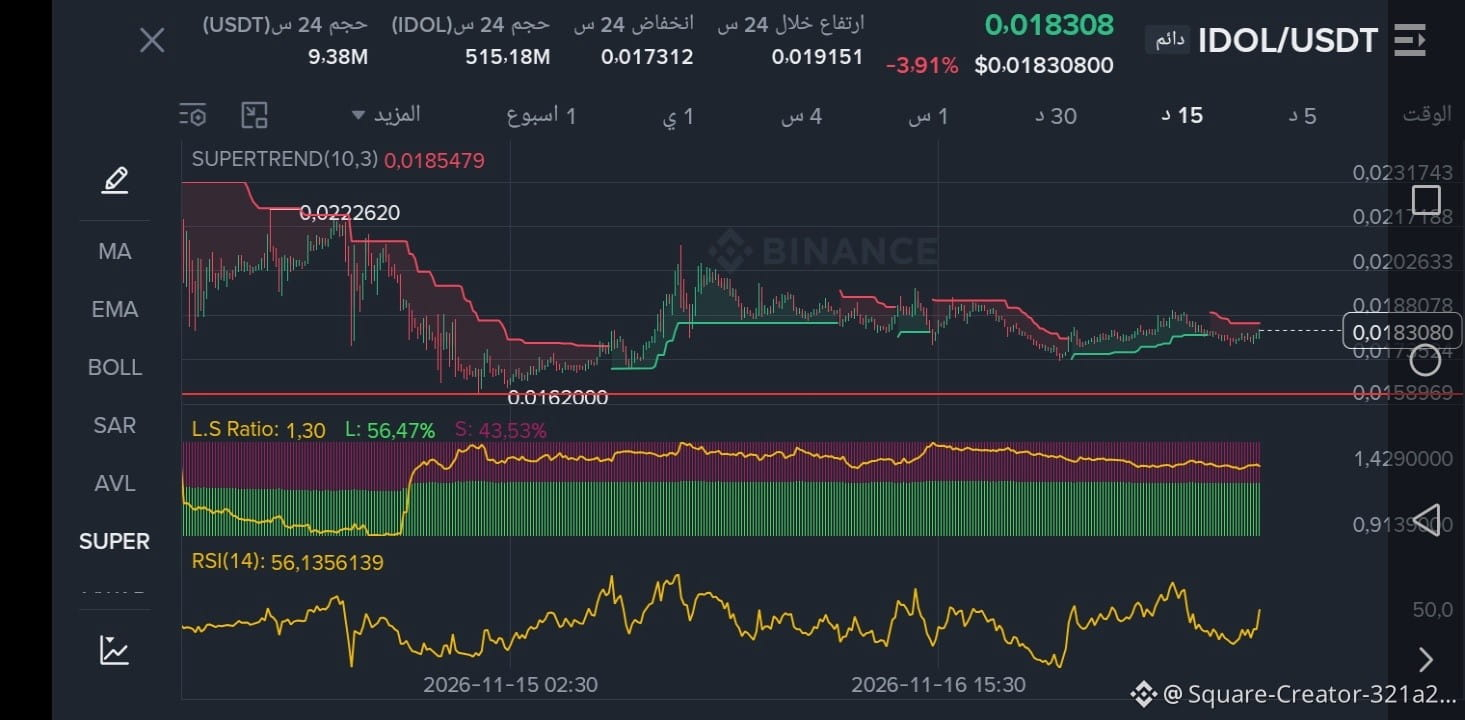
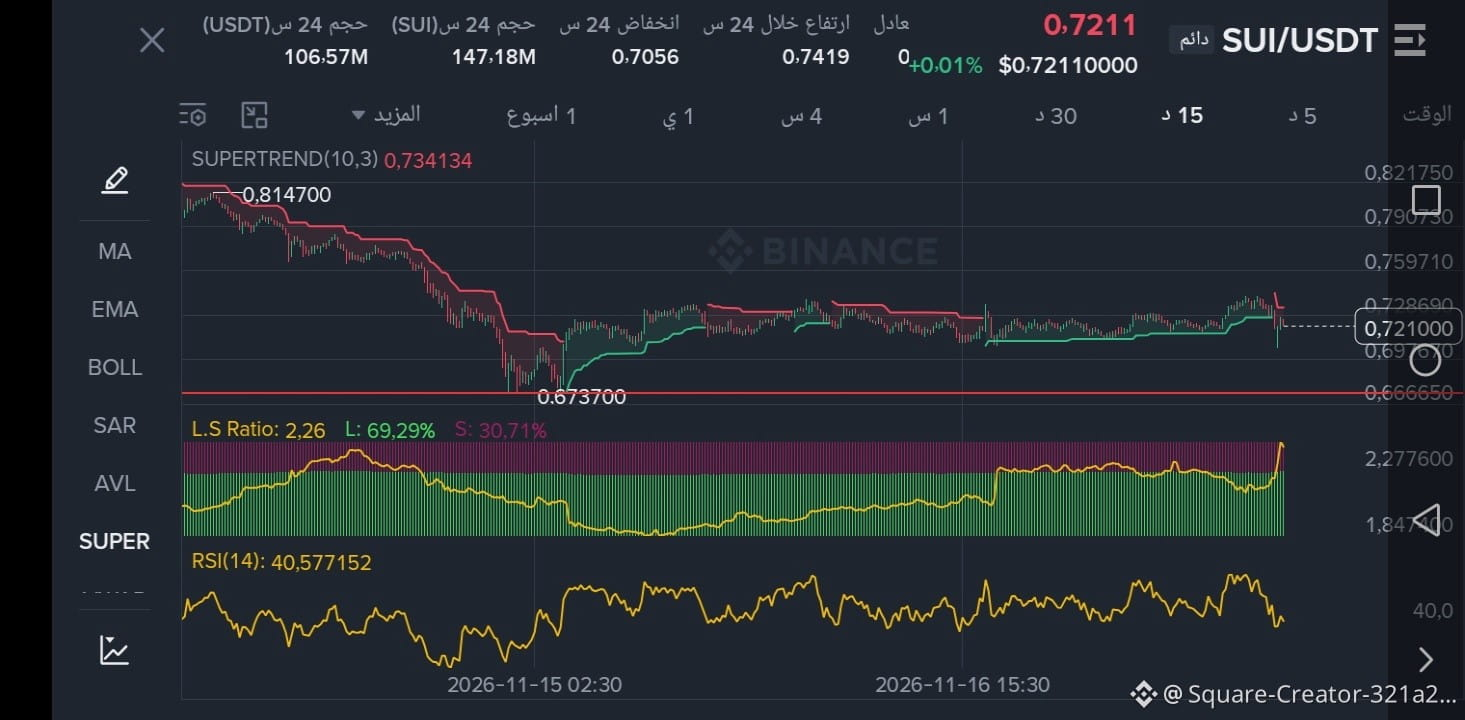
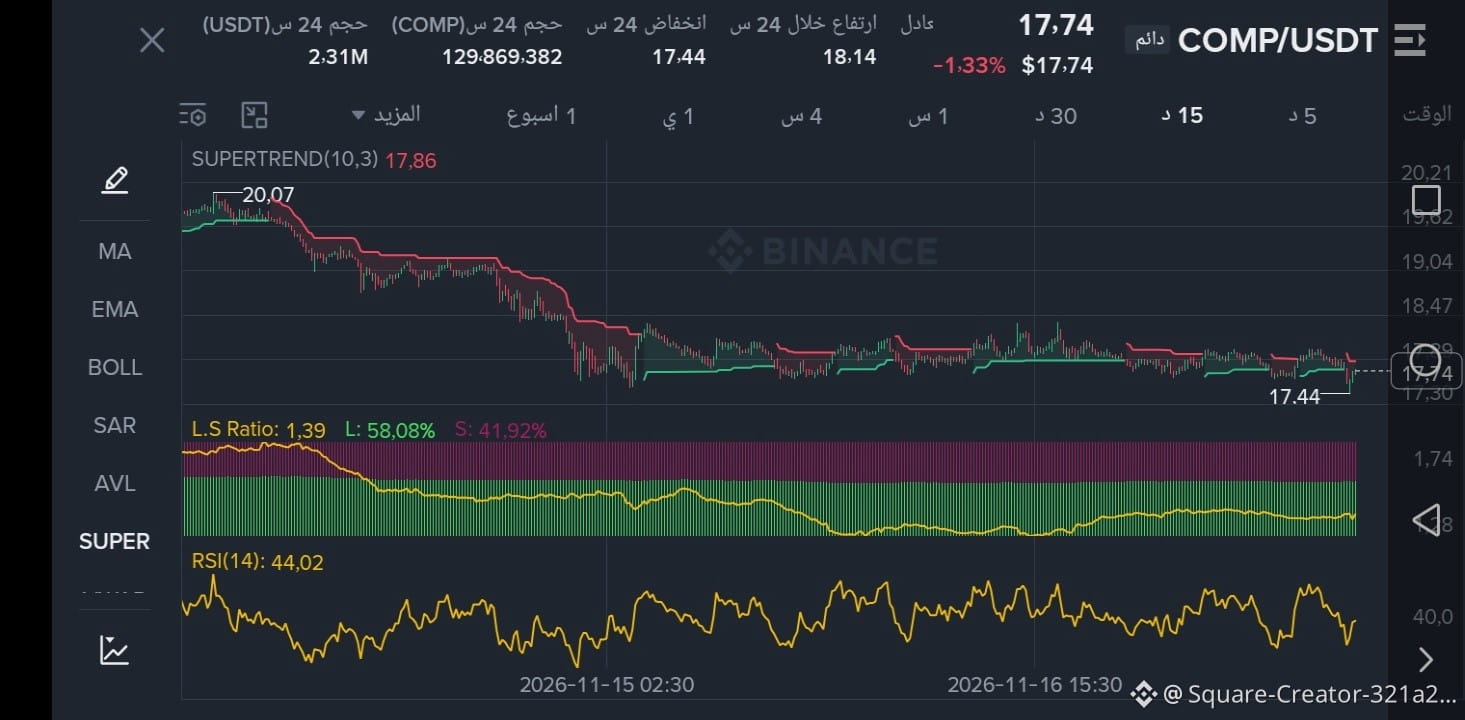
#Comp
#SUİ
#IDOL
#velve
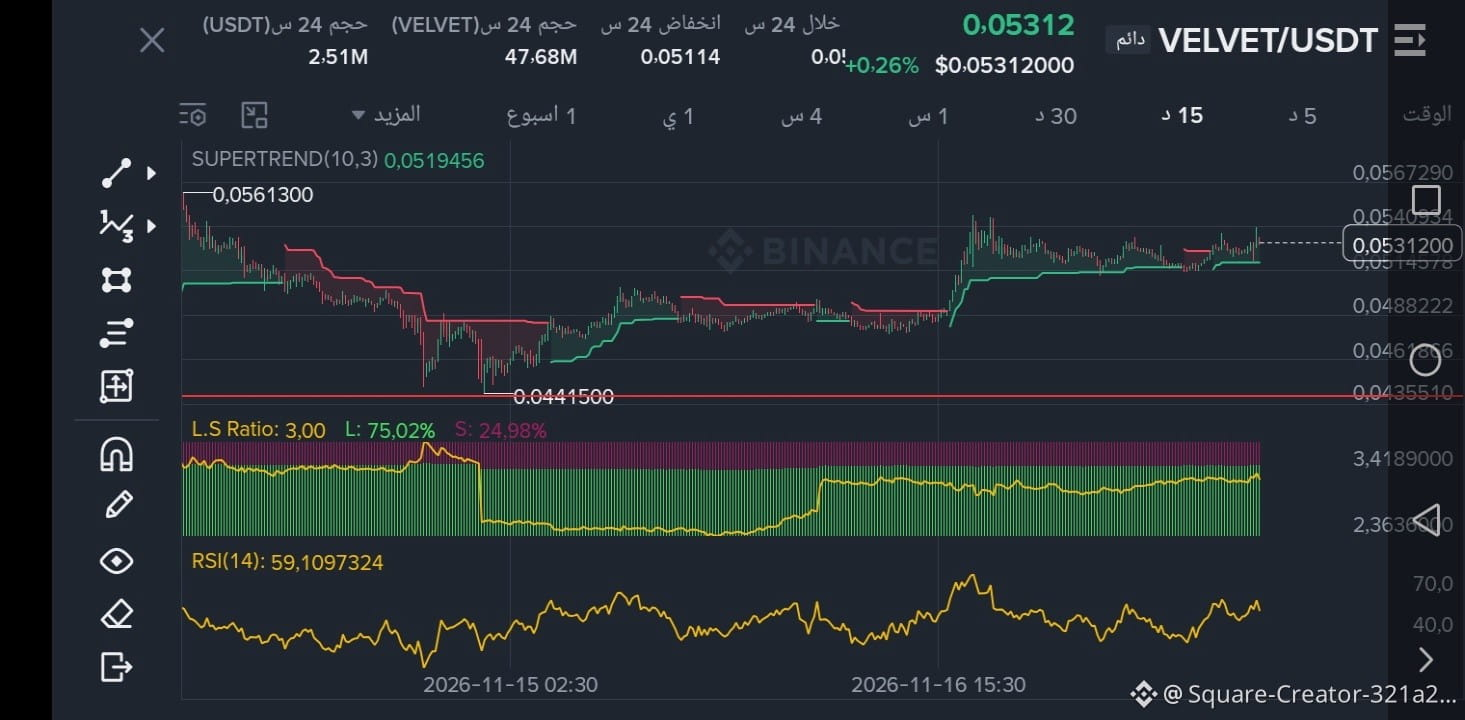
Beginning of a rise, bullish fluctuations, and formation of an upward trend
after breaking the downtrend.
Just an analysis. Good luck to everyone, God willing.
Monitoring is necessary.
$COMP
{future}(COMPUSDT)
$SUI
{future}(SUIUSDT)
$IDOL
{future}(IDOLUSDT)
#عملات_رقمية
#Comp
#SUİ
#IDOL
#velve
Beginning of a rise, bullish fluctuations, and formation of an upward trend
after breaking the downtrend.
Just an analysis. Good luck to everyone, God willing.
Monitoring is necessary.
$COMP
$SUI
$IDOL
#عملات_رقمية
#SUİ
#IDOL
#velve
Beginning of a rise, bullish fluctuations, and formation of an upward trend
after breaking the downtrend.
Just an analysis. Good luck to everyone, God willing.
Monitoring is necessary.
$COMP
$SUI
$IDOL
#عملات_رقمية
1
5
·
--
Bullish
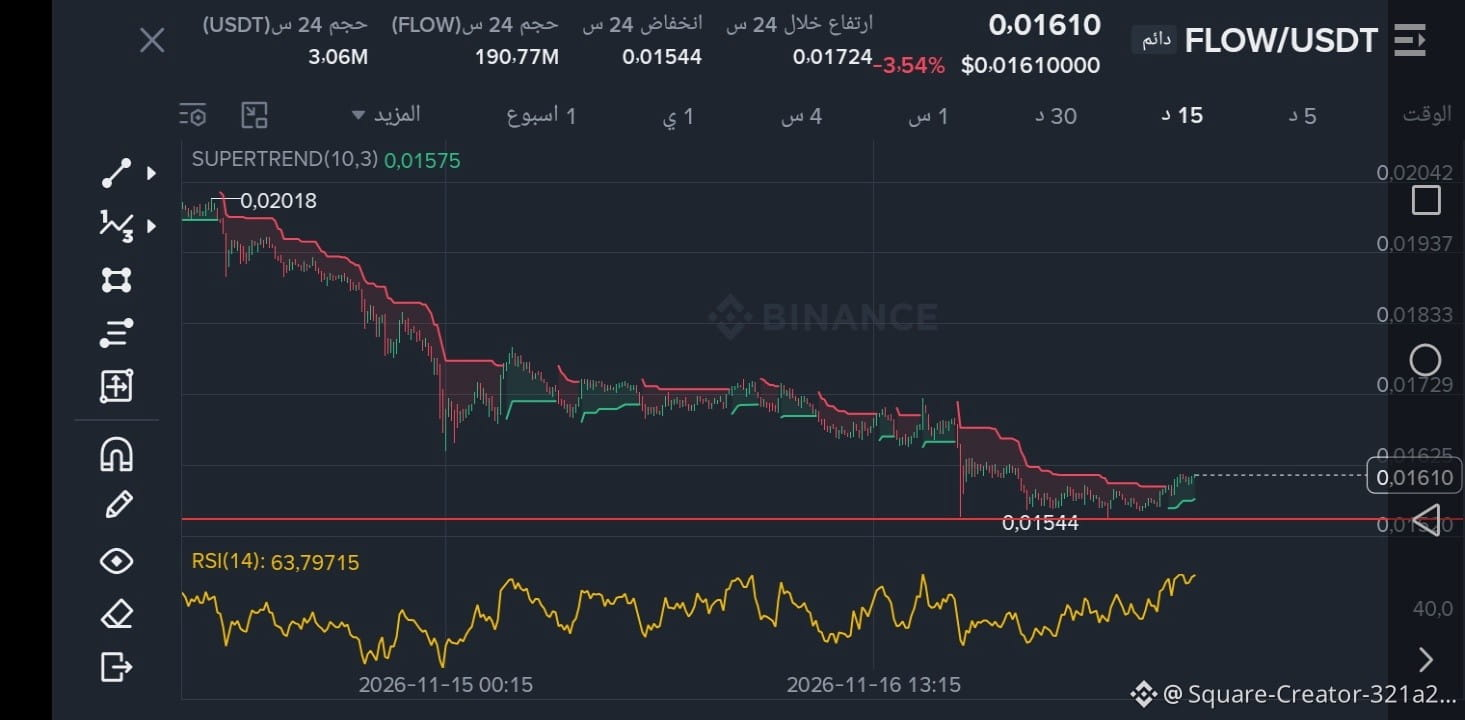
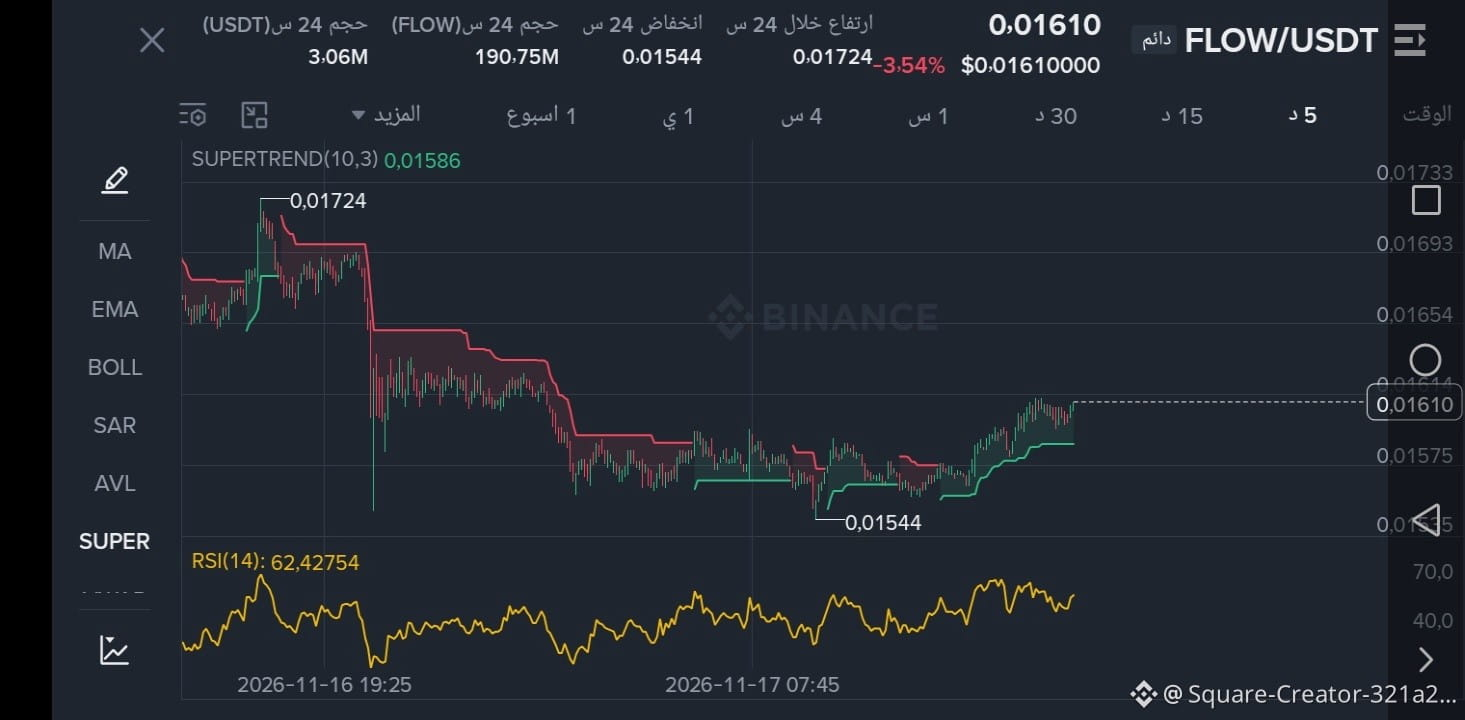
FLOW Has the reversal started from the bottom?
Current price: 0.01609
24h change: -3.77%
24h high: 0.01724
24h low: 0.01544
Trading volume: 3.06M
After a drop from 0.01799 to $0.01544
SuperTrend flipped from red to green at 0.01574, the first bullish reversal signal
📊 RSI rose from 35 to 63.33
Buying momentum has returned strongly
Price is above SuperTrend
Holding above support
Resistance
1. $0.01643
2. $0.01699
Support:
1. 0.01574 = SuperTrend
2. 0.01544 = 24h low
Holding above 0.01574 + breaking through 0.01643 = the way is open to 0.01699
Will $FLOW continue the bullish reversal?
{future}(FLOWUSDT)
Analysis and monitoring, not financial advice.
#BR Bullish, as we predicted earlier
#M Bullish, as we predicted
#FLOW
#FLOWUSDT
$M
{future}(MUSDT)
$BR
FLOW Has the reversal started from the bottom?
Current price: 0.01609
24h change: -3.77%
24h high: 0.01724
24h low: 0.01544
Trading volume: 3.06M
After a drop from 0.01799 to $0.01544
SuperTrend flipped from red to green at 0.01574, the first bullish reversal signal
📊 RSI rose from 35 to 63.33
Buying momentum has returned strongly
Price is above SuperTrend
Holding above support
Resistance
1. $0.01643
2. $0.01699
Support:
1. 0.01574 = SuperTrend
2. 0.01544 = 24h low
Holding above 0.01574 + breaking through 0.01643 = the way is open to 0.01699
Will $FLOW continue the bullish reversal?
Analysis and monitoring, not financial advice.
#BR Bullish, as we predicted earlier
#M Bullish, as we predicted
#FLOW
#FLOWUSDT
$M
$BR
Current price: 0.01609
24h change: -3.77%
24h high: 0.01724
24h low: 0.01544
Trading volume: 3.06M
After a drop from 0.01799 to $0.01544
SuperTrend flipped from red to green at 0.01574, the first bullish reversal signal
📊 RSI rose from 35 to 63.33
Buying momentum has returned strongly
Price is above SuperTrend
Holding above support
Resistance
1. $0.01643
2. $0.01699
Support:
1. 0.01574 = SuperTrend
2. 0.01544 = 24h low
Holding above 0.01574 + breaking through 0.01643 = the way is open to 0.01699
Will $FLOW continue the bullish reversal?
Analysis and monitoring, not financial advice.
#BR Bullish, as we predicted earlier
#M Bullish, as we predicted
#FLOW
#FLOWUSDT
$M
$BR
1
42
·
--
Bullish
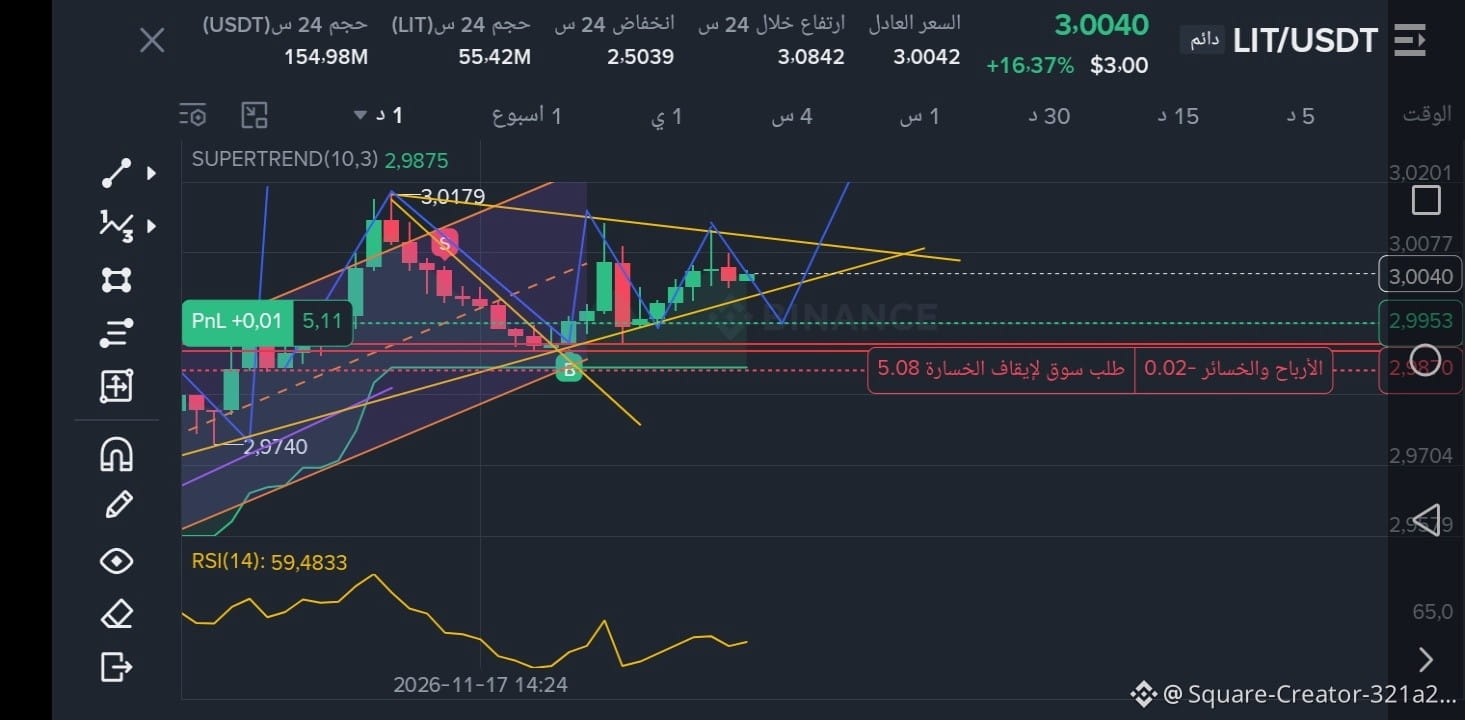
🔥🔥 $LIT
Officially broke above $3
Price now: $3.0040
24h change: +16.37%
24h high: $3.0842
24h low: $2.5039
Trading volume: $154.98M
From a low of $2.5039 to $3.0040 = +20% 🚀
LIT was holding at support at $2.5188.
It held above it and bounced strongly.
Then it entered an ascending channel and broke through its ceiling at $2.9891. After that, it broke through the psychological $3.00 level and held above it!
📊 RSI: 59.48 = healthy zone, with room to rise
📊 SuperTrend: $2.9875, green = the trend is still bullish
📊 Price: above $3.00 = breakout confirmed
Key levels:
Resistance:
1. $3.0179 = recent high
2. $3.0242 = next resistance
3. $3.0842 = 24h high
Support:
1. $3.00 = psychological level
2. $2.9891 = broken channel ceiling
3. $2.9875 = SuperTrend
Holding above $3.00 = the way is clear to $3.0242, then $3.0842.
There is a chance of an explosive move upward, based on the reading.
This is not financial advice, but rather my personal analysis.
Good luck to everyone, God willing.
$LIT
#LIT
#Crypto
#Binance
#LITUSDT
🔥🔥 $LIT
Officially broke above $3
Price now: $3.0040
24h change: +16.37%
24h high: $3.0842
24h low: $2.5039
Trading volume: $154.98M
From a low of $2.5039 to $3.0040 = +20% 🚀
LIT was holding at support at $2.5188.
It held above it and bounced strongly.
Then it entered an ascending channel and broke through its ceiling at $2.9891. After that, it broke through the psychological $3.00 level and held above it!
📊 RSI: 59.48 = healthy zone, with room to rise
📊 SuperTrend: $2.9875, green = the trend is still bullish
📊 Price: above $3.00 = breakout confirmed
Key levels:
Resistance:
1. $3.0179 = recent high
2. $3.0242 = next resistance
3. $3.0842 = 24h high
Support:
1. $3.00 = psychological level
2. $2.9891 = broken channel ceiling
3. $2.9875 = SuperTrend
Holding above $3.00 = the way is clear to $3.0242, then $3.0842.
There is a chance of an explosive move upward, based on the reading.
This is not financial advice, but rather my personal analysis.
Good luck to everyone, God willing.
$LIT
#LIT
#Crypto
#Binance
#LITUSDT
Officially broke above $3
Price now: $3.0040
24h change: +16.37%
24h high: $3.0842
24h low: $2.5039
Trading volume: $154.98M
From a low of $2.5039 to $3.0040 = +20% 🚀
LIT was holding at support at $2.5188.
It held above it and bounced strongly.
Then it entered an ascending channel and broke through its ceiling at $2.9891. After that, it broke through the psychological $3.00 level and held above it!
📊 RSI: 59.48 = healthy zone, with room to rise
📊 SuperTrend: $2.9875, green = the trend is still bullish
📊 Price: above $3.00 = breakout confirmed
Key levels:
Resistance:
1. $3.0179 = recent high
2. $3.0242 = next resistance
3. $3.0842 = 24h high
Support:
1. $3.00 = psychological level
2. $2.9891 = broken channel ceiling
3. $2.9875 = SuperTrend
Holding above $3.00 = the way is clear to $3.0242, then $3.0842.
There is a chance of an explosive move upward, based on the reading.
This is not financial advice, but rather my personal analysis.
Good luck to everyone, God willing.
$LIT
#LIT
#Crypto
#Binance
#LITUSDT
1
30
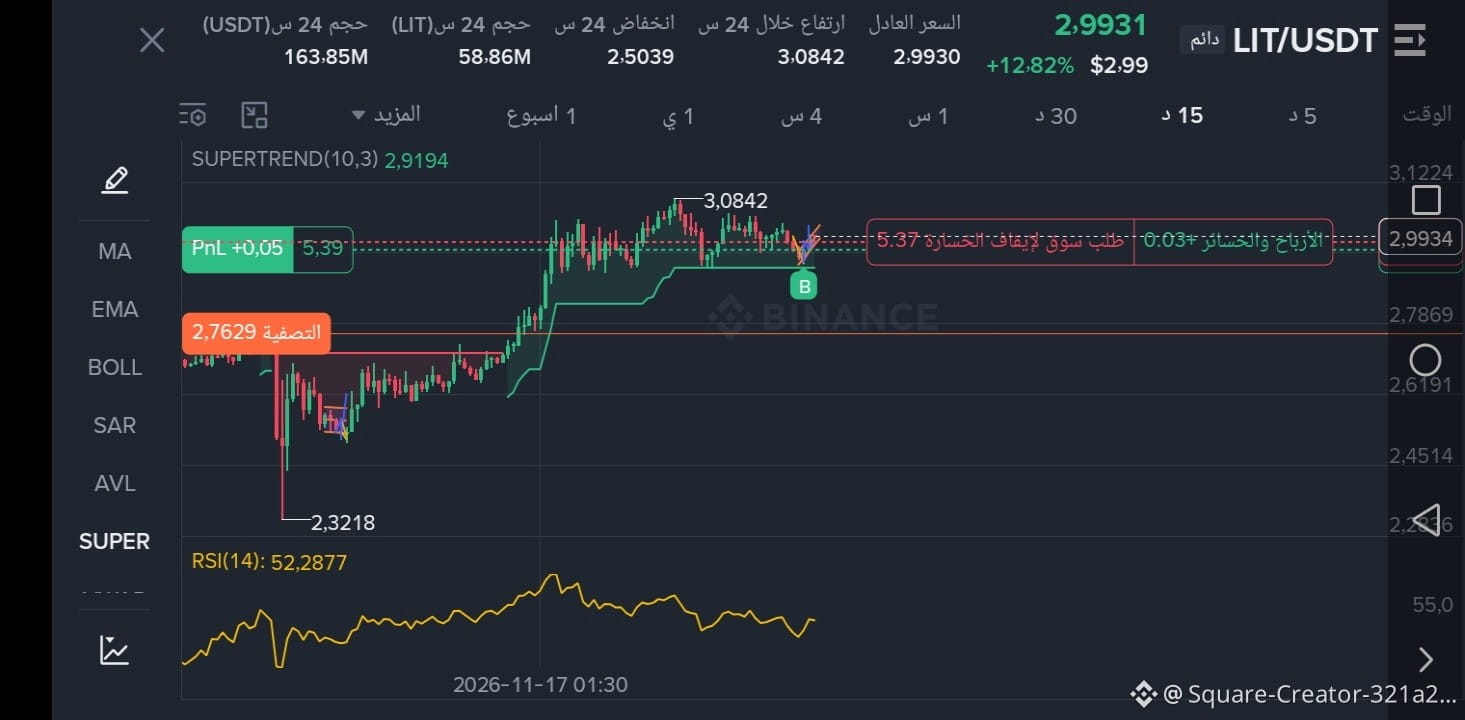
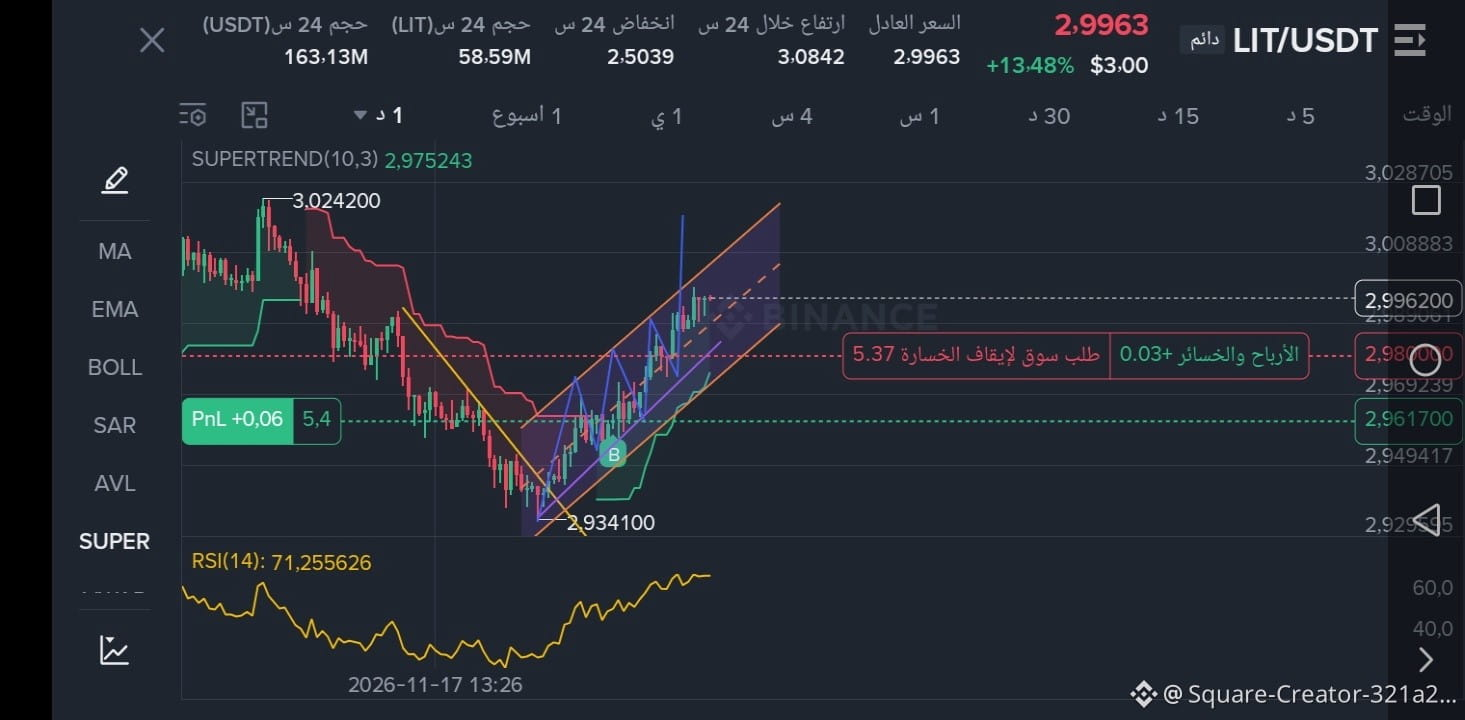
Upward move as expected
🟢Trade $LIT
Broke through the channel ceiling at 2.9891$ ✅
SuperTrend green at 2.9752$ ✅
RSI 71 = overbought
Target: 3.0242$
Stop: 2.9617$ = no loss
#Lıt
Not financial advice, just analysis
Upward move as expected
🟢Trade $LIT
Broke through the channel ceiling at 2.9891$ ✅
SuperTrend green at 2.9752$ ✅
RSI 71 = overbought
Target: 3.0242$
Stop: 2.9617$ = no loss
#Lıt
Not financial advice, just analysis
🟢Trade $LIT
Broke through the channel ceiling at 2.9891$ ✅
SuperTrend green at 2.9752$ ✅
RSI 71 = overbought
Target: 3.0242$
Stop: 2.9617$ = no loss
#Lıt
Not financial advice, just analysis
6
·
--
Bullish
🔥🔥 $ON
{future}(ONUSDT)
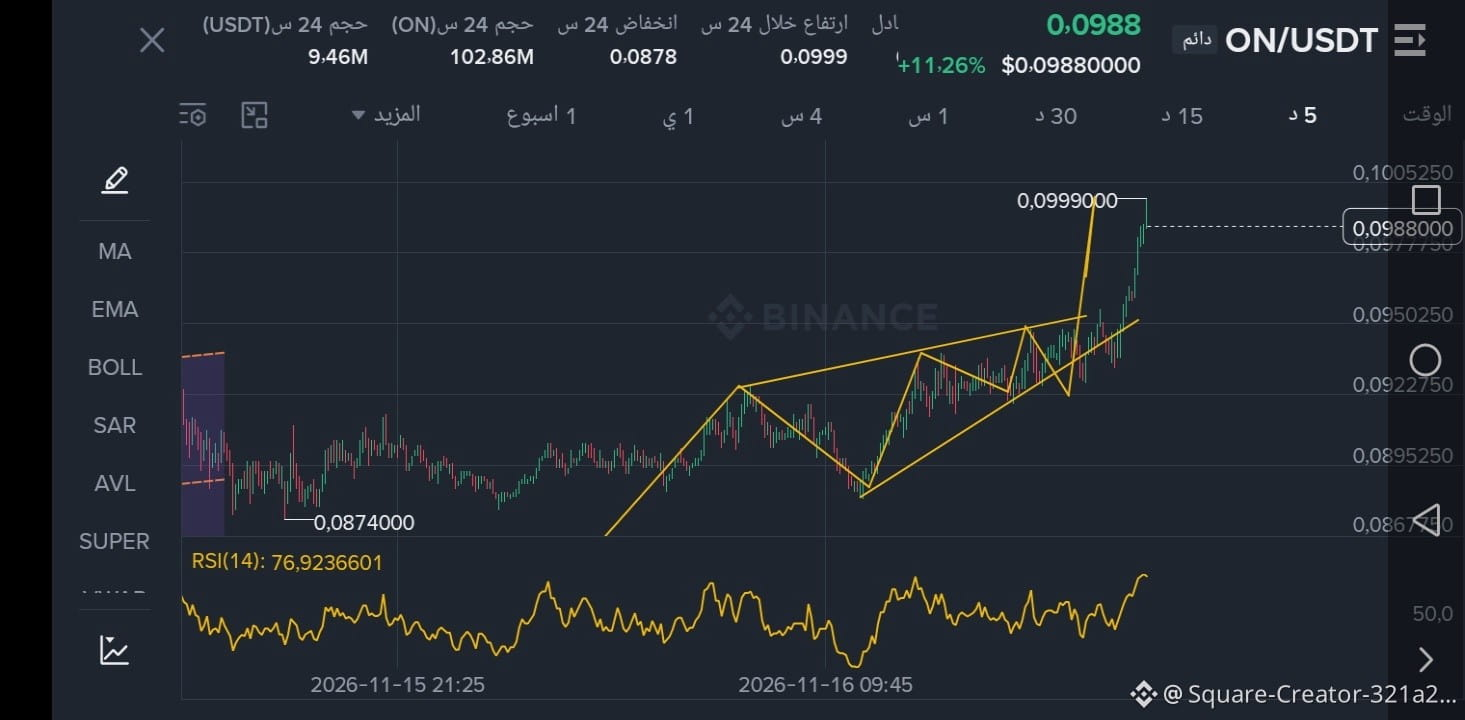
It reached $0.0999 and touched $0.10 — all targets achieved
And what we expected happened.
Price now: $0.0988
Change: +11.26%
High: $0.0999
Low: $0.0878
Trading volume: $9.46M
From $0.0939 to $0.0999 = +6.4% fully achieved 🚀🚀
We said a breakout above $0.0948 would mean an explosion, and a breakout above $0.0993 would target $0.10
And it all happened
📊 RSI: 76.92 = still overbought = profit-taking is possible ⚠️
📊 Price: $0.0988 = just $0.0001 away from breaking $0.10!
📊 Pattern: Ascending triangle breakout + vertical rise
✅ Breakout above $0.10 = target $0.105 (+6%)
⛔ Profit-taking = pullback to $0.0948 (-4%) = another entry opportunity
Just analysis, and I was lucky. Not financial advice.
#Binance
#on rocket
#BR bullish
$BR
{future}(BRUSDT)
🔥🔥 $ON
It reached $0.0999 and touched $0.10 — all targets achieved
And what we expected happened.
Price now: $0.0988
Change: +11.26%
High: $0.0999
Low: $0.0878
Trading volume: $9.46M
From $0.0939 to $0.0999 = +6.4% fully achieved 🚀🚀
We said a breakout above $0.0948 would mean an explosion, and a breakout above $0.0993 would target $0.10
And it all happened
📊 RSI: 76.92 = still overbought = profit-taking is possible ⚠️
📊 Price: $0.0988 = just $0.0001 away from breaking $0.10!
📊 Pattern: Ascending triangle breakout + vertical rise
✅ Breakout above $0.10 = target $0.105 (+6%)
⛔ Profit-taking = pullback to $0.0948 (-4%) = another entry opportunity
Just analysis, and I was lucky. Not financial advice.
#Binance
#on rocket
#BR bullish
$BR
It reached $0.0999 and touched $0.10 — all targets achieved
And what we expected happened.
Price now: $0.0988
Change: +11.26%
High: $0.0999
Low: $0.0878
Trading volume: $9.46M
From $0.0939 to $0.0999 = +6.4% fully achieved 🚀🚀
We said a breakout above $0.0948 would mean an explosion, and a breakout above $0.0993 would target $0.10
And it all happened
📊 RSI: 76.92 = still overbought = profit-taking is possible ⚠️
📊 Price: $0.0988 = just $0.0001 away from breaking $0.10!
📊 Pattern: Ascending triangle breakout + vertical rise
✅ Breakout above $0.10 = target $0.105 (+6%)
⛔ Profit-taking = pullback to $0.0948 (-4%) = another entry opportunity
Just analysis, and I was lucky. Not financial advice.
#Binance
#on rocket
#BR bullish
$BR
1
21
·
--
Bullish
🔥 $BR
{future}(BRUSDT)
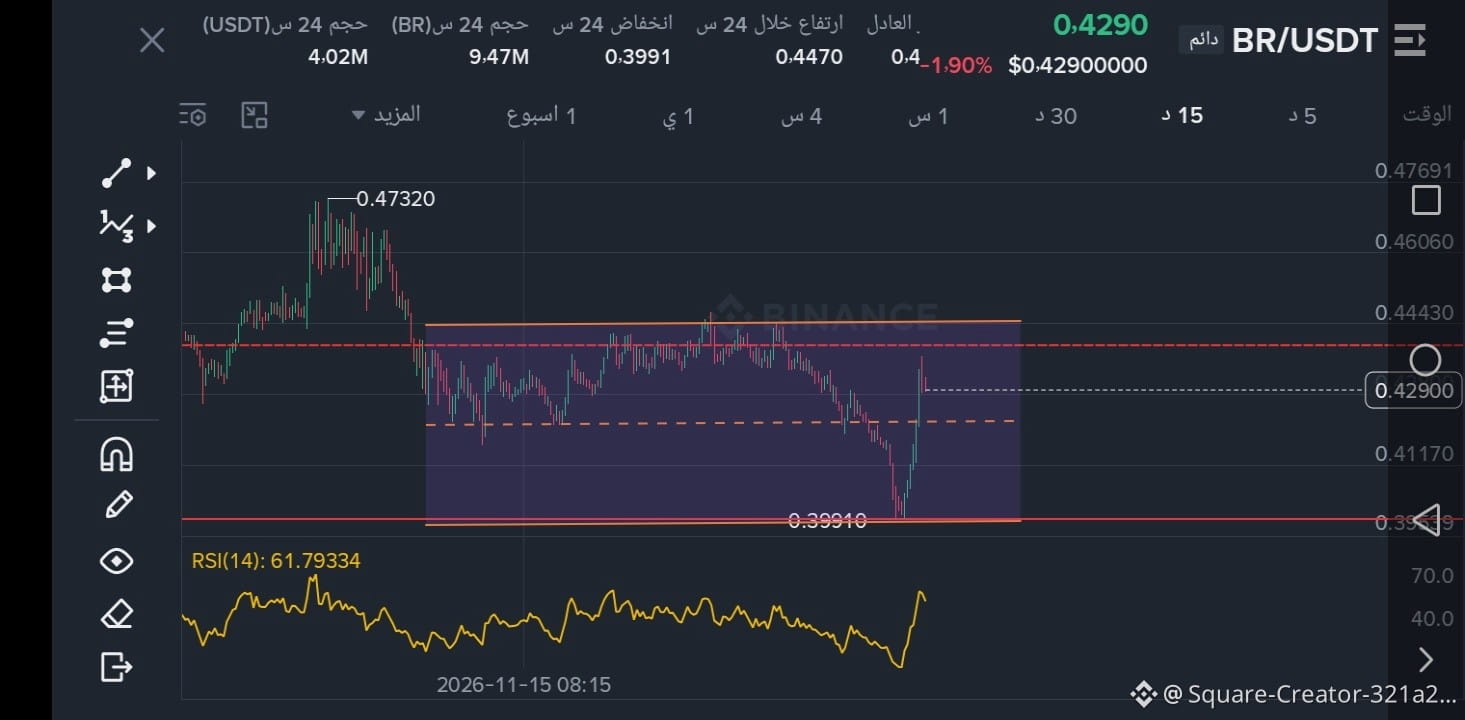
Strong rebound from the bottom of the box + RSI rose to 61
Current price: 0.4290$
Change: -1.90%
High: 0.4470$
Low: 0.3991$
Trading volume: 4.02M$
From 0.47320$ it dropped and entered a range from 0.3991$ to 0.4443$
Touched the low of 0.3991$ and rebounded +7.5% in one candle 🚀
📊 RSI: 61.79 = rose from 30 to 61 vertically = buyers entered strongly
📊 Price: 0.4290$ = in the middle of the range, after a strong rebound
📊 Pattern: sideways range + rebound from the bottom
✅ Break above 0.4443$ = target 0.47320$ (+10%)
⛔ Break below 0.4117$ = return to 0.3991$ (-6%)
#BR
#OP watching, rising from the bottom
Analysis only, good luck.
#fil watching, rising from the bottom
#Crypto
#w watching, rising from the bottom.
$OP
{future}(OPUSDT)
$FIL
{future}(FILUSDT)
Good luck to everyone, God willing
🔥 $BR
Strong rebound from the bottom of the box + RSI rose to 61
Current price: 0.4290$
Change: -1.90%
High: 0.4470$
Low: 0.3991$
Trading volume: 4.02M$
From 0.47320$ it dropped and entered a range from 0.3991$ to 0.4443$
Touched the low of 0.3991$ and rebounded +7.5% in one candle 🚀
📊 RSI: 61.79 = rose from 30 to 61 vertically = buyers entered strongly
📊 Price: 0.4290$ = in the middle of the range, after a strong rebound
📊 Pattern: sideways range + rebound from the bottom
✅ Break above 0.4443$ = target 0.47320$ (+10%)
⛔ Break below 0.4117$ = return to 0.3991$ (-6%)
#BR
#OP watching, rising from the bottom
Analysis only, good luck.
#fil watching, rising from the bottom
#Crypto
#w watching, rising from the bottom.
$OP
$FIL
Good luck to everyone, God willing
Strong rebound from the bottom of the box + RSI rose to 61
Current price: 0.4290$
Change: -1.90%
High: 0.4470$
Low: 0.3991$
Trading volume: 4.02M$
From 0.47320$ it dropped and entered a range from 0.3991$ to 0.4443$
Touched the low of 0.3991$ and rebounded +7.5% in one candle 🚀
📊 RSI: 61.79 = rose from 30 to 61 vertically = buyers entered strongly
📊 Price: 0.4290$ = in the middle of the range, after a strong rebound
📊 Pattern: sideways range + rebound from the bottom
✅ Break above 0.4443$ = target 0.47320$ (+10%)
⛔ Break below 0.4117$ = return to 0.3991$ (-6%)
#BR
#OP watching, rising from the bottom
Analysis only, good luck.
#fil watching, rising from the bottom
#Crypto
#w watching, rising from the bottom.
$OP
$FIL
Good luck to everyone, God willing
23
·
--
Bullish
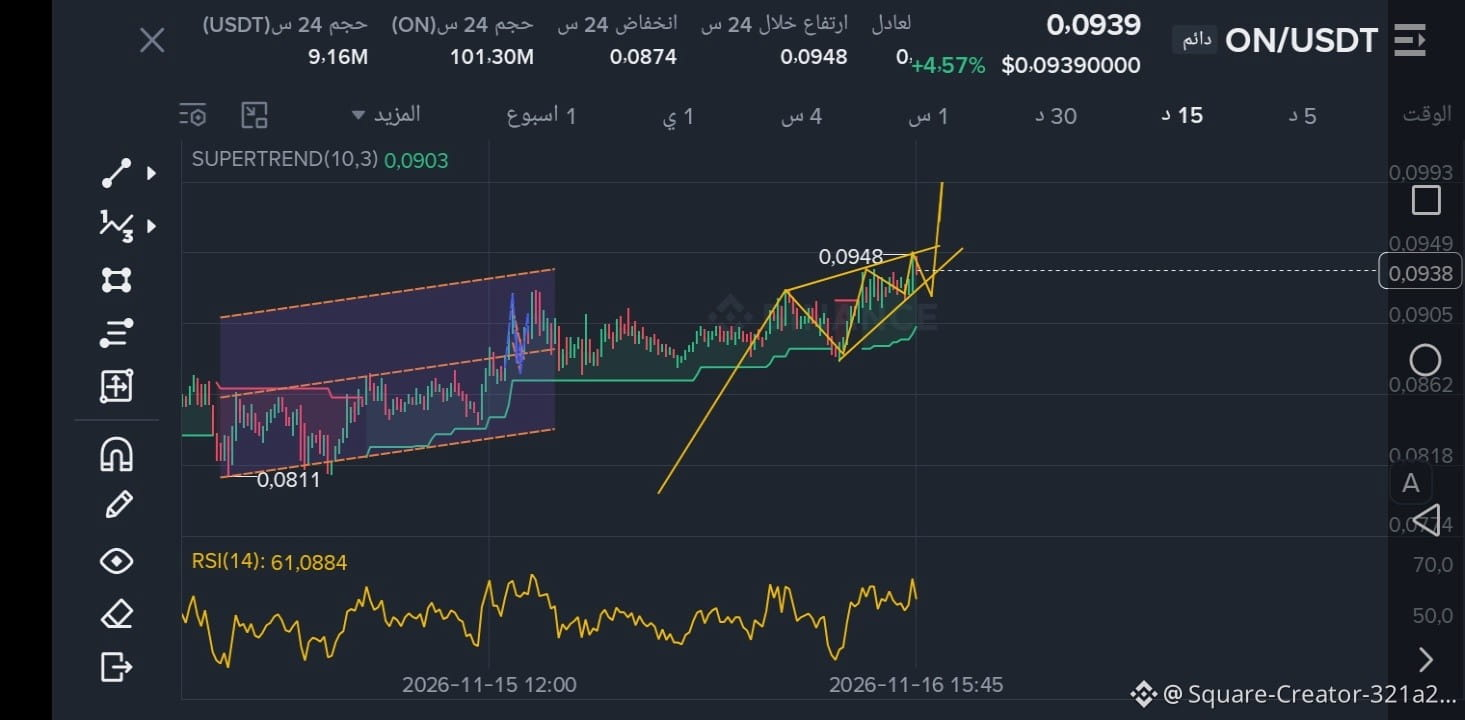
As expected..
🔥 $ON
{future}(ONUSDT)
is pushing toward the peak, and a breakout is getting closer
Current price: $0.0939
Change: +4.57%
Peak: $0.0948
Low: $0.0874
Trading volume: $9.16M
From $0.0811 to $0.0948 = up +16.9% 🚀
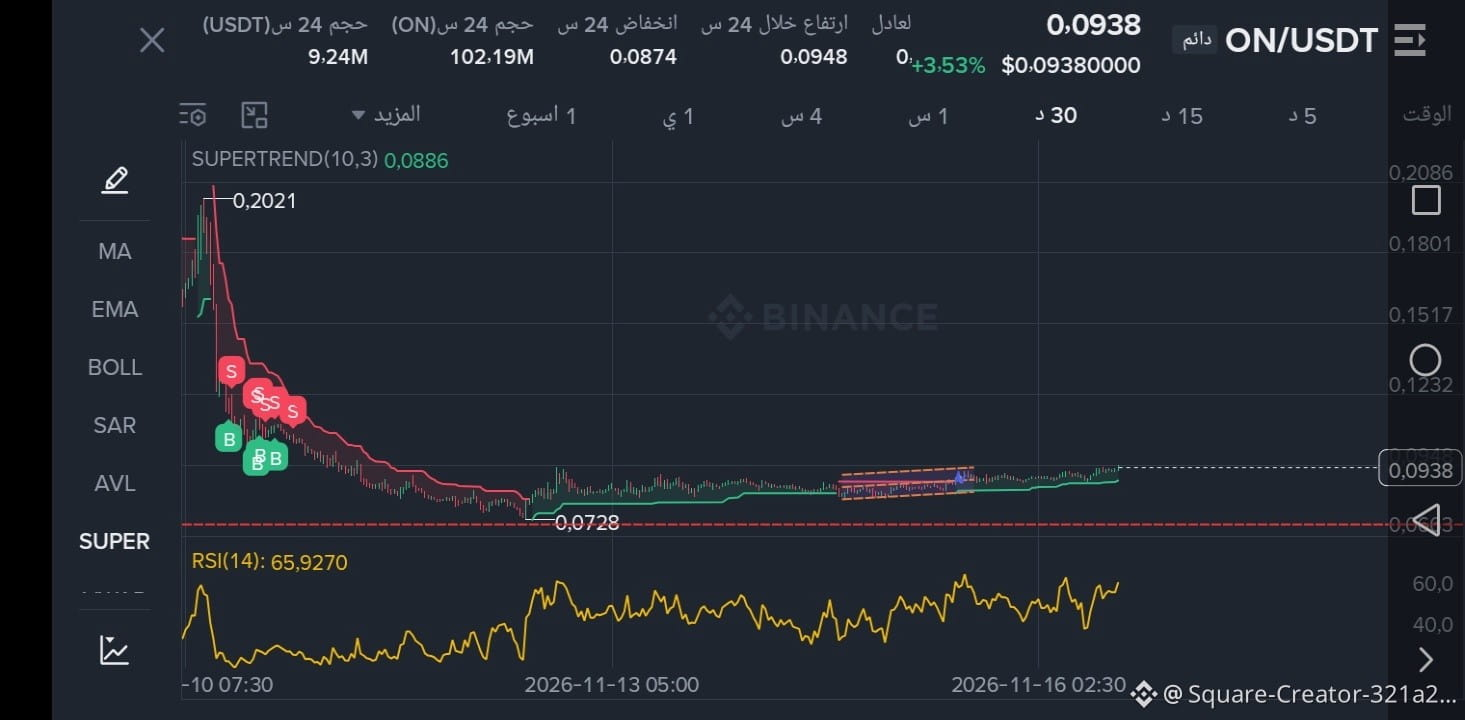
Now inside an ascending triangle, pressing against resistance
📊 SuperTrend: $0.0903 green = uptrend 🟢
📊 RSI: 61.08 = above 60 = buyers are firmly in control 🔥
📊 Price: just $0.0009 below the peak
✅ Break above $0.0948 = target $0.0993 (+5.7%), then $0.10 (+6.5%)
⛔ Break below $0.0903 = drop to $0.0874 (-6.9%)
A breakout could happen at any moment
This is not financial advice, just analysis.
And it's rising from the bottom, God willing
#on
#ON
#Crypto
As expected..
🔥 $ON
is pushing toward the peak, and a breakout is getting closer
Current price: $0.0939
Change: +4.57%
Peak: $0.0948
Low: $0.0874
Trading volume: $9.16M
From $0.0811 to $0.0948 = up +16.9% 🚀
Now inside an ascending triangle, pressing against resistance
📊 SuperTrend: $0.0903 green = uptrend 🟢
📊 RSI: 61.08 = above 60 = buyers are firmly in control 🔥
📊 Price: just $0.0009 below the peak
✅ Break above $0.0948 = target $0.0993 (+5.7%), then $0.10 (+6.5%)
⛔ Break below $0.0903 = drop to $0.0874 (-6.9%)
A breakout could happen at any moment
This is not financial advice, just analysis.
And it's rising from the bottom, God willing
#on
#ON
#Crypto
🔥 $ON
is pushing toward the peak, and a breakout is getting closer
Current price: $0.0939
Change: +4.57%
Peak: $0.0948
Low: $0.0874
Trading volume: $9.16M
From $0.0811 to $0.0948 = up +16.9% 🚀
Now inside an ascending triangle, pressing against resistance
📊 SuperTrend: $0.0903 green = uptrend 🟢
📊 RSI: 61.08 = above 60 = buyers are firmly in control 🔥
📊 Price: just $0.0009 below the peak
✅ Break above $0.0948 = target $0.0993 (+5.7%), then $0.10 (+6.5%)
⛔ Break below $0.0903 = drop to $0.0874 (-6.9%)
A breakout could happen at any moment
This is not financial advice, just analysis.
And it's rising from the bottom, God willing
#on
#ON
#Crypto
Abo-Khalid-Dobal
·
--
BullishThe ascending wedge formation is currently within the accumulation channel, which formed as a bullish flag pattern.
#on
$ON
#on
$ON
1
134
·
--
Bullish
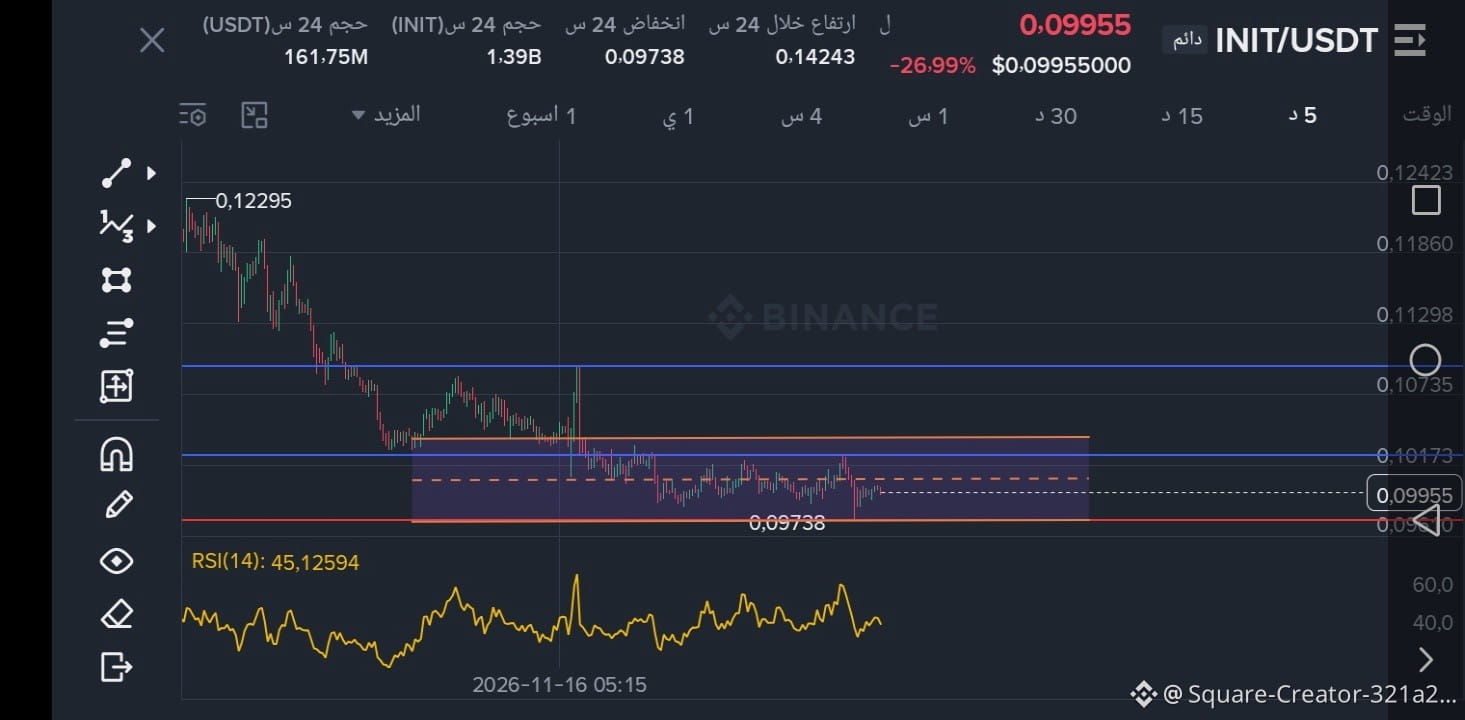
Update on INIT – why the breakout failed.
$INIT
{future}(INITUSDT)
A few hours ago, I told you that INIT was in a narrow triangle and a breakout was imminent.
What happened?
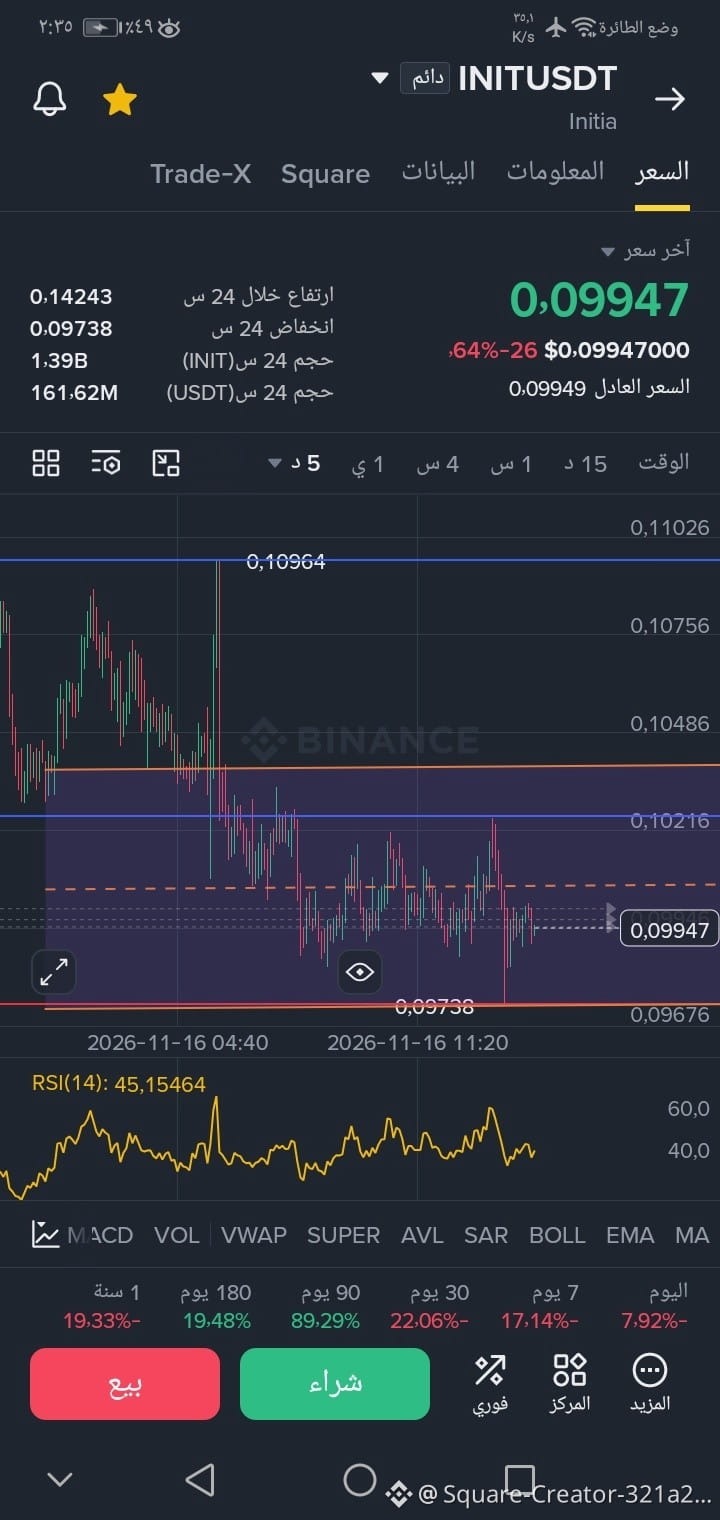
The price tried to rise to 0.10964 but failed to hold, and has now dropped to 0.09939, down -26.70%.
The market chose the second direction.
The price is now at the most important support: 0.09738.
This low is the lifeline. If it holds and bounces from here, we’ll return to test 0.10249 and then 0.10964 again.
If 0.09738 breaks and the price closes below it, the upward breakout is invalidated, and we enter a deeper decline.
RSI is now at 43.69—meaning the market is uncertain, not overbought or oversold.
Will INIT hold the 0.09738 support?
This is only analysis, not financial advice.
Good luck, everyone.
#w bullish
#BTW for monitoring
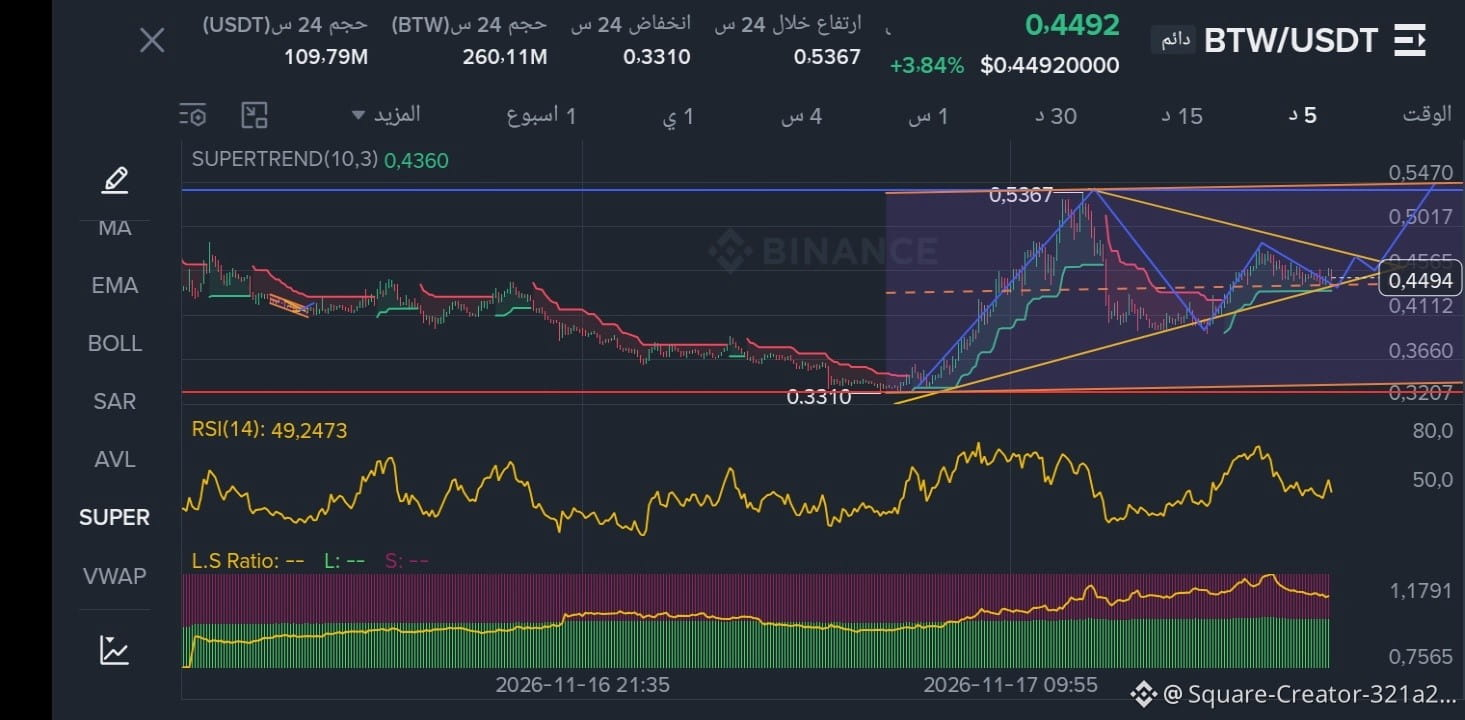
#INIT for monitoring
#init
$BTW
{future}(BTWUSDT)
$W
{future}(WUSDT)
Update on INIT – why the breakout failed.
$INIT
A few hours ago, I told you that INIT was in a narrow triangle and a breakout was imminent.
What happened?
The price tried to rise to 0.10964 but failed to hold, and has now dropped to 0.09939, down -26.70%.
The market chose the second direction.
The price is now at the most important support: 0.09738.
This low is the lifeline. If it holds and bounces from here, we’ll return to test 0.10249 and then 0.10964 again.
If 0.09738 breaks and the price closes below it, the upward breakout is invalidated, and we enter a deeper decline.
RSI is now at 43.69—meaning the market is uncertain, not overbought or oversold.
Will INIT hold the 0.09738 support?
This is only analysis, not financial advice.
Good luck, everyone.
#w bullish
#BTW for monitoring
#INIT for monitoring
#init
$BTW
$W
$INIT
A few hours ago, I told you that INIT was in a narrow triangle and a breakout was imminent.
What happened?
The price tried to rise to 0.10964 but failed to hold, and has now dropped to 0.09939, down -26.70%.
The market chose the second direction.
The price is now at the most important support: 0.09738.
This low is the lifeline. If it holds and bounces from here, we’ll return to test 0.10249 and then 0.10964 again.
If 0.09738 breaks and the price closes below it, the upward breakout is invalidated, and we enter a deeper decline.
RSI is now at 43.69—meaning the market is uncertain, not overbought or oversold.
Will INIT hold the 0.09738 support?
This is only analysis, not financial advice.
Good luck, everyone.
#w bullish
#BTW for monitoring
#INIT for monitoring
#init
$BTW
$W
1
65
Article
Not every green candle means a gain, and not every red candle means a lossNot every red candle means a loss... and not every green candle means a gain!
The most dangerous mistake beginners make on Binance:
They see a coin up +42% and say, "It's a winner," then buy it,
They see a coin down 19% and say, "It's a loser," then sell it.
The truth is exactly the opposite.
1. Green can mean a loss for you:
Imagine EVAA is up +42.94% today, reaching 2.5828.
Anyone who bought it this morning made a 42% profit.
Not every green candle means a gain, and not every red candle means a loss
Not every red candle means a loss... and not every green candle means a gain!
The most dangerous mistake beginners make on Binance:
They see a coin up +42% and say, "It's a winner," then buy it,
They see a coin down 19% and say, "It's a loser," then sell it.
The truth is exactly the opposite.
1. Green can mean a loss for you:
Imagine EVAA is up +42.94% today, reaching 2.5828.
Anyone who bought it this morning made a 42% profit.
The most dangerous mistake beginners make on Binance:
They see a coin up +42% and say, "It's a winner," then buy it,
They see a coin down 19% and say, "It's a loser," then sell it.
The truth is exactly the opposite.
1. Green can mean a loss for you:
Imagine EVAA is up +42.94% today, reaching 2.5828.
Anyone who bought it this morning made a 42% profit.
1
104
·
--
Bullish
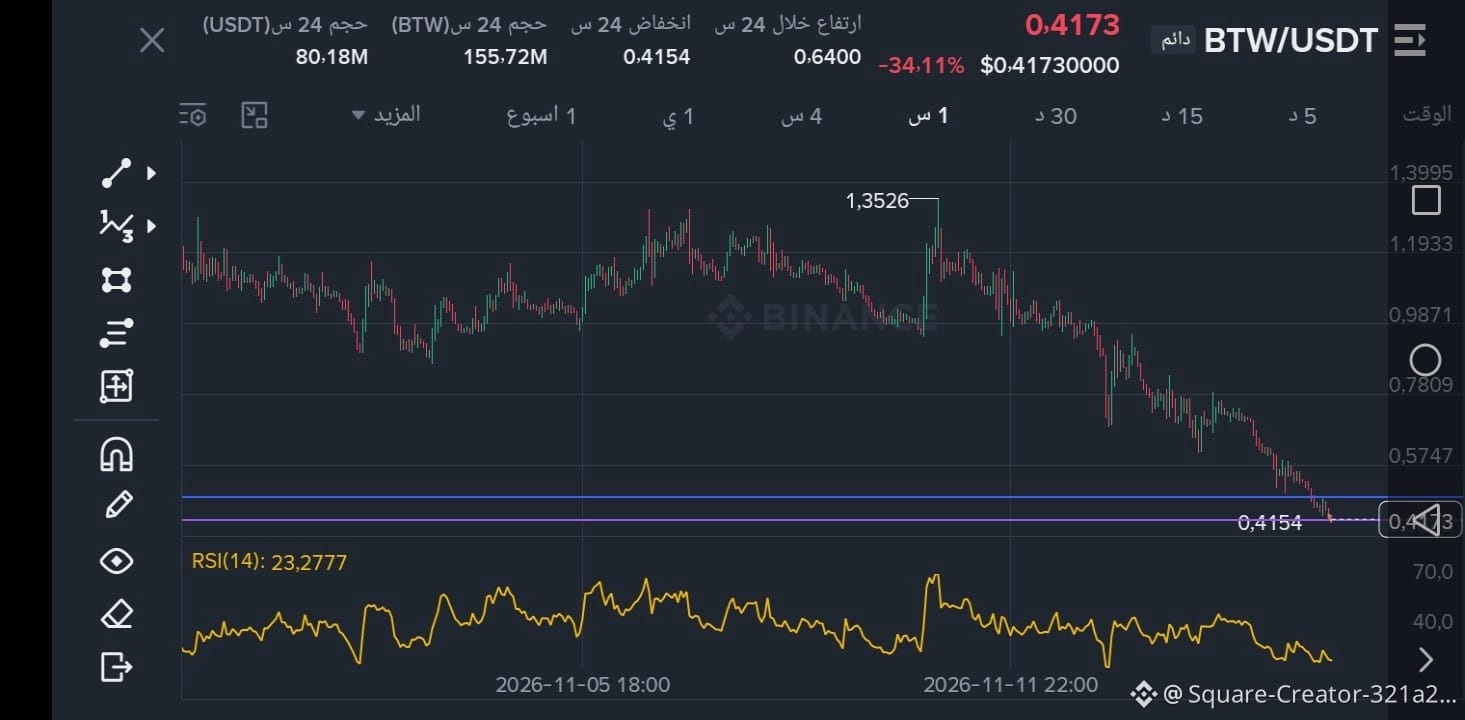
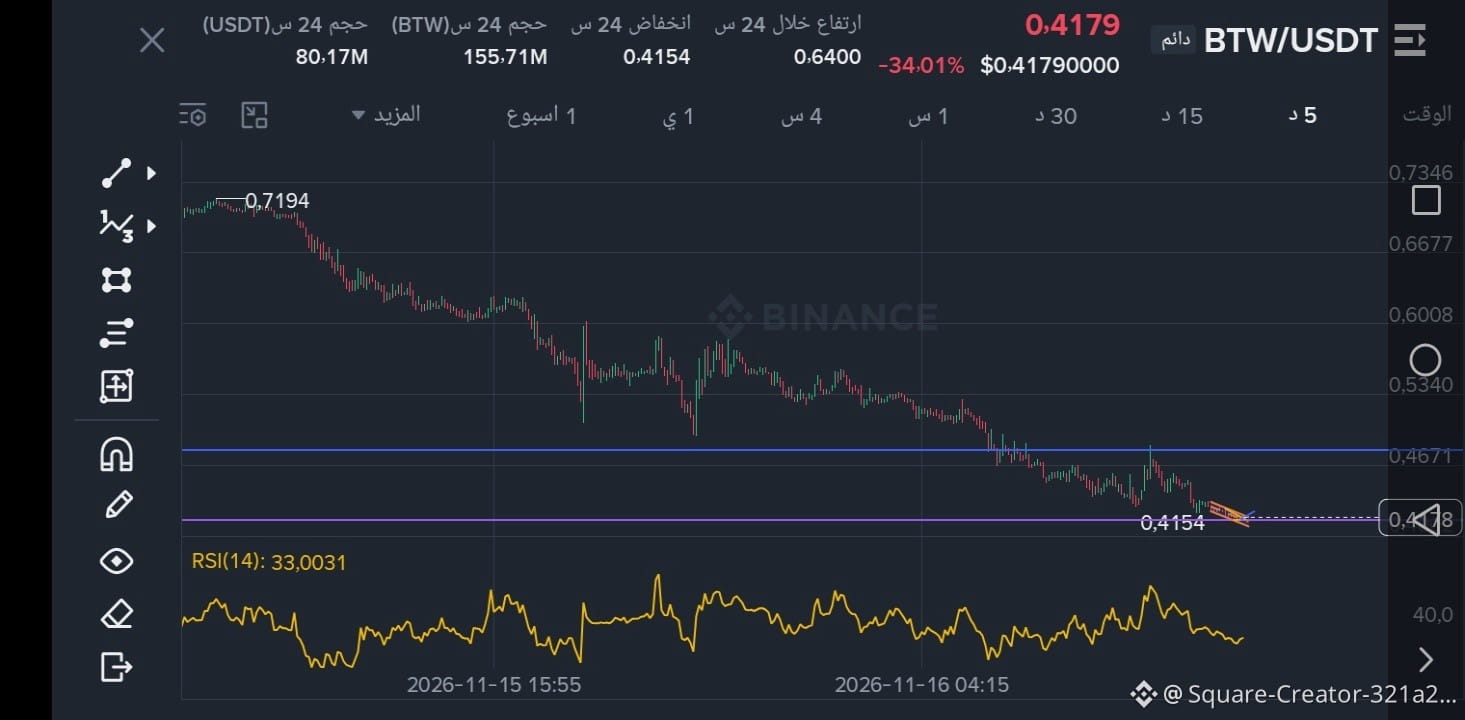
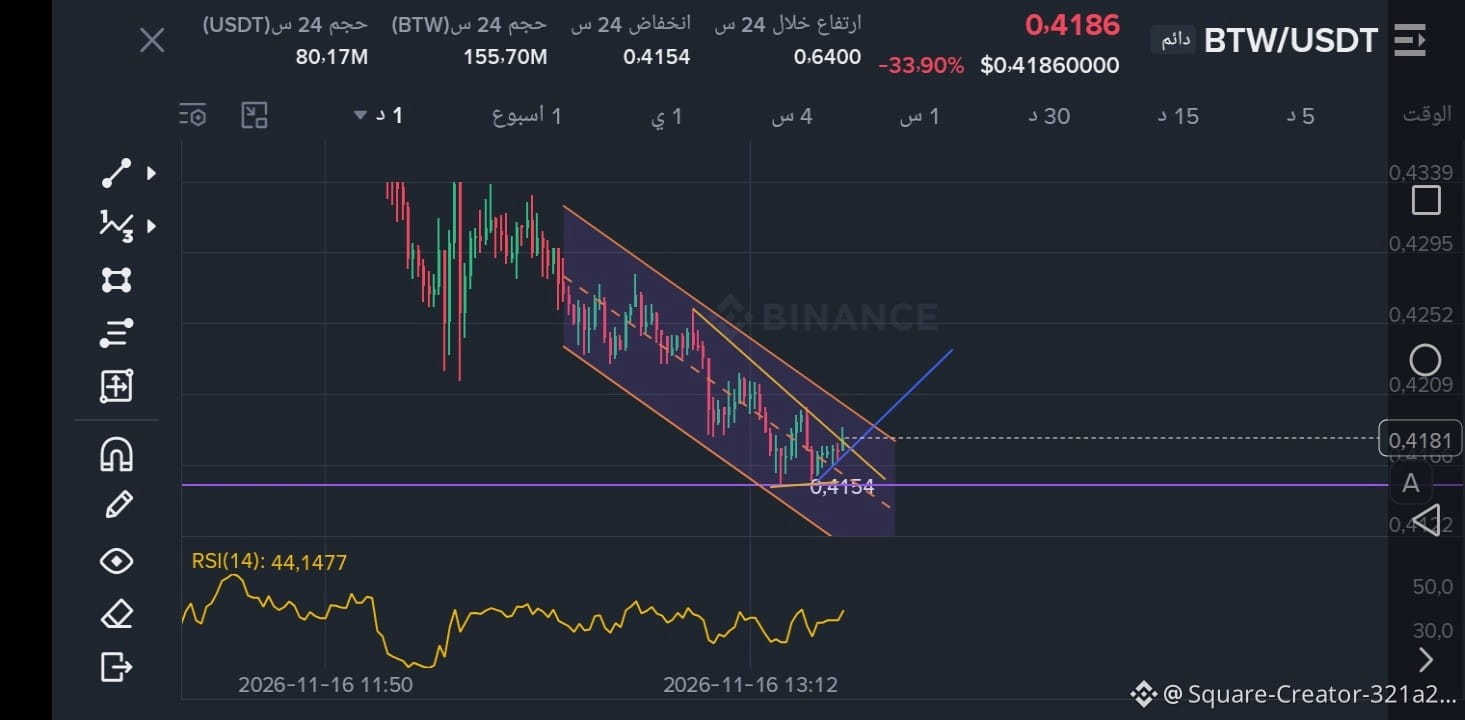
BTW across 3 timeframes: the bottom held and a rebound is approaching.
Current price: $0.4186
Change: -33.90%
High: $0.6400
Low: $0.4154
Trading volume: $80.17M
From $1.3526 to $0.4154 = down -69% 📉
But the $0.4154 low held 3 times and wasn’t broken!
📊 RSI across 3 timeframes: 23 -> 33 -> 44 = gradually rising
📊 Smaller timeframe: broke upward out of the descending channel ✅
📊 Price: held above $0.4154 = bullish divergence
✅ Holding above $0.4154 + holding above $0.4209 = rebound
Target 1: $0.4252
Target 2: $0.4671 (+11%)
Target 3: $0.48186 (+15%)
⛔ Breaking below $0.4154 = drop to $0.3100 (-25%)
This is the bottom
(This is not financial advice, just an analysis that may or may not be correct.) 👍
$BTW
{future}(BTWUSDT)
#BTW
#Crypto
#BTWUSDT⚡️
#Binance
BTW across 3 timeframes: the bottom held and a rebound is approaching.
Current price: $0.4186
Change: -33.90%
High: $0.6400
Low: $0.4154
Trading volume: $80.17M
From $1.3526 to $0.4154 = down -69% 📉
But the $0.4154 low held 3 times and wasn’t broken!
📊 RSI across 3 timeframes: 23 -> 33 -> 44 = gradually rising
📊 Smaller timeframe: broke upward out of the descending channel ✅
📊 Price: held above $0.4154 = bullish divergence
✅ Holding above $0.4154 + holding above $0.4209 = rebound
Target 1: $0.4252
Target 2: $0.4671 (+11%)
Target 3: $0.48186 (+15%)
⛔ Breaking below $0.4154 = drop to $0.3100 (-25%)
This is the bottom
(This is not financial advice, just an analysis that may or may not be correct.) 👍
$BTW
#BTW
#Crypto
#BTWUSDT⚡️
#Binance
Current price: $0.4186
Change: -33.90%
High: $0.6400
Low: $0.4154
Trading volume: $80.17M
From $1.3526 to $0.4154 = down -69% 📉
But the $0.4154 low held 3 times and wasn’t broken!
📊 RSI across 3 timeframes: 23 -> 33 -> 44 = gradually rising
📊 Smaller timeframe: broke upward out of the descending channel ✅
📊 Price: held above $0.4154 = bullish divergence
✅ Holding above $0.4154 + holding above $0.4209 = rebound
Target 1: $0.4252
Target 2: $0.4671 (+11%)
Target 3: $0.48186 (+15%)
⛔ Breaking below $0.4154 = drop to $0.3100 (-25%)
This is the bottom
(This is not financial advice, just an analysis that may or may not be correct.) 👍
$BTW
#BTW
#Crypto
#BTWUSDT⚡️
#Binance
1
132
·
--
Bullish
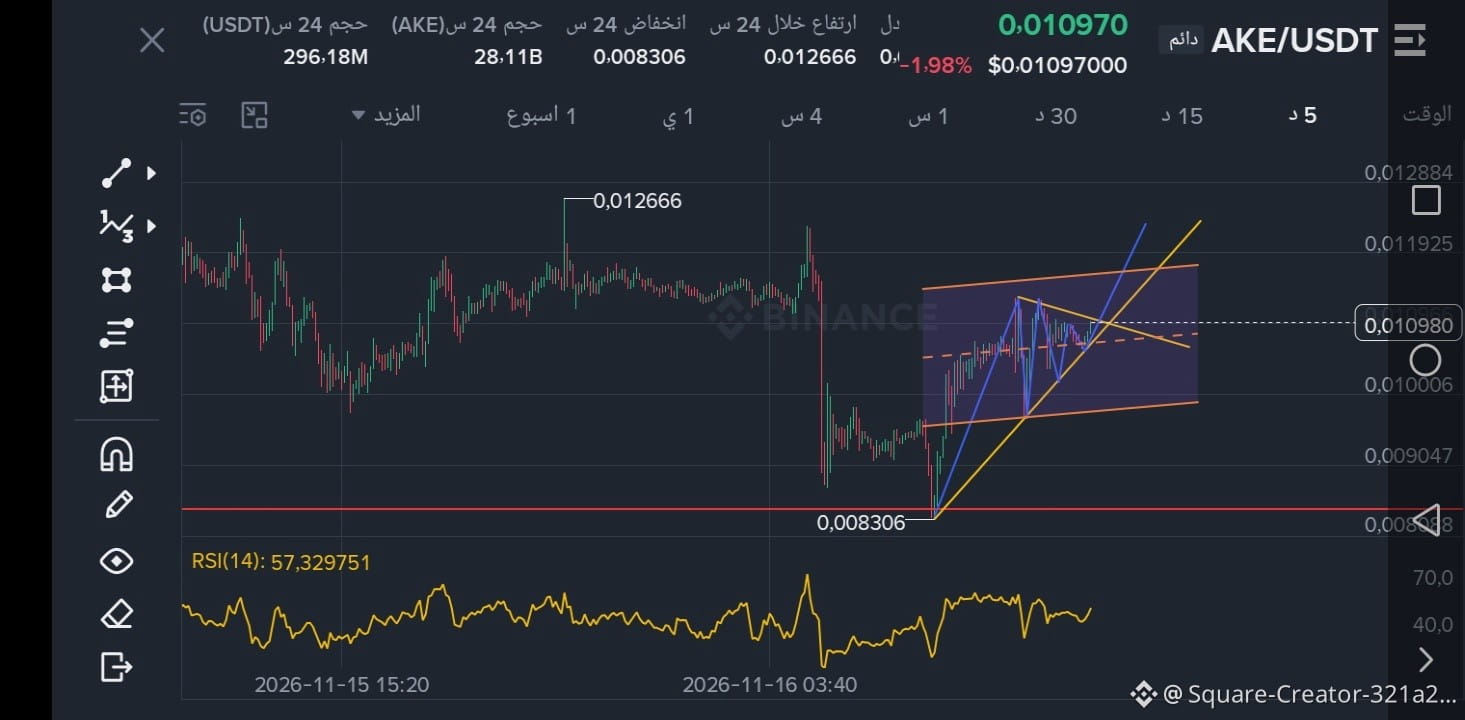
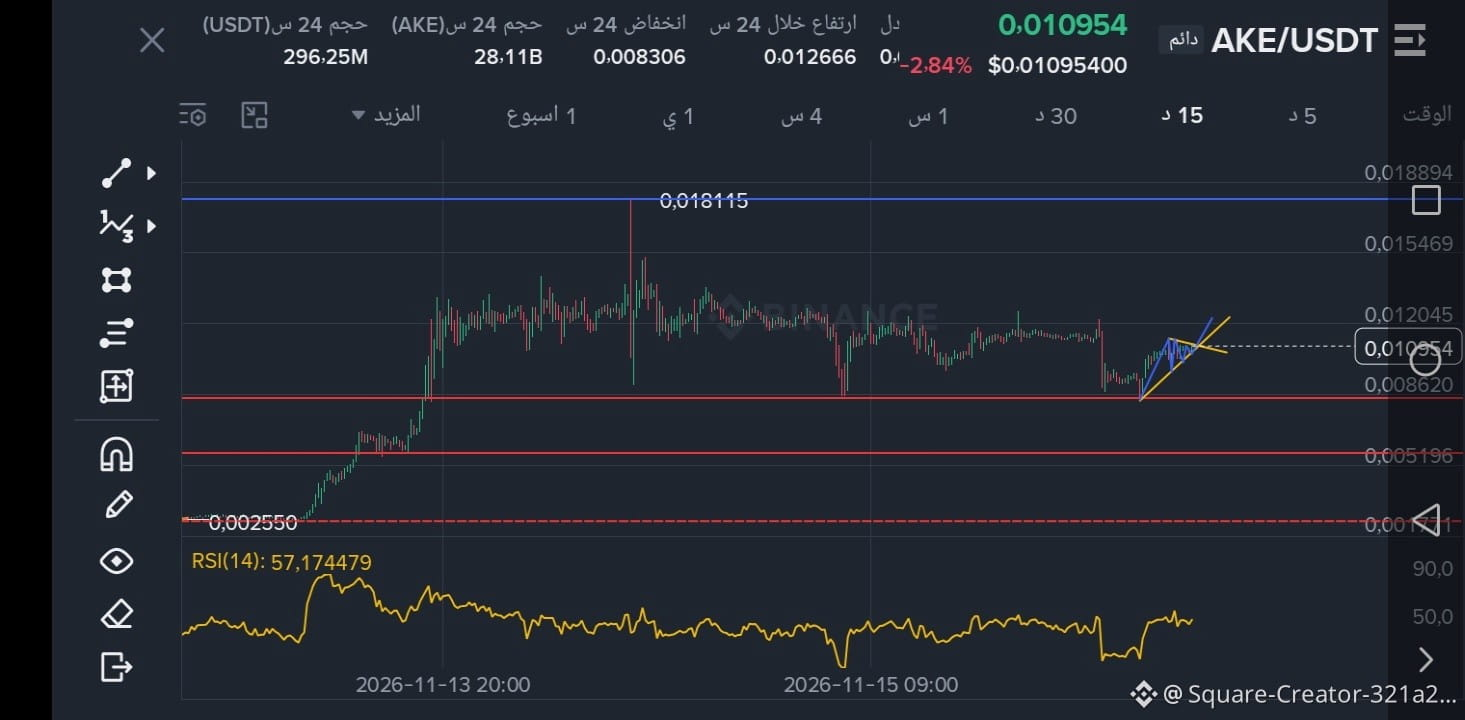
🔥 AKE rebound +32% from the bottom inside an ascending channel
Price now: 0.010970$
Change: -1.98%
High: 0.012666$
Low: 0.008306$
Trading volume: 296.18M$ 🔥
From 0.012666$ to 0.008306$ = a -34.4% drop in one candle!
Then a +32% rebound from the bottom ✅
📊 Pattern: ascending channel + small triangle inside it = accumulation before the next move
📊 RSI: 57.32 = above 50 = buyers are in control
📊 Volume: 296M$ = whales entering strongly
✅ Break above 0.011192$ = target 0.012666$ (+15%)
⛔ Break below 0.010006$ = return to 0.008306$
$AKE
{future}(AKEUSDT)
It's forming a new bottom. Good luck to everyone
This is not financial advice, just an analysis that may or may not be correct
#AKE
#Crypto
🔥 AKE rebound +32% from the bottom inside an ascending channel
Price now: 0.010970$
Change: -1.98%
High: 0.012666$
Low: 0.008306$
Trading volume: 296.18M$ 🔥
From 0.012666$ to 0.008306$ = a -34.4% drop in one candle!
Then a +32% rebound from the bottom ✅
📊 Pattern: ascending channel + small triangle inside it = accumulation before the next move
📊 RSI: 57.32 = above 50 = buyers are in control
📊 Volume: 296M$ = whales entering strongly
✅ Break above 0.011192$ = target 0.012666$ (+15%)
⛔ Break below 0.010006$ = return to 0.008306$
$AKE
It's forming a new bottom. Good luck to everyone
This is not financial advice, just an analysis that may or may not be correct
#AKE
#Crypto
Price now: 0.010970$
Change: -1.98%
High: 0.012666$
Low: 0.008306$
Trading volume: 296.18M$ 🔥
From 0.012666$ to 0.008306$ = a -34.4% drop in one candle!
Then a +32% rebound from the bottom ✅
📊 Pattern: ascending channel + small triangle inside it = accumulation before the next move
📊 RSI: 57.32 = above 50 = buyers are in control
📊 Volume: 296M$ = whales entering strongly
✅ Break above 0.011192$ = target 0.012666$ (+15%)
⛔ Break below 0.010006$ = return to 0.008306$
$AKE
It's forming a new bottom. Good luck to everyone
This is not financial advice, just an analysis that may or may not be correct
#AKE
#Crypto
1
151
·
--
Bullish
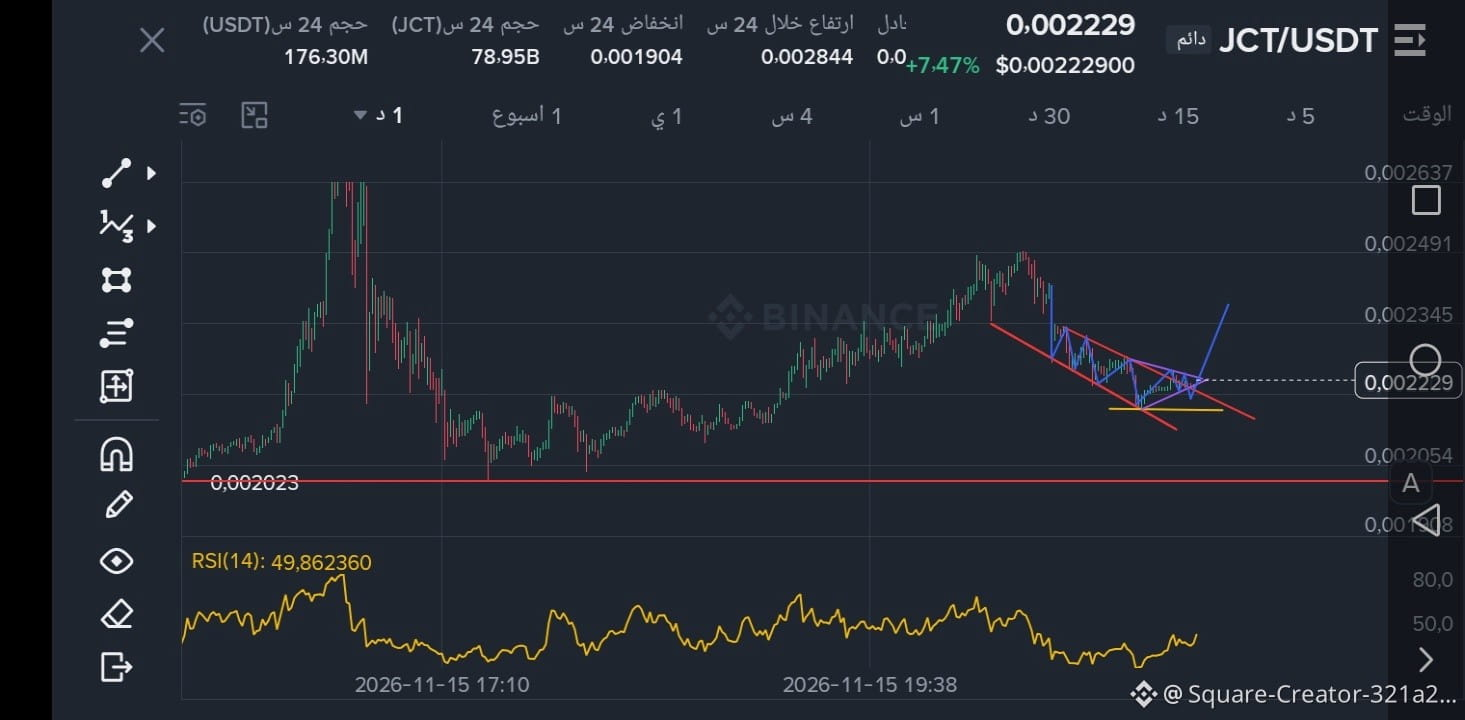
JCT - Falling Wedge pattern... an imminent upward breakout
JCT is now at 0.002229, up +7.47% in 24 hours
The chart shows a Falling Wedge pattern — one of the strongest bullish reversal patterns
The price fell from the high of 0.002844 to the low of 0.001904, then began forming higher lows within the wedge. The price is now compressed at the end of the wedge
Why I expect an upward breakout
1. RSI is now at 49.86 — in the middle, meaning there is plenty of room to rise
2. Trading volume is 176.30M — strong liquidity is present
3. The price held the historical support at 0.002023 and did not break below it
Breakout confirmation: break above 0.002345 and hold above it
Targets: 0.002491, then 0.002637, then 0.002844
Stop-loss: a break below 0.002023 invalidates the analysis
INIT and JCT have the same pattern tonight. Which one will break out first?
Good luck, everyone. Analysis and chart reading, and God knows best
$JCT
{future}(JCTUSDT)
$INIT
{future}(INITUSDT)
$EVAA
{future}(EVAAUSDT)
#JCT
#JCTUSD
JCT - Falling Wedge pattern... an imminent upward breakout
JCT is now at 0.002229, up +7.47% in 24 hours
The chart shows a Falling Wedge pattern — one of the strongest bullish reversal patterns
The price fell from the high of 0.002844 to the low of 0.001904, then began forming higher lows within the wedge. The price is now compressed at the end of the wedge
Why I expect an upward breakout
1. RSI is now at 49.86 — in the middle, meaning there is plenty of room to rise
2. Trading volume is 176.30M — strong liquidity is present
3. The price held the historical support at 0.002023 and did not break below it
Breakout confirmation: break above 0.002345 and hold above it
Targets: 0.002491, then 0.002637, then 0.002844
Stop-loss: a break below 0.002023 invalidates the analysis
INIT and JCT have the same pattern tonight. Which one will break out first?
Good luck, everyone. Analysis and chart reading, and God knows best
$JCT
$INIT
$EVAA
#JCT
#JCTUSD
JCT is now at 0.002229, up +7.47% in 24 hours
The chart shows a Falling Wedge pattern — one of the strongest bullish reversal patterns
The price fell from the high of 0.002844 to the low of 0.001904, then began forming higher lows within the wedge. The price is now compressed at the end of the wedge
Why I expect an upward breakout
1. RSI is now at 49.86 — in the middle, meaning there is plenty of room to rise
2. Trading volume is 176.30M — strong liquidity is present
3. The price held the historical support at 0.002023 and did not break below it
Breakout confirmation: break above 0.002345 and hold above it
Targets: 0.002491, then 0.002637, then 0.002844
Stop-loss: a break below 0.002023 invalidates the analysis
INIT and JCT have the same pattern tonight. Which one will break out first?
Good luck, everyone. Analysis and chart reading, and God knows best
$JCT
$INIT
$EVAA
#JCT
#JCTUSD
2
858
Log in to explore more content
Join global crypto users on Binance Square
⚡️ Get latest and useful information about crypto.
💬 Trusted by the world’s largest crypto exchange.
👍 Discover real insights from verified creators.
Email / Phone number
Trending Topics
NvidiaEarningsTonight:AIStocks’NextMove?
97,189 views
1,154 Discussing
Nvidia Earnings Day: Interim CEO's First Appearance — Can the AI Story Hold?
Binance News
·17 Likes
·8k views
A Packed Week of Earnings and Data Tests Markets
135,762 views
635 Discussing
AnthropicIPOTestsInvestorAppetiteForAI
301,013 views
2,791 Discussing