
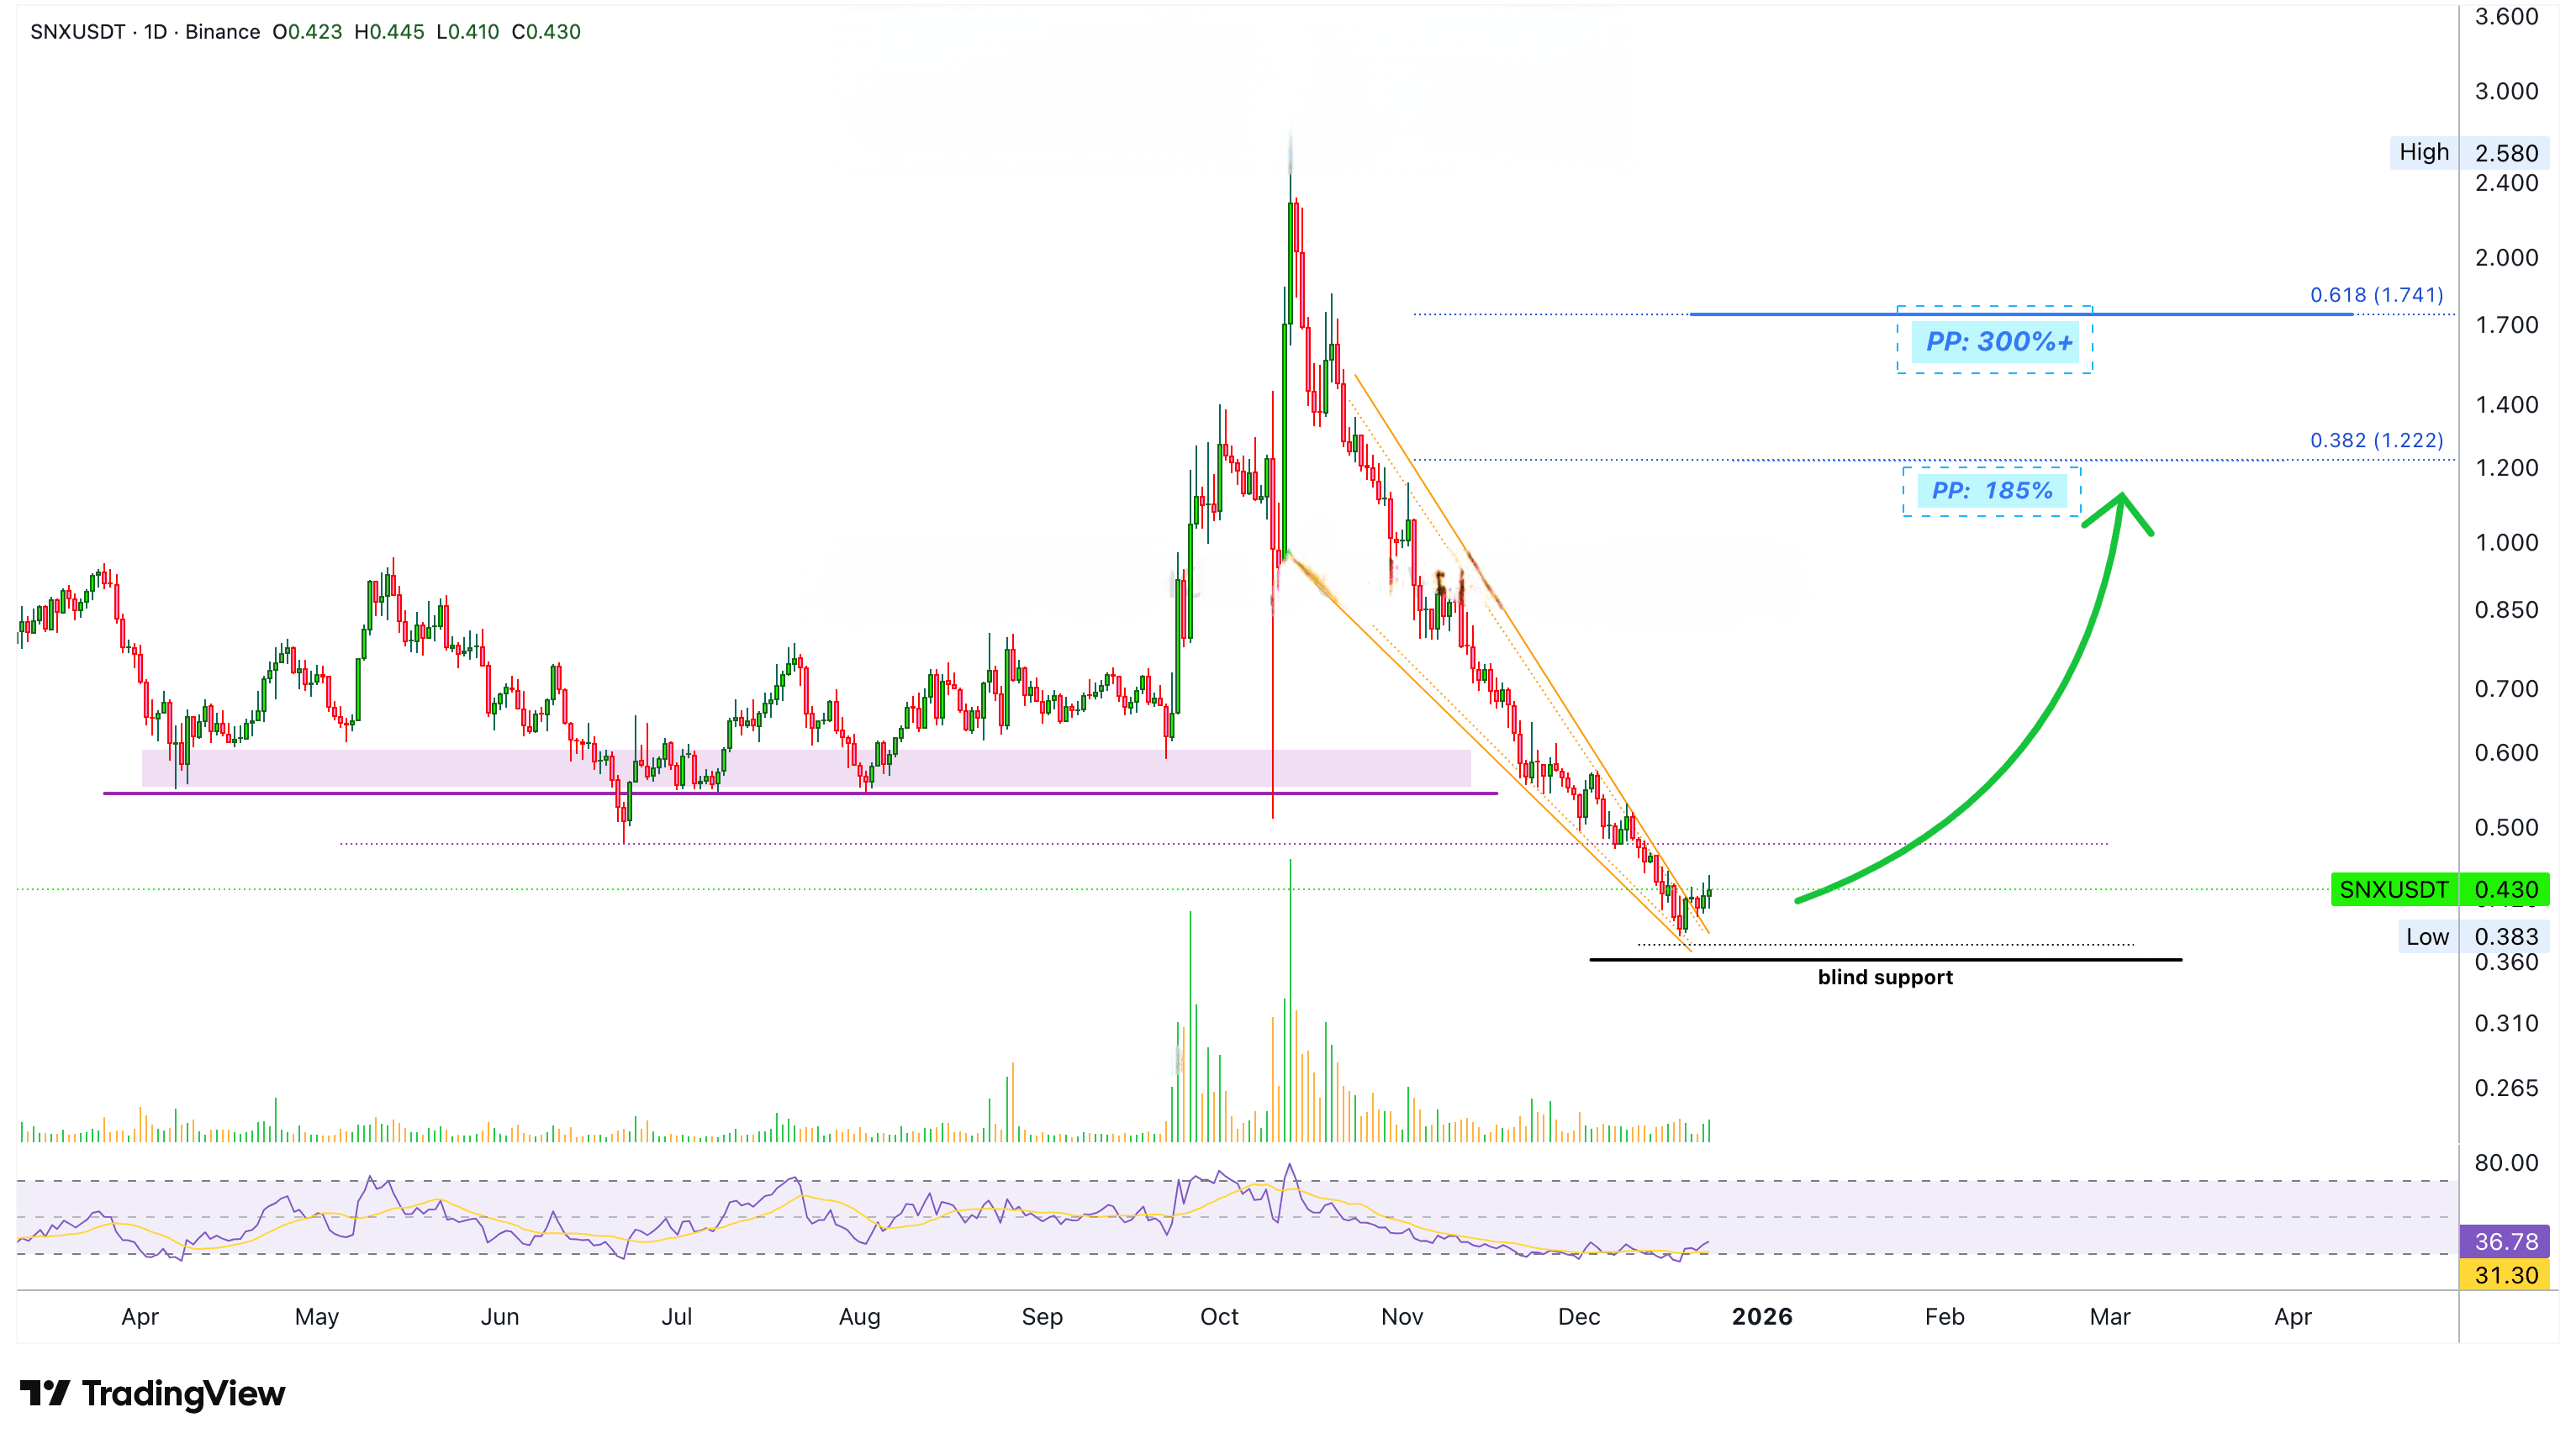
The signal here is called "hidden bullish divergence." It is one of those divergences with the Relative Strength Index. There is also a bearish doji pattern. Regardless of these, after a major outflow, there is always a strong recovery.
SNX dropped below its previous low and support and immediately began to turn around. The Relative Strength Index has entered the oversold area and is now starting to recover.
This is another chart setup similar to AAVE, you can buy now/today and start making profits the next day. Really the best prices and possible entry times.
Another upward signal comes from the volume, but we have already looked at this indicator many times.
Returning only to the baseline can result in significant gains. An upward wave here could easily produce some 150% to 300% within weeks or days, once the upward movement starts.
Since the decline was rapid and continuous, the opposite should be equally strong. These are ideal chart settings if you are looking for opportunities to enter a SPOT position.
⚠️ Disclaimer:
This analysis is for educational purposes only and does not encourage trading futures or any prohibited transactions. The goal is to illustrate potential market movements, not a direct recommendation to buy or sell.
💡 Important notes:
- This analysis is for educational purposes only.
- Please study the market and make decisions based on your ability and risk tolerance.
- The author is not responsible for others' trading or their profit results.
Namaste.
✅ Trading here on $SNX