
As we can see, Bitcoin has dropped enough from its summer peak, and corrections are still ongoing, and people are still wondering if this is the end of a bullish cycle? Well, we haven't even started; there is a lot of growth we can expect in 2026. Considering that the Federal Reserve has finally cut interest rates by another 0.25 basis points and now the current rates are around 3.75%, which is the lowest since the COVID-19 era.
Additionally, the recent release of the Consumer Price Index showed how inflation is declining in the United States, the expected data was 3.1% while the actual figures were 2.7% indicating that the U.S. economy is slowing down and the Federal Reserve considered this a signal to lower interest rates. Besides that, they announced a quantitative easing policy which means that a lot of cheap money will flow into the markets and it is just a matter of time until market sentiment shifts towards risk assets.
Recently, Donald Trump announced distributions of $2000 intended for every citizen in the United States. Other factors indicating that we should be patient for growth on BTC are that XAAUSD, XAGUSD, and even S%P500 are reaching new record levels, while BTC remains stable.
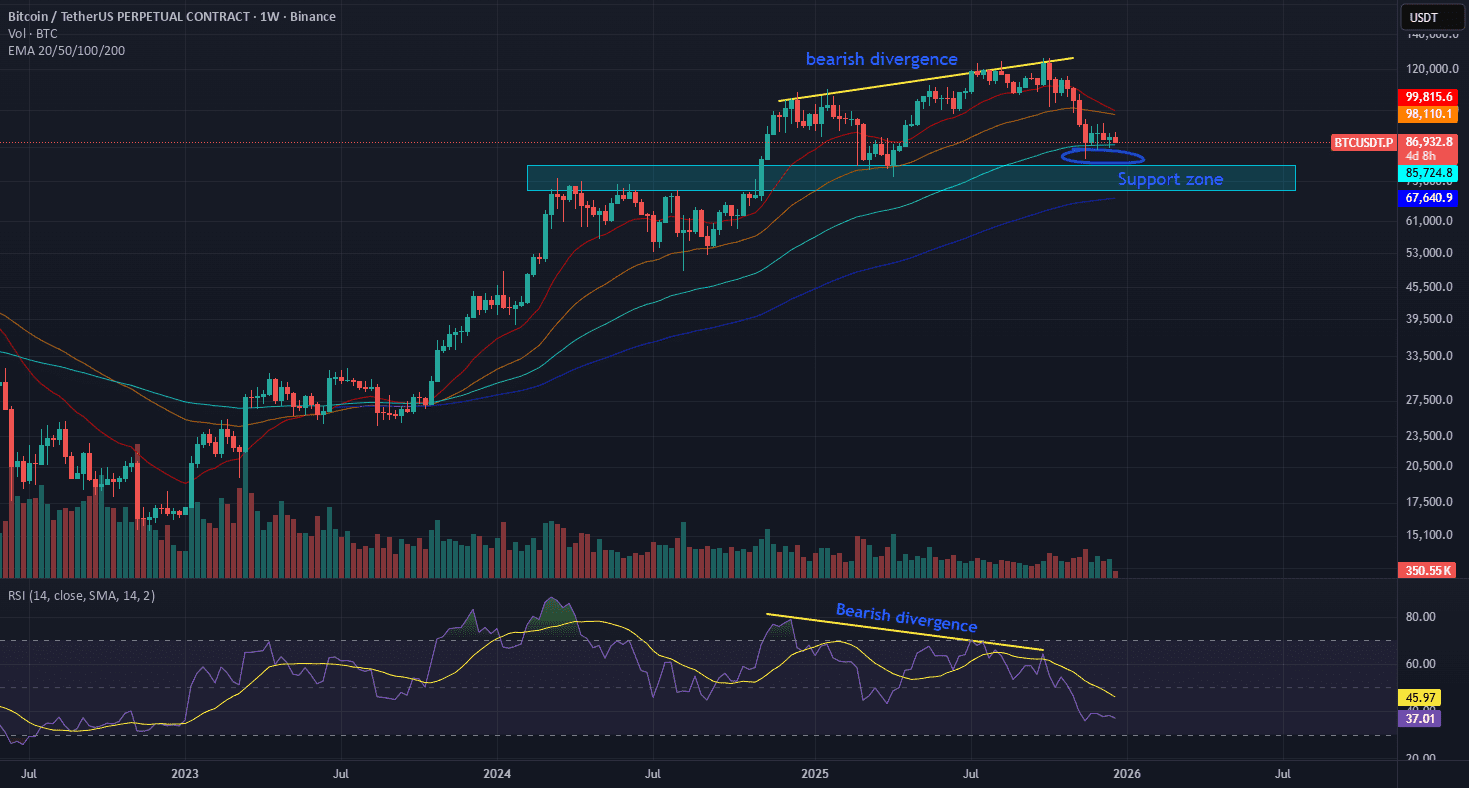
We took into account all the fundamental factors, now let's take a look at the BTC chart from technical analysis. I specifically opened a higher timeframe on 1-D because it is essential to look at the bigger picture. The price is not in a bearish area because according to the EMA 100/200 lines, we can see how BTC has bounced several times from the EMA 100 level, and the price holds above this level, preventing it from moving into the critical red area. Frankly, we are still in a stable position and we are in a distribution phase where many old BTC holders are selling their BTCs in large quantities, in addition, millions of dollars are flowing from the crypto market.
We can also see a bearish divergence on BTC, where the price made two peaks, the second peak higher than the first, and the RSI indicator showed us two lower levels, the first peak higher than the second indicating a bearish signal on higher timeframes. After a period of time, BTC finally calmed down enough and that bearish divergence disappeared from the chart, and this alone gives us a green light to recover BTC.
, so all we have to do is carefully look at the chart and wait for the reversal movement, and this is where we need to be quick enough to buy at the right time. I hope that 2026 starts with big green candles. When everything is said and done, I would like to hear your thoughts on my opinion. Please feel free to share your comments below this post. Good luck to everyone!
⚠️ Disclaimer:
This analysis is for educational purposes only and does not encourage trading in futures or any prohibited transactions. The goal is to illustrate potential market movements, not a direct recommendation to buy or sell.
💡 Important notes:
- This analysis is for educational purposes only.
- Please study the market and make decisions based on your ability and risk tolerance.
- The author is not responsible for others' trading or their profit results.
