Bitcoin analysis through five indicators
🔹 Wyckoff (structural behavior)
🔹 Price Action (support and resistance)
🔹 Macro & global news (Cash Flow + liquidity)
🔹 Market derivatives variables (Funding + OI + Liquidations)
🔹 A clear action plan for the investor and trader
The study will be comprehensive, practical, and applicable—not just a description.
🚀 Bitcoin Strategic Market Thesis – Dec 19, 2025
Analysis Title:
🔹 Phase Markdown + Liquidity Compression + Macro Pressure
🔹 Horizon 12–18 months
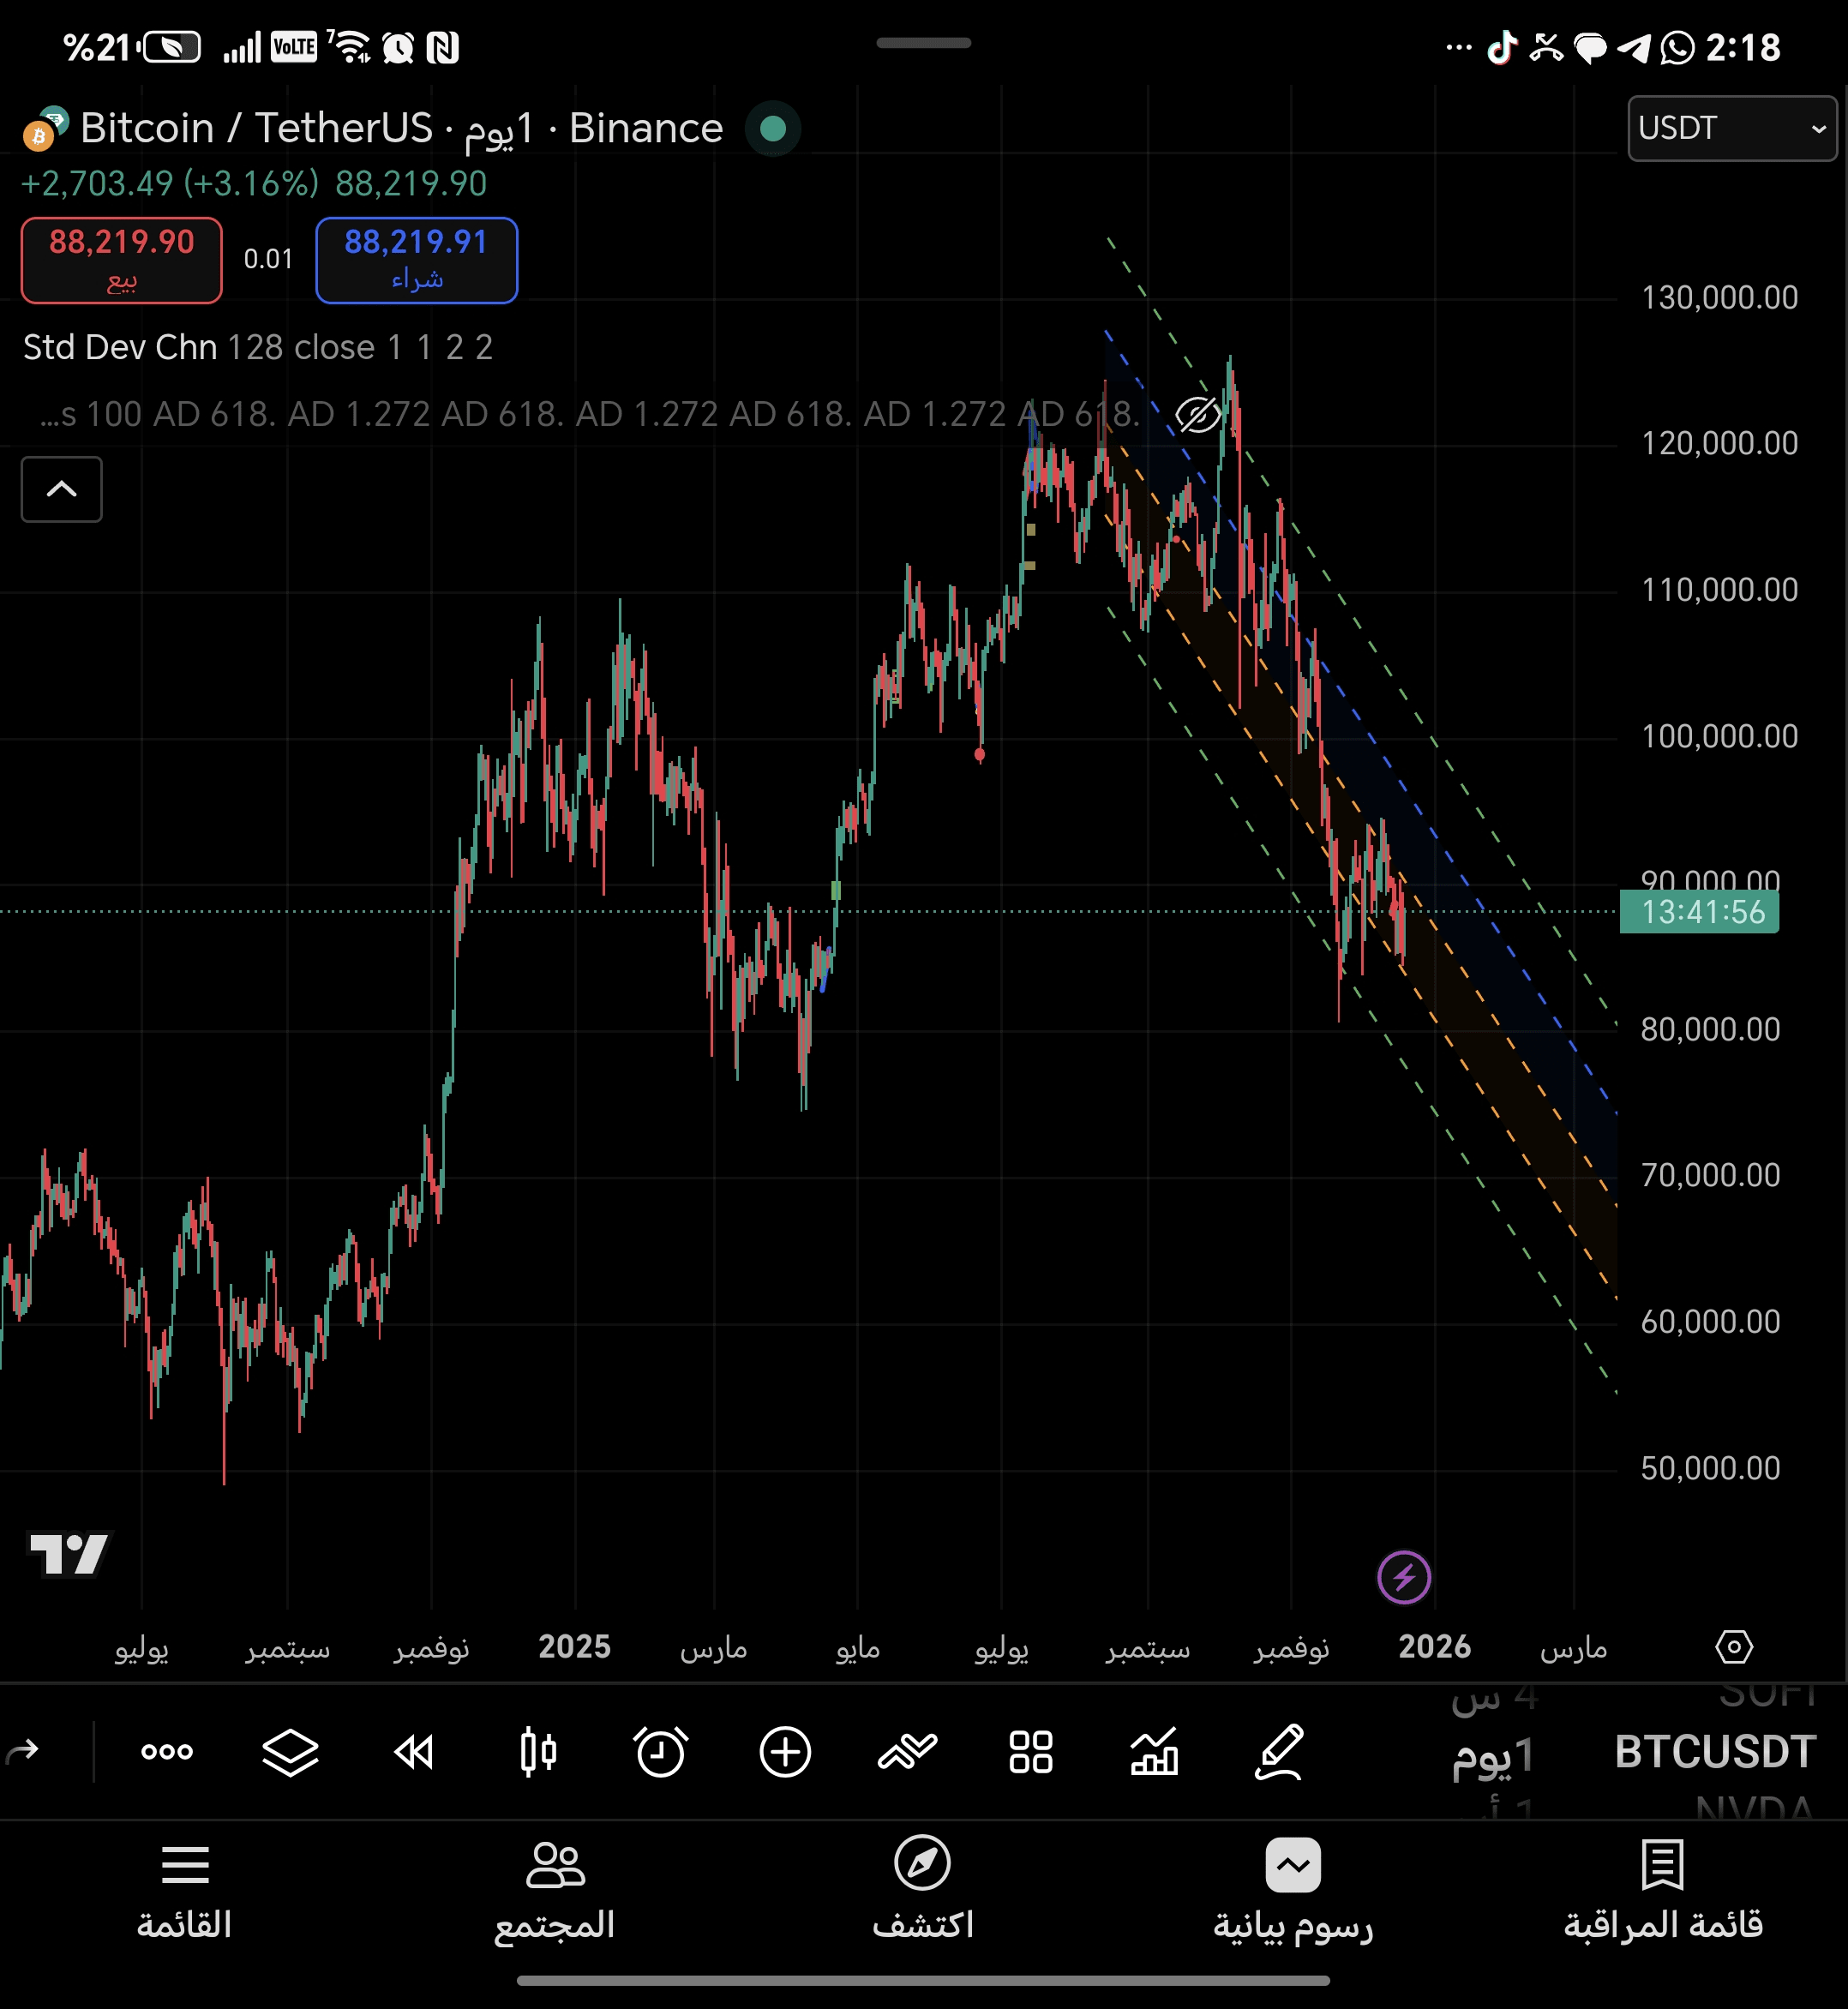
🧠 1) Structural Behavior – Wyckoff (Multi-Frame)
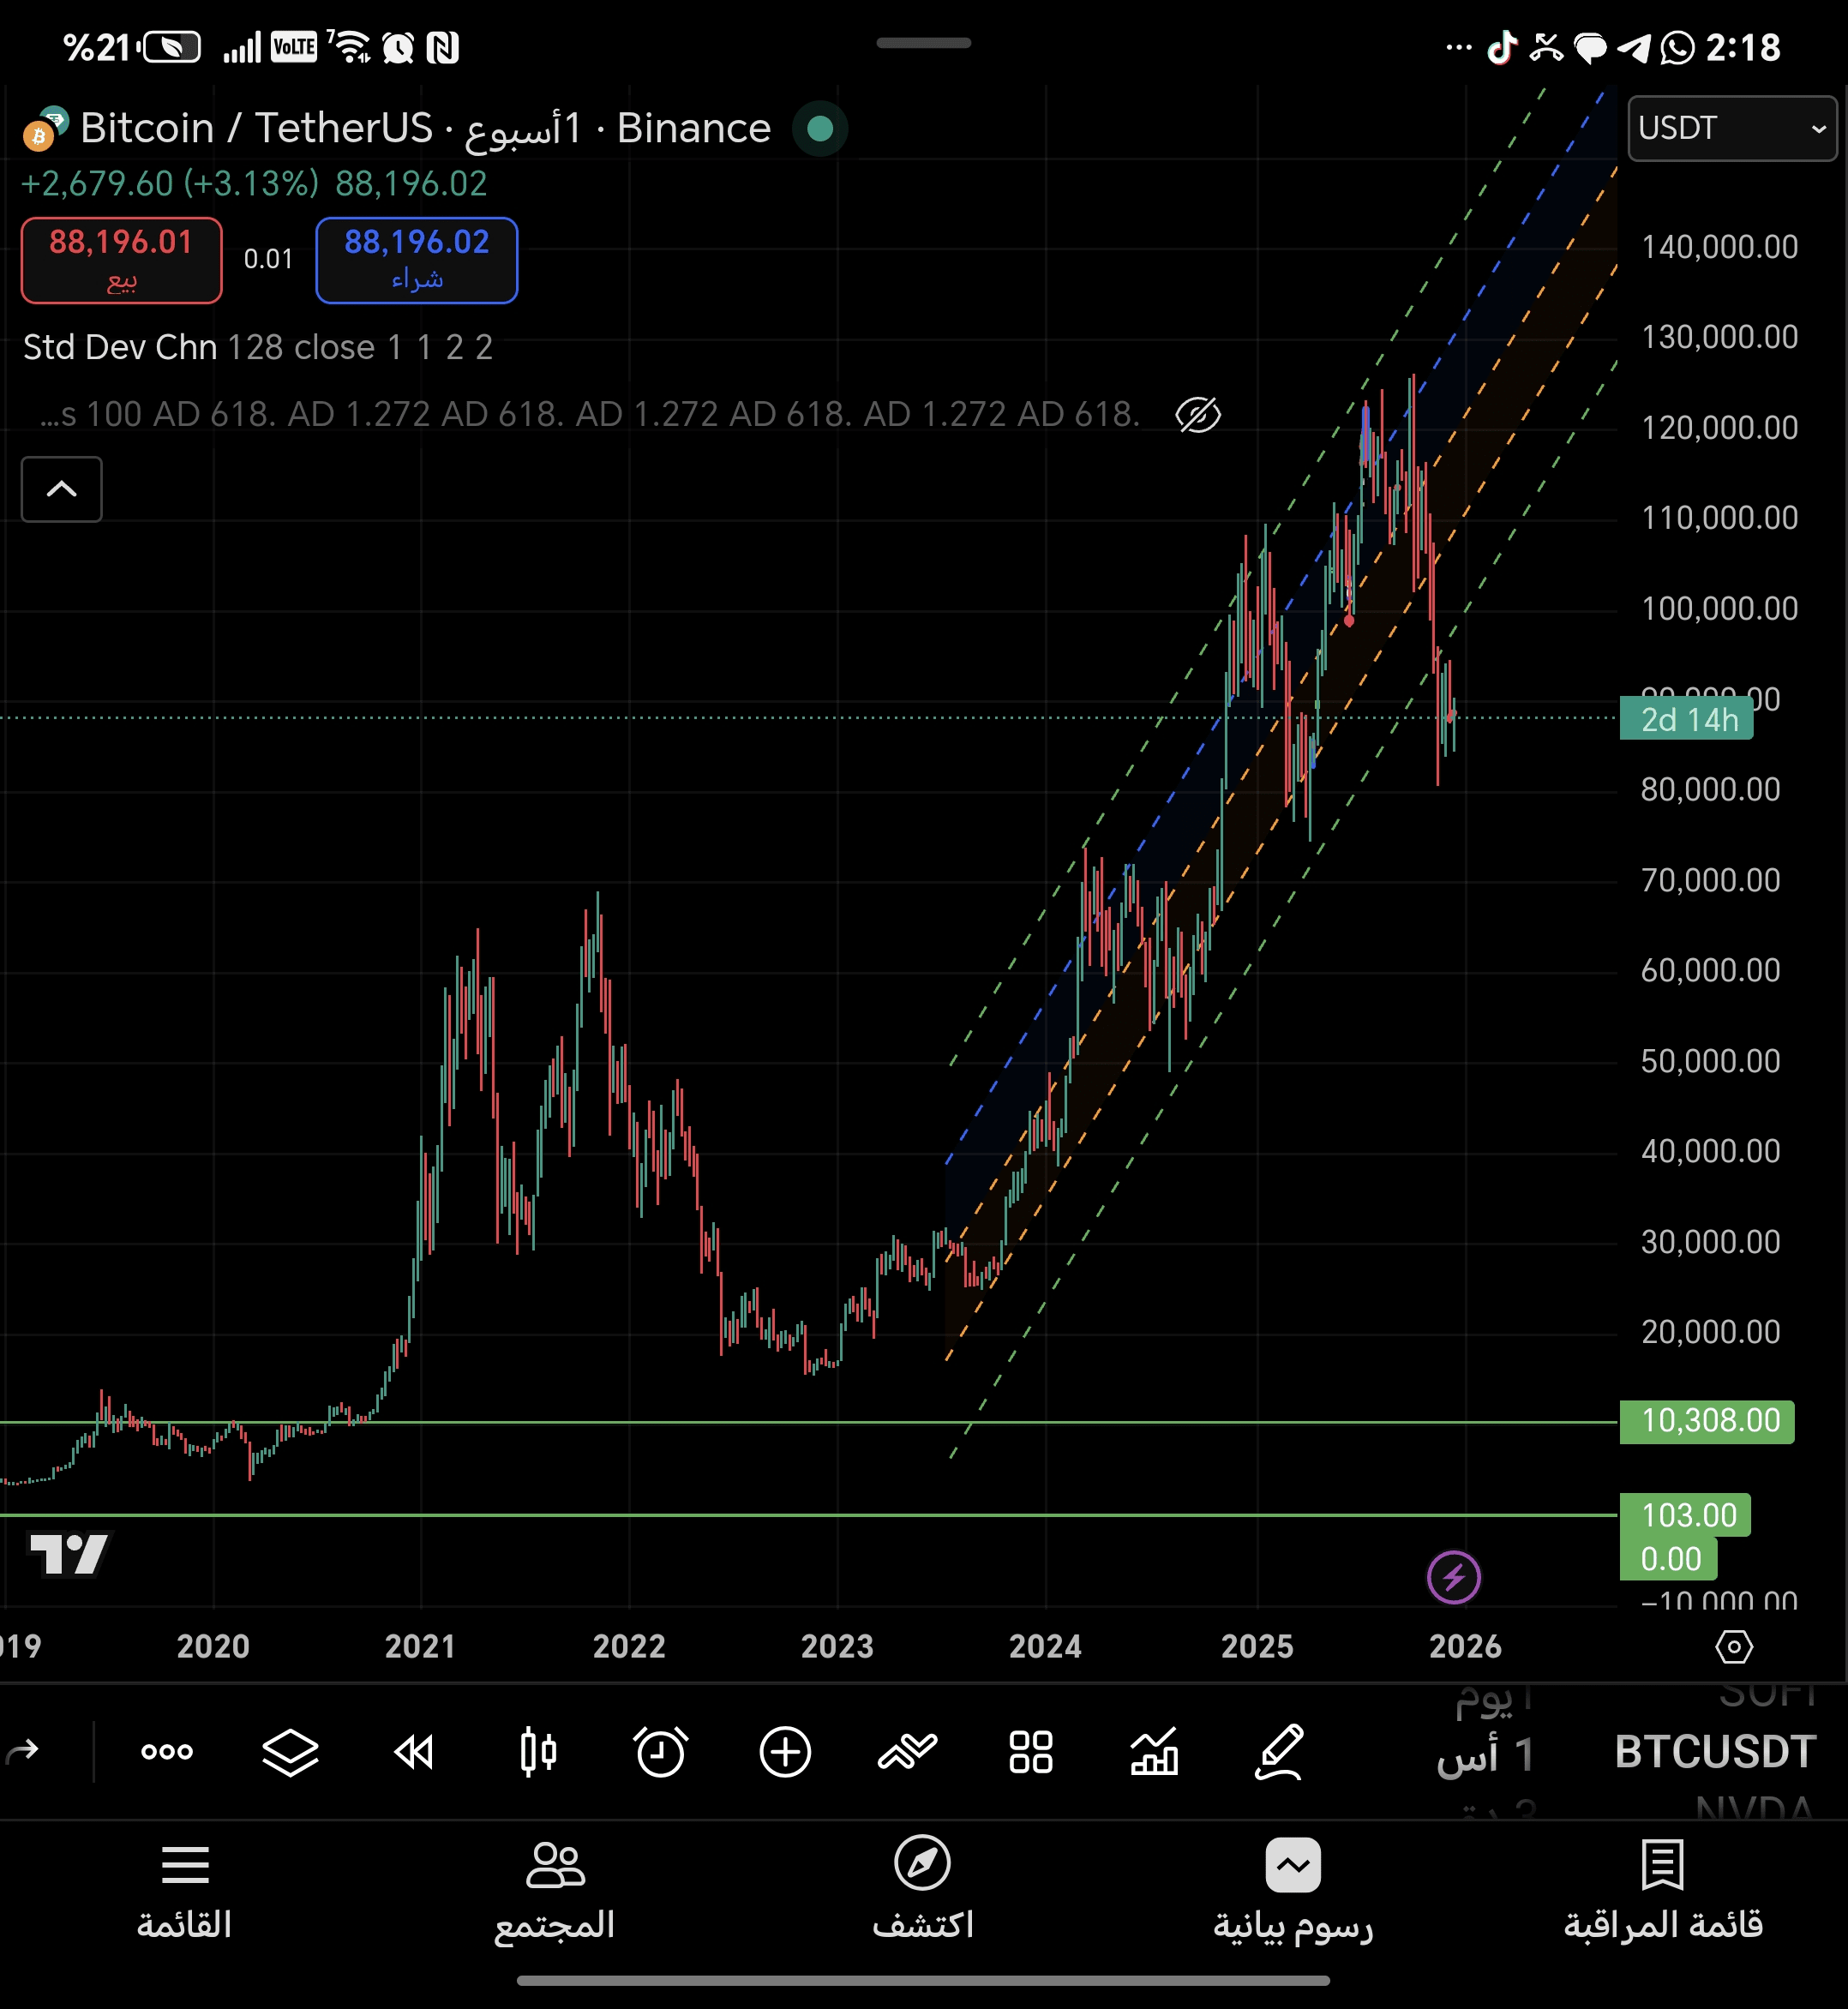
📌 A) Weekly (Major Trend)
The historical peak at ~125,000 was a clear Buying Climax (BC).
The price failed to stay above 120K several times = Upthrust / UTAD Failure.
Breaking Mid-Channel Regression (half of the rising channel) = structural shift.
Judgment:
📉 We are entering Phase D / Phase E of Markdown
= Usually a long down phase before entering the correct accumulation.
📌 B) Daily (Down Structure)
Price:
Lower Highs
Lower Lows
Breaking psychological support levels (90K – 92K – 95K)
Weak volume rebounds (Weak Demand)
These are all features of a downward oscillating authority, with no institutional buying liquidity.
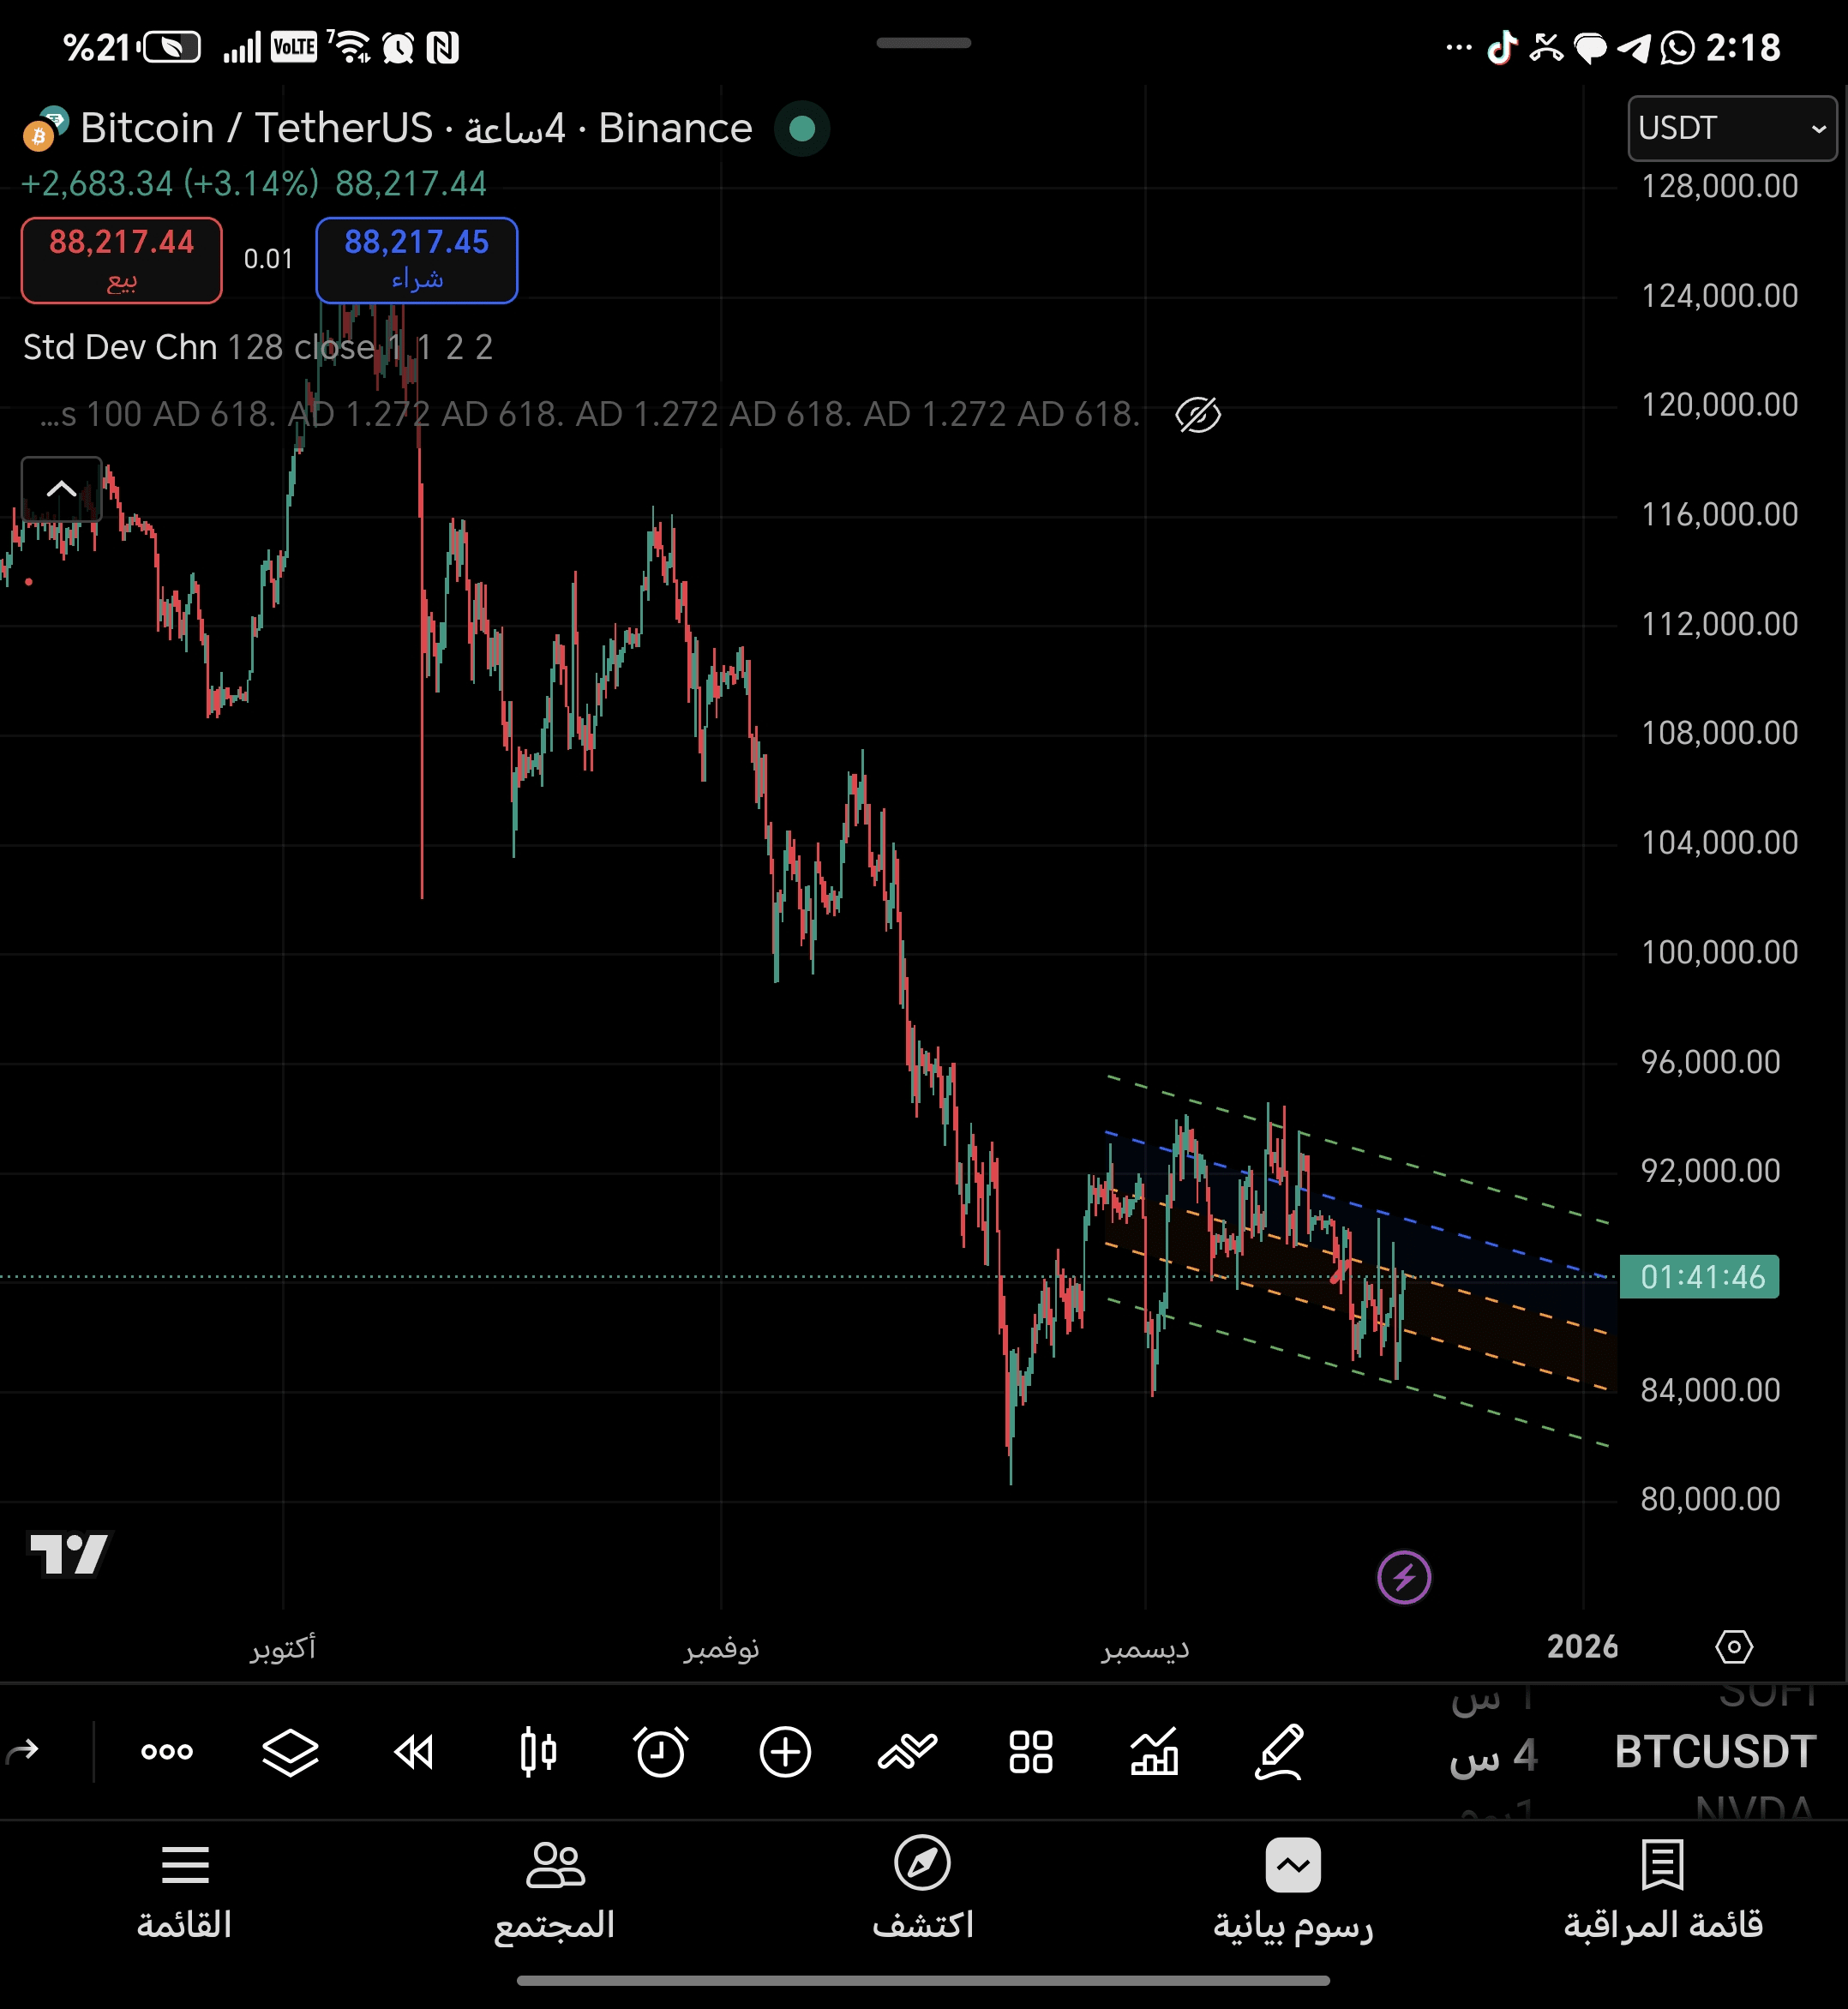
📌 C) 4 Hours (Execution details)
Bitcoin in a narrow descending channel (downward sloping canal)
Current scenario on 4H:
Sideways Selling Zone
No True Bullish Break
Retest at Resistance → Rejection
Continuation of Down-Channel
👉 This pattern indicates temporary downward targets before any real reversal.
📊 2) Support and Resistance Levels – Price Action
⚠️ Forbidden resistance areas for the stability of the upward trend:
📌 95,000 – 92,000 – 90,000 turned from support to resistance
= Demand → Supply Flip
This indicates that those who were buying above it have unloaded liquidity.
🟢 Important support levels:
🔹 88,000 – 84,000
Lower Channel Test Area
And not a final bottom
🔹 80,000
Gateway to a major drop
🔹 72,000 – 75,000
An area where Smart Money is expected to enter the real accumulation
🔹 65,000 – 68,000
Deeper transaction level area
(The expected bottom if Compression ended)
📈 3) Institutional cases for the trend:
✅ Bullish Confirmation
Daily close above 95K
Weekly close above 100K
Volume Uptrend + RSI Breakout
➡️ This means the possibility of the end of the downward phase and a new beginning.
❌ Bearish Continuation
Break 84,000
High selling liquidity
RSI below 40 on Daily
➡️ Opens the door towards 72K → 68K
🌍 4) Global News and the Macro Drivers
📌 A) Year-end Season – Rebalancing / Tax Harvesting
Year-end often: ✔ Institutions close profitable positions
✔ Extract profits from highly volatile assets
✔ Reduces risks in balance sheets
This explains Phase Distribution Late 2025.
📌 B) Interest Data and Liquidity Environment
If inflation data: 📈 Stronger than expected / Monetary tightening
→ Pressing more on high-risk assets
If inflation drops: 📉 It may be negative growth support
→ Liquidity entering assets again
📉 5) Market Derivatives – Funding / OI / Liquidations
🔻 Funding Rate
Negative Funding in most sessions = Short Bias is dominant
= Indicates Weak Demand from Bulls
🔻 Open Interest
Decrease in OI after 92K
= Indicates Exhaustion of Buyers
🔻 Liquidation Pools
Areas that gather selling liquidity: ✔ Below 88K
✔ Below 84K
✔ At stations 80K / 75K
These are strong support break areas that derivatives often target.
🧨 The complete summary and recommendation
📍 Current situation
🔸 BTC in Phase Markdown confirmed 🔸 Has not yet entered real Accumulation 🔸 Markets waiting for Selling Climax 🔸 Liquidity has not yet entered 🔸 The decline is not a general collapse, but a severe correction
📈 What are we watching to change the expectation?
| Positive |
✔ Daily close above 95,000 ✔ Volume rising with RSI Break ✔ OI increasing as prices rise
→ Then we can say:
Shift into Accumulation Phase B
📉 What are we watching for the continuation of the decline?
| Negative |
✔ Break below 84,000 with liquidity
✔ RSI stabilizes below 40
✔ Funding Rate continues to be negative
→ And downward targets: 🎯 82K → 75K → 68K
💡 The executive plan according to your goal
🟢 For long-term investors
DCA at: 🟠 88–84K
🟡 80–75K
🔵 72–68K
🟣 65–60K
Stop loss only at breaking 60K
(Then follow up with re-evaluation)
🔥 For traders / Swing
Entry positions: 📍 88–84K
📍 Retrace Test
📍 Reject Zone -> Sell
Exit areas: 📌 92–95K (Negative Market)
🧠 The most powerful phrase summarizing the analysis:
⚠️ As long as we are below 95K, Bitcoin is in a weak market;
The decline has an advantage ⚠️
Do not jump to buy now if you are looking for a reversal,
But wait for the liquidity that builds a real base before the trend turns.
\u003cc-164/\u003e
\u003ct-327/\u003e
\u003ct-348/\u003e