💡 What the words and the indicator mean in short:
The NVT Golden Cross indicator measures the relationship between the network value (Network Value) and the transaction volume on the blockchain (Transaction Volume).
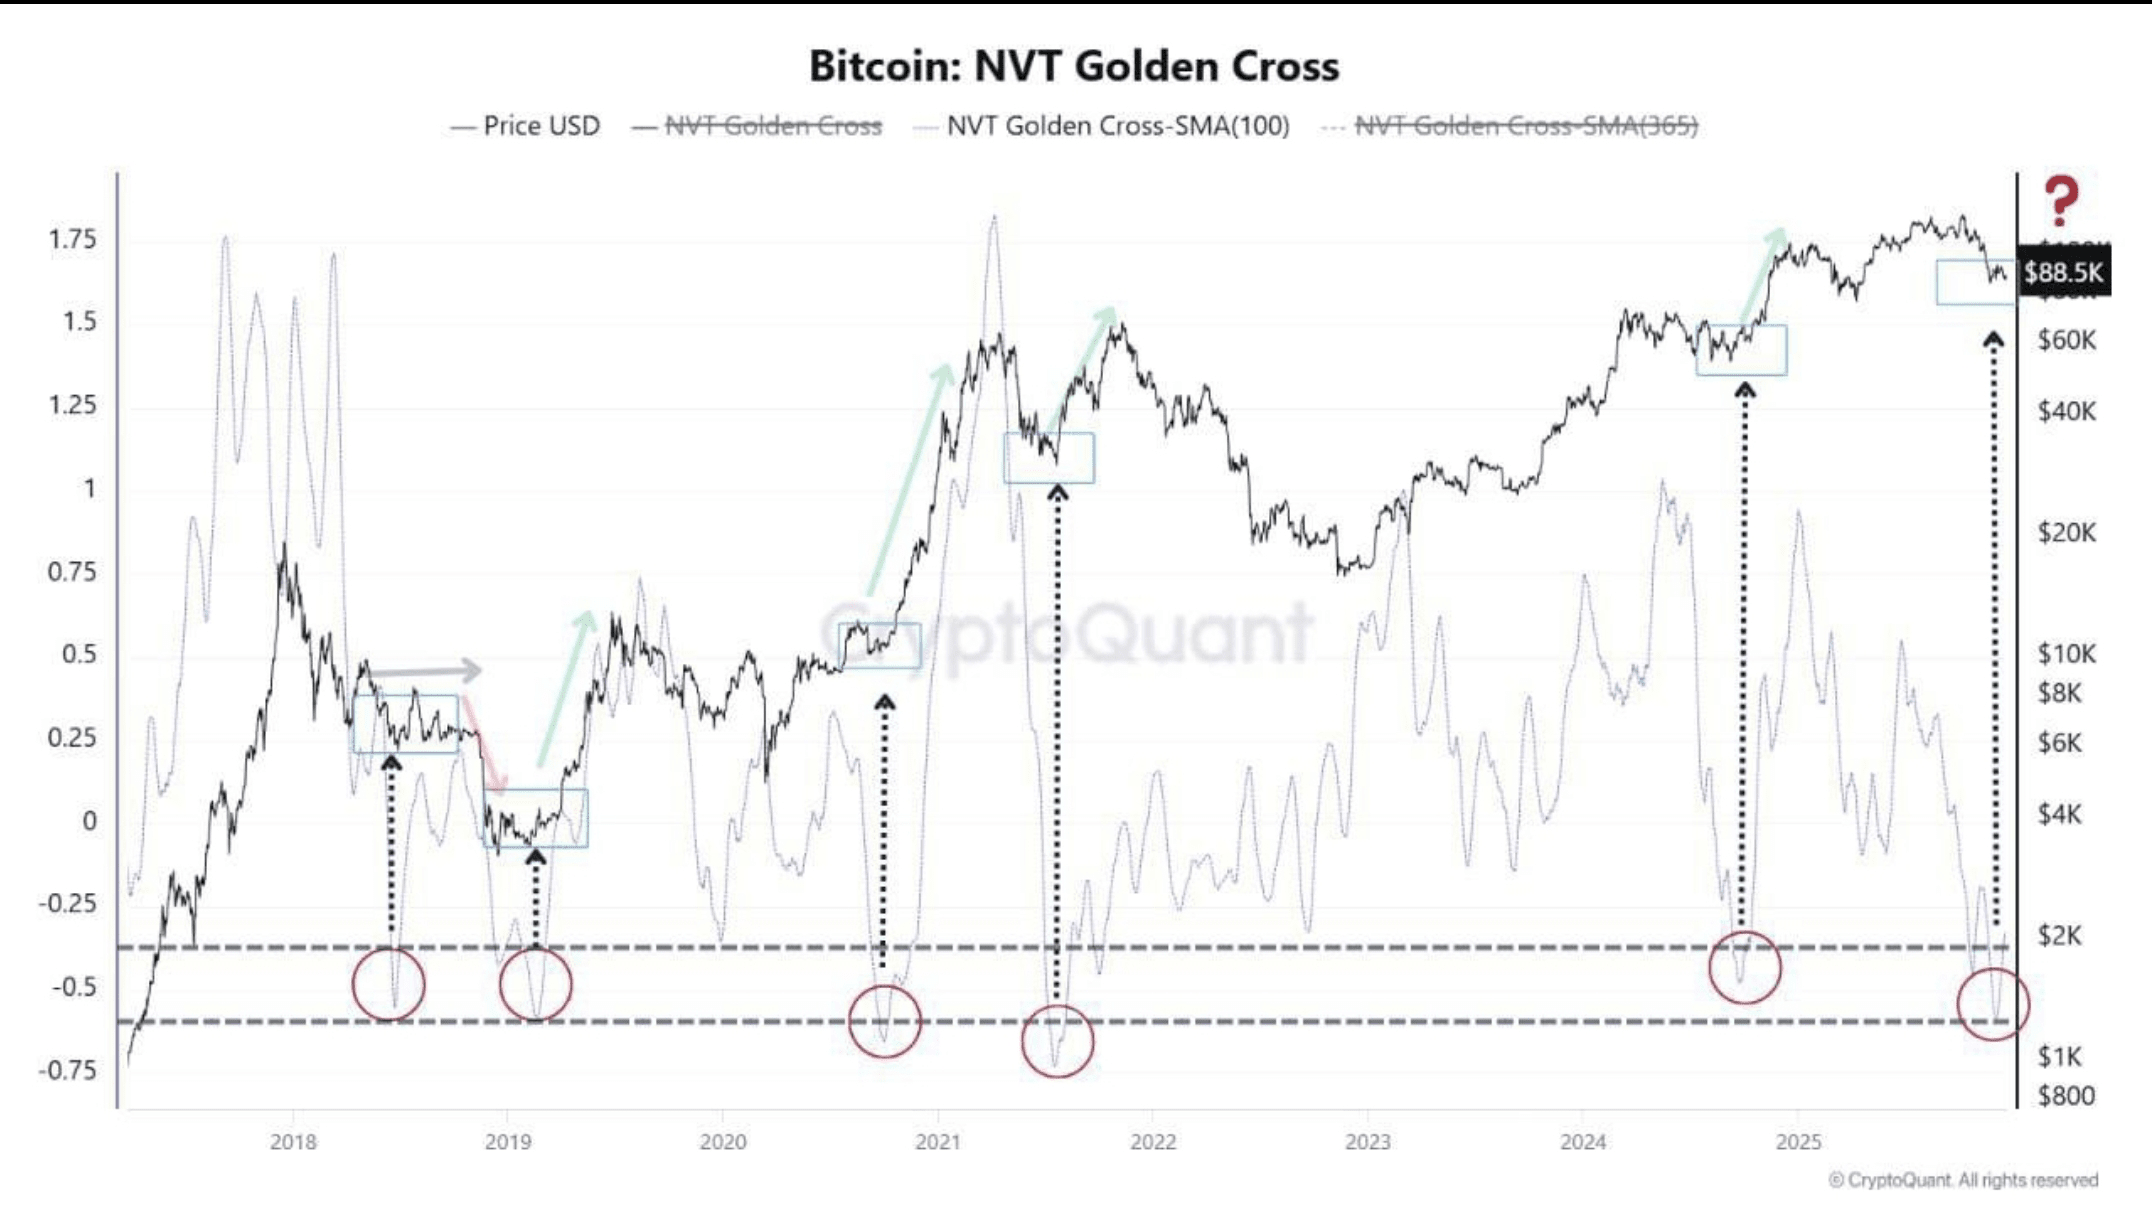
When the indicator drops significantly below zero or into the negative zone — this means: the price has become low compared to the actual activity on the network → Oversold.
Now the indicator has started to rise again from the negative zone → Signal of the beginning of a bullish wave.
📈 What does the chart show?
Each red circle at the bottom = a strong upward bottom for Bitcoin (2018 – 2019 – 2020 – 2022 – 2023 – 2025)
After every bottom: 🚀 a strong rise follows
Sometimes ×2 or ×3 or more
🟢 Investment message: The same pattern is repeating now:
Bitcoin was oversold
Network activity is strong
The price is below the "fair value on the network"
The market is in an accumulation phase → potential golden bottom
⚠️ Professional alert:
NVT does not accurately determine entry timing
But it is excellent at identifying Macro Bottom cycles
The strongest when combined with ETF flows and American liquidity
🎯 Executive summary: The market gives a long-term bottom signal and the current price tends to gradually rise towards new peaks instead of collapsing.