

Market Structure Overview
Overall Bias: Bullish continuation after pullback
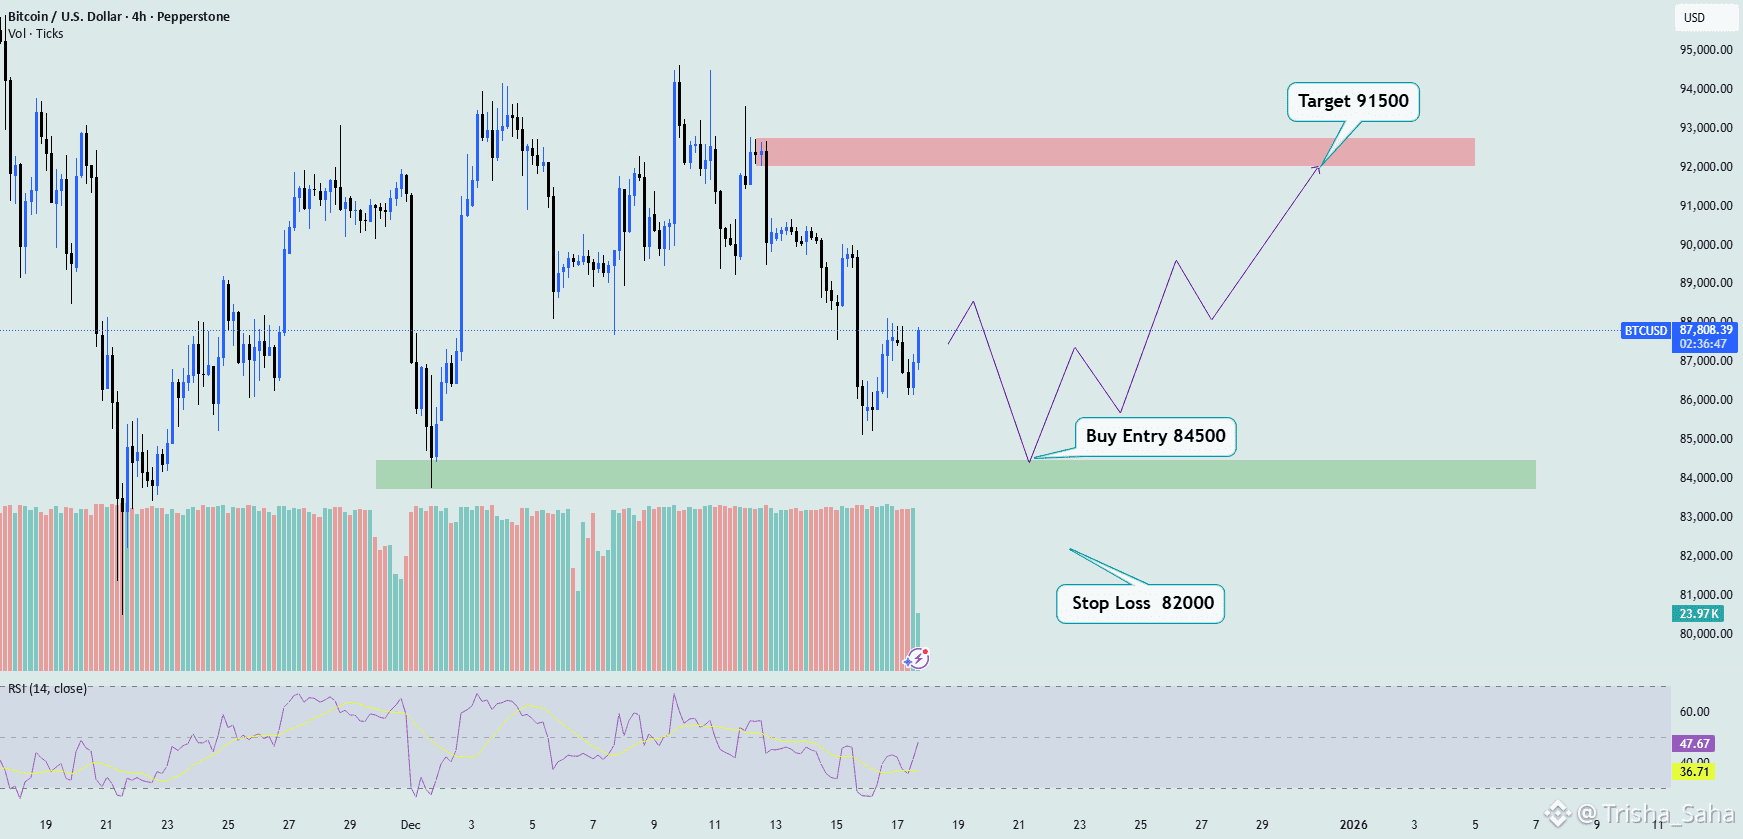
Trend Context: Price previously made higher highs, then corrected into a strong demand / liquidity zone
Current Price Area: ~87,700
Key Zones Identified:
🟢 Demand / Buy Zone: 84,000 – 85,000
🔴 Supply / Resistance Zone: 91,500 – 92,500
🧠 Reasons for This Trade (Why Buy?)
Liquidity Grab Completed
Price swept sell-side liquidity below recent lows and reacted strongly upward.
This often indicates smart money accumulation.
Strong Demand Zone
Green zone (around 84,500) previously caused a strong bullish move.
Price is expected to revisit this zone before continuation.
Market Structure Shift (MSS)
After the drop, price formed higher lows on lower timeframe → sign of bullish shift.
RSI Confirmation
RSI near oversold region and starting to curl up → bullish momentum building.
Volume Support
Increased volume near the lows shows buyer interest.
🟢 Trade Setup (Buy Setup)
✅ Buy Entry
Buy Limit: 84,500
(Entry inside demand zone after pullback)
❌ Stop Loss
Stop Loss: 82,000
Below demand zone & liquidity low (safe invalidation level)
🎯 Targets
Target 1: 88,500 (minor resistance / partial profit)
Target 2: 90,500 (structure high)
Final Target: 91,500 (major supply zone as marked on chart)
📈 Risk–Reward
Risk: ~2,500 points
Reward: ~7,000 points
Risk–Reward Ratio: Approx 1 : 2.8 (Good setup)
