
Bitcoin (BTC) is trading near one of its most important long-term technical support levels, putting market participants on alert as downside risks build. While BTC has so far managed to hold this key “safety net,” shares of Strategy have already broken below the same level, flashing a cautionary signal for bulls.
Bitcoin Hovers Near 100-Week Moving Average
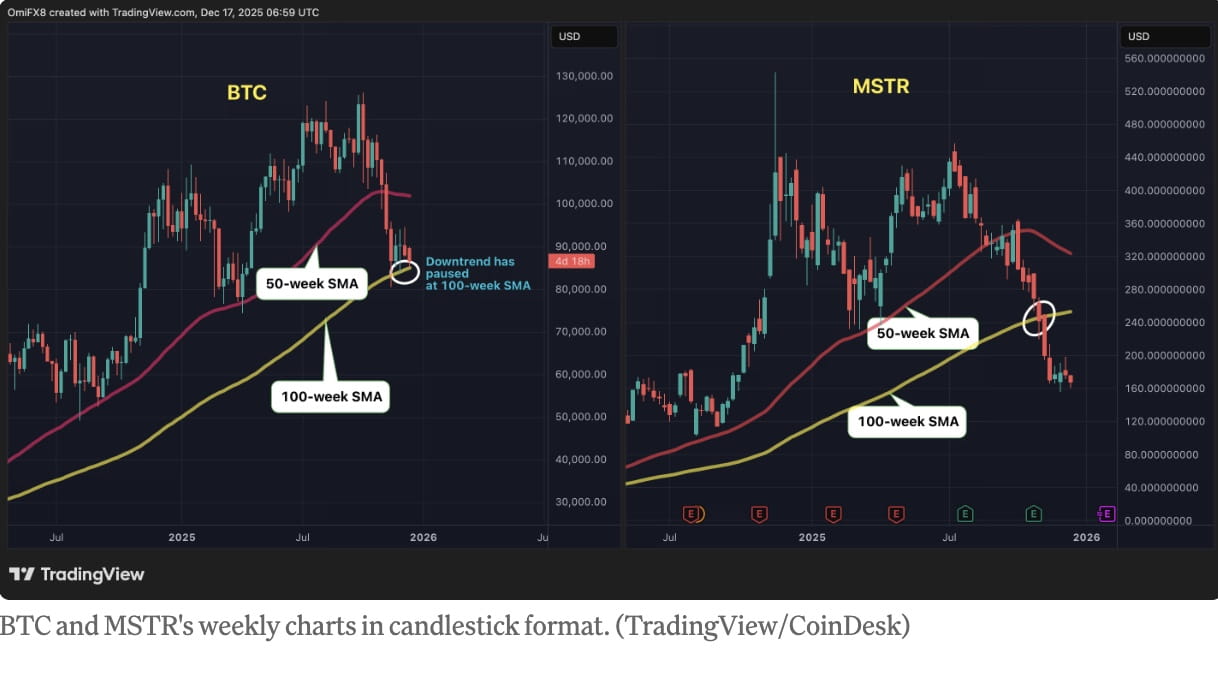
At press time, Bitcoin (BTC) is trading around $86,300, hovering just above the 100-week simple moving average (SMA) — a widely followed indicator that reflects the average price over roughly two years.
This long-term moving average has acted as support for the past three weeks, temporarily halting Bitcoin’s decline from record highs above $126,000. Technical analysts often view the 100-week SMA as a dividing line between broader bull and bear market phases.
As long as BTC remains above this level, bulls can argue that the market is stabilizing and potentially forming a base. A sustained bounce from the 100-week SMA could reinforce the view that Bitcoin is undergoing a healthy correction rather than entering a deeper downtrend.
Strategy Shares Already Broke Below the Same “Safety Net”
However, the situation becomes more concerning when looking at Strategy (MSTR) stock performance.
In early November, MSTR fell decisively below its own 100-week SMA — a breakdown that preceded a sharp extension of losses. The stock dropped to around $220 at the time of the breach and has since continued lower, trading near $160 and marking a decline of more than 60% from its year-to-date high of $457.
This divergence matters because Strategy has historically acted as a leveraged proxy for Bitcoin. In previous cycles, MSTR often led BTC both higher and lower, particularly when long-term technical levels were breached.
Earlier this year, MSTR also broke below its 50-week SMA ahead of Bitcoin, a move that was later followed by weakness in BTC itself. That historical pattern is now raising concerns that Bitcoin could still be vulnerable if its own 100-week support fails.
Why the 100-Week SMA Is So Important for Bitcoin Bulls
The 100-week SMA is not just another technical line — it represents a psychological and structural level watched by long-term investors, funds, and systematic traders.
Holding above it suggests long-term demand remains intact.
Breaking below it can trigger forced selling, trend-following exits, and renewed bearish momentum.
If Bitcoin loses this support, analysts warn that downside could accelerate as confidence erodes and sellers regain control — potentially mirroring the path already taken by Strategy shares.
Conversely, if BTC successfully defends the level, it could act as a “trampoline,” setting the stage for a relief rally and restoring short-term bullish confidence.
Key Levels to Watch
Support: 100-week SMA (current zone)
Downside risk: Loss of this level could open the door to deeper declines
Bullish confirmation: A sustained bounce and reclaim of higher resistance would ease pressure

