
Checkonchain: a repeated break of BTC $81,000 will open the way to $75,000.
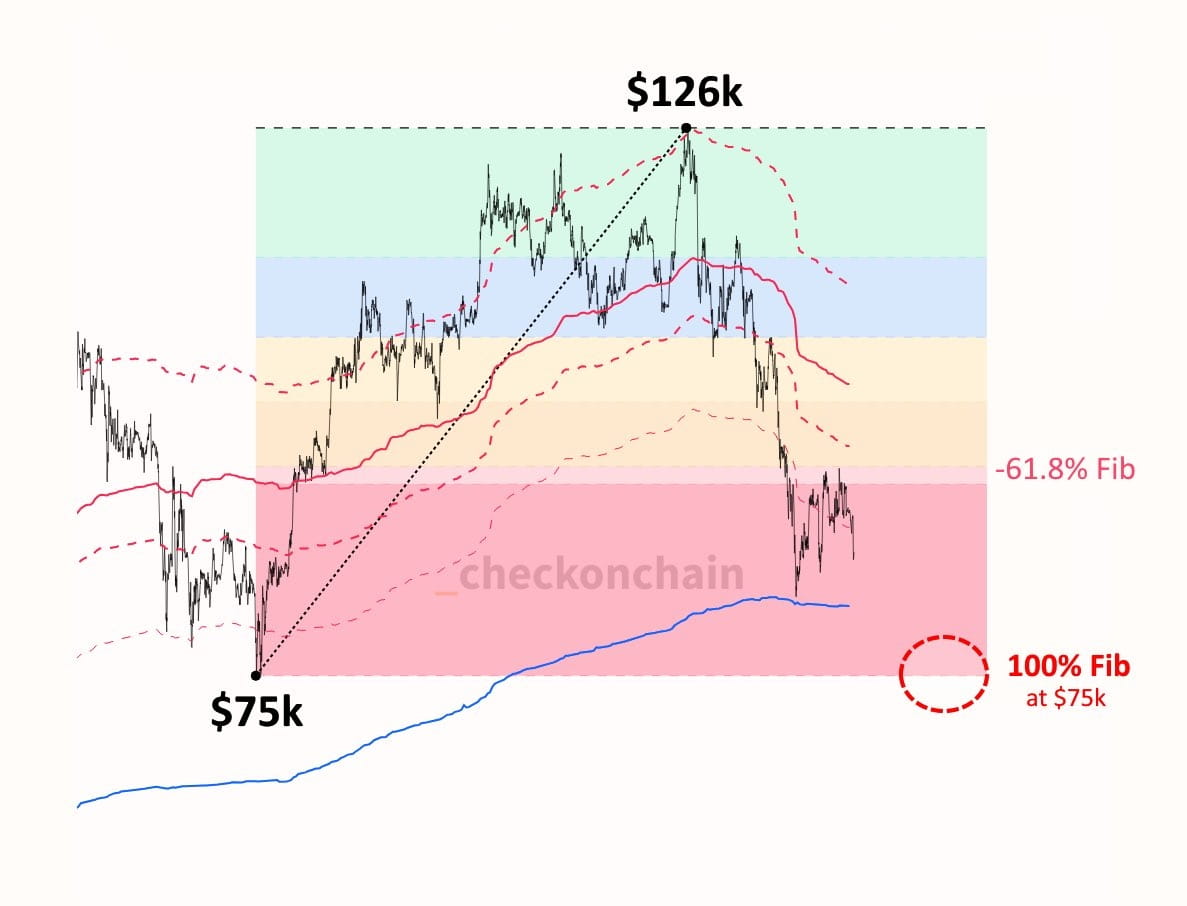
Analysts #Checkonchain note - if #BTC breaks the true average market price around $81,000, the focus will quickly shift to a full Fibonacci correction from the impulse that began after the lows during Trump's tariffs. The level of $75,000 is marked as the baseline for the entire movement, from which the rise to the highs around $126,000 began.
Interestingly, the current structure looks almost instructional. The correction has already reached the 0.618 zone according to Fibonacci. Now either the market holds the average levels or goes for a complete closure of the impulse.
On the chart, this looks extremely clear:
- Minimum impulse - about 75,000$
- Maximum movement - about 126,000$
- Key control level - 81,000$
- Potential full correction - around 75,000$
If you add from yourself, then all this story is not about panic and not about collapse. It's about market symmetry. BTC really loves to completely close such movements, especially after overheated phases. There is no magic here, only statistics. Although Fibonacci sequences, of course, look beautiful. Sometimes even too much.
As long as #BTC holds above 81,000$ - the scenario of a deeper correction remains a hypothesis. Breaking this level makes testing 75,000$ not a scare but a quite working basic scenario. And what will happen afterwards is a good question.
