Unknowingly, I have been in the circle for over 10 years! At 38, looking back, when I first entered the cryptocurrency circle in 2015, that little bit of principal I had was still borrowed, 60,000 yuan, and I had no confidence at all.
Now the account has exceeded 8 digits. To be honest, my feelings are quite complicated. The earnings are not fast, and it's not based on luck; it's just a matter of stepping into one pit after another and reflecting on each to climb out.
I have experienced the darkest moments of life: liquidation, debt, poor eating, poor sleeping, and even standing on the rooftop contemplating ending it all. I once lost 60,000 in principal in a day, while turning 1,000 into 20 million took me a full 6 years!
Today, I am sharing my valuable experiences from these 6 years without reservation, hoping to help everyone avoid detours in the contract circle and achieve financial freedom as soon as possible.
In the cryptocurrency trading world, after several years of professional trading, I have achieved some success. Using a method tested with 500,000, I achieved 10 million in results, relying solely on the cup and handle pattern, with a winning rate of 99%, suitable for everyone! Worth a thumbs up and collection!
The cup and handle pattern has two types: one is the upright cup and handle pattern, and the other is the inverted cup and handle pattern.
In my view, the bullish cup and handle pattern can serve as both a continuation pattern and a reversal pattern. Because the cup and handle pattern is expected to be bullish, we also call the cup and handle pattern a bullish cup and handle.
This means that if it forms in an uptrend, then this pattern indicates a continuation of the bullish trend.
Similarly, if it forms in a downtrend, then this pattern will indicate a bullish reversal.
So it does not matter where this pattern forms; what matters is that the bullish cup and handle is expected to bring a bullish breakout market. Next, let’s delve into more details.
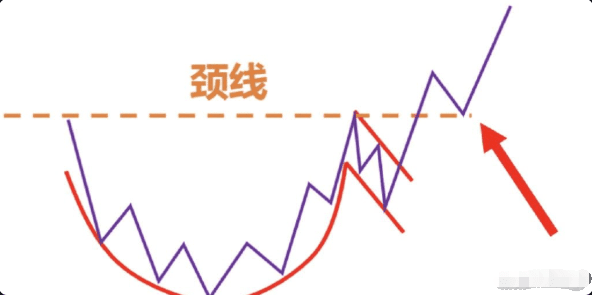
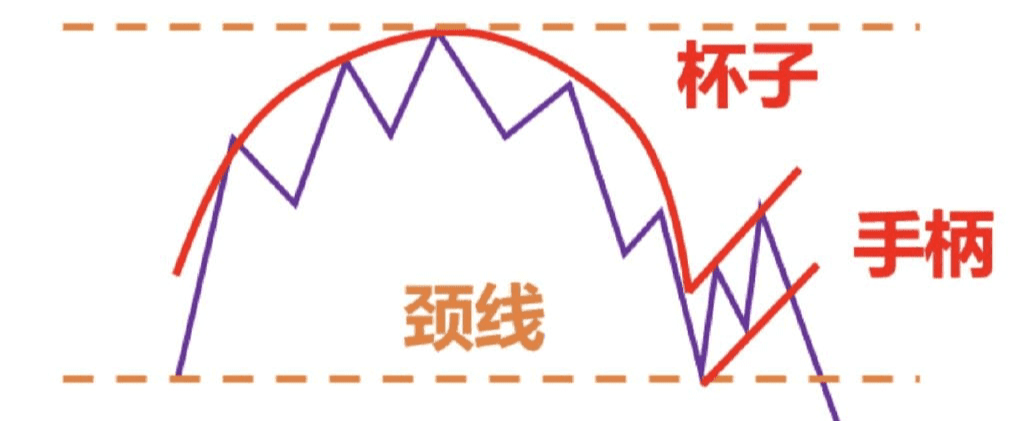
The bullish cup and handle consists of two parts. As the name implies, it is the cup and the handle, with the neckline acting as a resistance level.
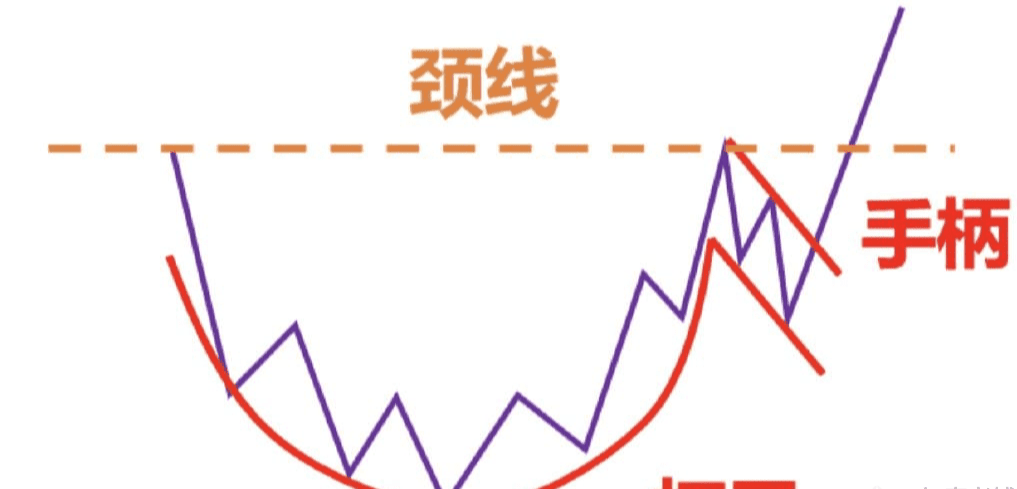
The cup shape forms after the price goes bearish, followed by a consolidation period where the candlesticks become smaller or weaker, indicating signs of the market bottoming.
Afterwards, the price rises toward the resistance level, indicating that bulls are gradually taking over the bear market.
Now, it looks like a ball or a round-bottom object. If you pay attention to the volume at this time, you will find that the closer you are to the cup shape, the volume should continue to increase, indicating increased buying pressure.
The price reaction at the resistance level is very important as it tells you whether there are still selling pressures at that level.
If there is a large sell-off at the resistance level, the bullish cup and handle will fail. Because it tells you there is still selling pressure, the market is not ready to go higher.
But if you notice that the price maintains well near the resistance position, it indicates that buyers are willing to buy at higher prices. Therefore, the handle must form a tight consolidation or accumulation below the resistance level.
At this time, many traders will trade according to the methods they learned from some trading books, which is to short when the price is at resistance.
If the price shows strong momentum when entering the resistance level but is strongly rejected at the resistance level or forms a false breakout upwards, then it's not an issue.
However, if the price approaches resistance and forms an uptrend, or even makes a higher low when entering resistance, then you need to be very careful.
This is a strong signal; it tells you that buyers are willing to buy at these higher prices.
You'd better not short the market because it is likely to break higher.
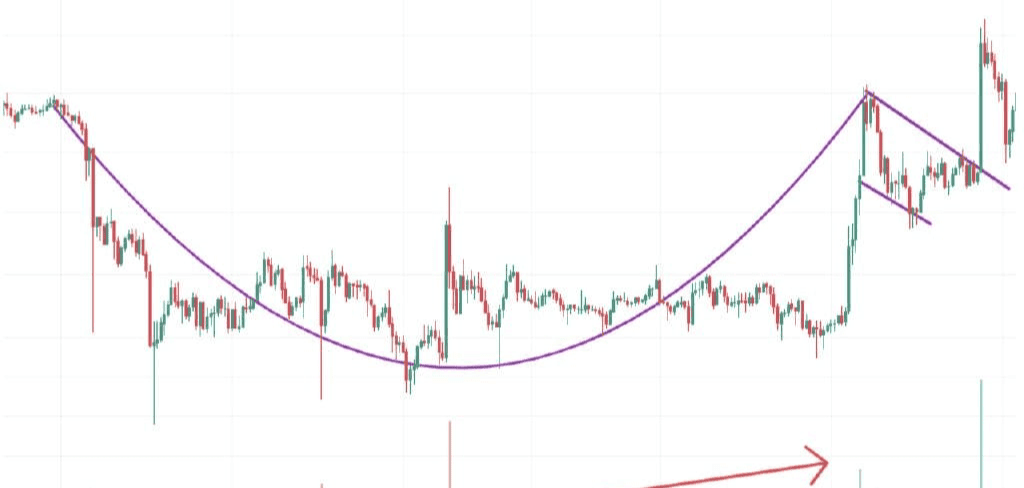
Therefore, there will be tight consolidation near resistance levels; this is the shape of the handle, which could be a bull flag, a bull triangle flag, or a descending wedge.
But regardless of which type, the following market trend is likely to be bullish.
At the same time, during the consolidation period, the volume should decrease, indicating a lack of selling pressure.
There is a very important point here: the handle must be smaller than the cup, and the distance from the neckline to the bottom of the handle cannot be greater than half the distance from the neckline to the bottom of the cup, which is H1<H2/2.
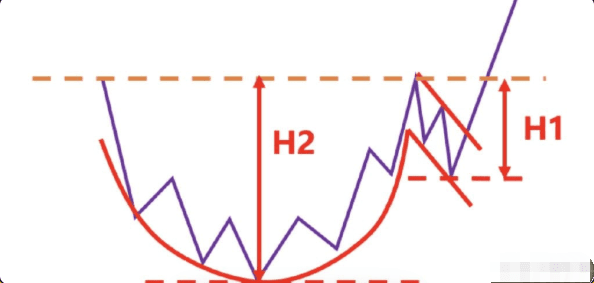
Ideally, it should be maintained in the upper third of the cup shape. You may notice that this is actually the moderate retracement area of Fibonacci, and the subsequent probability of a bullish trend is higher.
If the bottom of the handle moves down deeper, the likelihood of the market breaking up decreases.
Generally, regardless of what pattern precedes the bullish cup and handle, as long as the bullish cup and handle pattern appears, we believe its subsequent market trend will be upward.
So we are only interested in breaking the neckline, so the entry methods for the bullish cup and handle can be divided into the following 3 types.
Enter at market price after breaking the neckline.
Enter at market price after breaking the highest price of the breakout candlestick.
Enter at the neckline after breaking it.
First, let's look at method 1.
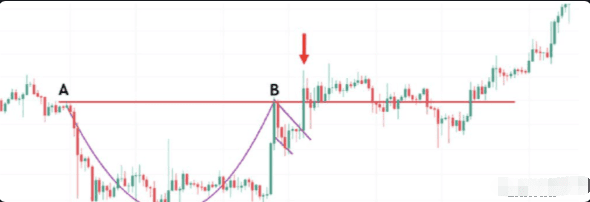
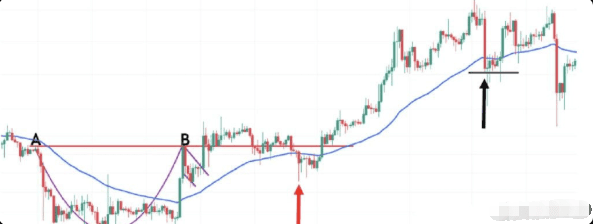
From the chart, we can see that by connecting points A and B, we can obtain a neckline. Aggressive traders will enter after the candlestick at the red arrow breaks through.
The first method is the most aggressive entry method; when the price breaks the neckline, enter at market price directly.
The advantage of this technique is that you might get the best entry price. However, the downside is that due to the resistance above, the price may reverse, resulting in a false breakout, and it may even hit your stop-loss point.
Let's look at method 2 again.
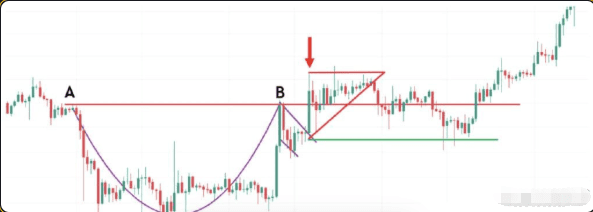
In the chart, we find the bullish candlestick that breaks the neckline. The red arrow marks the candlestick, so then draw a red horizontal line at the highest price of this candlestick, and observe the subsequent price trend.
We find that after the breakout candlestick, the price moves hesitantly, with a bunch of overlapping candlesticks, and then forms an ascending triangle pattern. We can wait for the breakout of this pattern to enter, which is also a re-entry for the bullish cup and handle. However, the market did not continue but instead retested the bottom of this ascending triangle. From the green horizontal line in the chart, we can see this.
We will continue to wait for the subsequent candlestick to break the red horizontal line before entering at market price.
So using method 2 greatly reduces the probability of false breakouts; this is the advantage of this method, reducing false breakouts.
The downside of this method is that if buyers are too strong, the closing price of the waiting bullish candlestick will be relatively high, meaning your entry price will be higher than method 1. However, compared to method 1, it is a more conservative method.
This technique teaches a small trick; if two patterns appear and they are in the same direction, then it is a good entry opportunity.
We see the position of the black circle in the chart, which serves as both a retest point of the rectangle pattern and a retest point of the descending triangle. If a bearish candlestick appears at this time, the probability of a decline will increase. This position is a good shorting opportunity.
Let’s look at method 3 again, which is after the breakout, when it retests the neckline. If a bullish signal candlestick appears near the neckline, enter at market price at the highest price of the breakout signal candlestick.
The method of waiting for a pullback to long has the advantage of low risk and high reward-to-risk ratio, but sometimes it may not give you the opportunity to pull back; the price directly breaks through and rises without looking back, leaving you anxiously watching.
After explaining the above 3 methods, I believe you will have a clearer understanding of entering the bullish cup and handle. You may be wondering which method is better. In fact, there is no best method; you need to decide your entry strategy and continuously practice it in numerous trades.
Of course, if you want to verify whether the breakout is real, you can use volume and other momentum indicators for validation.
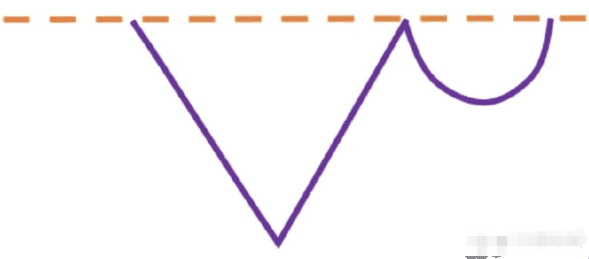
Another point to note is that we should try to participate in cup shapes with longer bottoms and more U shapes, preferably avoiding cup shapes with sharp V-shaped bottoms, as shown in Figure 3.10-8. These sharp drops and rises generally tend to lead to energy exhaustion.
Next, let’s talk about how to set stop-loss for the bullish cup and handle.
For a bullish cup and handle, if entering at the neckline using method 1, such traders generally set the stop-loss at stop-loss level 2.
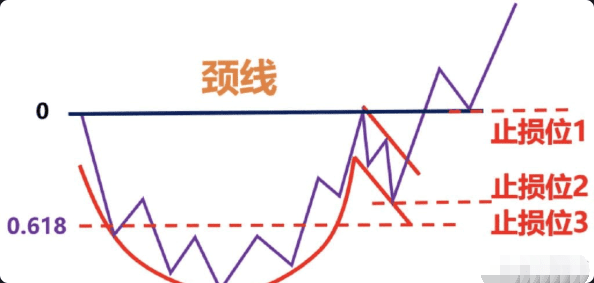
As mentioned earlier, we should not set stop-losses at obvious levels, such as support and resistance levels, swing highs or lows, etc. Because these are obvious places, you may get swept out at any time.
Therefore, the stop-loss needs to be set wide; it is generally recommended to set it at the Fibonacci 0.618 area. When the price breaks below 0.618, it is considered that the cup and handle pattern has failed.
However, if entering with methods 2 and 3, then such traders prefer to set the stop-loss at stop-loss level 1.
This position is also obvious and easy to be stopped out.
So if using method 2 or method 3, you can try setting the stop-loss at stop-loss level 2 or stop-loss level 3. When the price breaks the neckline, closely observe the price direction and be ready to manually stop loss, and do not wait until the price really drops to stop-loss level 3. If the market really gets to that point, your losses will also be significant.
Of course, you can also use the ATR indicator to set fixed stop-loss prices. These stop-loss and entry methods vary from person to person, but we must maintain consistency.
Finally, let's see how to set take-profit to maximize profits. You can use 3 methods.
Method 1: Price prediction method.
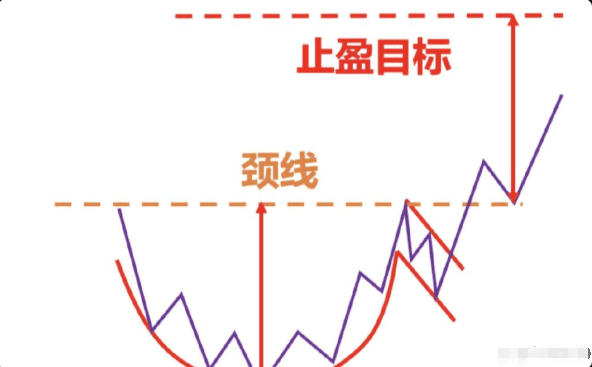
What you need to do is take the distance between the highest and lowest points of the cup and handle, which is the widest distance in the cup and handle. Then, based on the direction of the breakout, copy and paste this distance or project this distance to the breakout point.
Of course, the cup and handle can definitely break out and bring a larger market trend, so we also need method 2: trailing stop.
As mentioned many times, the trailing stop can use moving averages (MA), exponential moving averages (EMA), or trend lines and other tools to move stops, and you should exit trades only when the market closes above the tool you are using.
For example, if you are using the exponential moving average EMA50, then when the price breaks below EMA50, you should be prepared to exit.
So, after the lowest price of the candlestick indicated by the black arrow is broken, we exit the market. Although the candlestick at the red arrow also broke the EMA50, its lowest price was not broken.
At the same time, if using the method of breaking through, retesting, and then breaking through, the position of the red arrow has not entered yet.
Of course, this is just an example; whether to use MA or EMA, whether to use EMA20, EMA50, or EMA200 is up to your choice, as long as you maintain consistency.
In addition to the above two methods, there is also a third method, which combines method 1 and method 2, and works well. This way, you can use the fixed take-profit method to predict future trends in advance, lock in some profits, and then use the trailing stop method to control the remaining profits.
This is the true way to let profits run; even if there is a sudden reversal, you can still protect what you have without giving back the profits you earned.
Having finished discussing the bullish cup and handle, let's move on to discuss the bearish cup and handle, which is the inverted cup and handle pattern.
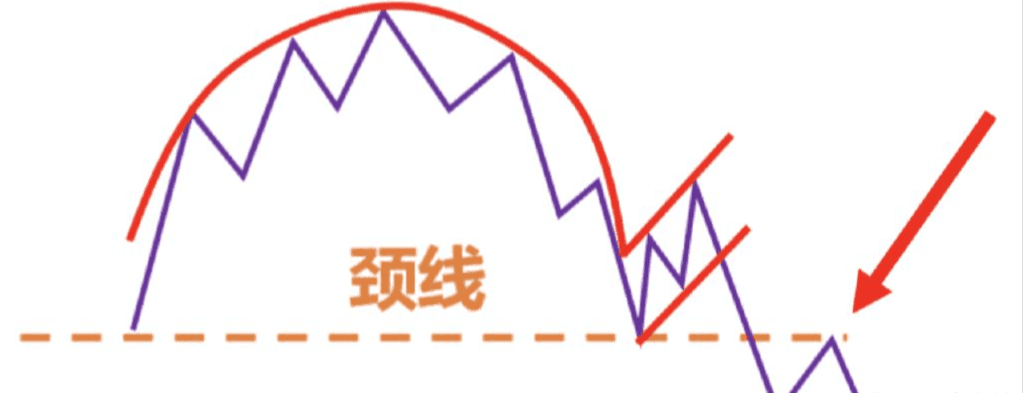
The bearish cup and handle is also composed of two parts: the cup and the handle. The neckline acts as a support level; it is actually the inverted version of the bullish cup and handle.
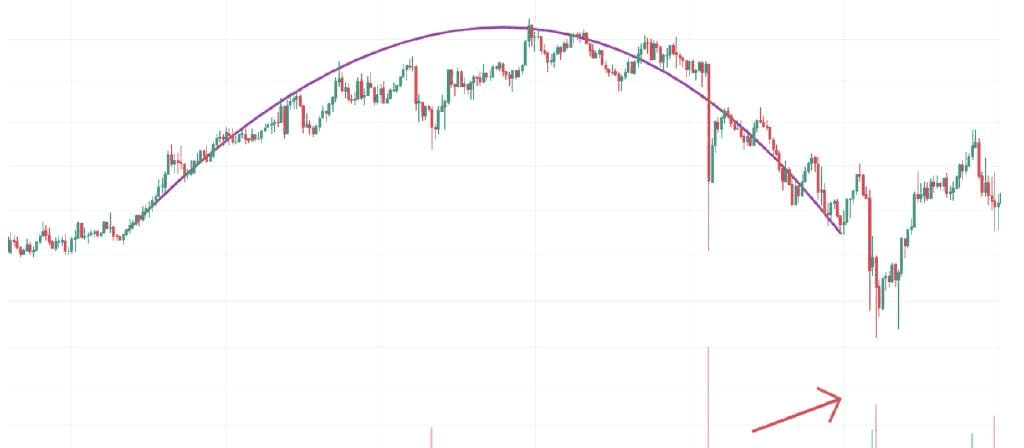
The cup shape forms after the price goes bullish, followed by a consolidation period where the candlesticks become smaller or weaker, indicating signs of the market topping. Subsequently, the price plunges toward the support level, indicating that bears are gradually taking over the bull market.
Now, it looks like a ball or a round-top object.
At this point, if you pay attention to the volume, you will find that the closer you are to the cup shape, the volume should continue to increase, indicating increased selling pressure.
The price reaction at the support level is very important as it tells you whether there are still buyers at that level.
If there is a large buying pressure at the support level, the bearish cup and handle will fail. Because it tells you there is still buying pressure, the market is not ready to go lower.
However, if you notice that the price maintains well near the support level, it indicates that sellers are willing to sell at lower prices. Therefore, the handle must form a tight consolidation or accumulation above the support level.
At this time, many traders will trade according to the methods they learned from some trading books, which is to long when the price is at support.
Especially like the above figure, there was a false breakout down to the support level, and then the price returned above the support level, at which point many people entered to long.
If the price shows strong momentum when entering the support level but is strongly rejected at the support level or forms a false breakdown downwards, then it's not an issue.
However, if the price approaches the support level and forms a downtrend, or even makes a lower high when entering the support level, then you need to be very careful.
Because this is a strong signal, it tells you that sellers are willing to sell at these lower prices. You'd better not long the market because it is likely to break lower.
Therefore, there will be tight consolidation near support levels; this is the shape of the handle, which could be a bear flag, a bear triangle flag, or an ascending wedge. But regardless of which type, the following market trend is likely to be bearish.
There is a very important point here, just like the bullish cup and handle, the handle must be smaller than the cup, and the distance from the neckline to the bottom of the handle cannot be greater than half the distance from the neckline to the bottom of the cup, which is H1<H2/2, as shown in Figure 3.10-14.
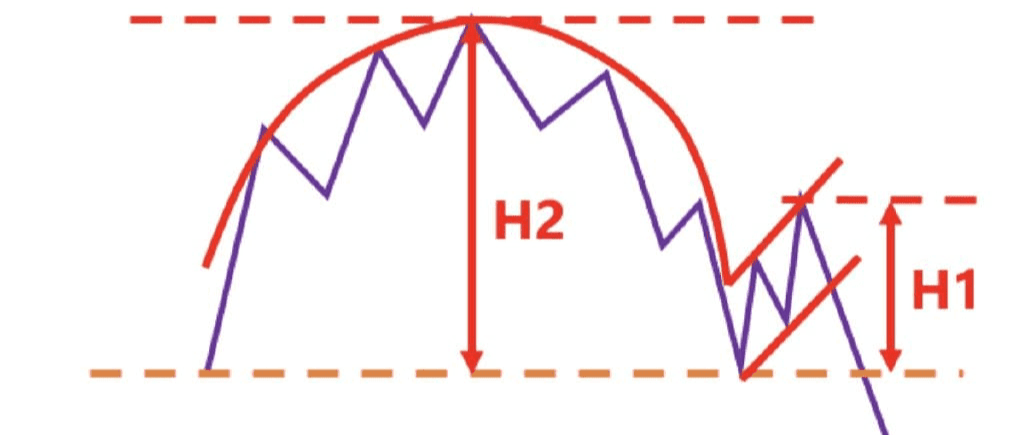
Ideally, it should be maintained in the lower third of the cup shape. You may notice that this is actually the moderate retracement area of Fibonacci, and the subsequent probability of a bearish trend is higher.
If the bottom of the handle moves up deeper, the likelihood of the market breaking down decreases.
Generally, regardless of what pattern precedes the bearish cup and handle, as long as the bearish cup and handle pattern appears, we believe its subsequent market trend will be downward.
So we are only interested in breaking the neckline, so the entry methods for the bearish cup and handle can be divided into the following 3 types.
Enter at market price after breaking the neckline.
Enter at market price after breaking the lowest price of the bearish candlestick.
Enter at the neckline after breaking it.
First, let’s look at method 1.
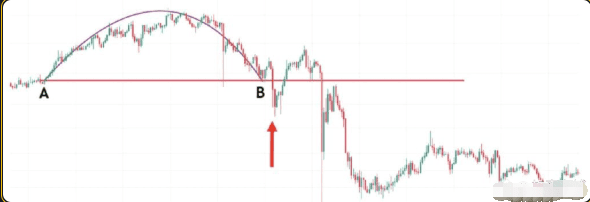
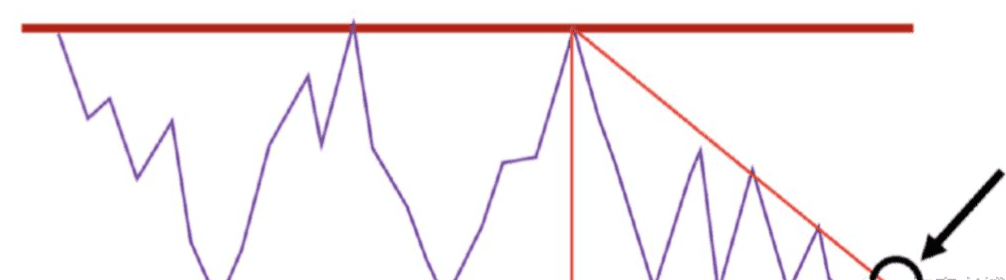
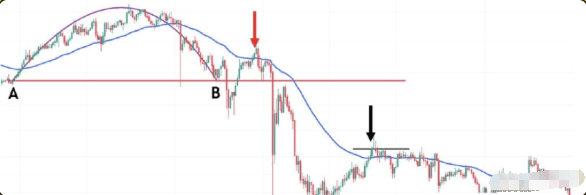
From the chart, we can see that by connecting points A and B, we can obtain a neckline. Aggressive traders will enter after the candlestick at the red arrow breaks down.
The first method is the most aggressive entry method; when the price breaks the neckline, enter at market price directly.
The advantage of this technique is that you might get the best entry price. However, the downside is that due to the resistance above, the price may reverse, resulting in a false breakout, and it may even hit your stop-loss point.
Let's look at method 2 again.
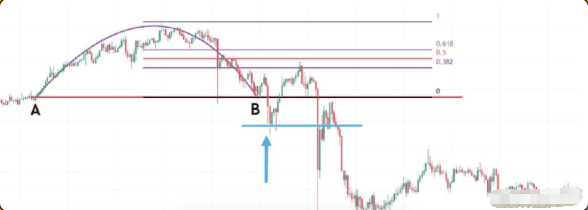
In the chart, we find the bearish candlestick that breaks the neckline. The blue arrow marks the candlestick, so then draw a blue horizontal line at the highest price of this candlestick, and wait for the subsequent candlestick to break the blue horizontal line to enter at market price.
We found that after the breakout candlestick, a false breakout occurred, and the price rebounded above the support line. However, we can see that the rebound area was near the Fibonacci 0.382 area from the neckline to the highest point, and then the price began to fall.
This means that it has retested the buying momentum, which is not very strong. If it were very strong, it would have directly broken through the Fibonacci 0.5 area, causing this bearish cup and handle pattern to fail.
So using method 2 greatly reduces the probability of false breakouts; this is the advantage of this method, reducing false breakouts.
The downside of this method is that if buyers are too strong, the closing price of the waiting bullish candlestick will be relatively high, meaning your entry price will be higher than method 1. However, compared to method 1, it is a more conservative method.
Let’s look at method 3 again, which is after the breakout, when it retests the neckline. If a bullish signal candlestick appears near the neckline, enter at market price at the highest price of the breakout signal candlestick, as shown in Figure 3.10-17.
The method of waiting for a pullback to short has the advantage of low risk and high reward-to-risk ratio, but sometimes it may not give you the opportunity to pull back; the price directly breaks down and does not look back, leaving you anxiously watching.
After explaining the above 3 methods, I believe you will have a clearer understanding of entering the bearish cup and handle. You may be wondering which method is better. In fact, there is no best method; you need to decide your entry strategy and continuously practice it in numerous trades.
Of course, if you want to verify whether the breakdown is real, you can use volume and other momentum indicators for validation.
Another point to note is that we should try to participate in cup shapes with longer tops and more U shapes, preferably avoiding cup shapes with sharp V shapes at the bottom, as shown in Figure 3.10-18. These sharp rises and falls generally tend to lead to energy exhaustion.

Next, let’s talk about how to set stop-loss for the bearish cup and handle.
For the bearish cup and handle, if entering at the neckline using method 1, such traders generally set the stop-loss at stop-loss level 2, as shown in Figure 3.10-19.
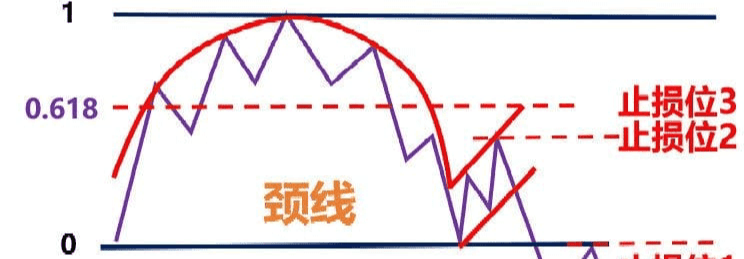
As mentioned earlier, we should not set stop-losses at obvious levels, such as support and resistance levels, swing highs or lows, etc. Because these are obvious places, you may get swept out at any time.
Therefore, the stop-loss needs to be set wide; it is generally recommended to set it at the Fibonacci 0.618 area. When the price breaks below 0.618, it is considered that the cup and handle pattern has failed.
However, if entering with methods 2 and 3, then such traders prefer to set stop-loss level 1.
This position is also obvious and easy to be stopped out.
So if using method 2 or method 3, you can try setting the stop-loss at stop-loss level 2 or stop-loss level 3. When the price breaks the neckline, closely observe the price direction and be ready to manually stop loss, and do not wait until the price really rises to stop-loss level 3. If the market really gets to that point, your losses will also be significant.
Of course, you can also use the ATR indicator to set fixed stop-loss prices. These stop-loss and entry methods vary from person to person, but we must maintain consistency.
Finally, let's see how to set take-profit to maximize profits. You can use 3 methods.
Method 1: Price prediction method.
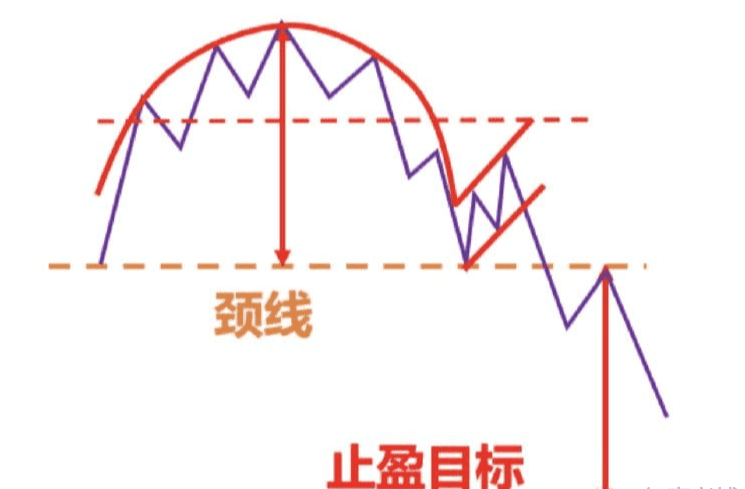
What you need to do is take the distance between the highest and lowest points of the cup and handle, which is the widest distance in the cup and handle. Then, based on the direction of the breakout, copy and paste this distance or project this distance to the breakout point.
Of course, the cup and handle can definitely break out and bring a larger market trend, so we also need method 2: trailing stop.
As mentioned many times before, trailing stops can use moving averages (MA), exponential moving averages (EMA), or trend lines and other tools to move stops, and you should exit trades only when the market closes above the tool you are using.
For example, if you are using the exponential moving average EMA50, then when the price breaks below EMA50, you should be prepared to exit, as shown in Figure 3.10-21.
So, after the highest price of the candlestick indicated by the black arrow is broken, we exit the market.
In fact, we can see that the candlestick at the red arrow also broke the EMA50. If you entered before this, then at this point, you should exit with a stop-loss. However, when the price breaks down again, we can still re-enter. What we need to do is play the probability game; it is impossible to profit every time.
Of course, this is just an example; whether to use MA or EMA, whether to use EMA20, EMA50, or EMA200 is up to your choice, as long as you maintain consistency.
In addition to the above two methods, there is also a third method, which combines method 1 and method 2, and works well. This way, you can use the fixed take-profit method to predict future trends in advance, lock in some profits, and then use the trailing stop method to control the remaining profits.
This is the true way to let profits run; even if there is a sudden reversal, you can still protect what you have without giving back the profits you earned.
That concludes the explanation of the bearish cup and handle pattern, including the characteristics of the pattern, entry methods, stop-loss methods, and setting take-profit targets.
With that said, the explanation of the pattern also comes to an end. I have organized an Excel sheet of all pattern classifications so that everyone can quickly review what they have learned; the download link is at the end of this book.
Of course, there are also some patterns that have not been explained, such as expanding triangles, V shapes, etc. We really do not need to master every single one and memorize them all.
At the same time, I need to emphasize that we should not memorize these pattern templates blindly. It is important to understand that template thinking is not only meaningless but also hinders traders from understanding the overall context.
Additionally, traders who memorize patterns like this will completely lose direction when they suddenly realize that financial markets do not always develop according to textbook forms, and they lack the knowledge to deal with these unknown situations.
Additionally, my suggestion is that everyone should follow 3-4 strong patterns according to their preferences rather than chasing every pattern. The more focused you are, the better the results will be, even if you only master one pattern; practicing it to perfection can still yield profits.
Wen Jing focuses on Ether contract spot ambush, and the team has positions ready to enter#美SEC推动加密创新监管 $BTC


