Wenjing knows an old veteran who has been immersed in the cryptocurrency world for many years. He entered the market years ago with 100,000, and now his account has jumped to over 15 million. He once said something that enlightened me: the essence of the cryptocurrency world is a playground of emotions, where most people are just tourists blindly following the crowd. If you can hold onto your own nature, this place is a treasure trove.
According to his way of thinking, if you want to make real money in the cryptocurrency world, the key points are these:
Firstly, do not be greedy for small profits and do not take catastrophic risks.
This sounds easy, just eight words, but 80% of people can’t get past this in their lifetime. It's like you opened a long position at 20,000 USD, and when it just rises to 21,000, you hurriedly take profit, feeling pleased with a 5% gain. As a result, the price skyrockets to 25,000, and you only nibbled at the edges, while watching the big profits slip away. Next time you try to be smart, you wait for the price to drop back to 20,000 to open a long position, but when it rises to 21,000, you stubbornly hold on, determined to make big money, only to see it drop back to 20,000 or even 19,500, and you are left with no choice but to cut your losses. How many people are trapped in this vicious cycle of constantly getting slapped in the face, never managing to break free.
Secondly, specifically choose mainstream coins that have dropped significantly and are slowly recovering.
Don’t touch those flashy new cryptocurrencies. First, take a 10% position as a base, don’t guess where the bottom is, wait until it stabilizes before acting. The method may seem clumsy, but it is steady.
Third, wait for the trend to stabilize, and then supplement 20%-30% of the position during the pullback.
While others are always eager to pick the very bottom, I prefer to wait until the trend is clear before adding, even if the price is higher, it is much better than being stuck in mid-air.
Fourth, every time there is a rise, first withdraw the principal and half of the profit.
Let the remaining position fluctuate freely, regardless of how crazy the market gets, when it reaches the line I draw, I will act, never greedy for an extra cent. Money in the pocket is the real gain.
Relying on this practical method, last year he helped a friend who had previously lost over 600,000 operate, and within six months not only recovered the losses but also earned enough for a family car.
It's not an exaggeration; there are smart people everywhere in the cryptocurrency market. What is lacking is the 'real person' who can restrain themselves and stay calm. When everyone is chasing gains and selling at losses, you steadily follow the trend and can instead pick up the chips that others frantically throw away.
In the cryptocurrency market, one must have a high-quality circle.
Before discussing MACD, we must first talk about moving averages. There are many strategies involving moving averages in the market that seem mysterious. Today, let's uncover the moving average:
What is a moving average?
The moving average refers to the Moving Average (MA), which averages prices over a specific time period.
Moving averages are classified into three attributes:
1. Regressiveness
For any asset, its price always fluctuates around its value. When the expected profit target is reached, it will be sold to cash out, just like the gravitational pull of the Earth; if it deviates, it will be pulled back, which is what we often refer to as divergence rate.
2. Support and resistance
This is also a main reason why many people are obsessed with using moving averages. The moving average is indeed the average cost, the average price of the densely traded area. (Breaking below or surging above are quick, alternating principles), having strong support and resistance, a pullback to cost has support, while breaking through cost has resistance, just like when a car breaks through an obstacle, it needs to accelerate.
3. Trendiness
Long-period moving averages have continuity and are very stable, revealing trends effectively.
The drawback of moving averages is that they have serious lagging characteristics.
The prices we see are superficial; the essence is the value behind the price.
Making decisions based on price is merely superficial; the core is value, whether it has been accepted and recognized.
During actual trading, retail investors only ever see price fluctuations, and their emotions can be affected, causing further fluctuations.
Long moving averages have stability, but lack sensitivity;
Short moving averages have sensitivity but lack stability.
In actual operation, moving averages have hidden pullback period attributes, which will face a series of problems. If these problems cannot be solved, it will affect our trading judgment, leading to inevitable mistakes. Can moving averages solve these problems?
When will it be pulled back? What price will be pulled back? How much will the pullback be?
Moving averages cannot resolve these core key issues.
Thus, it cannot help us trade well.
These substantive issues must be resolved during trading; therefore, to comprehensively reveal all price fluctuations, the upgraded upper and lower channels have led to the emergence of the BOLL (Bollinger) channel lines and MACD.
BOLL (Bollinger) focuses on support and resistance, while MACD focuses on the strength of trends.
A single moving average has obvious limitations, including the moving average system; these are actually the most basic technical indicators;
Seeing this, do you still think moving averages are mysterious?
Will you still think about relying on a single trick to eat all the food?
Any technical indicator is merely an auxiliary indicator, and can only help us increase the probability of trading.
The MACD that emerged is based on this principle, solving problems that moving averages can't address directly.
The core concept behind MACD design: secondary processing of data.
MACD originates from moving averages, and the source of the moving averages is the closing prices of each K line, which is a secondary processing of this data, making it more accurate and objective.
Just like how MACD is revered by many retail investors, its wide applicability, reliable judgment accuracy, correct trend judgments, and extremely high popularity rate.
As mentioned earlier, moving averages tend to lag behind the market trend, making them generally unsuitable for short-term trading, especially contracts. For short-term trading, the support and resistance of Bollinger Bands will be more effective, which I will share based on practical cases in future articles.
Today, I will stop here regarding the origin of MACD. Later, I will discuss the basics of MACD, structure, golden cross, death cross, practical application techniques of top-bottom divergence, and the combination strategy of volume and MACD.
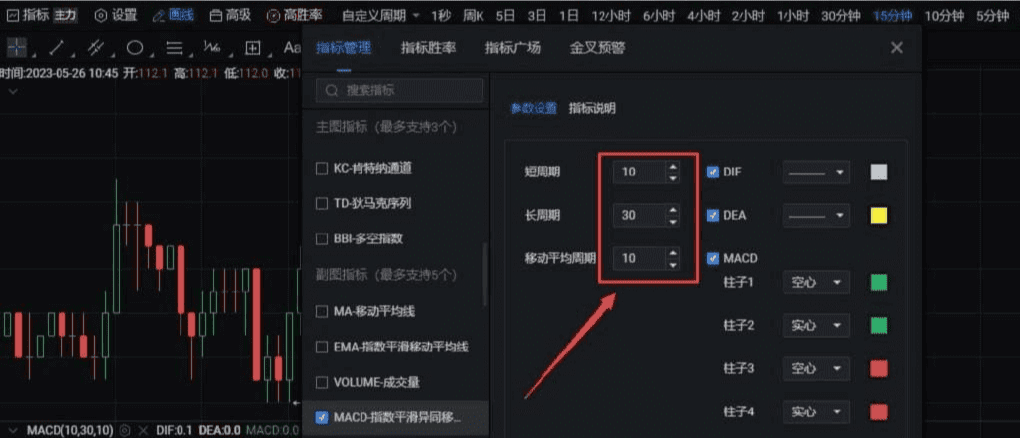
To conclude, let me first share the settings of the MACD indicator, which will help you understand why many stock market trading experts feel out of place in the cryptocurrency market;
You can compare it with your own MACD settings to understand clearly. The cryptocurrency market is open 24 hours a day, 365 days a year, with no holidays. Therefore, many indicators are different from those in traditional financial markets;
Professionals create value, and details determine success or failure.
Today, let's take a look at the basics of MACD and the structure of the MACD indicator:
The MACD indicator consists of four basic parts:
1. Study the strength of trends (depth of movements)
2. Discuss changes in intensity (speed of movements)
3. The MACD histogram can only express whether the trend is weakening or strengthening.
4. MACD is a lagging indicator (a natural attribute, a secondary processing of moving average data, and moving averages themselves are already lagging enough)
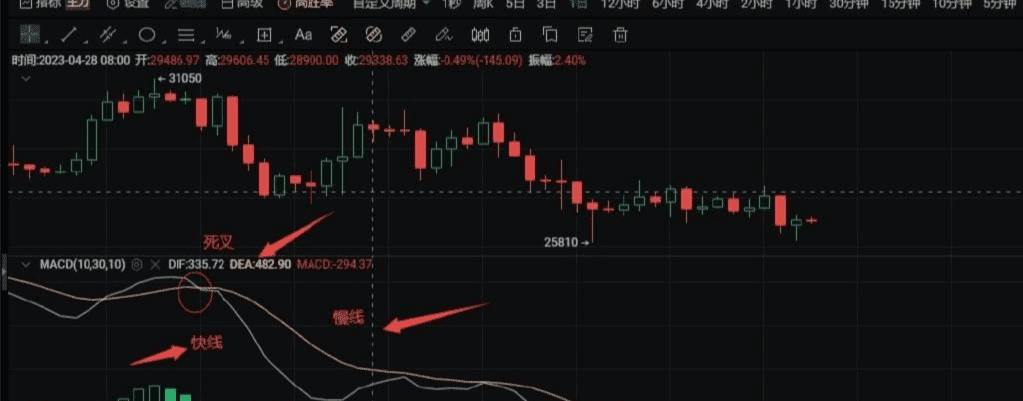
The structural part of the MACD indicator:
Consisting of two curves and a set of bars, the fast-moving one is the DIF line, and the slow one is the DEA, which can also be abbreviated to fast F and slow A;
Fast F represents the short-term speed of price movements. The greater the gap between the two EMA curves displayed, the higher the curve position, indicating that the speed of increase is faster; if the curve position is lower, it indicates that the speed of decrease is faster;
DEA is calculated using a smoothing moving algorithm on DIF, representing the average DIF value over a period of time, with DEA serving as an auxiliary judgment line for DIF;
The fast line collects from the moving averages, and the moving averages collect from the closing prices, which is a secondary processing of the moving average data;
The slow line collects from the fast line, corresponding to the third processing of moving average data;
The fast line minus the slow line multiplied by 2 gives us the MACD.
The histogram is also called the MACD line; the practical technique lies in:
When MACD is on the zero axis, the speed of increase accelerates or the speed of decrease slows down;
When MACD is below the zero axis, the speed of increase slows down or the speed of decrease accelerates;
And these rules are:
1. Trends have acceleration characteristics,
2. The gravitational regressive nature near the zero axis; once the histogram deviates too far from the zero axis, it must return;
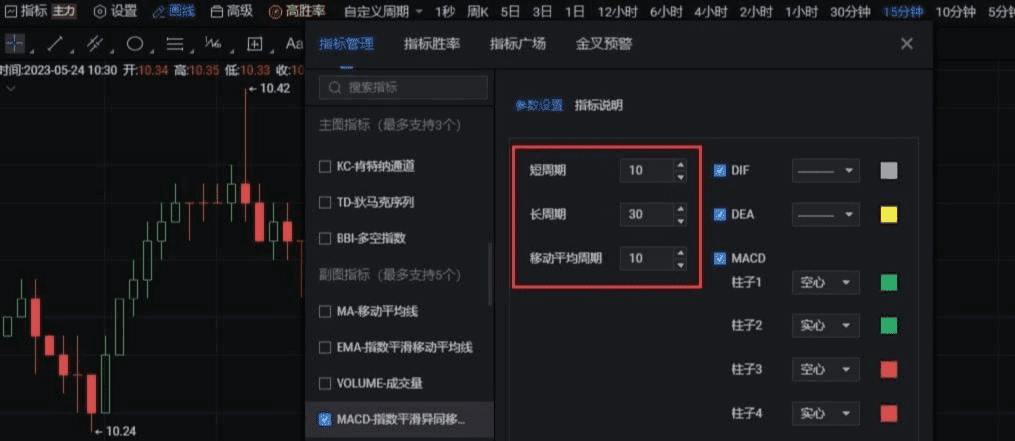
The settings of MACD:
With this one setting, one can defeat those 99% of analysts using MACD in the market;
The cryptocurrency market operates 24 hours a day, 365 days a year without interruption. MACD originates from traditional financial markets, which have default settings for market closures. Therefore, if you do not set it, the accuracy will greatly decrease, especially over longer trading periods.
If you grasp a bit more of the market’s subtle hints than others, your conclusions will be more accurate than theirs, thus increasing your probability of success.
Synchronous operations, divergence observation, only engage in market movements that one can understand;
Trading, that's all.
The MACD technical indicator can only serve as one of the references and auxiliary indicators during our practical operations. This is the key; we cannot mythologize it through a single technology.
Just like how I use candlestick charts and naked K lines to assess the overall market, determine bull or bear, and identify phases;
We can clearly judge which specific stage the market is currently in, whether it is in a bull market or a bear market. What stage is the bull or bear market in? Based on the current level, is the market in an uptrend, downtrend, or consolidation?
If a conclusion about the market is given 80 points, to continue improving the accuracy of judgment, more technical indicators are needed for assistance;
Adding 5 points for the MACD indicator, adding 5 points for Western technical analysis, Bollinger Bands, volume, and other indicators—the higher you go, the harder it becomes to add points;
If these indicators are in sync, the probability of success will greatly increase;
This is also the real reason why we need to build our own trading system.
We must understand the principles of specific indicators to have a clear understanding, and only then can we apply them skillfully, thus increasing the correct probabilities.
In the future, I will specifically cover some practical uses of golden crosses and death crosses in specific stages of the market, rather than the so-called golden cross buy, death cross sell, and other superficial methods on the market.
Earn $50 a day = Annual income of $100,000! The miracle of compound interest in the cryptocurrency market can change your fate in 300 days
Core data:
Earn $20 a day → Annual income of $42,000 (monthly income of $3,500)
Earn $100 a day → Annual income of $210,000 (monthly income of $17,500)
Earn $500 a day → Annual income of $1.05 million (monthly income of $87,500)
Earn $1,000 a day → Annual income of $2 million (achieving class transition)
[Real Profit Rules in Cryptocurrency]
The essence of compound interest:
It's not about making huge profits every time, but about harvesting steadily every day.
For example: Earn only 1% a day ($1,000 principal → $10), annual yield exceeds 300%
Reject huge losses:
A single-day loss greater than 10% requires 10 days to double to break even
Iron rule: Daily stop loss ≤ 3%, profit ≥ 5%
[Daily Harvest System]
Core strategy:
Only trade at the 4-hour trend level, with daily trades ≤ 3 times
Profit-loss ratio ≥ 2:1 (gain $50, lose $25)
Practical cases:
Yesterday ETH was over 4560 → 4680 flat, profit of $1,325 (took 2 hours)
The day before, SOL was at 203 short → 196 flat, profit of $860 (took 4 hours)
[Three Steps to Achieve Daily Goals]
Principal grading:
$5,000: Daily goal of $50 (1%)
$10,000: Daily goal of $100 (1%)
$50,000: Daily goal of $500 (1%)
Strategy matching:
Small capital: high profit-loss ratio short-term (tight stop loss, generous profits)
Large principal: low leverage swing (wide stop loss, reduced frequency)
Review is mandatory:
Daily statistics on win rates, profit-loss ratios, maximum drawdown
Delete the continuous loss strategy and strengthen the profit model
[Blood and Tears Warning]
Reject heavy positions and all-in strategies (10 wins ≠ 1 loss that can't be recovered)
Reject frequent trading (transaction fees erode profits)
Reject emotional trading (profit expansion + loss revenge)
To put it simply, there are three key points, simple but must be executed seriously:
First, never go all in, do it in batches. In my early years, I suffered losses from being fully invested; more than $3,000 was lost in just a few days, leaving only half. Later, I established a strict rule: before the market shows a clear signal, only a maximum of 20% of the position should be tested; wait until the trend is stable, such as the cryptocurrency holding above the 5-day line, and the volume is also following, then slowly increase the position. Many people face liquidation not because the market is tricky, but because they are too eager, going all in without waiting for signals, and cannot withstand fluctuations, ending up having to cut losses.
Secondly, only add positions to profitable trades. In the past, I always thought about averaging down to reduce costs when losing, but the more I added, the more trapped I was, putting in all my principal. Later, I established a strict rule: cut losses on losing trades at stop-loss points, never add; only for profitable trades, wait for it to rise above a 5% cushion before adding a little position. In simple terms, let profits roll over while keeping the principal safe and sound, avoiding unnecessary risks, which leads to a steadier mindset.
Third, go with the trend and do not struggle against it. 'Go with the flow' sounds cliché, but I only realized its importance after stepping into the pitfalls of counter-trend trading. When the market rises, I look for cryptocurrencies that are stable above the moving average; when the market breaks downward, I stay in cash for opportunities without forcing a 'bottom pick'. Many people say the market is difficult, but the real difficulty lies in their mindset—always thinking of opposing the trend, either escaping the peak too early or blindly bottom-picking, which naturally leads to losses.
Wen Jing focuses on Ether contract spot ambush, the team has positions available for swift entry #加密市场观察 $ETH


