XRP is still under the pressure of its prolonged bearish trend, but recent price movements suggest that the bears may be losing control. The upward movements have become more pronounced and aggressive, while the downward momentum is slowing, hinting that buyers (the bulls) are quietly stepping in. With a crucial breakout above the main resistance, the bulls may be preparing for a significant counterattack.
Overall bearish structure: ceiling of the red trend line
According to the latest update on the XRP chart by "MakroVision Research", the broader market structure remains firmly within a downward trajectory, clearly defined by steep red trend lines. These trend lines continue to cap every recovery attempt, leaving the larger technical picture unchanged and leaning towards bearish.
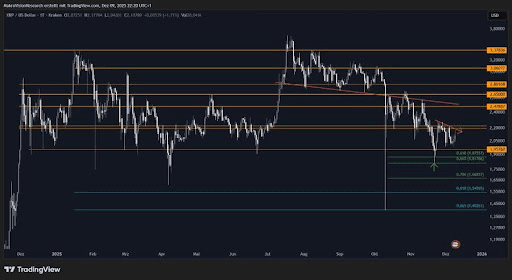
However, the internal structure of the market has begun to show noticeable signs of improvement. Short-term price behavior reveals that upward movements are becoming more impulsive, faster, and more defined. Meanwhile, bearish phases are gradually slowing down, taking longer to unfold and showing less momentum.
This shift is a classic indicator of diminishing selling pressure and increasing buyer activity at lower levels. The market may still be under a prevailing resistance area, but its internal dynamics are no longer as weak as before.
Key price levels to monitor
If XRP can make a decisive move above the red trend line around $2.48, it will unlock the bullish potential that has been quietly forming beneath the surface. Without this breakout, the currency remains technically under pressure, but the foundation for a potential reversal is clearly forming.
Key price levels to watch include the following:
* Resistance zone: $2.2 - $2.22.
* Key breakout level: $2.48.
* Support zone: $1.95 - $1.88 (which corresponds to Fibonacci corrections and recent reaction points).
The dual path conflict: bearish trend vs. bullish internal structure
In conclusion, "MakroVision Research" highlighted that XRP is currently on a dual path. While the larger trend remains technically bearish, the internal price structure has become increasingly and noticeably bullish. This diminishing bearish momentum makes the current chart very intriguing.
The immediate fate of XRP now entirely depends on whether the asset can achieve a sustainable breakout above the previously mentioned critical resistance levels, specifically the trend line at $2.48.
Analyst warning: If XRP successfully converts that key resistance into support, the accumulated bullish momentum could unfold very quickly, leading to a rapid price increase.
Currently, the critical question is whether XRP can achieve a sustainable trend reversal and capitalize on its internal strength, or whether the overall bearish pressure will ultimately prevail, forcing the price to drop deeper towards the significant low level of $1.4.
Note: At the time of writing the report, XRP was trading at $2.06 on the daily chart.

