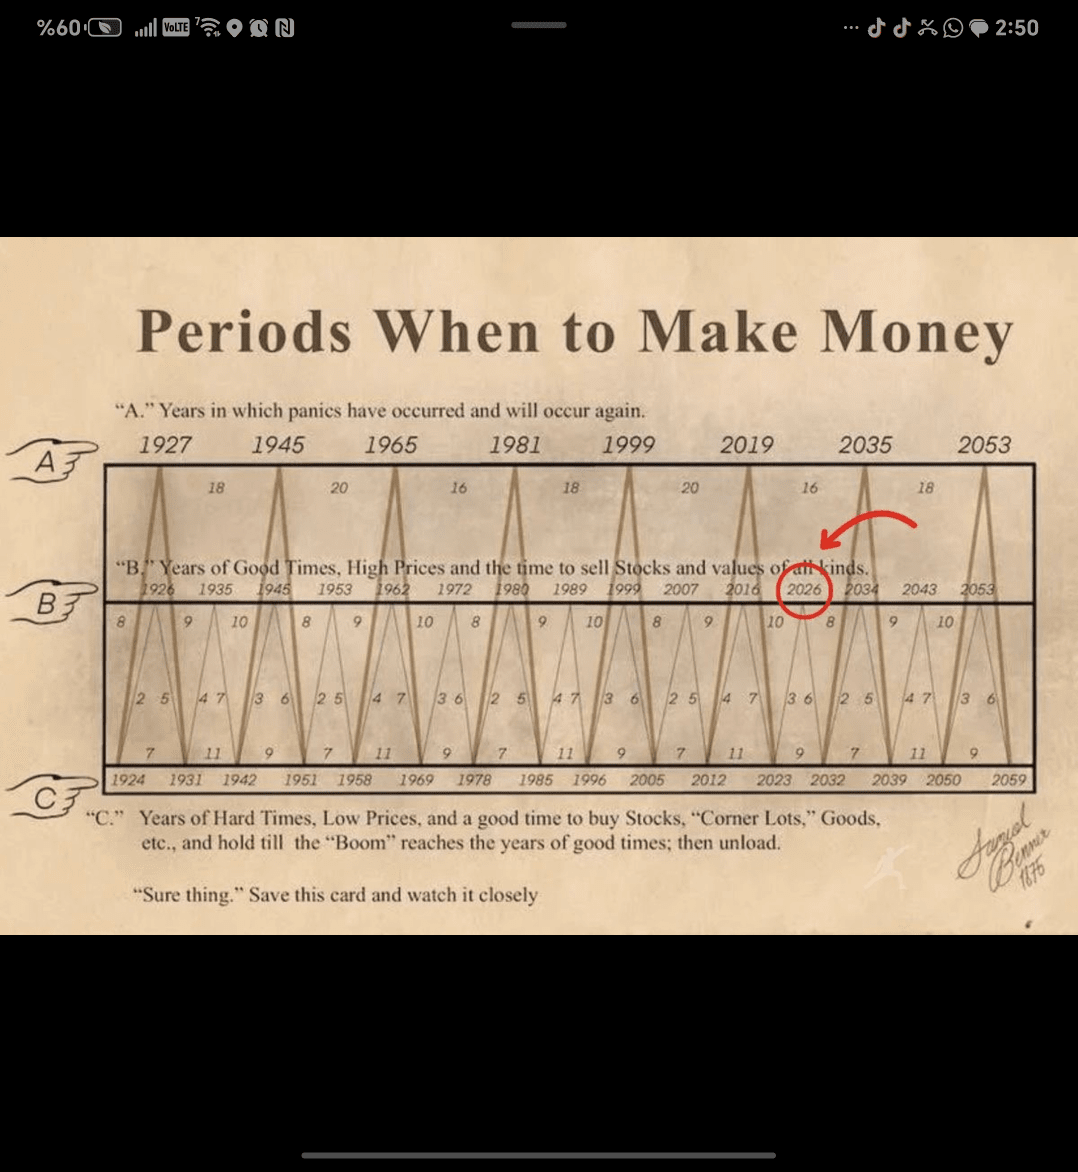
🎯 First: What does the table say?
The table divides time into three recurring phases:
A – Panic Years
These are the years that witness:
Strong collapses
Economic shocks
End of cycles
Violent repricing
One clear example:
1929 Great Depression
1987 Black Monday
2008 financial crisis
2020 Corona (out of the table but realistic)
According to the table: the next year in this path after 2019 is 2035.
B – Years of Peaks and High Prices (Boom Years – Sell Zone)
These years represent:
Cycle peak
High prices for stocks and real estate
Excellent time for selling and risk reduction
The chart indicates that 2026 is one of the upcoming peak years.
This explains why many analysts expect:
Major peak for Bitcoin between 2025–2026
Peak for stock markets before entering a new recession 2026–2027
C – Years of Decline and Hardship (Hard Times – Buy Zone)
This part represents:
Years of low prices
Excellent time for buying and accumulating
Beginning of a new cycle
According to the table, the last years of C were:
2023 (has actually ended, and it was indeed a year of bottoms!)
And the upcoming period of C will be around 2032–2034.
🔍 Second: What does 2026 specifically mean?
The year 2026 is circled in your image because it is:
🔥 Year of Economic/Financial Peak in this cycle
That is:
Excellent selling year
Year of exit for heavy speculation
Year of profit-taking
Year expected to see economic slowdown after the peak
And intriguingly...
This aligns with expectations:
Bitcoin makes a legendary peak 2025–2026
U.S. stock markets reach a peak then settle down
Interest rate hike/Economic slowdown after 2026
📈 Third: Is this model historically accurate?
In general, it is not a physical law, but it depends on economic cycles of 18 years which is a recurring historical observation:
Peak Bottom Peak
1929 1945 1965
1965 1982 2000
2000 2008–2010 2018–2021
Next peak (according to the cycle) → 2025–2026
Note the match with the table!
🧨 Fourth: How does the smart investor use this table?
✔ Risk Management Strategy
2024–2026 = Growth and Peak Phase
Near 2026 = Position reduction
2027–2030 = Volatility/Recession
2032–2034 = Buy Again at a Cheap Price
🧠 Fifth: My final investment opinion
The table clearly states:
2026 = Selling Phase (Cycle Peak)
2032–2034 = Buying Phase (Cycle Bottom)
2035 = Potential Shock/Crash
This aligns with the current Bitcoin movement:
Strong rise 2024–2025
Peak 2025–2026
Deep correction afterwards
🏁 The Golden Summary
🔸 We are now in Phase B (High Prices and Growth), the road to the peak
🔸 2026 = Strategic Exit Point for Heavy Portfolios
🔸 2032–2034 = Best Buying Opportunities for the Coming Contract
🔸 2035 = Year of new economic shock according to the model