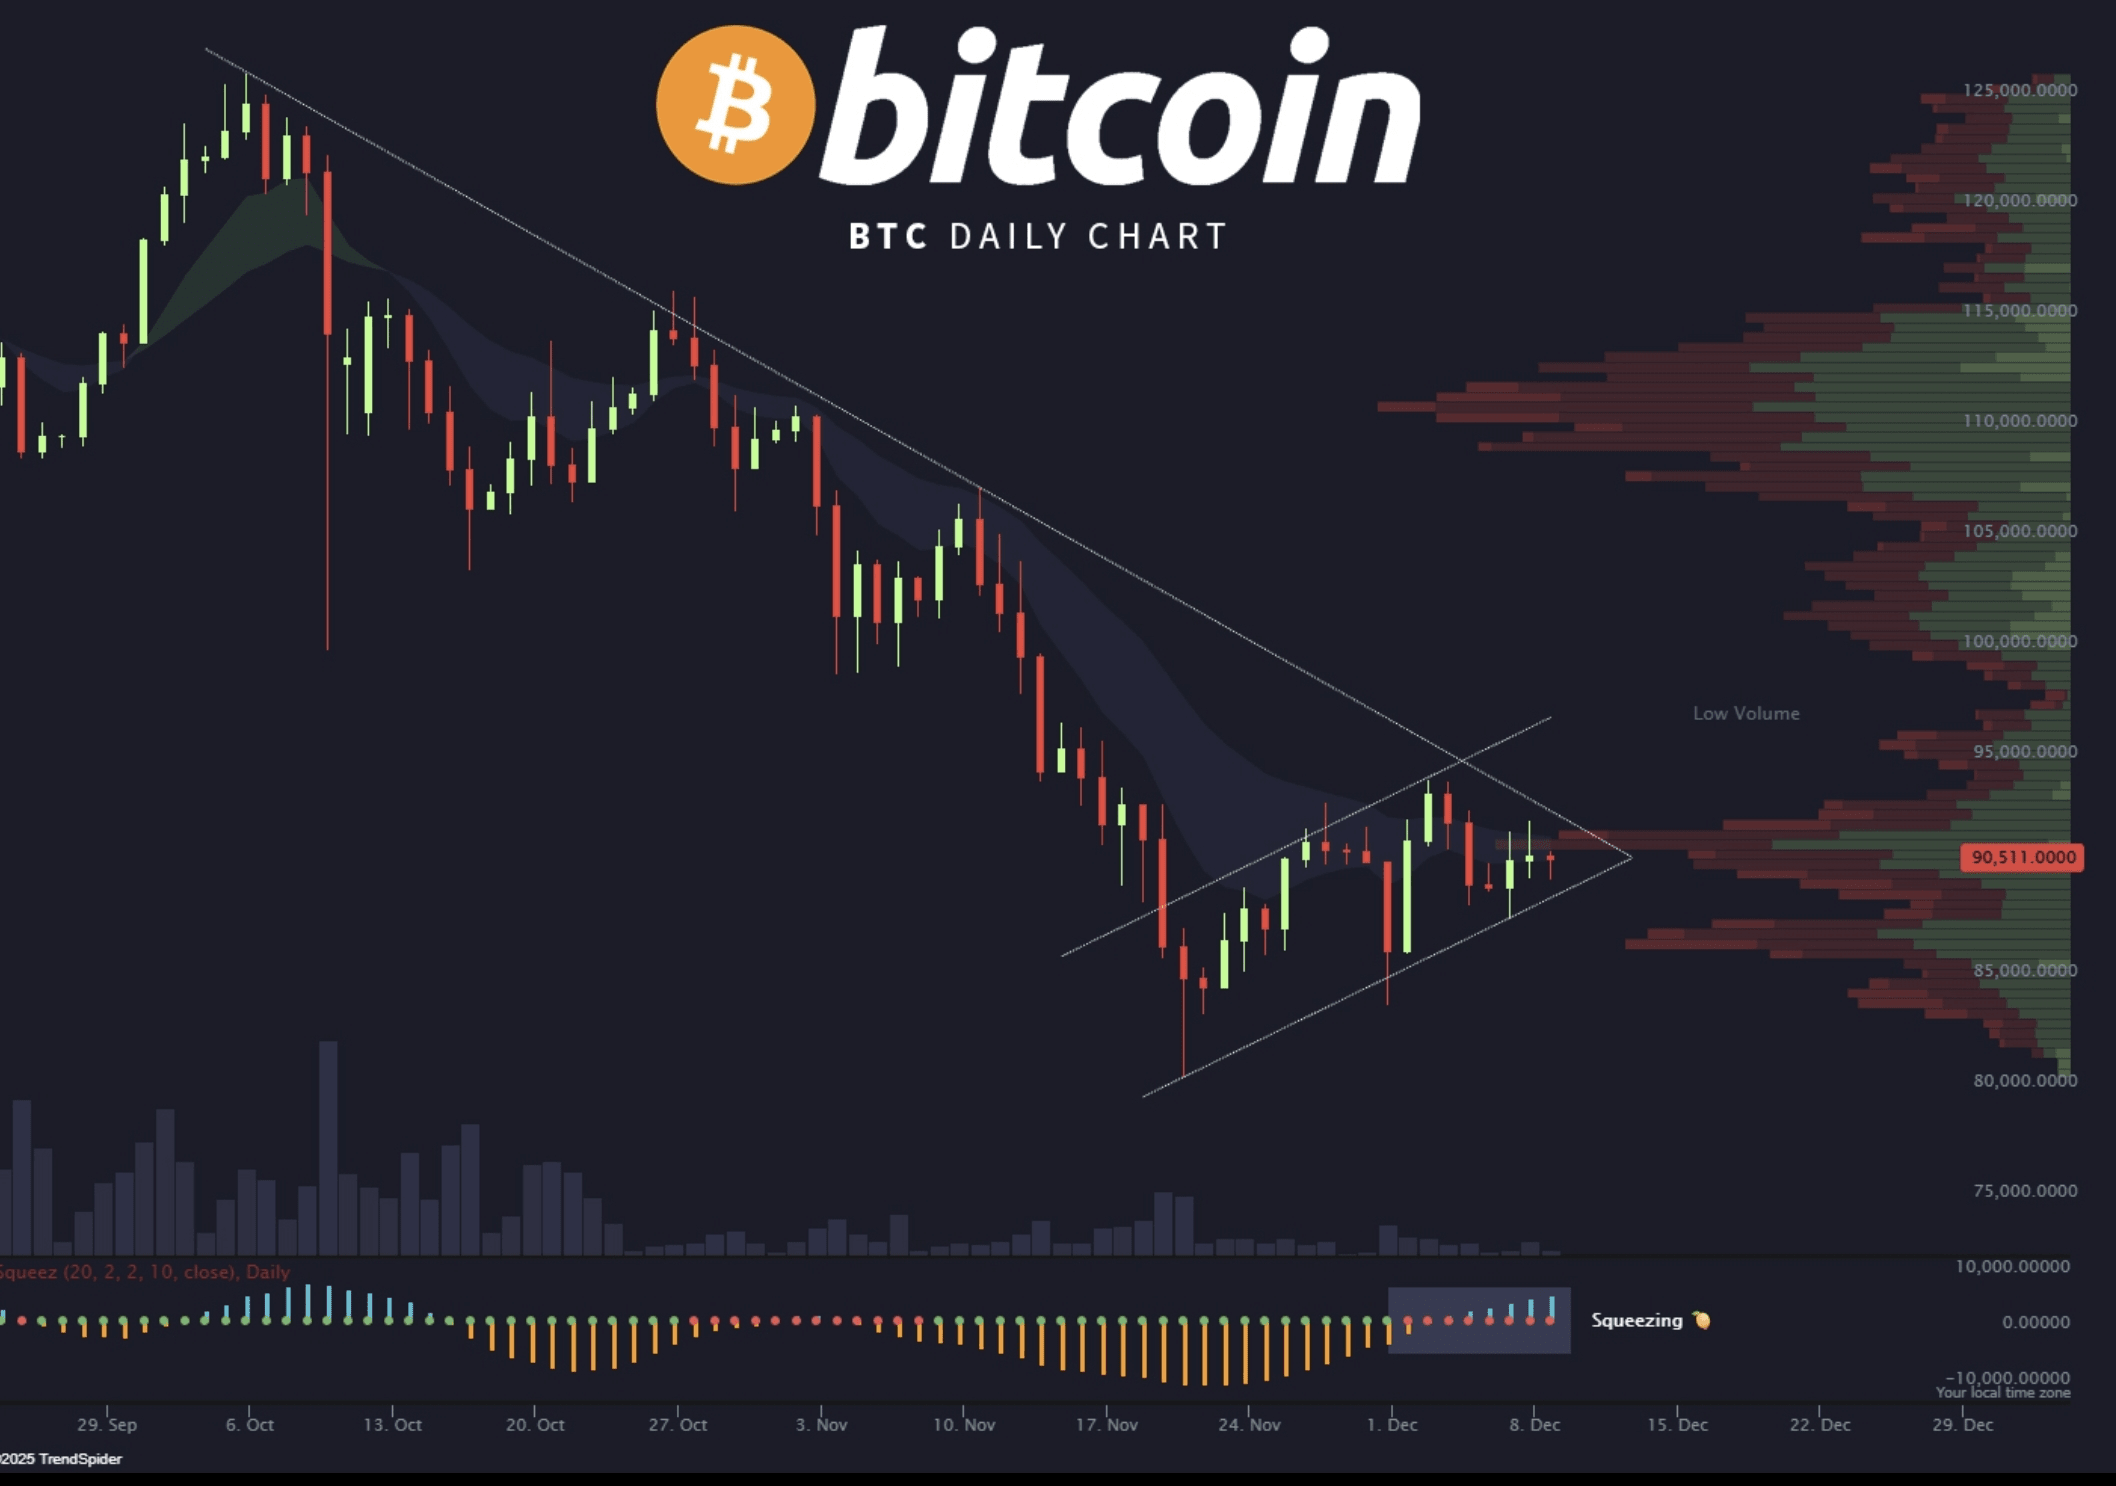
1️⃣ General trend – the big picture
🔻 The main trend has still been downward since the end of September
Low peaks
Low bottoms
A clear downward trend drawn on the peaks
Every upward attempt has been corrective and not a sustainable upward trend
Therefore: the market is moving within a correction inside a downward trend and not a real upward trend.
2️⃣ The currently dominant price pattern
🔶 The price is inside a narrow Rising Wedge / Channel
And it is a bearish continuation pattern often within a downtrend.
🔶 It intersects with a Symmetrical Triangle
And this triangle comes after weak volatility and low volume → confirms we are inside a pressure area before an explosion.
Result:
The market is at a decision point
Bullish Breakout
Or
Bear Flag and continuation of the drop.
3️⃣ Trading volume – Volume Profile
🔸 At 90K → High Volume Node
Strong resistance area + repeated reversals.
🔸 At 95K → Low Volume Zone
If the price breaks it with volume →
It is likely to jump directly towards 100K because the area above is 'light' and has little liquidity.
As long as the price is below 95K → bearish pressure dominates
Above 95K → starts the 'liquidity trap' to higher levels
4️⃣ Squeeze Momentum – upcoming explosion indicator
The market is in a Squeeze
Volatility decreases
Volume decreases
Price is tightening between two lines → close to explosion
⚠️ This indicates that a strong movement is coming, not just simple volatility.
5️⃣ Candles + RSI + MACD – the fine details
📌 At resistance level (90K – 95K):
Appearance of candles: Doji, Shooting Star, or Bearish Engulfing → supports the bearish scenario
RSI: near overbought area = potential selling pressure
MACD: Bearish crossover above the zero line = strong bearish signal
📌 At support level (85K – 89K):
Hammer candles / Bullish Engulfing → supports the bounce
RSI: may drop to the 40–35 area → suitable for reversal
MACD: Bullish crossover from below = beginning of a short positive wave
6️⃣ Bullish scenario (Breakout Scenario)
This scenario has a potential but is not the highest unless under conditions:
✅ Its conditions:
1. Daily close above the main downtrend
2. Breaking 95,000 with clear volume
3. MACD gives a bullish crossover
4. Strong candle (Bullish Engulfing or Marubozu)
🎯 Its targets:
100,000
105,000
111,000
115,000
120–125K (if momentum continues)
❌ Scenario invalidated:
Return below 90K after the breakout.
7️⃣ Bearish scenario (Bear Flag – currently the strongest technically)
Downtrend
Rising Wedge pattern
Weak volume
Pressure on the ceiling
There is resistance at 90–95K
RSI traditionally tilts down after correction
So the final analysis leans towards:
🔥 The higher probability = bearish break and continuation of the trend
Conditions for confirmation:
1. Breaking the lower support line of the wedge/channel
2. Daily close below 89,500
3. High trading volume during the breakout
🎯 Downward targets:
85,000
82,000
78,000
And if the correction intensifies: 72K – 70K
❌ Scenario invalidated:
Breaking 95K with strong volume.
8️⃣ Final summary — golden version
> Bitcoin is now in a tight and dangerous decision area between 89,000 and 95,000.
Breaking above 95K = beginning of a violent upward wave.
Breaking below 89K = continuation of the bearish trend.
And the probability of the bearish scenario is higher technically unless volume and momentum change.