
If there is a chart that helps people read the next rhythm of BTC, it is BTC/DXY and the signal right now is quite clear for $BTC

The basic BTC/DXY chart shows the strength of BTC compared to USD. When this chart goes up, it means BTC is stronger than USD, while when it falls, it means USD is dominating. The interesting thing is that this chart often gives signals earlier than the traditional BTC/USD chart, especially at important times.
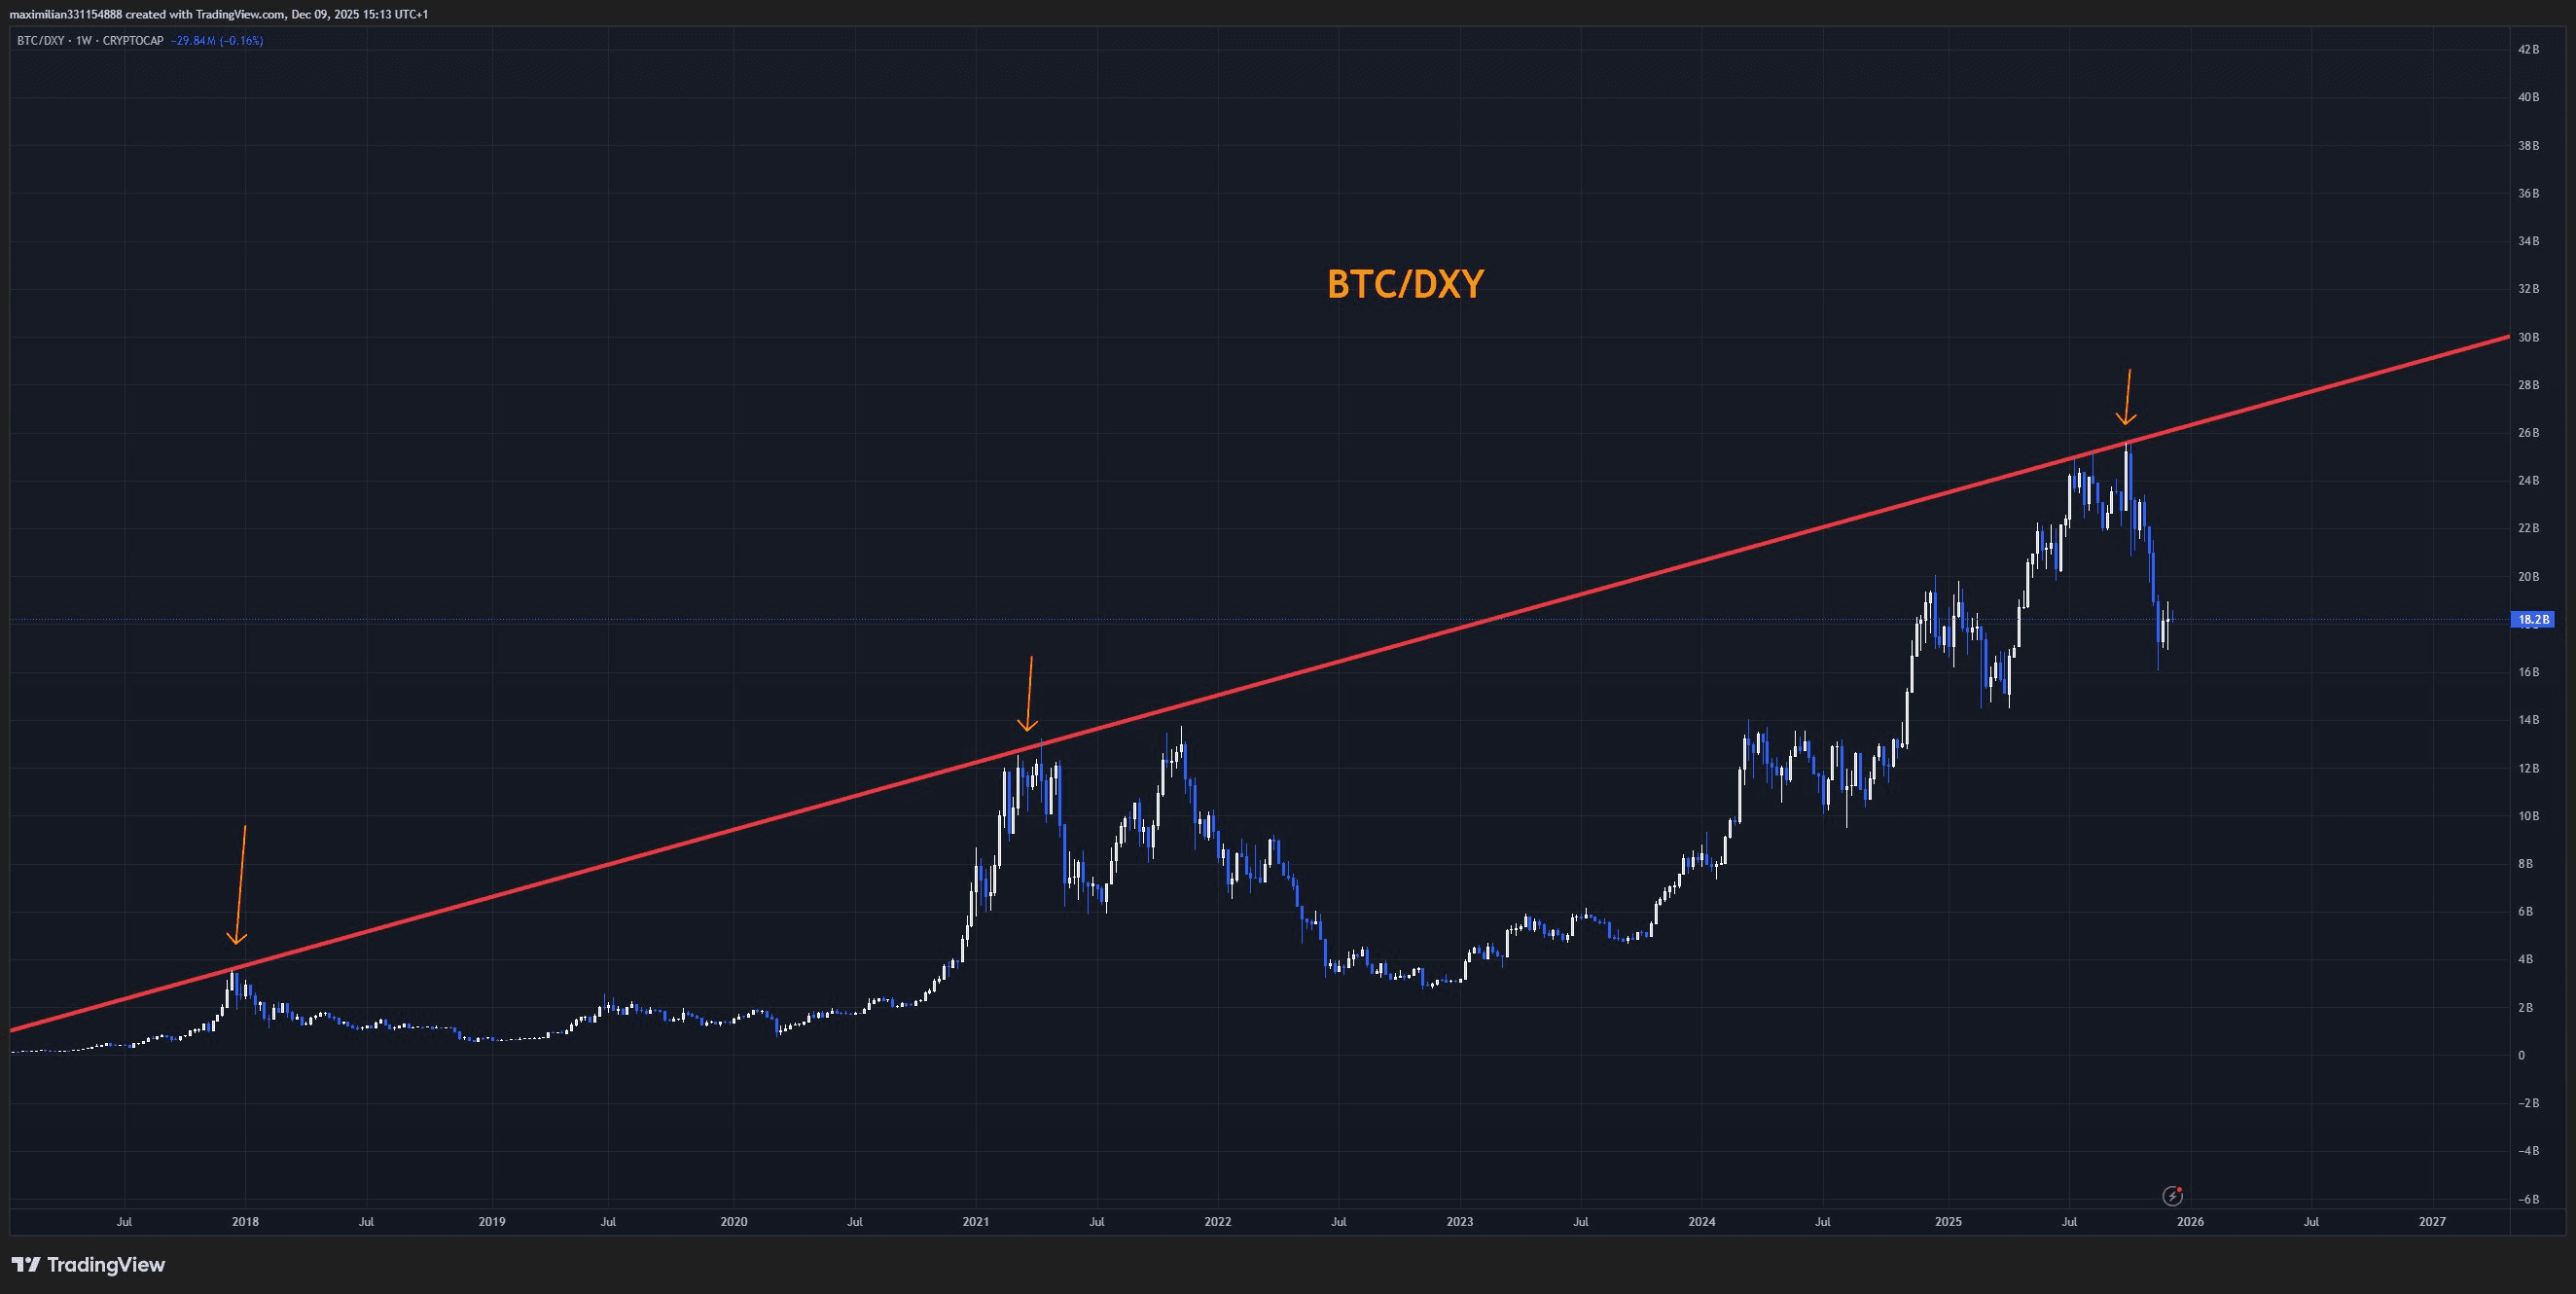
Looking back at the past, BTC/DXY has touched the long-term trendline three times and created significant peaks: in 2017, in 2021, and also the recent peak. Each time it touches the red line, BTC tends to drop sharply. It is like an early warning that few people pay attention to.
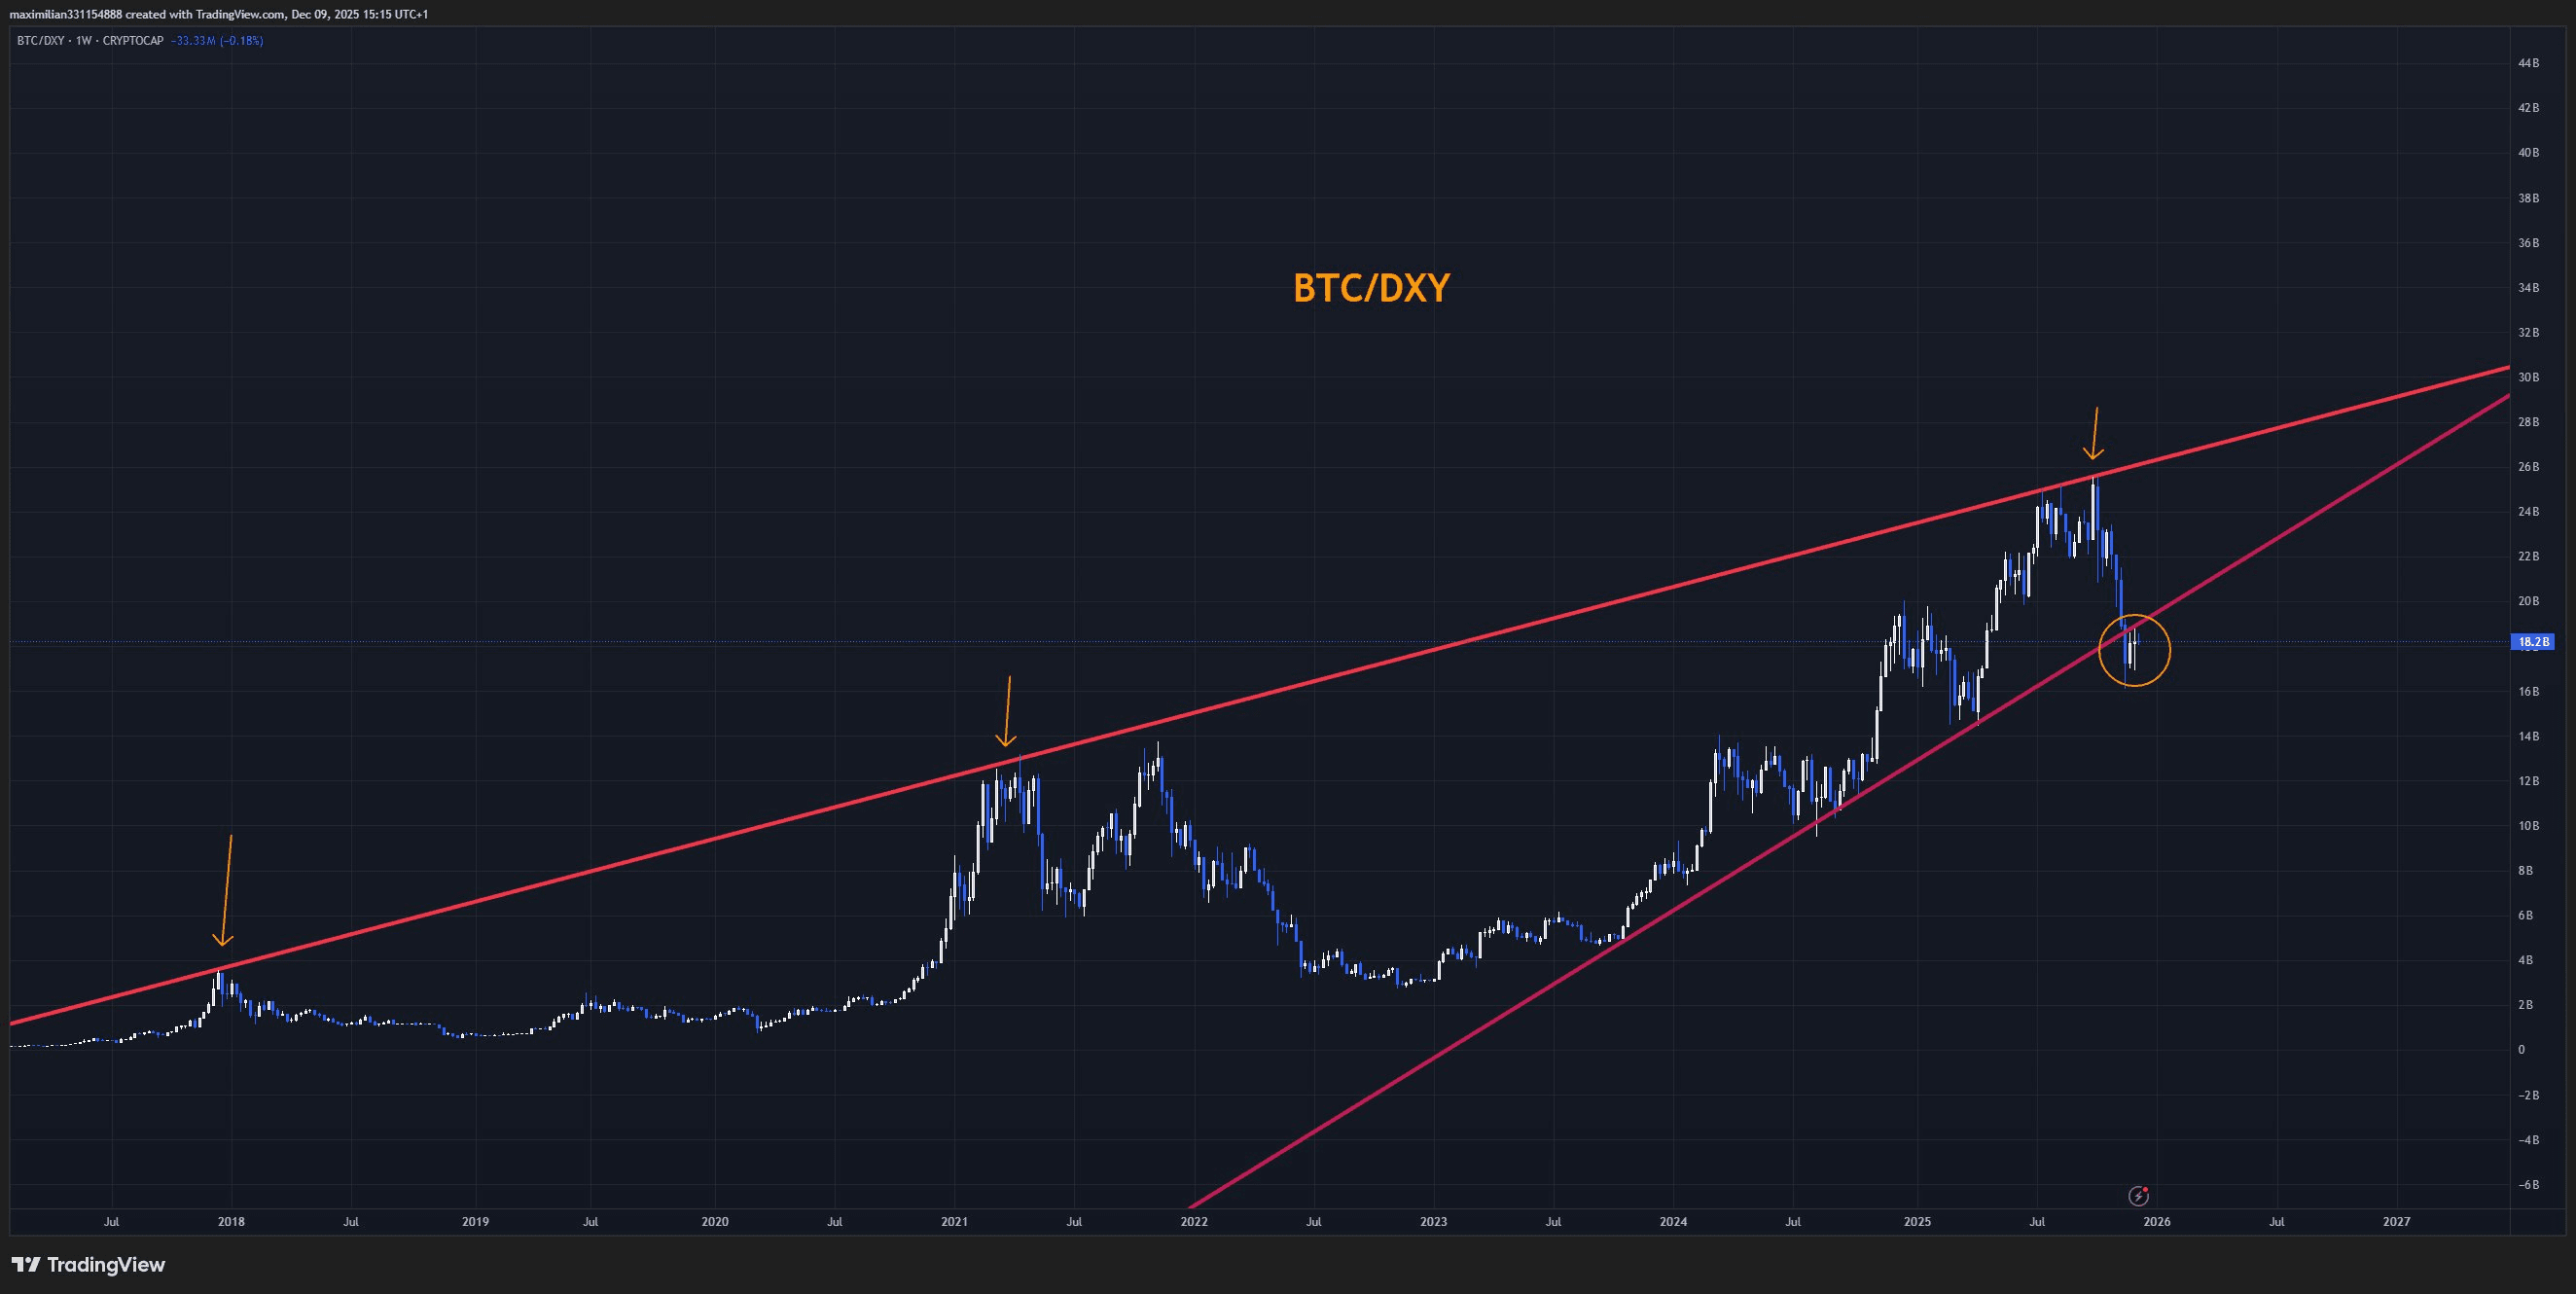
Currently, there is one notable point that BTC/DXY has just broken the uptrend line and retested it but couldn't rise. With basic technical analysis, this is a quite clear signal that the upward momentum has ended and the market is preparing for another drop. No need to complicate things, just understand simply: when the trendline breaks, the price goes down.
Brothers, please pay more attention to the main support of BTC/DXY over the years. If this chart continues to drop to that area, it is highly likely that BTC will have another drop before finding a strong bottom. Looking at the current structure, that scenario is becoming increasingly clear.
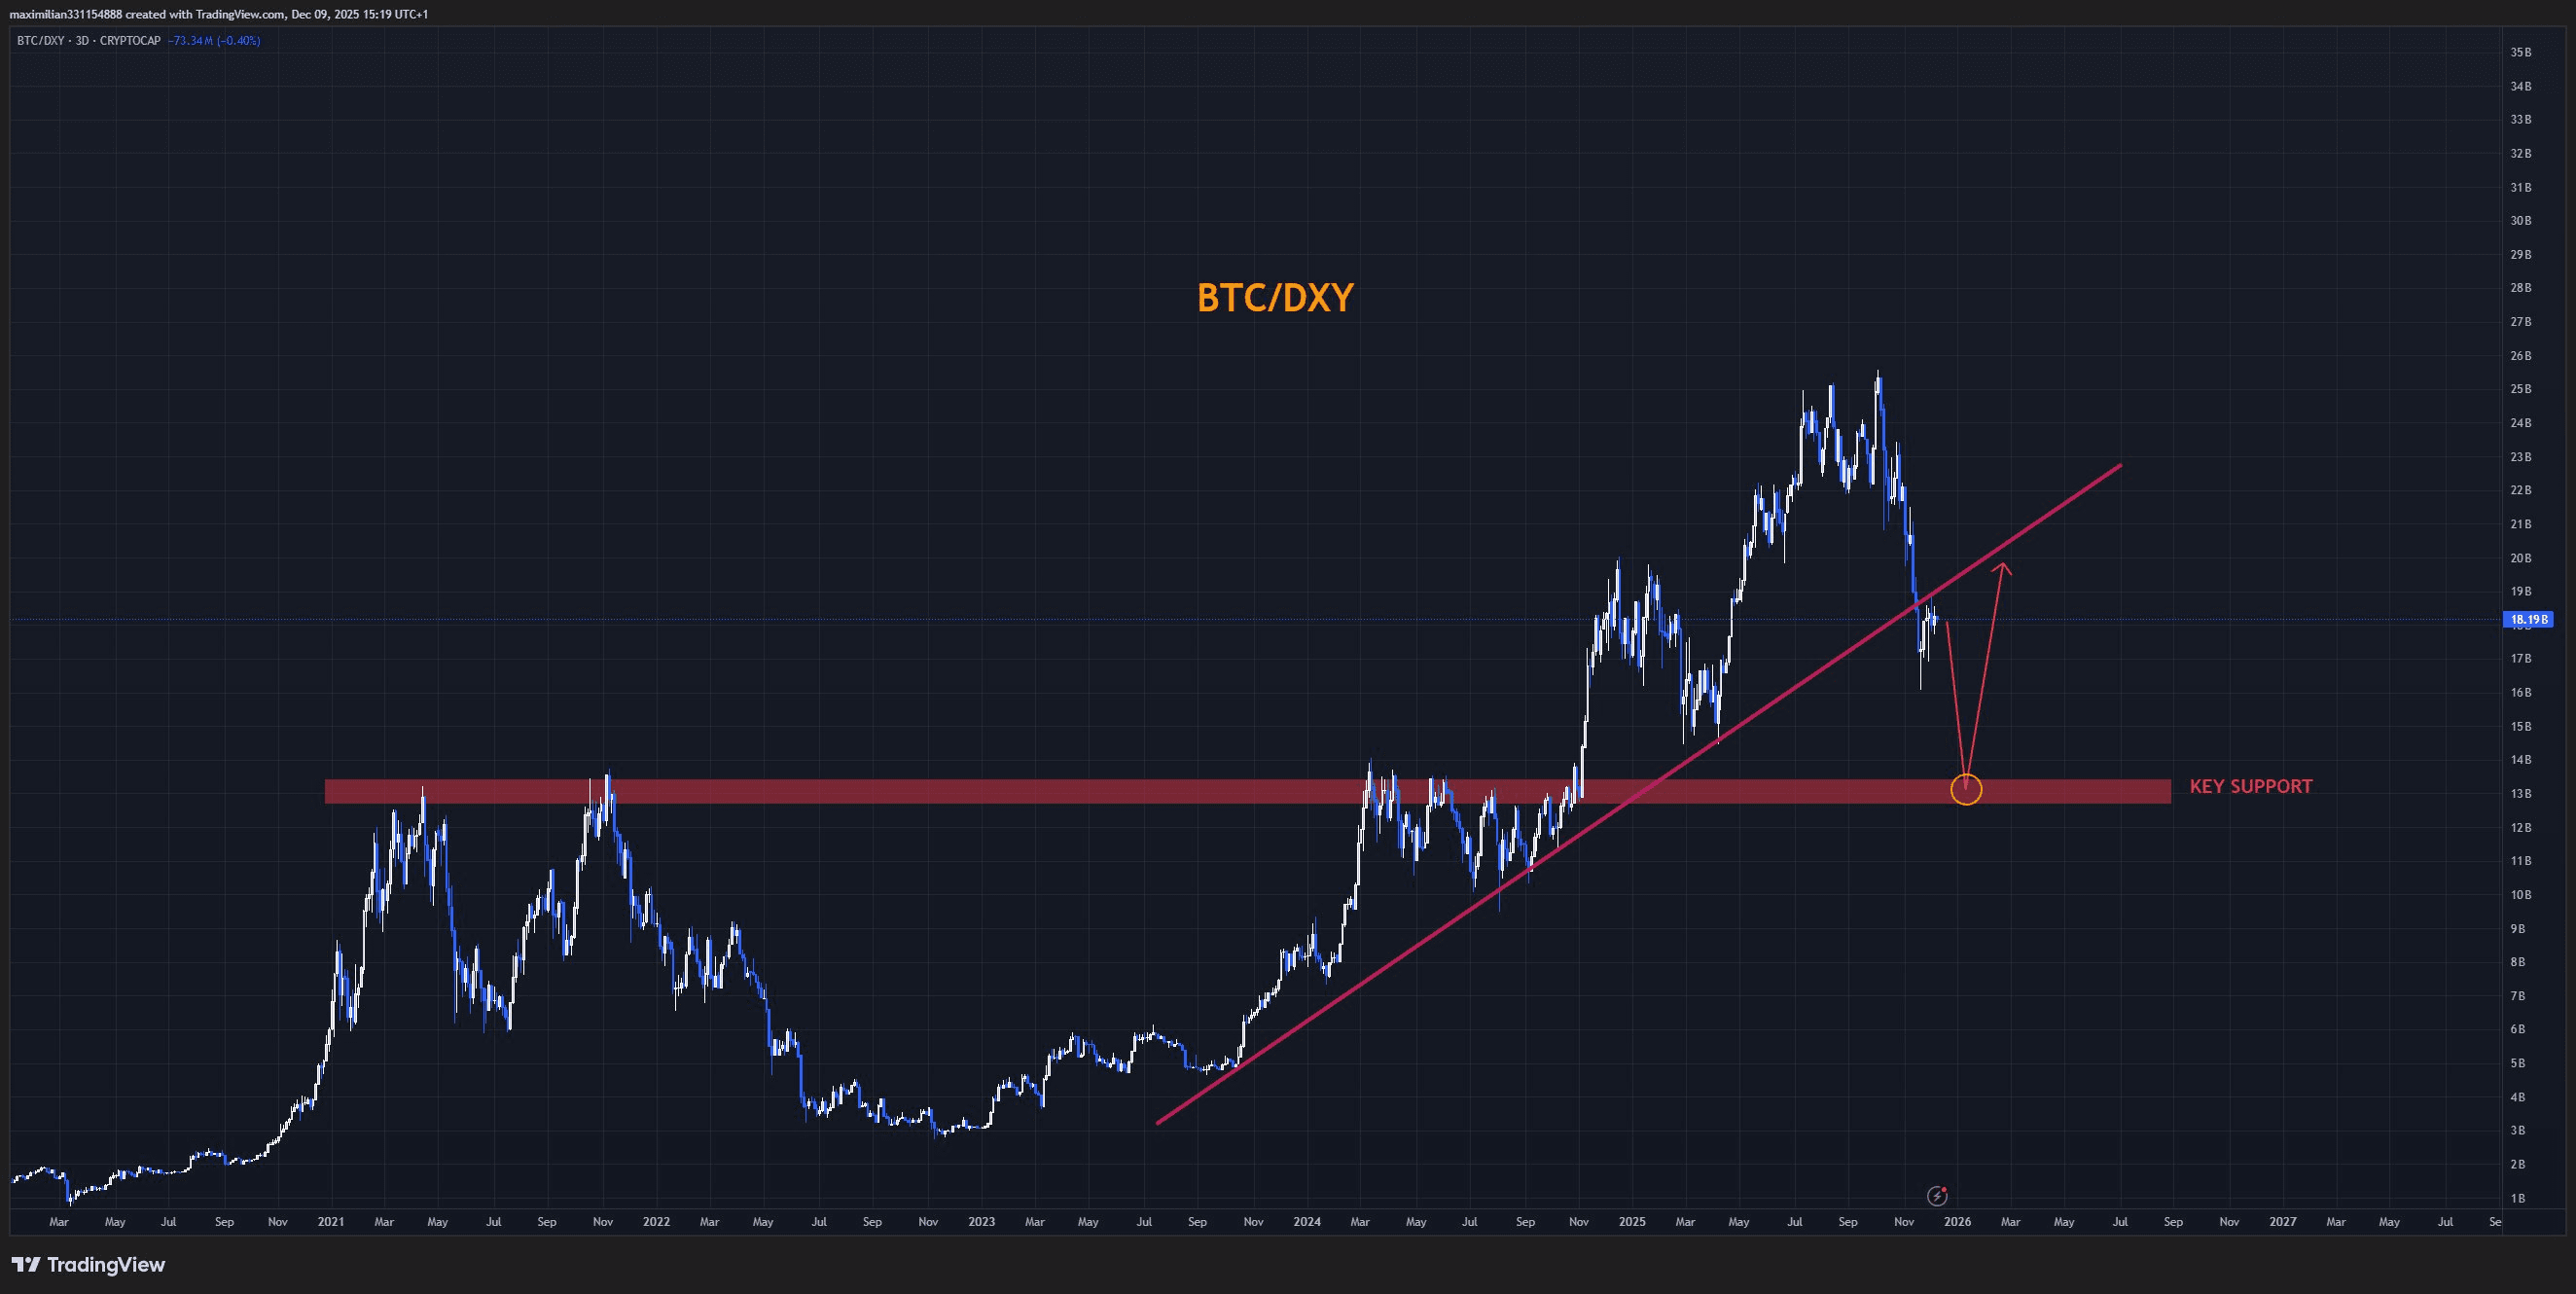
BTC/DXY is showing that a peak is being established and a breakdown has occurred along with the next support area becoming apparent. For newcomers, just remember one thing: this chart often leads BTC, so it's worth monitoring whenever the market enters a sensitive phase like now.
