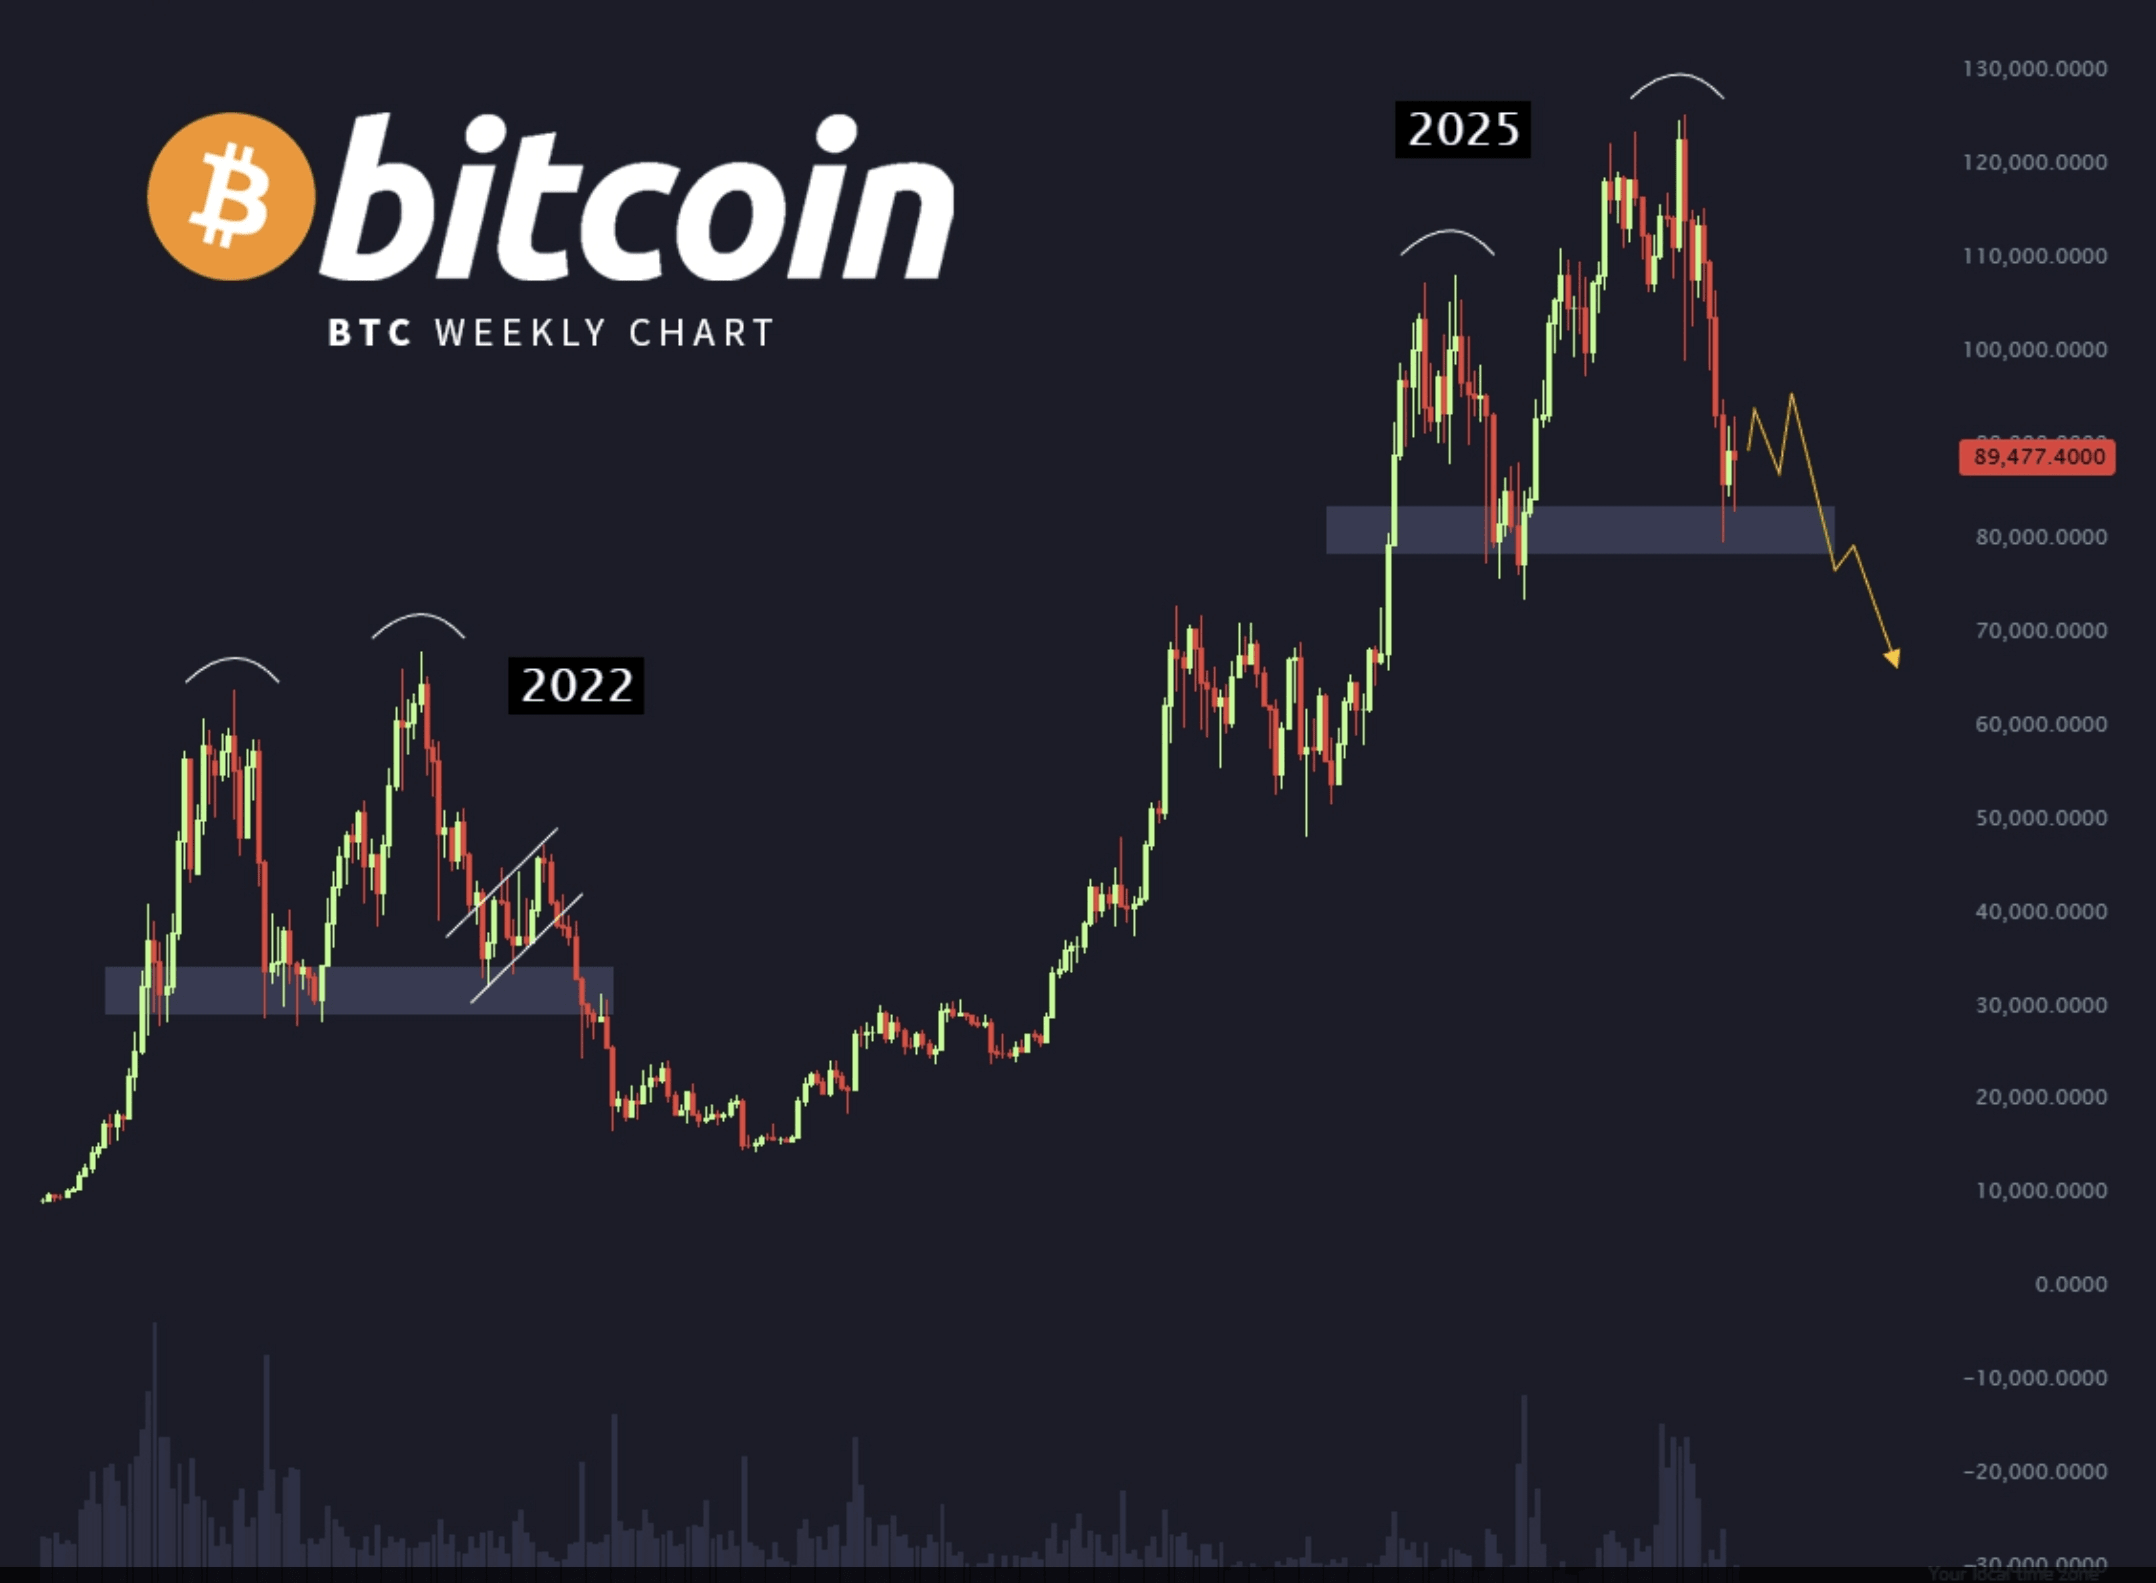
Double Top model on the weekly timeframe
The image compares between:
🔹 2022
A double top has formed
then a violent collapse from 69k to 15k
and the break was due to the fall of the horizontal gray support area
🔹 2025 (the current expected scenario)
Bitcoin formed a new double top between 110k – 120k
and broke the sloping support line
and now it approaches strong horizontal support (area 88k – 90k)
And if the area breaks → a similar drop is expected as in 2022.
🧠 2. Is the scenario scientifically logical? (Yes... but with conditions)
There is a significant similarity between 2022 and 2025 in terms of:
✔ High buying saturation
✔ Similar price structure (double top)
✔ Weak buying volume
✔ Break of an upward trend
But...
🔸 There is a very important difference:
In 2022, there was neither ETF nor institutional entry nor an upcoming Halving.
As for now:
ETF funds inject billions
The supply decreases after halving
Founders buy any dip
The Fed is heading towards a reduction
For this reason, even though the model exists technically, the depth of the drop will not be like in 2022.
📉 3. What does the chart exactly say?
The picture suggests this scenario:
1. BTC is currently around 89k
2. It will bounce slightly upwards
3. Then it will drop to test the gray area (82k–88k)
4. If broken → the next target 70k–75k
5. Then a huge new rise begins that lasts for years
📌 The analysis is very professional, but it does not mean a complete collapse... rather a 'correction within a bullish market.'
🔥 4. Should you be afraid?
No.
This is normal in a Bitcoin cycle.
In every upward cycle, you see:
Big peak → Strong correction → Accumulation → Upward explosion
And for the record:
Every Bitcoin cycle drops between 25% to 40% before the final surge.
💡 5. The most important area in the chart – the gray area
This area = the lifeline for the upward trend.
📌 If it holds above 88k–90k →
Bitcoin rises to 120k, 140k, and possibly 180k.
📌 If the area breaks strongly →
It will drop to 70k–75k → Golden buying area.
🎯 6. My final professional opinion
The scenario in the picture:
✔ Logical in terms of 'price behavior'
✔ Not exaggerated
✔ Represents a healthy correction, not a catastrophic collapse
✔ Closer to a 'Shakeout' scenario rather than a Bear Market