
 This is a detailed, professional, and sequential analysis of the Bitcoin (BTC/USD) market using Smart Money Concepts (SMC), integrating technical structure with the current fundamental drivers for institutional-level decision making.
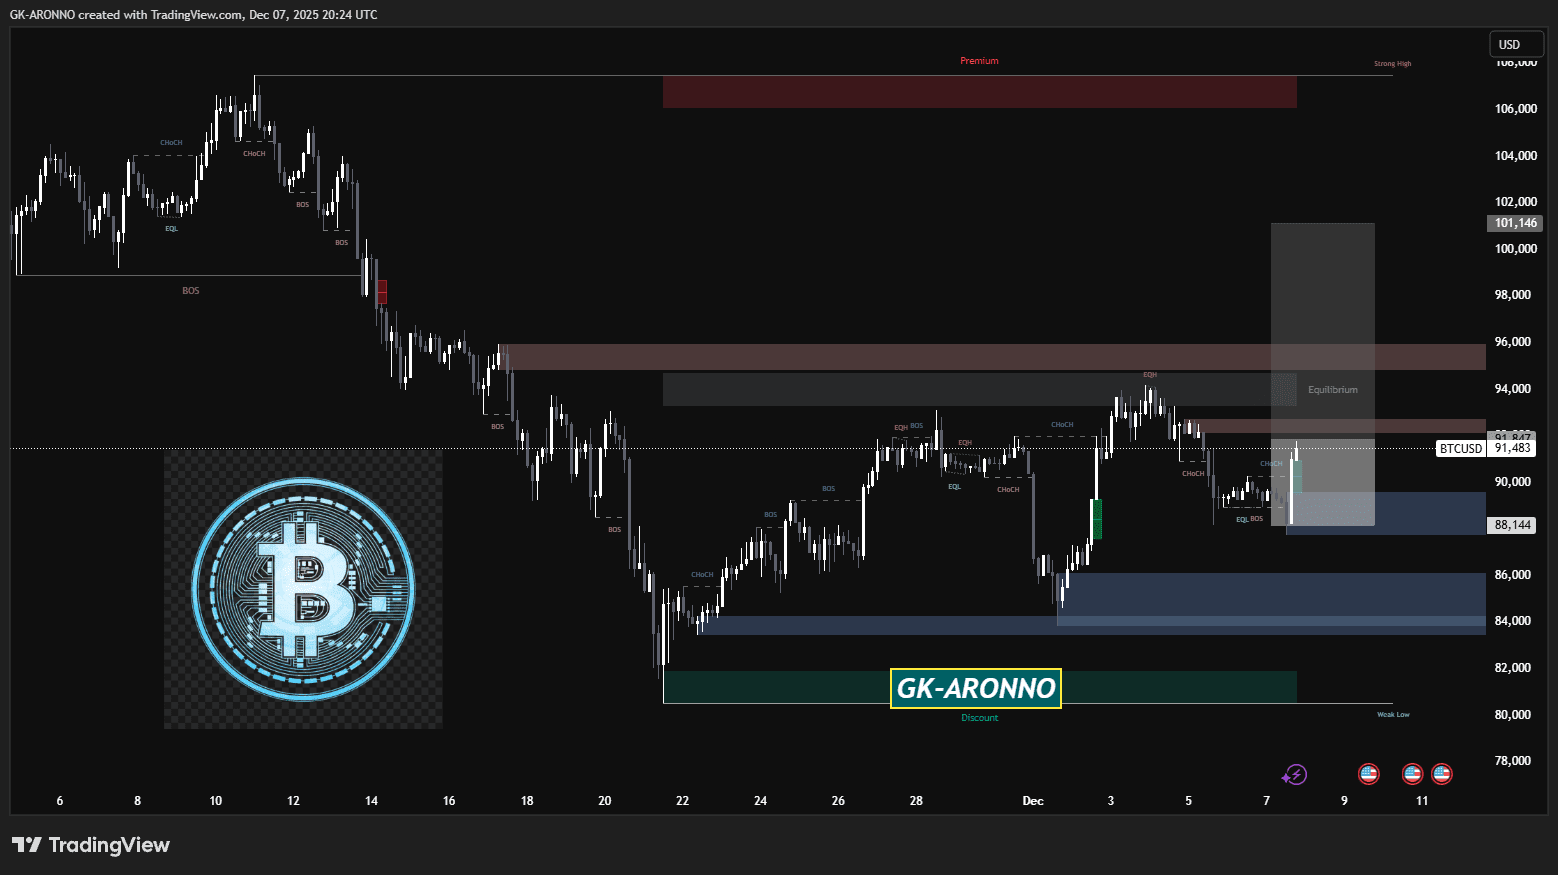
The current price action is characterized by short-term downward pressure within a medium-term consolidation phase, following a failure to sustain the previous peak near $100,000. Institutional traders are likely positioning themselves for a high-impact liquidity event driven by upcoming monetary policy announcements.
---
1. ⚙️ Market Structure Analysis from Top to Bottom (Daily/4 Hour)
The SMC strategy begins with top-down analysis to determine the main trend and identify areas of institutional activity across different time frames.
A. Market Structure on the Higher Time Frame (Daily)
*Overall Trend:** The medium-term trend remains bullish (higher highs and higher lows) despite the recent pullback from the $100,000 area.
*Major High (HH):** $\approx \$100,000$. This is the previous major high.
*Major Low (HL):** The current structure on the short-term is about $\approx \$80,742$ (monthly low/13-week low).
*Current Action:** Price is consolidating below the pivot point (PP) $\approx \$90,053$ and the 40-day moving average ($\approx \$100,365$). Price action indicates that there is a pullback or consolidation underway, as confirmed by the short-term trend that is in a descending channel.
B. Identifying SMC Structure
*Bearish Demand Block (OB) / Supply Area:** Price range between $\approx \$94,000$ and $\approx \$96,090$. This is the origin point for the recent sharp downward slippage, where institutional sell orders were filled. This area represents dense supply and acts as immediate key resistance.
*Bullish Demand Block (OB) / Demand Area:** Range between $\approx \$84,000$ and $\approx \$86,000$. This area is the potential point for institutional accumulation, aligning with major support at the second support point ($\approx \$85,799$) and the bottom of the support channel at $84,000$.
---
2. 🌊 Liquidity Analysis & Institutional Targets
Smart money (SM) targets high liquidity areas - where there is a cluster of retail stop-loss orders (often placed above or below obvious highs/lows) - to fill its large orders with minimal slippage.
A. Liquidity Target from the Sell Side (SSL)
*Location:** Directly below the previous swing low and the short-term trading range.
*Target Area:** $\approx \$83,204$ to $\approx \$84,282$ (Pivot point 3 support/price 3 standard deviations support).
*Scenario:** The drop to this area is a high-probability liquidity sweep (stop hunting). Institutional buyers can collect liquidity from retail stop losses before a significant upward movement begins (classic accumulation maneuver).
B. Liquidity Target from the Buy Side (BSL)
*Location:** Above the current highest consolidation point.
*Target Area:** $\approx \$95,601$ to $\approx \$97,253$ (Pivot points 2 and 3 resistance).
*Scenario:** The movement to this area will remove liquidity from retail short positions, providing fuel for continued short-term selling from the bearish demand block, or paving the way for a major break of structure (BOS) above $100,000.
---
-Wise trading plan (4-hour/1-hour execution)
The trading plan is organized around a sequence of high-probability SMC events, prioritizing movement to remove liquidity before directional commitment.
Liquidity Sweep (expecting short-term movement)
*Action:** Monitor the price for a downward impulsive movement (displacement).
*Event:** Price breaks support at $\approx \$87,500$ and sweeps SSL below $\approx \$85,799$ (Pivot point 2 support) and continues toward the demand area ($\approx \$84,000$).
*Confirmation:** Look for a Change of Character (ChoCH) to return upward on a lower time frame (e.g., 15-minute chart) once price enters the demand area $\approx \$84,000$. A ChoCH indicates a potential reversal when smart money steps in to buy.
Trend continuation (long trade setup)
*Entry:** Long once ChoCH is confirmed within the demand area ($\approx \$84,000$ - $\approx \$86,000$).
*Stop Loss:** Safely placed below the lowest final point of liquidity sweep (i.e., below $\approx \$83,204$).
*Take Profit 1 (TP1):** Bearish demand block / supply area at $\approx \$94,000$ to $\approx \$96,090$. Price is likely to react here as institutional short positions are defended.
*Take Profit 2 (TP2):** BSL above $\approx \$97,253$.
Confirmation of Break of Structure (BOS)
*Action:** If price breaks and continues to close above the demand block at $\approx \$96,090$ and the highest swing point at $\approx \$100,000$ (BOS) on the daily chart.
*Outcome:** This confirms a strong resumption of the bullish trend in the medium term and indicates directional commitment from institutional buyers. Subsequent pullbacks can be bought aggressively, targeting the highest level in 52 weeks at $\approx \$126,184$.
✅ Trade here at $BTC
