Bitcoin’s short-term trend is increasingly being shaped by what’s happening inside Binance — the world’s largest crypto exchange by trading volume. Three critical indicators currently signal rising sell pressure, shifting liquidity behavior, and a market preparing for heightened volatility. Together, they may determine whether BTC can defend its major support zone or faces a deeper correction ahead.
🐋 1. Rising BTC Whale Ratio Signals Potential Distribution
The Exchange Whale Ratio — which measures the share of BTC inflows controlled by large holders — has surged to 0.47 across all exchanges, indicating that whales are aggressively moving Bitcoin onto trading platforms.
On Binance specifically, the 14-day EMA of the Whale Ratio has climbed to 0.427, its highest level since April. Historically, spikes in this metric often precede major distribution phases, as large players prepare to sell into liquidity.
With Bitcoin still struggling to break decisively above the $93,000–$96,000 resistance zone, this on-chain behavior suggests that sell-side pressure is building at higher price levels. If this trend continues, BTC is likely to remain range-bound or revisit key support before any sustainable breakout occurs.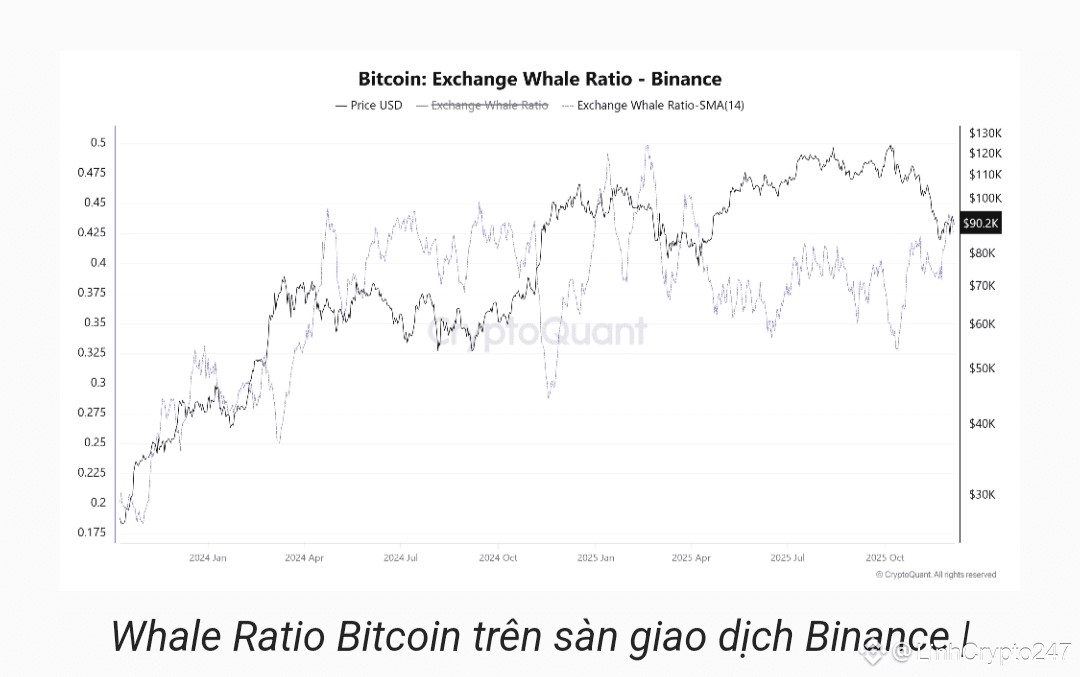
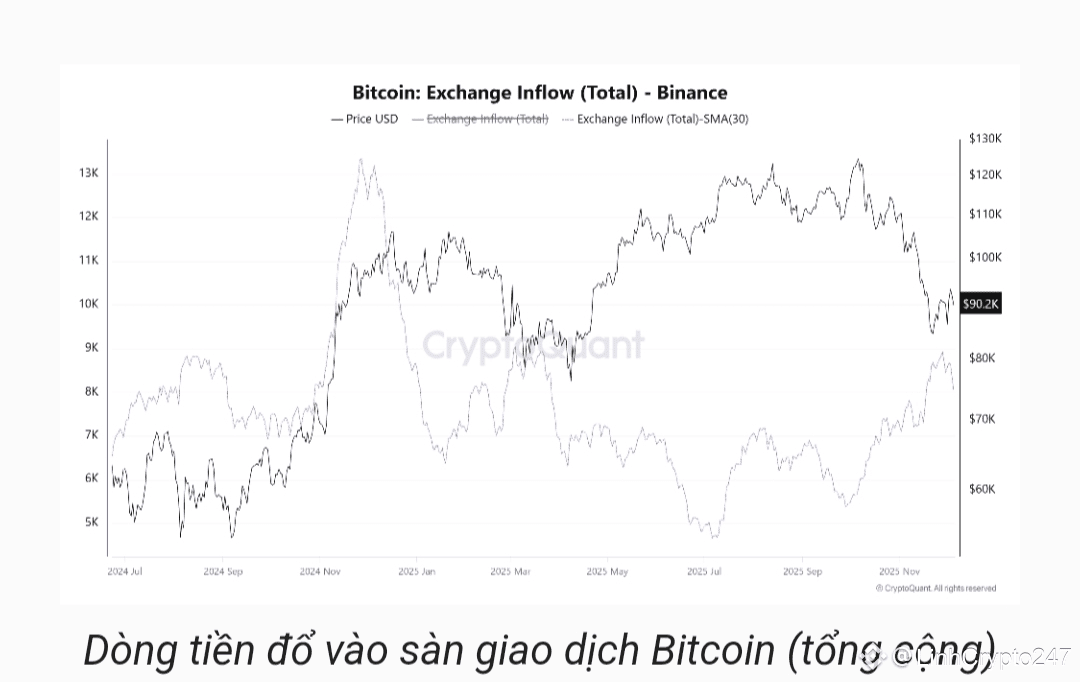
📥 2. BTC Inflows to Binance Hit Annual High – Correction Risk Rising
On-chain data shows that the 30-day SMA of BTC deposits into Binance reached 8,915 BTC on November 28, nearly matching the annual peak of 9,031 BTC recorded on March 3.
Historically, such surges in exchange inflows have often preceded sharp price corrections, as they represent growing intent to sell rather than long-term holding.
This behavior reflects a gradually shifting market psychology:
Investors appear to be de-risking after the recent rally, transferring BTC onto Binance where liquidity is deepest.
As BTC attempts to hold above the $90,000–$93,000 range, this growing on-exchange supply could act as a significant overhead drag. Until this excess supply is absorbed, upward momentum is likely to remain limited.
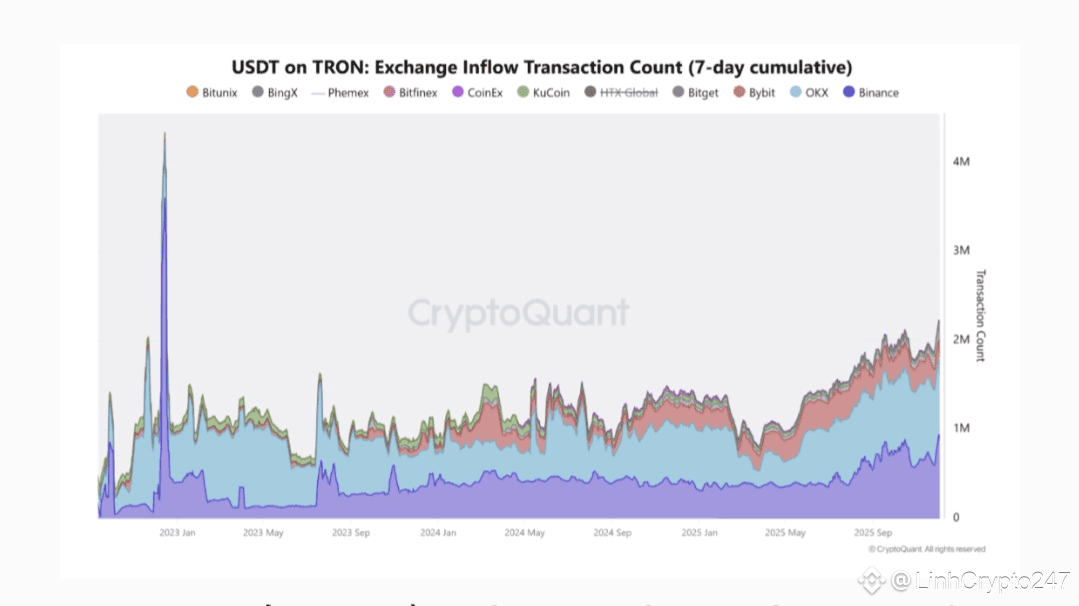
💵 3. Massive Spike in USDT Deposits Signals Incoming Volatility
Over the past 7 days, Binance recorded an astonishing 946,000 USDT deposit transactions, far surpassing:
OKX: 841,000
Bybit: 225,000
A surge in stablecoin inflows typically means traders are preparing capital for rapid execution — either to aggressively buy dips or to flip positions during sharp volatility.
However, given:
Rising whale sell pressure
Increasing BTC exchange inflows
This USDT accumulation is more likely positioned for short-term reactive trading, not long-term accumulation.
In unstable market environments, such large stablecoin liquidity often amplifies volatility and accelerates price expansion or breakdown.
⚠️ Key Scenarios Ahead
📉 Bearish Scenario:
If BTC loses the $90,000 support, the stacked sell pressure and deep liquidity on Binance could trigger a fast-moving downside cascade, potentially driving price toward lower demand zones.
📈 Bullish Scenario:
If Bitcoin successfully defends the $90,000–$93,000 support zone, the massive USDT reserves waiting on the sidelines could rapidly convert into market buys, fueling a sharp rebound rally.
✅ Final Takeaway
All three Binance-based signals —
✔️ Whale Ratio
✔️ BTC Exchange Inflows
✔️ USDT Deposit Explosion
— are aligning to warn that Bitcoin is approaching a decisive volatility phase. Whether this results in a breakdown or a violent upside reversal depends entirely on how price reacts around the $90K psychological support level.
💬 Do you think BTC will defend $90,000 or break lower? The next big move is closer than it looks.
👉 Follow me for daily Bitcoin & altcoin market insights, real-time on-chain signals, and professional trade breakdowns. Let’s navigate the market together.
#Bitcoin #BTC #Binance #CryptoMarket


