📊 Bitcoin (BTC) Market Analysis — 6
December Update
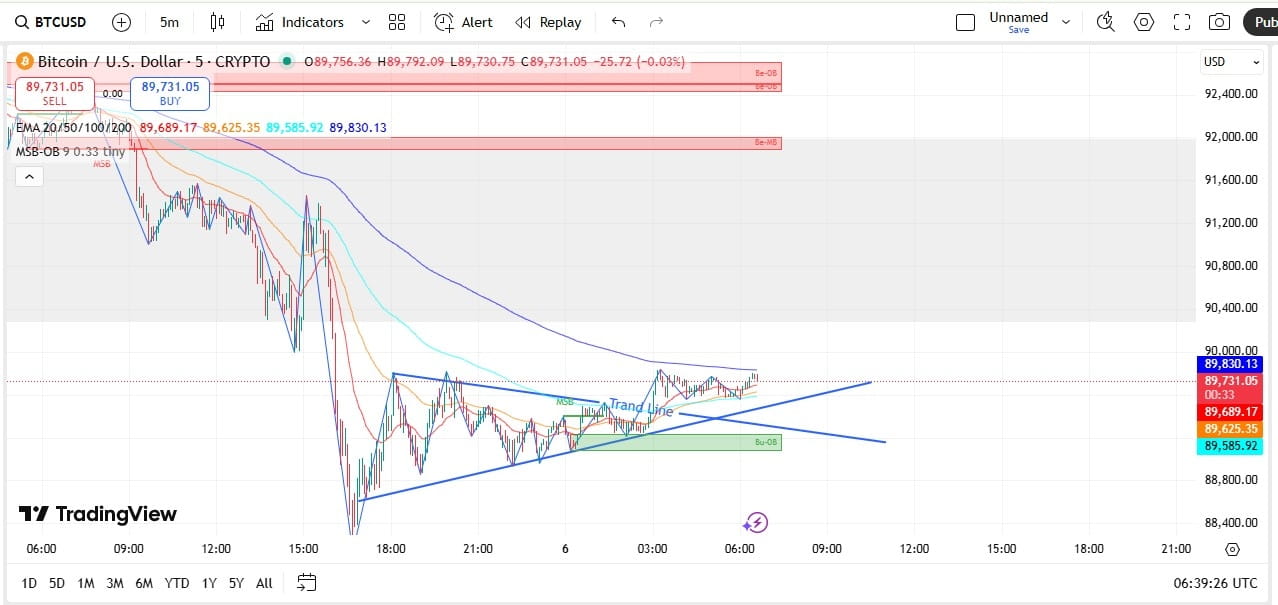
Today's BTC market has formed an important symmetrical triangle/compression on the 30m and 5m charts
zone. In the past
few hours, the price has come down from a clear downtrend and is now in a compression phase, where a breakout is very close.
🔻 Recent Price Action
Price has rejected from the red sell-OB of the 92K zone and created a strong down
move.Going down
Price Buy-OB (89.5K – 89.6K) has respected the zone.In the market
multiple MSB (Market Structure Break) has been seen which confirmed the short-term
trend to the downward direction.
🔹 30m Chart Observation
Price is below EMA 20/50/100
Thus, the market is still in a bearish structure.Below
the bullish order block is reacting and forming a price triangle.Of the breakout
Before low volatility—larger
The probability of movement is higher.
🔹 5m Chart Observation
A clear Ascending Trendline has formed on the 5m chart.
Price
Now trying to go up holding this trendline.However, above the 89.8K – 90K zone is a
Important resistance where supply is high.
📌 Key Levels to Watch
Resistance Zone
89,800 – 90,200 (Liquidity + EMA confluence + small sell-OB)
From here
If there is a rejection, the chance to go down again is higher.
Support Zone
89,500 – 89,600 Buy-OB
this zone
If broken again 88,800 – 89,000 drop is possible.
📈 Possible Scenarios
🚀 Bullish Breakout
If price
clears a break above the triangle range 90K+
gives,
then
in the short-term, a push up to 90.5K – 91K can be seen.
It can be observed.
📉 Bearish Breakdown
If
the trendline breaks below,
then BTC can easily slide to 89K → 88.5K.
📌 Summary
BTC is now in a
compression zone and can have a big move in either direction. Below, Buy-OB is strong, but until the resistance at 90K is not broken,
there is no bullish confirmation.
For traders:
The risk of entering a trade without breakout confirmation is high.