🚀 **$ACE/USDT – 12H BREAKOUT ALERT | Trend Shift Confirmed**
$ACE just printed one of its strongest daily candles since launch —
and the chart is signalling a **high-probability upside continuation** in the next 12 hours.
Here’s the breakdown that matters:
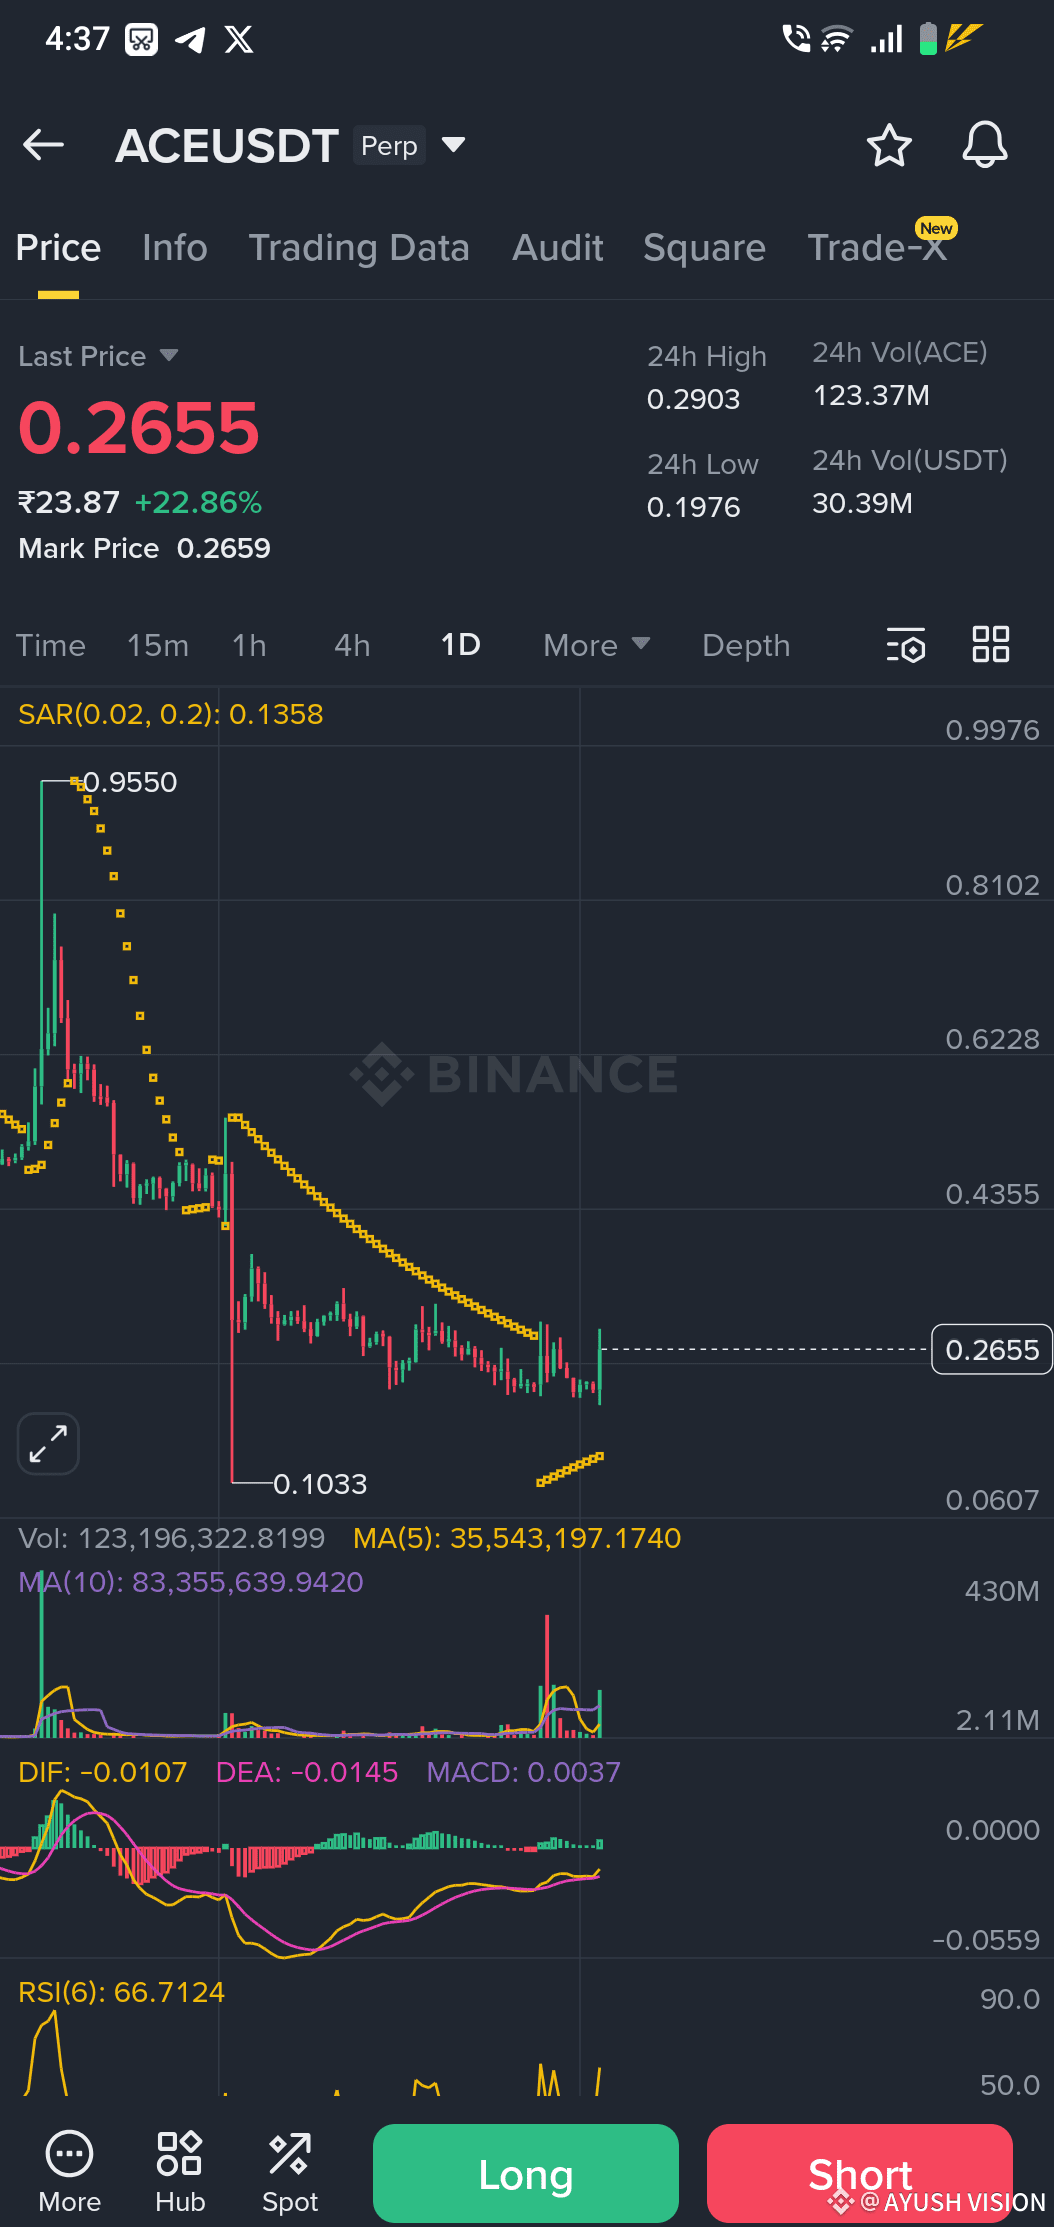
🔥 **1. SAR Trend Reversal Loading**
After weeks of downtrend, price has finally smashed into the SAR band.
A SAR flip here = official trend reversal.
Historically, $ACE pumps right after this signal.
📈 **2. MA(5) Just Turned Up – First Time in the Entire Range**
This early moving-average curl is EXACTLY what we see before momentum ignition.
MA(10) flattening confirms sellers are out of fuel.
💥 **3. MACD Just Crossed Into Bullish Territory**
MACD histogram is green again.
Signal lines curling up = fresh momentum.
This is a textbook pre-breakout setup for $ACE.
⚡ **4. RSI at 66 = Strength Without Overheat**
RSI is rising but NOT overbought.
This is the zone where $ACE usually accelerates the fastest.
📊 **5. Volume Spike Confirms Real Demand**
The breakout wasn’t random.
Buyers hit the orderbook with conviction — volume > recent average on $ACE.
---
🎯 **MY 12-HOUR DIRECTIONAL CALL: BULLISH**
$ACE shows a complete momentum shift.
If price holds above **0.245–0.255**, upside continuation is the highest-probability scenario.
**Targets to watch:**
- **TP1:** 0.285
- **TP2:** 0.300
- **TP3 (Aggressive):** 0.325
**Invalidation (Stop Zone):**
Below **0.228**, $ACE momentum weakens.
---
🧠 **Summary:**
$ACE has flipped from accumulation → breakout phase.
Momentum indicators, SAR structure, and volume are all aligned.
If the support zone holds, the next 12 hours can bring **another strong leg up**.
#ACE #ACE #Binance
$ETH e #CryptoAnalysis #BreakoutAlert #TradingCommunity


