The Bitcoin (BTC) price is approaching the apex of a wedge formed by a descending trend line and a major ascending trend line. If it breaks upward, the bull market will continue; if it breaks downward, it may enter a bear market. Which situation will it be?
The falling wedge pattern has at most one week left—will it be up or down next?
The BTC price must break out or drop before the end of next week, and it is likely to happen before the price reaches the apex of the wedge, as historically, Bitcoin tends not to wait until the end of triangles and wedges to take action.
If the price breaks below the wedge area and confirms the break, it would be a serious blow and a rather definitive signal of Bitcoin entering a bear market, especially since Bitcoin has been in a bear market since its historical high of 126,000 USD.
On the other hand, if the price breaks above the wedge top and confirms the rise, there may still be a possibility for the bull market to continue. Nevertheless, the bulls still need to make considerable efforts to revive market confidence.
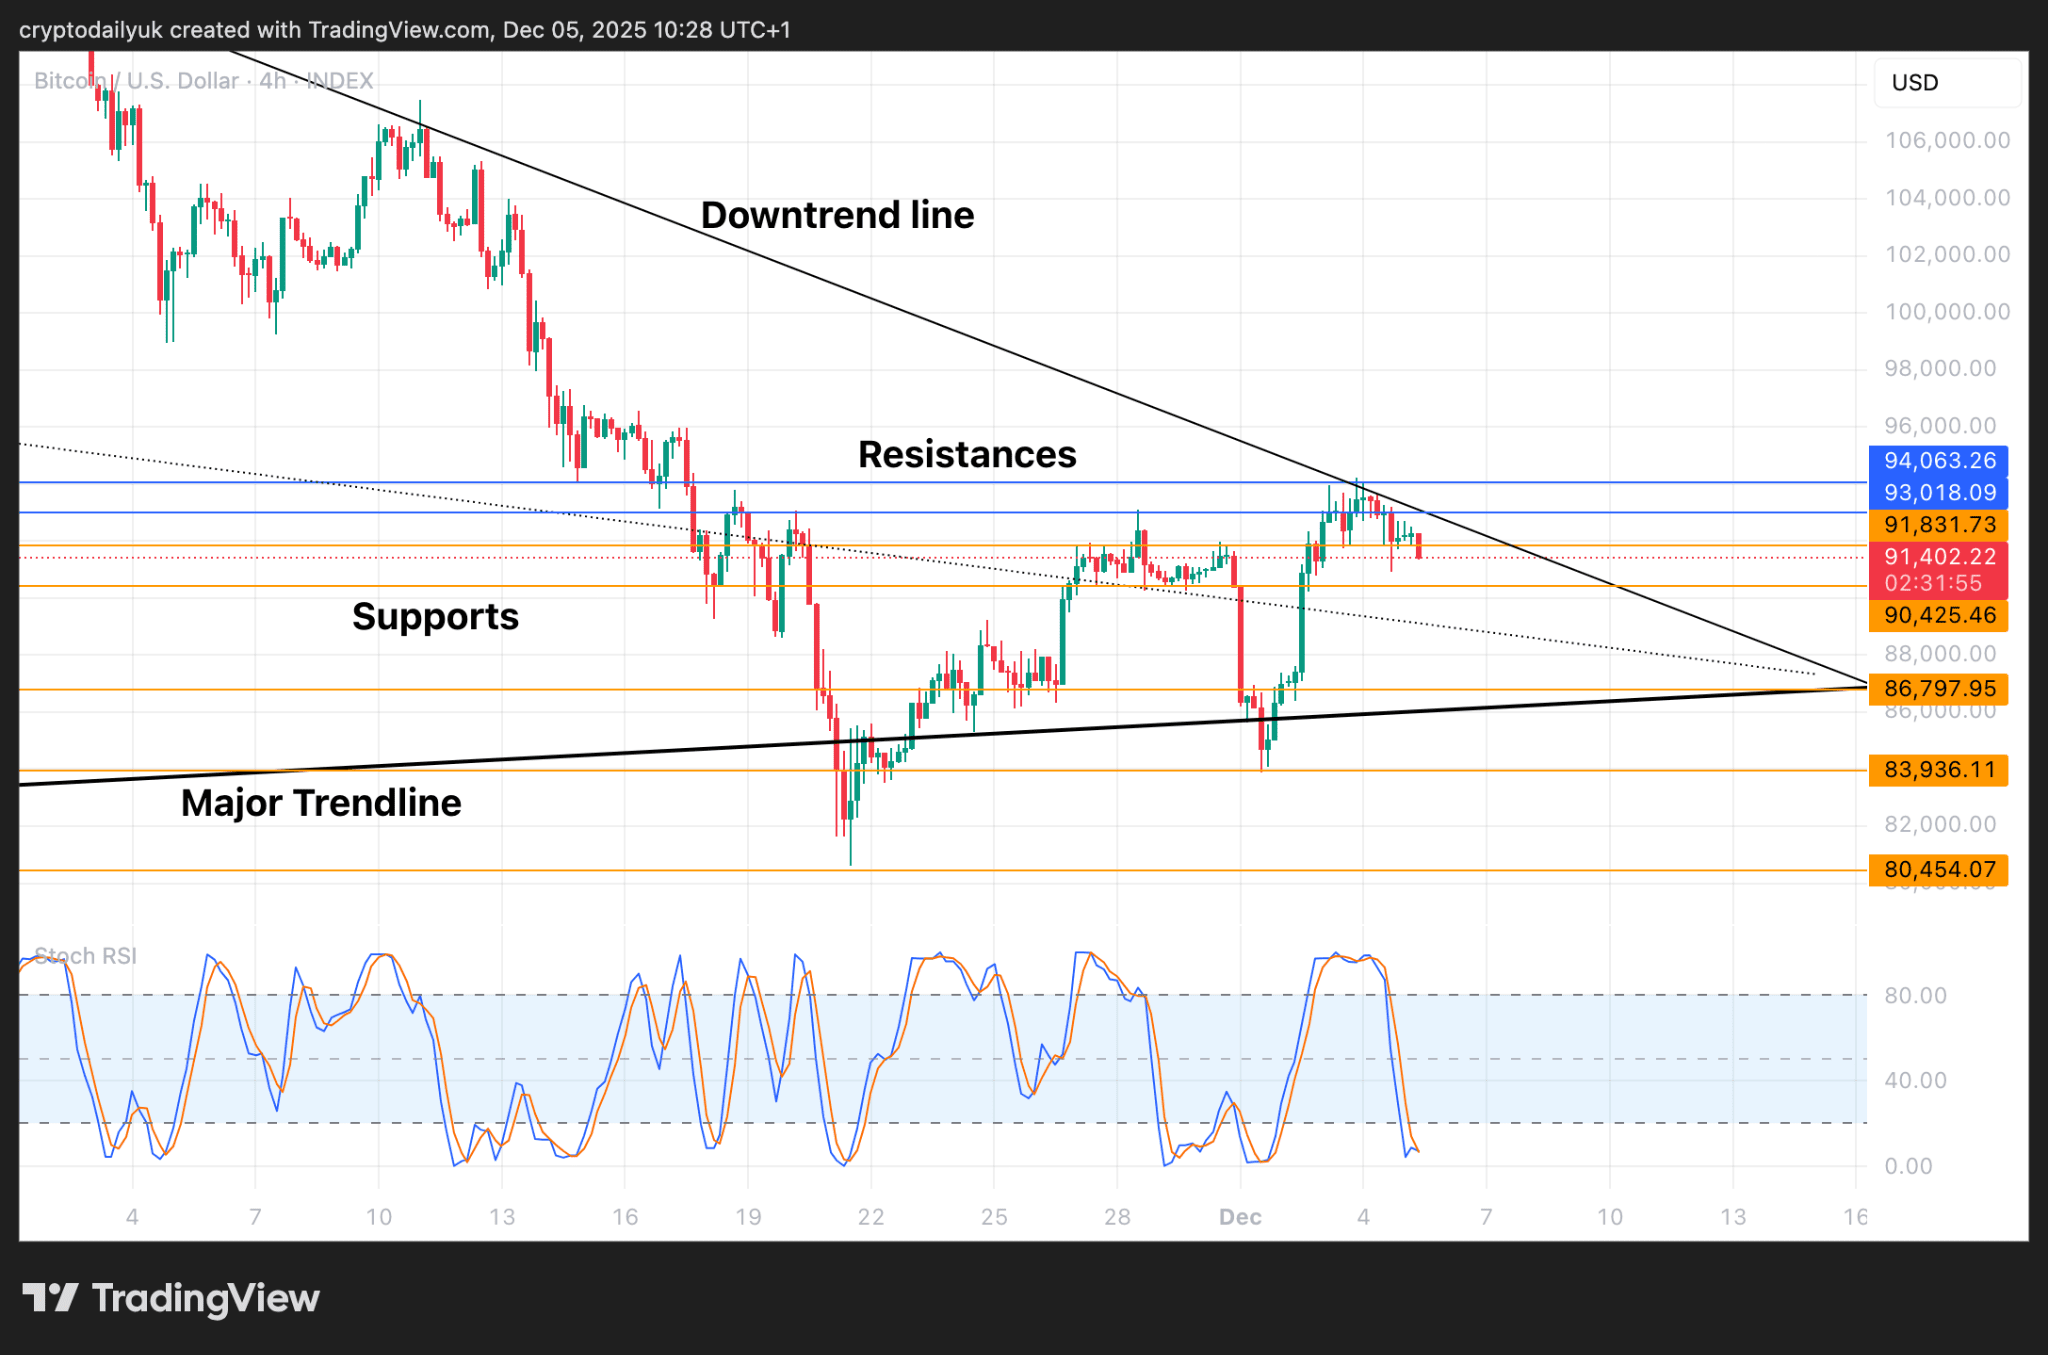
At present, Bitcoin's price performance is quite robust in the short term. If the current reversal touches the support level of 90,000 USD or the descending trend line (as shown by the dashed line in the chart), the price may rebound from these two positions. Currently, the possibility of a breakout seems greater than that of a breakdown.
In other words, if the price falls to the main trend line and breaks below it, confirming the trend on the other side, all bullish bets will be invalidated.
The next rebound may be a critical moment.
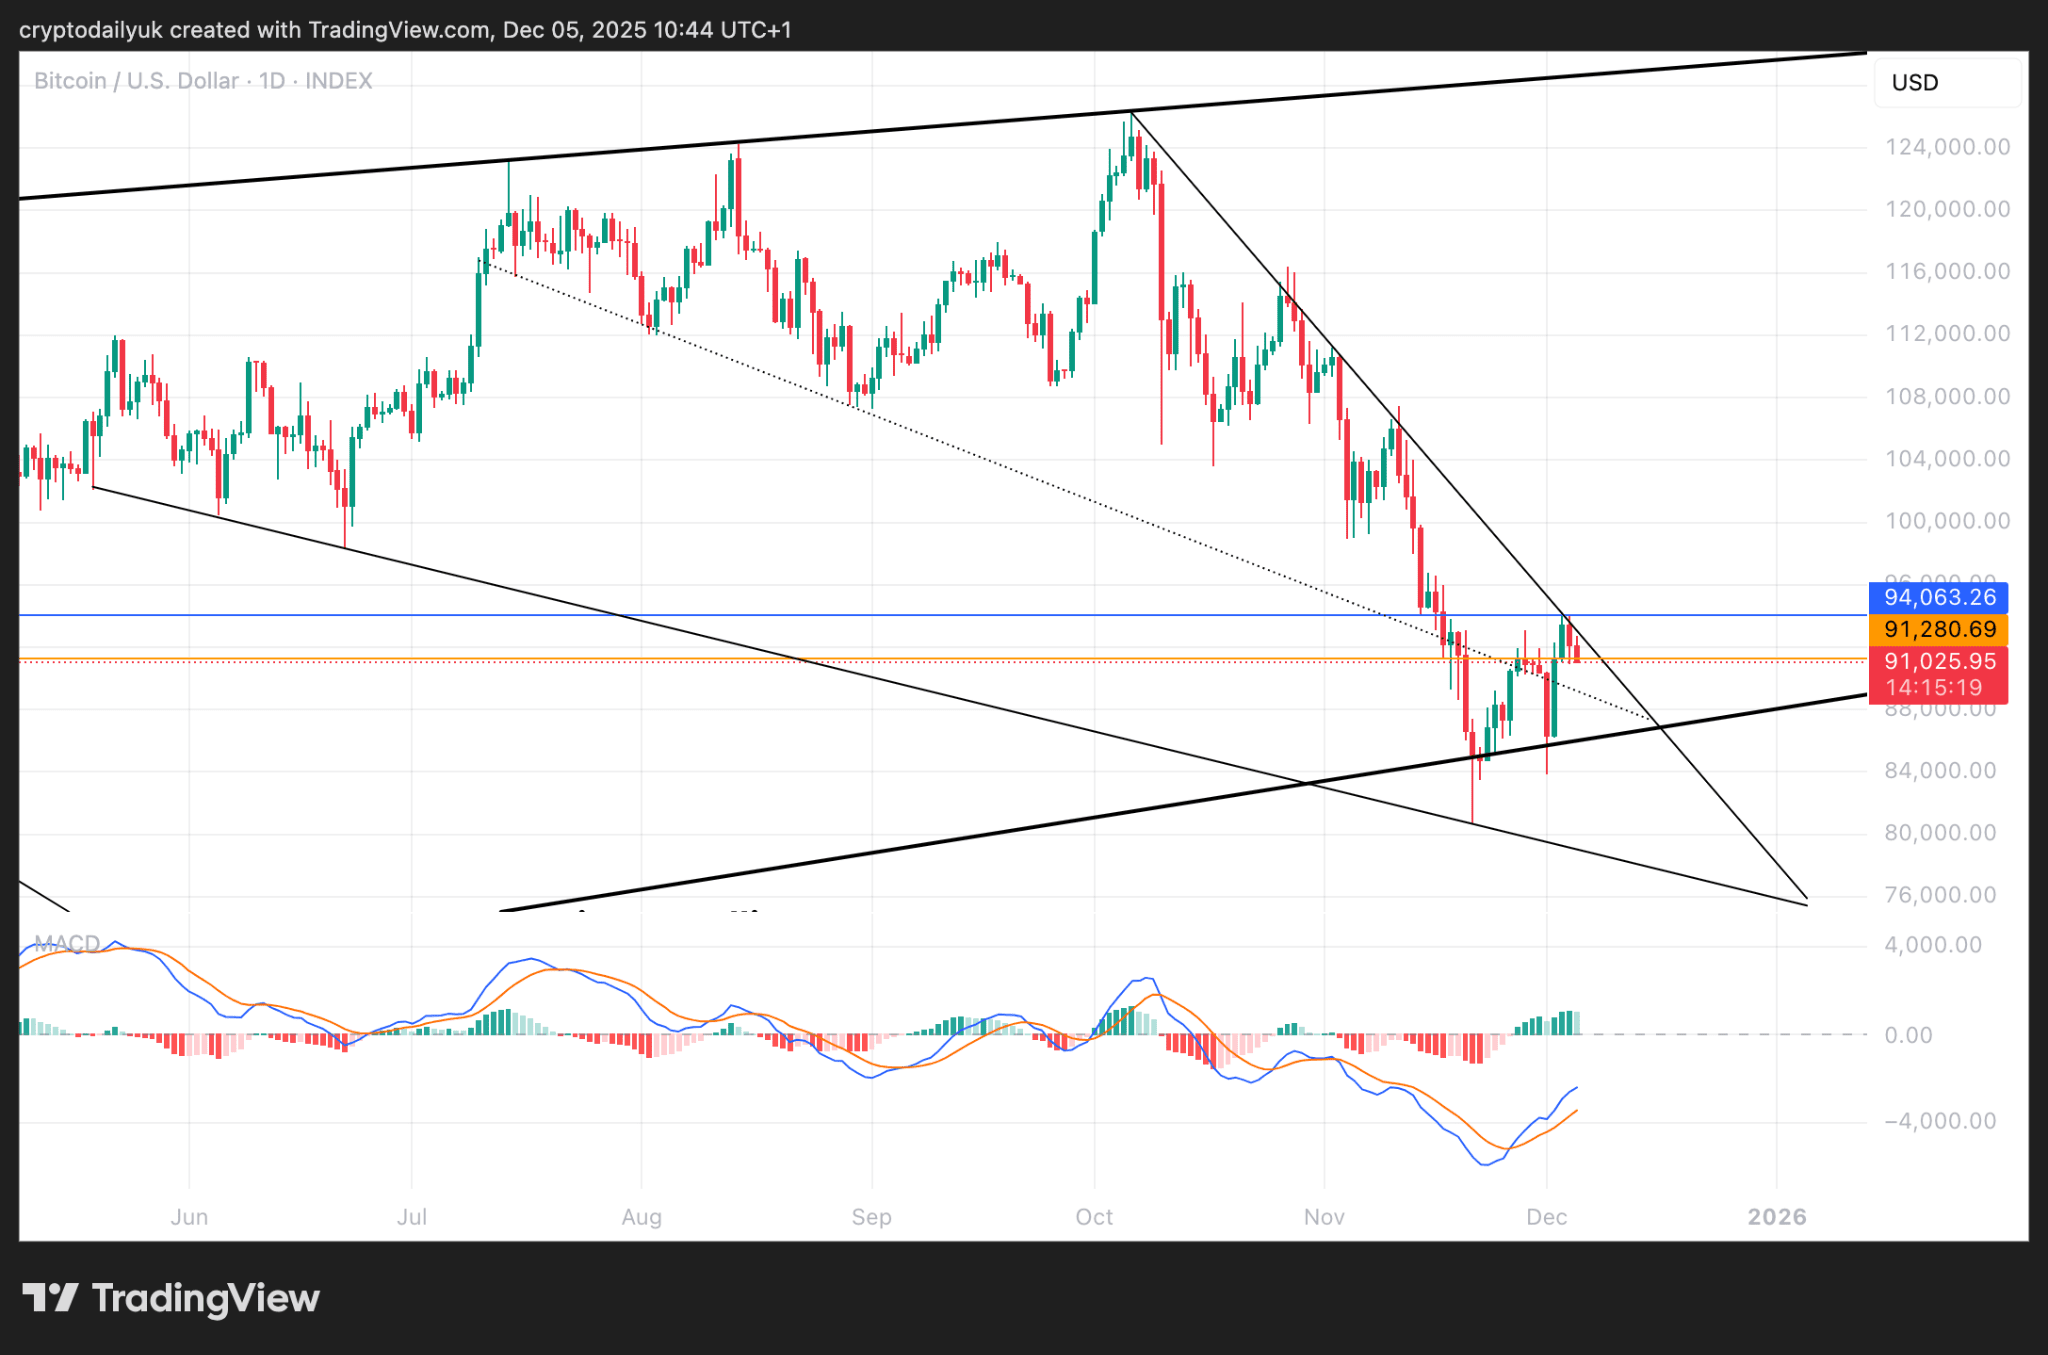
The daily chart fully displays the descending wedge pattern. The price has dropped to around 80,000 USD, providing additional support for the validation of the wedge pattern. Now, the price will face the risk of breaking out upward or downward. Nevertheless, considering the importance of the main ascending trend line, this trend line is more likely to prevail than the upper trend line of the wedge pattern.
Therefore, the price of Bitcoin may further decline, but once the next rebound occurs, it may help the price break free from the wedge top.
At the bottom of the chart, the MACD indicator line shows the lowest decline in Bitcoin's history. It is currently rising, and the histogram is shown in green, indicating that this trend may continue for a long time.
94,000 USD is the major resistance level.
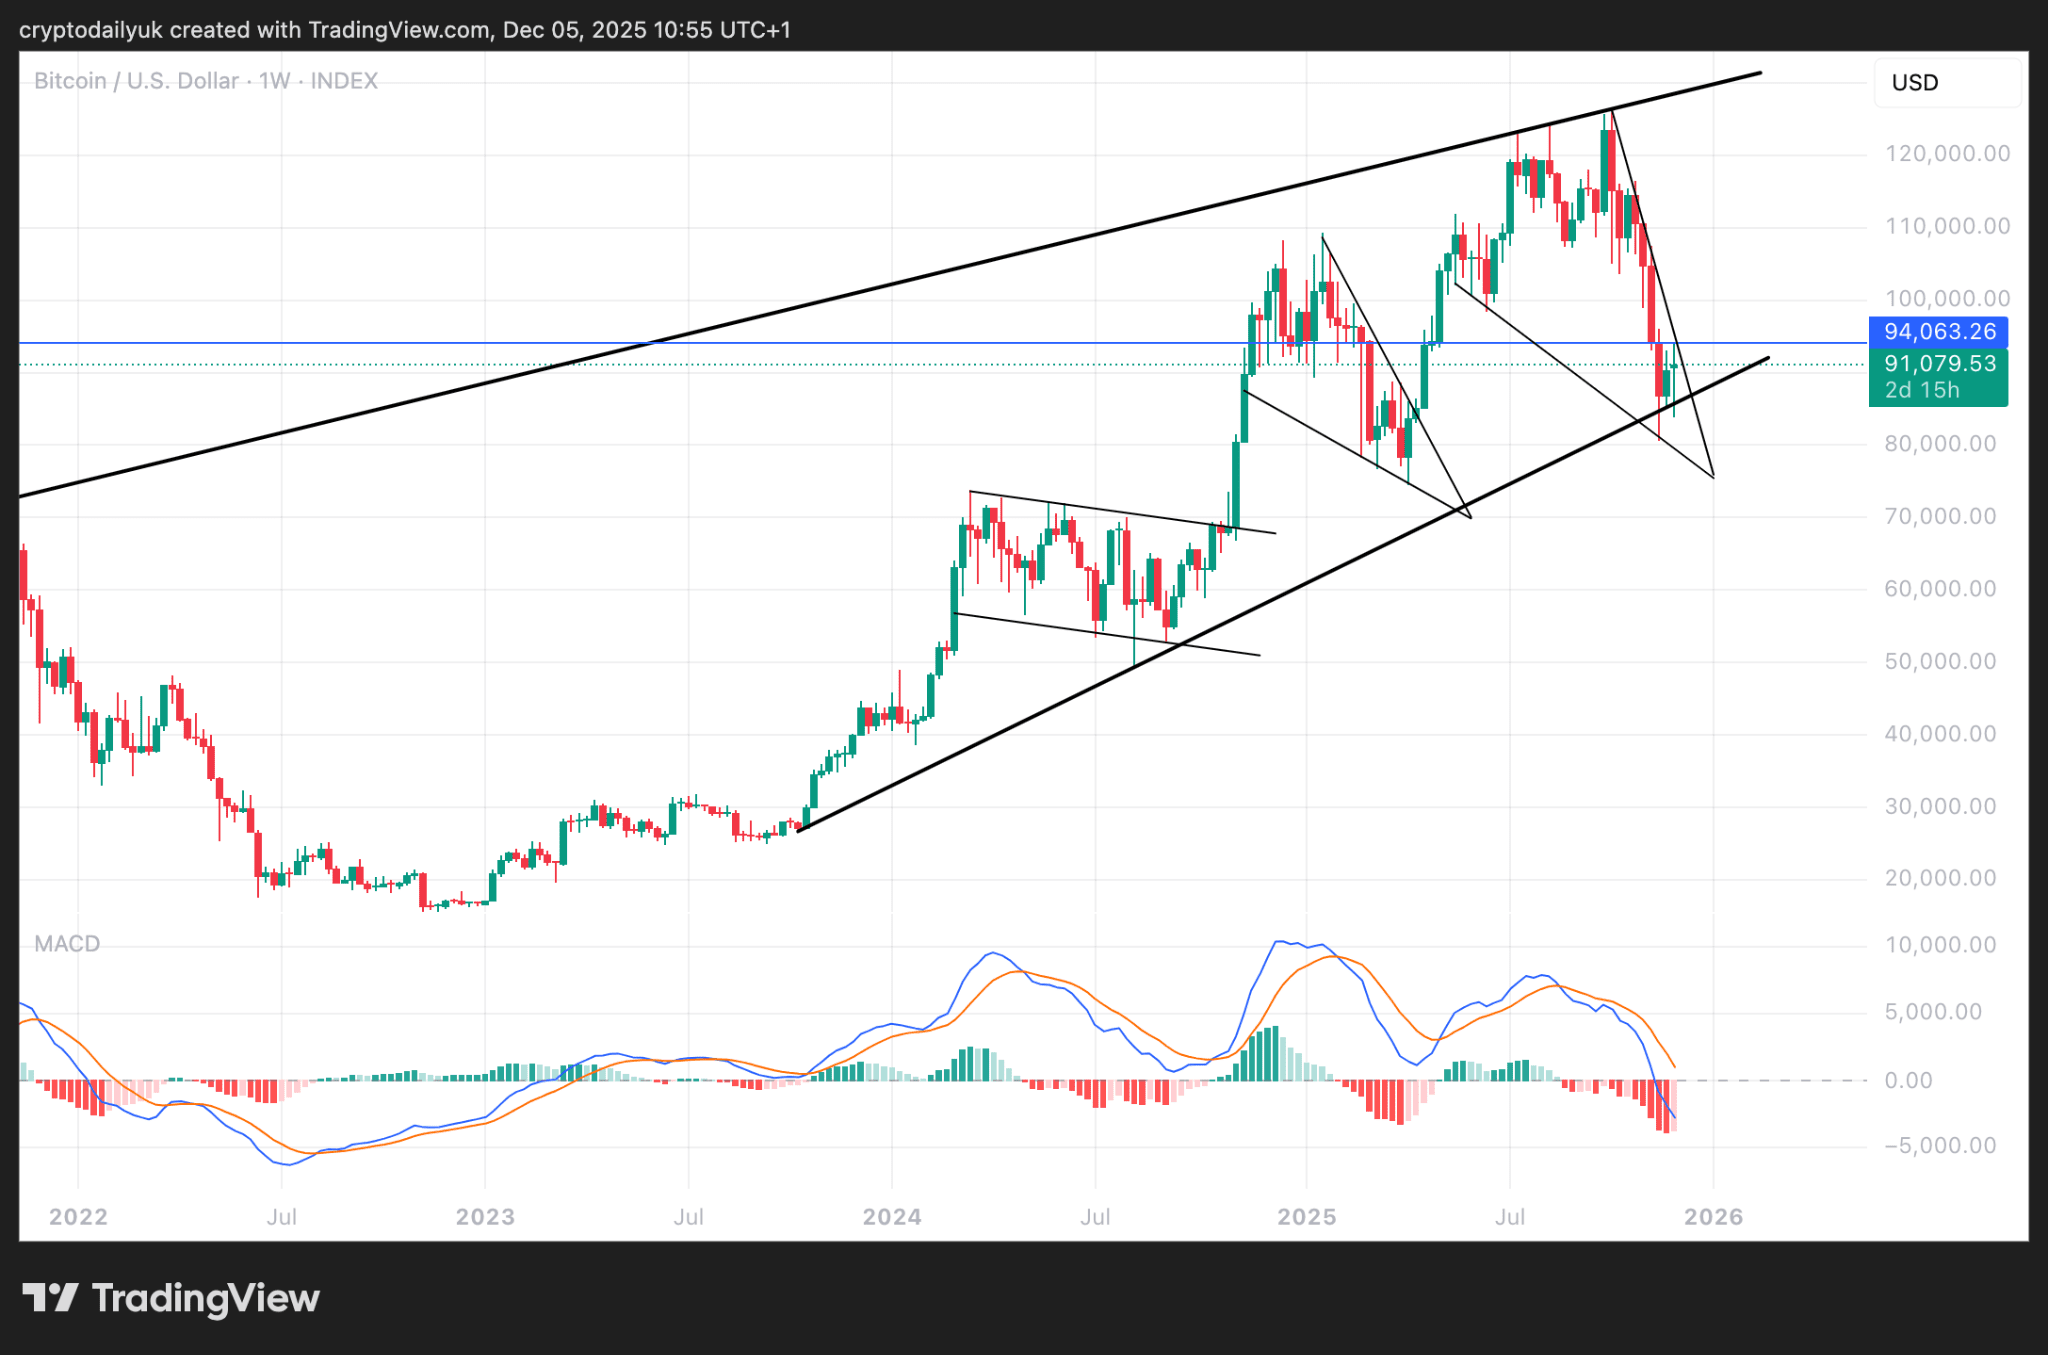
Although not far from the edge of the cliff, the bullish trend on the weekly chart remains strong. The last red candlestick has a long lower shadow, comparable to the lower shadows of several previous large patterns. This indicates that strong buying pressure floods in every time the price touches the market-determined bottom.
From the current price level, the resistance level at 94,000 USD (blue line) is the main resistance level that BTC price needs to break through.
The MACD indicator at the bottom of the chart shows that both the indicator line and the signal line are declining, but the color of the latest histogram in the bar chart has changed from red to pink. Does this signal that the market is about to turn positive, and the bulls are about to gain the upper hand?
