Basic knowledge diagram for cryptocurrency candlestick chart (Part One)
The candlestick chart is drawn based on the opening price, highest price, lowest price, and closing price for each analysis period. Taking the daily candlestick as an example, the portion between the opening price and closing price is drawn as a rectangular body: if the closing price is higher than the opening price, it is called a bullish candle, usually represented by a red body (with the opening price at the bottom and the closing price at the top); conversely, it is called a bearish candle, commonly represented by a green body (with the opening price at the top and the closing price at the bottom). Additionally, thin lines connect the highest price and the lowest price to the body, forming the upper shadow and lower shadow, respectively. It should be noted that in the cryptocurrency, US and European stock, and foreign exchange markets, the color conventions are opposite to those in the domestic market, with green commonly representing bullish candles and red representing bearish candles.
Based on different analysis periods, candlestick charts can be divided into 1-minute candlesticks, daily candlesticks, monthly candlesticks, etc. For example, a daily candlestick represents one day, while a 1-minute candlestick represents one minute. There is a hierarchical relationship between candlesticks of different periods: daily candlesticks are formed by aggregating 24 hourly candlesticks, while hourly candlesticks are formed by aggregating 60 1-minute candlesticks.
1. What is a Bullish Candle?
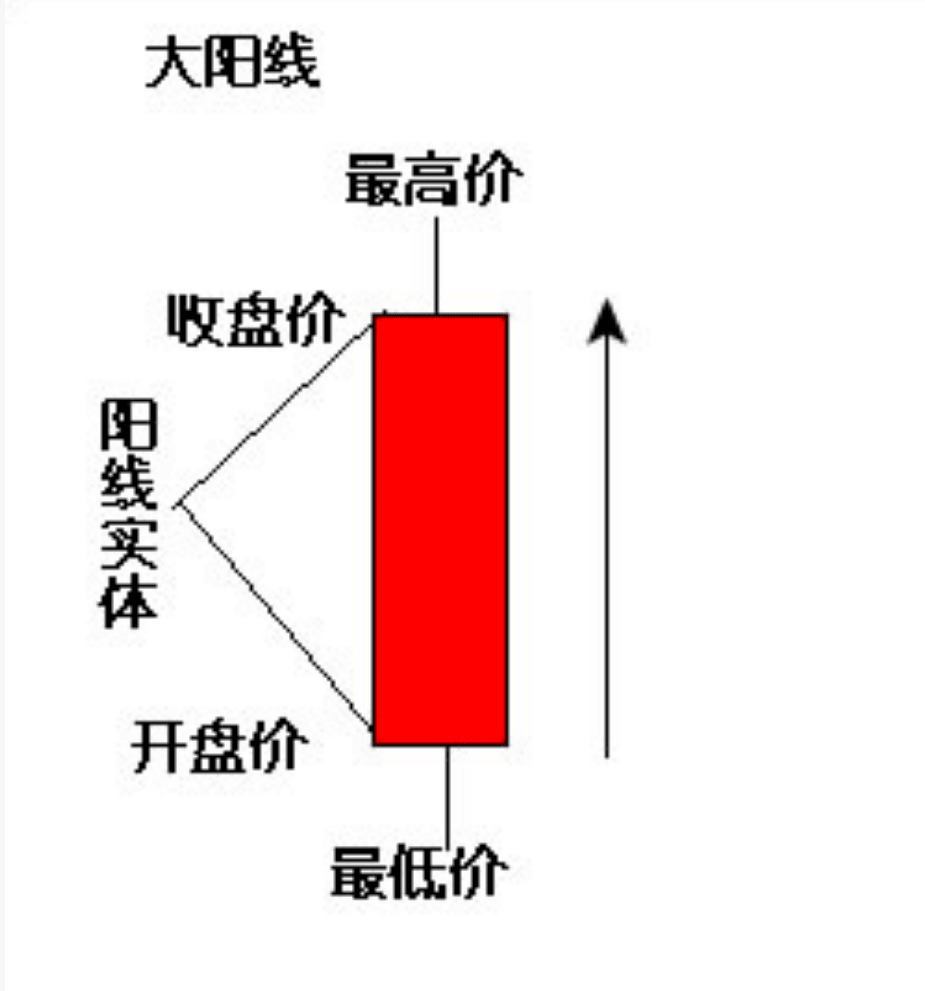
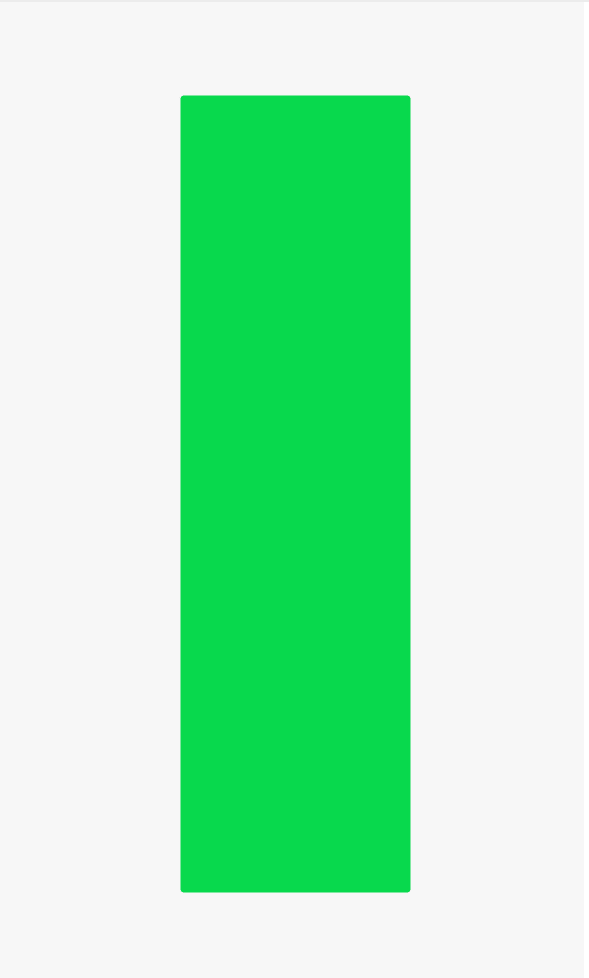
Bullish Candle
Bullish candles can be subdivided into various forms based on the different combinations of shadow and body, each indicating different market implications: when a bullish candle has no lower shadow and a long upper shadow, it indicates that the stock price has encountered strong selling pressure during its upward movement; conversely, if there is no upper shadow and a long lower shadow, it means that the buying force is strong and the stock price has received strong support during its decline. A long red candle with no shadows (also called a sun line) signifies a continuous rise, with buyers holding absolute dominance. If the upper shadow is long and the lower shadow is short, it shows fierce battles between bulls and bears, but bulls have a slight advantage, which is often a signal of a trend reversal—it's worth noting that if this pattern occurs after a large rise, it may indicate a future decline, whereas if it occurs after a large drop, it may signal a bottom rebound. When the upper shadow is short and the lower shadow is long, it represents strong upward force, which can quickly reclaim lost ground even in a downturn. Finally, if both the upper and lower shadows are long but the red body is short, it indicates that the forces of bulls and bears are balanced, and the market appears ambiguous.
2. What is a Bearish Candle?
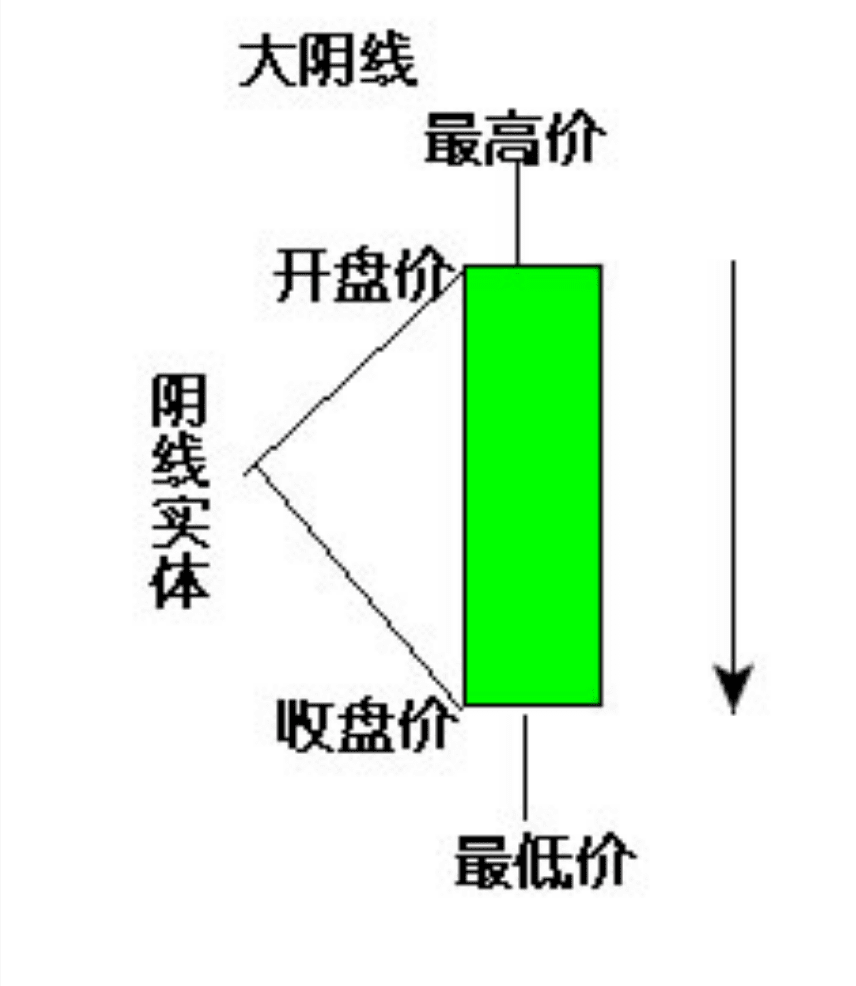
Bearish Candle
Different types of bearish candles: no shadows, long upper shadow indicating a rise followed by a fall, weak rebound, and strong bearishness; no upper shadow, long lower shadow indicating strong downward momentum but support below; short upper and lower shadows, long green body appearing during a downward trend, indicating that the downward force is still strong, appearing after a large rise, indicating a reversal test, indicating a possible sharp decline in the market; no upper and lower shadows, also known as a large bearish candle, indicating a complete fall, with strong selling pressure; short lower shadow, long upper shadow indicating a battle between bulls and bears, with bears being stronger, weak rebound; short upper shadow, long lower shadow indicating a battle between bulls and bears, with bears being stronger but strong support during declines; long upper and lower shadows, short green body indicating balanced forces between bulls and bears, with an unclear market.
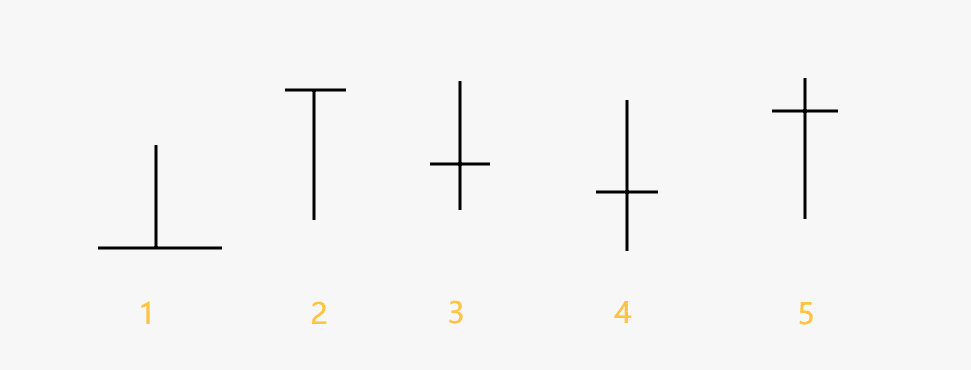
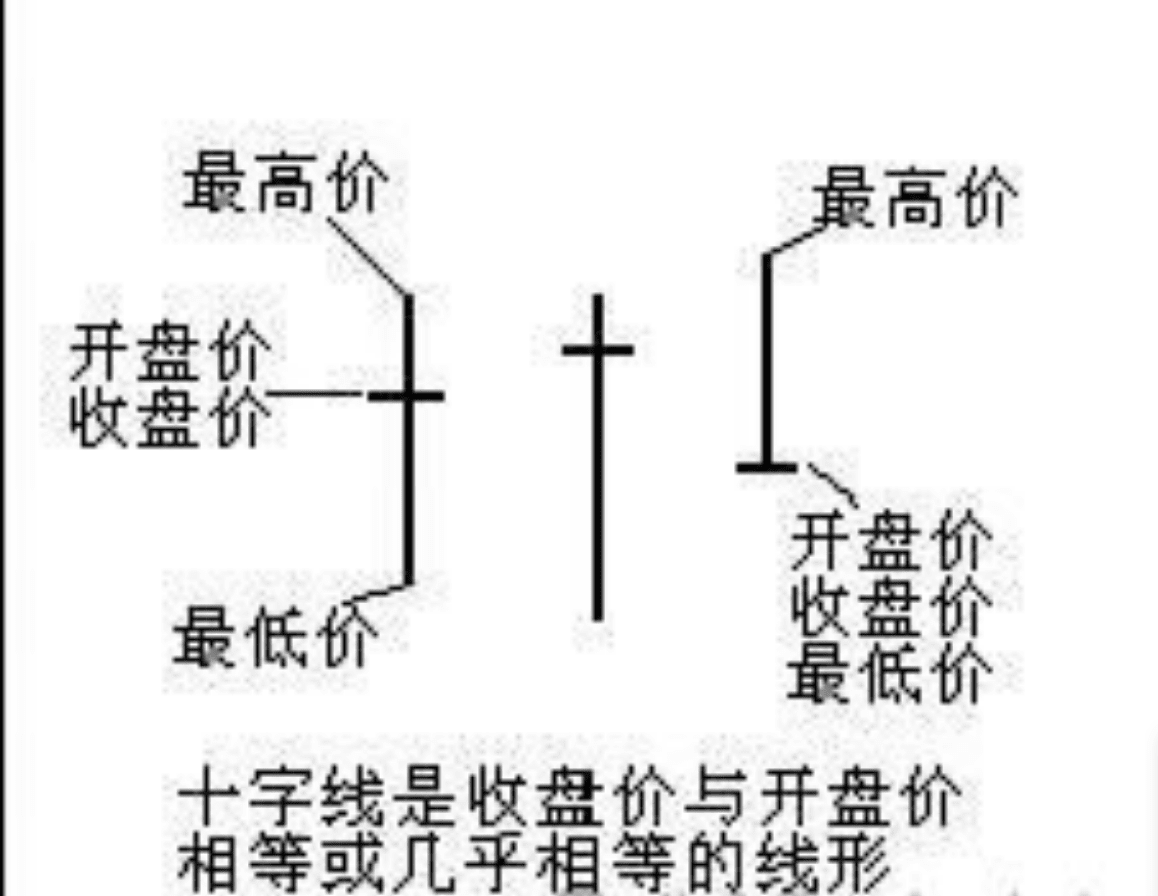
What is a Doji?
Different types of Doji: long upper shadow, no lower shadow, i.e., inverted T-shape, indicating that buyers are strong but sellers are pulling prices back, with bears being stronger; long lower shadow, no upper shadow, i.e., T-shape, indicating that sellers are strong but buyers are pulling prices back, with bulls being stronger; long upper and lower shadows, i.e., large Doji, indicating that both sides are evenly matched, requiring observation in the future; long upper shadow, short lower shadow, indicating a rise after opening but closing back to even, with bears being stronger; long lower shadow, short upper shadow, indicating a drop followed by a rise, with buyers being stronger.
No Head No Foot Bearish Candle
Feature: No head and no foot bearish candles indicate a steadily declining market. They show that bears completely dominate during the session, with bulls unable to resist, leading to a gap down on the next trading day.
Appearance location: Appearing in a downward market indicates that stock prices will accelerate downward.
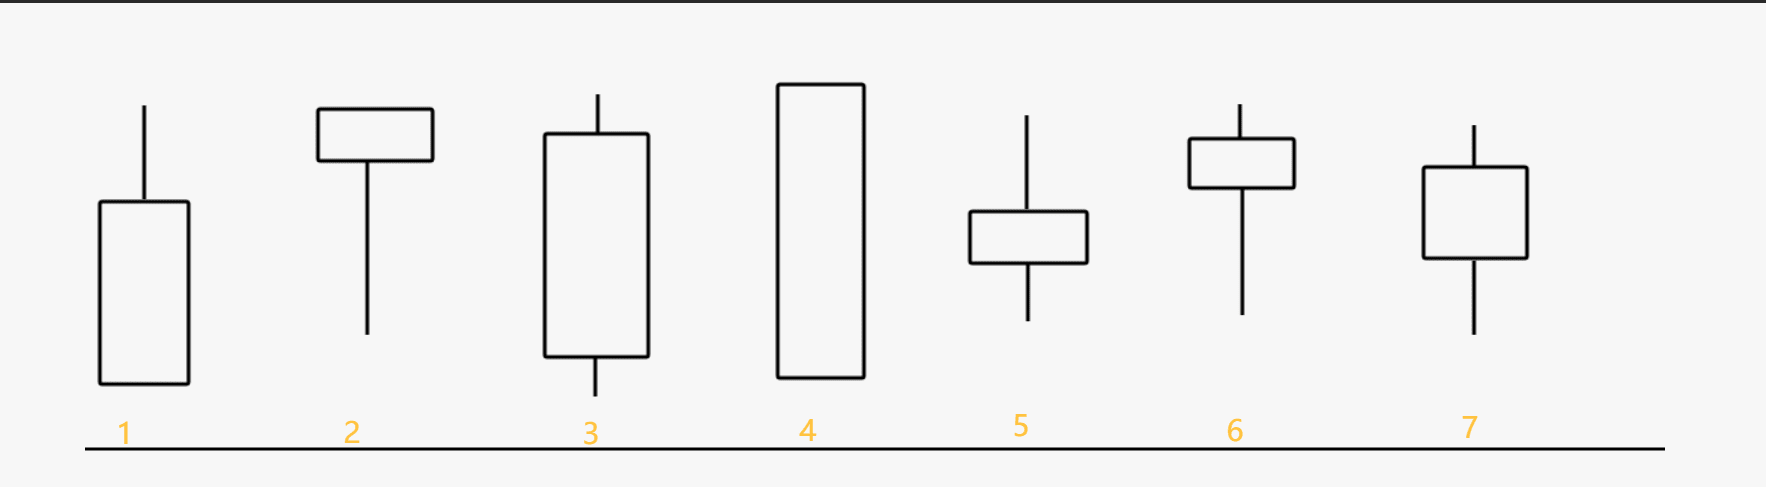
3. Bullish Candle
Different subclasses of bullish candles
No lower shadow, long upper shadow, indicating that the stock price encounters strong resistance during its rise, as shown in the above figure 1);
No upper shadow, long lower shadow, indicating that the buying force is strong and there is support during declines, as shown in the above figure 2);
Short upper and lower shadows, long red body, indicating a strong rising trend, with the stock price being stable, as shown in the above figure 3);
No upper and lower shadows, long red body, also known as a sun line, indicating a continuous rise, with strong buying force, as shown in the above figure 4);
Long upper shadow, short lower shadow, indicating a battle between bulls and bears, with bulls being stronger, often indicating a reversal signal. It is important to note that if this occurs after a large rise, it often implies that the market may decline later, while if it occurs after a large drop, it often implies that the market may rebound from the bottom, as shown in the above figure 5);
Short upper shadow, long lower shadow, representing strong upward force, quickly reclaiming after a decline, as shown in the above figure 6);
Long upper and lower shadows, short red body, representing a battle between bulls and bears, with forces being balanced, and the market appearing ambiguous, as shown in the above figure 7).
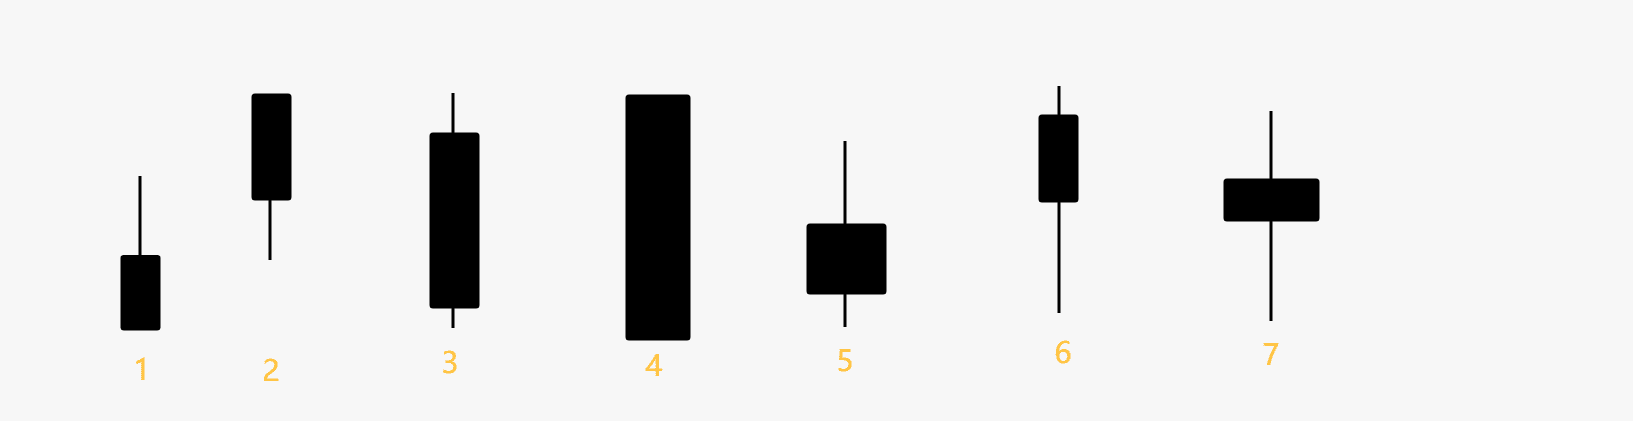
4. Bearish Candle
Different subclasses of bearish candles
No lower shadow, long upper shadow, indicating a rise followed by a fall, weak rebound, and strong bearishness, as shown in the above figure 1);
No upper shadow, long lower shadow, indicating strong downward momentum but support below, as shown in the above figure 2);
Short upper and lower shadows, long green body, appearing during a downward trend, indicating that the downward force is still strong; after a large rise
appears; indicates a reversal test, indicating that the market may drop sharply, as shown in the above figure 3);
No upper and lower shadows, also known as a large bearish candle, indicating a complete fall, with strong selling pressure, as shown in the above figure 4);
Short lower shadow, long upper shadow, indicating a battle between bulls and bears, with bears being stronger, weak rebound, as shown in the above figure 5);
Short upper shadow, long lower shadow, indicating a battle between bulls and bears, with bears being stronger but strong support during declines, as shown in the above figure 6);
Long upper and lower shadows, short green body, indicating balanced forces between bulls and bears, with an unclear market, as shown in the above figure 7).
5. Doji
Different subclasses of Doji
Long upper shadow, no lower shadow, i.e., inverted T-shape, indicating that buyers are strong but sellers are pulling prices back, with bears being stronger, as shown in the above figure 1);
Long lower shadow, no upper shadow, i.e., T-shape, indicating that sellers are strong but buyers are pulling prices back, with bulls being stronger, as shown in the above figure 2);
Long upper and lower shadows, i.e., large Doji, indicating that both sides are evenly matched, requiring observation in the future, as shown in the above figure 3);
Long upper shadow, short lower shadow, indicating that after opening prices rise but close back to even, with bears being stronger, as shown in the above figure 4);#美国非农数据超预期 #BTC
Long lower shadow, short upper shadow, indicating a drop followed by a rise, with buyers being stronger, as shown in the above figure 5).#ETH