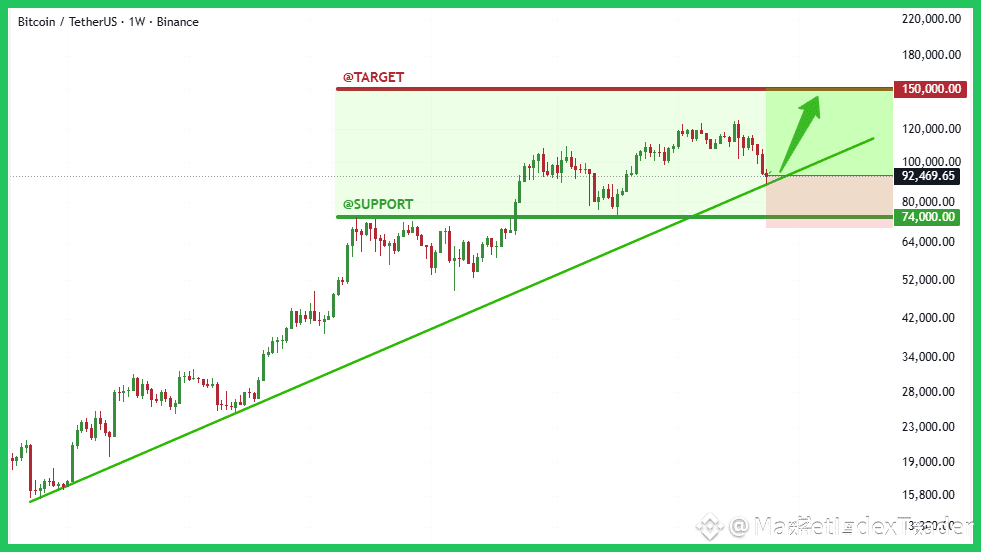
Alright team, let's break down this juicy $BTC chart and see what's cooking. The weekly timeframe reveals a powerful trend continuation pattern that we absolutely cannot ignore.
Technically, price is currently testing a crucial, multi-year rising trendline, confirming this zone (around $92,000) as strong dynamic support. The critical structural support lies at the $74,000 level. As long as the weekly close stays above this long-term trendline, the trajectory remains aggressively bullish, validating the potential target zone of $150,000. This setup offers a highly favorable risk-reward ratio.
On the fundamental side, institutional conviction remains incredibly strong. We are seeing consistently positive net inflows into the US Spot Bitcoin ETFs, which absorbs supply and strengthens the base. Furthermore, the market is beginning to feel the delayed supply shock effects from the recent Halving, adding long-term upward pressure.
My strategy is clear: this pullback is a gift for long-term stackers. Accumulate confidently within this support range. The technical structure confirms the underlying bullish trend.
Highly recommend HOLD and Stacking $BTC at Binance
Feel free to comment the altcoin you are holding and we will check it for you!
#BTC #Bitcoin #TechnicalAnalysis #Crypto #BinanceSquare #BullMarket
