Price Action & Momentum Breakdown
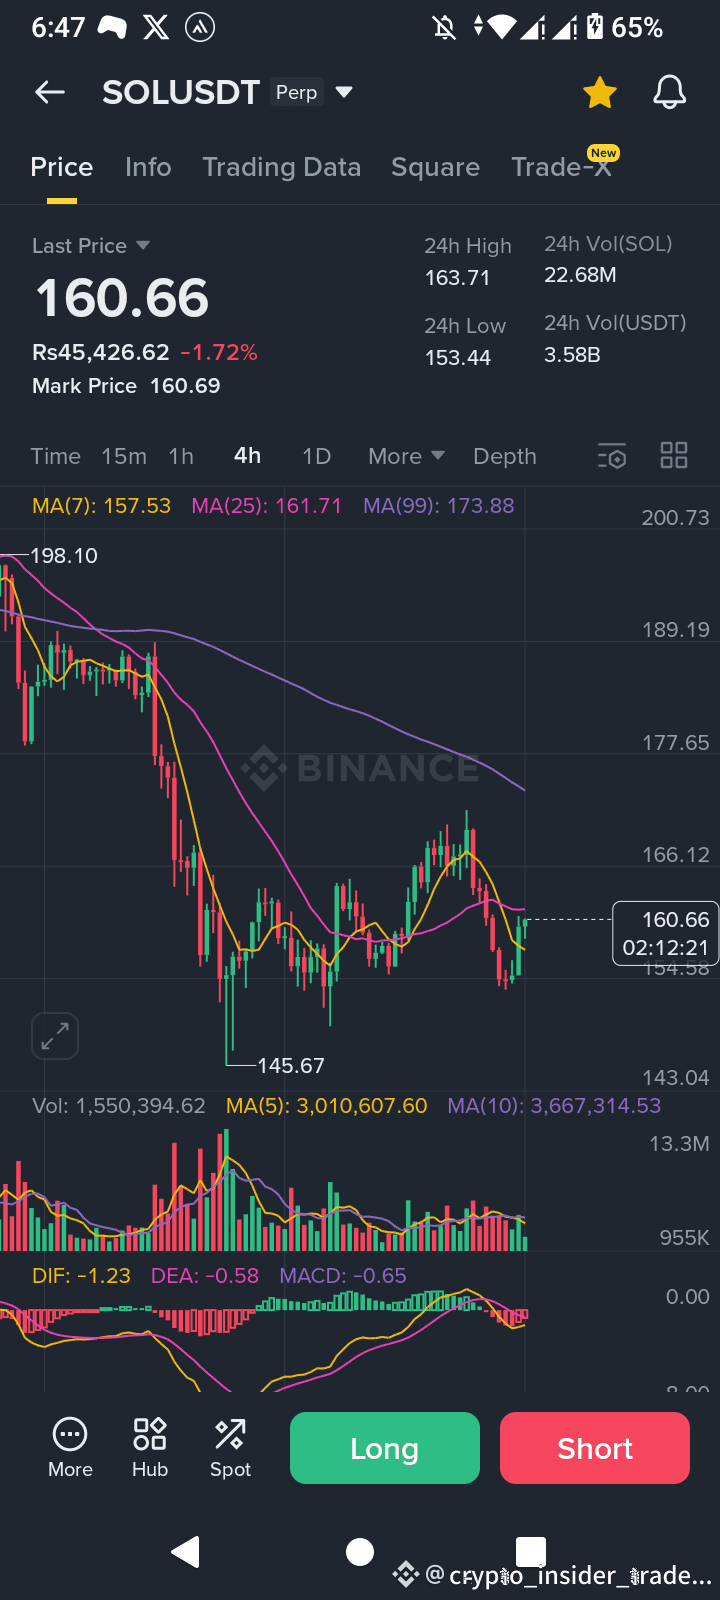
SOL is currently trading at $159.771, dangerously close to the 4-hour support zone around $153.518 (24h low). The 24-hour range of $153.518-$163.758 shows a modest 6.67% volatility window, but don't let that fool you—this consolidation could be loading the spring for a significant move.
✔︎ The MA(50) at $160.214 is acting as immediate resistance, a bearish signal that suggests sellers are defending higher prices aggressively. Price sitting below this key moving average indicates the short-term trend remains under pressure.
Moving Average Confluence: The Real Story
Here’s where it gets interesting:
➤ MA(5): 463.85K – Short-term volume average
➤ MA(10): 533.76K – Medium-term volume showing increasing participation
➤ MA(50): 160.214 – Our critical pivot point
The ascending volume moving averages (despite price decline) suggest institutional accumulation or heavy distribution. Given the downtrend, this screams distribution—smart money might be exiting positions into strength.
MACD: The Momentum Killer
The MACD tells a concerning story:
➜ MACD Line: -0.711
➜ DIF: -1.291
➜ DEA: -0.580
Both MACD and DIF are deep in negative territory with the histogram bars expanding downward. This bearish divergence indicates accelerating downward momentum. Until we see a bullish crossover above the signal line, bulls have no business getting aggressive here.
Volume Analysis: Follow the Money
24-hour volume sits at 3.32M SOL (approximately $524.06M USDT). The volume profile shows decreasing buying pressure on upticks and increasing volume on downsides—a textbook distribution pattern. Notice how the volume spikes correspond with price drops? That’s not retail panic; that’s informed money moving.
Critical Levels to Watch
Resistance Zones:
① $160.20-$163.00 – Immediate resistance cluster (MA50 + recent rejection zone)
② $171.77 – Major supply zone visible on the chart
③ $186-$189 – Previous demand turned supply area
Support Zones:
① $159-$160 – Current battle line
② $153.50 – 24h low and crucial support
③ $145.73 – Major support from early November lows
A breakdown below $153.50 could trigger a cascade toward $145, where bulls must make their stand or risk a deeper correction toward $135-$140.
Trading Scenarios
◆ Bearish Scenario (Higher Probability - 60%)
If SOL loses $153.50 with volume, expect a swift move to $145.73. The MACD divergence and MA rejection support this view. A close below $145 opens the door to $135-$138, where previous consolidation could offer relief.
◆ Bullish Scenario (40%)
A reclaim of $160.20 and MA(50) with strong volume could trigger short-covering toward $163.75, then $171. However, bulls need to flip $171 to support for any sustainable rally toward $180+. The RSI would need to break above 50 and MACD needs a bullish crossover—neither of which we're seeing yet.
◆ Volatility Play
The tight 4-hour range suggests a breakout is imminent. Options traders are likely pricing in expansion. The 24h high at $163.758 and low at $153.518 create a 6.67% range—narrow for SOL. Historically, these compressions precede 10-15% moves within 48 hours.
The Macro Context
Remember, SOL isn't trading in isolation. Bitcoin's dominance, ETH's movements, and broader risk sentiment drive the ecosystem. With SOL perpetuals showing funding rates near neutral, there’s no extreme positioning either way—meaning the next move could be violent in either direction.
The 50-day MA acting as resistance is particularly noteworthy. In previous cycles, SOL has respected this level religiously. A decisive break above would invalidate the bearish thesis; a rejection here confirms more downside.
Final Verdict
✔︎ Short-term: Bearish while below $160.20
✔︎ Medium-term: Neutral pending $153/$172 break
✔︎ Risk/Reward: Favors patience or small positions with tight stops
The chart is screaming "wait for confirmation." Whether you're bullish or bearish, let SOL break its range before committing capital. Chase nothing in this environment.
Pro tip: Watch BTC correlation. If Bitcoin catches a bid and SOL still can’t reclaim $160, that’s a massive red flag for relative weakness.
What’s Your Play?
Are you buying this dip or waiting for sub-$150? Do you think SOL reclaims $180 before year-end, or are we headed for a deeper correction? Drop your technical targets below and let’s debate this—the community’s smartest insights often beat any single analysis.
If this analysis helped sharpen your edge, smash that share button and help other traders navigate these choppy waters. Follow for daily technical breakdowns that cut through the noise.
#solana #sol #USGovShutdownEnd? #BinanceHODLerALLO #StrategyBTCPurchase

