
In the world of cryptocurrencies, it is not enough to observe the price of an asset: what is truly important is to understand where the money is flowing. Market capitalization is like the vital pulse of the crypto ecosystem, and its reading allows anticipating moments of expansion or contraction.
When we analyze pairs like ALLUSDT on Binance, what we observe is not just the value of a particular token, but the trend of liquidity in the market as a whole.
📌 What is capitalization in the crypto market?
Market capitalization represents the sum of the value of all circulating assets. It reflects the total money invested in cryptocurrencies at a given time.
When this indicator grows, it means more capital is entering the ecosystem: there is confidence, positive speculation, and pursuit of returns.
When it decreases, it is interpreted as money leaving, either towards dollars (USDT, USDC) or towards traditional fiat currencies, which usually anticipates correction movements or stages of uncertainty.
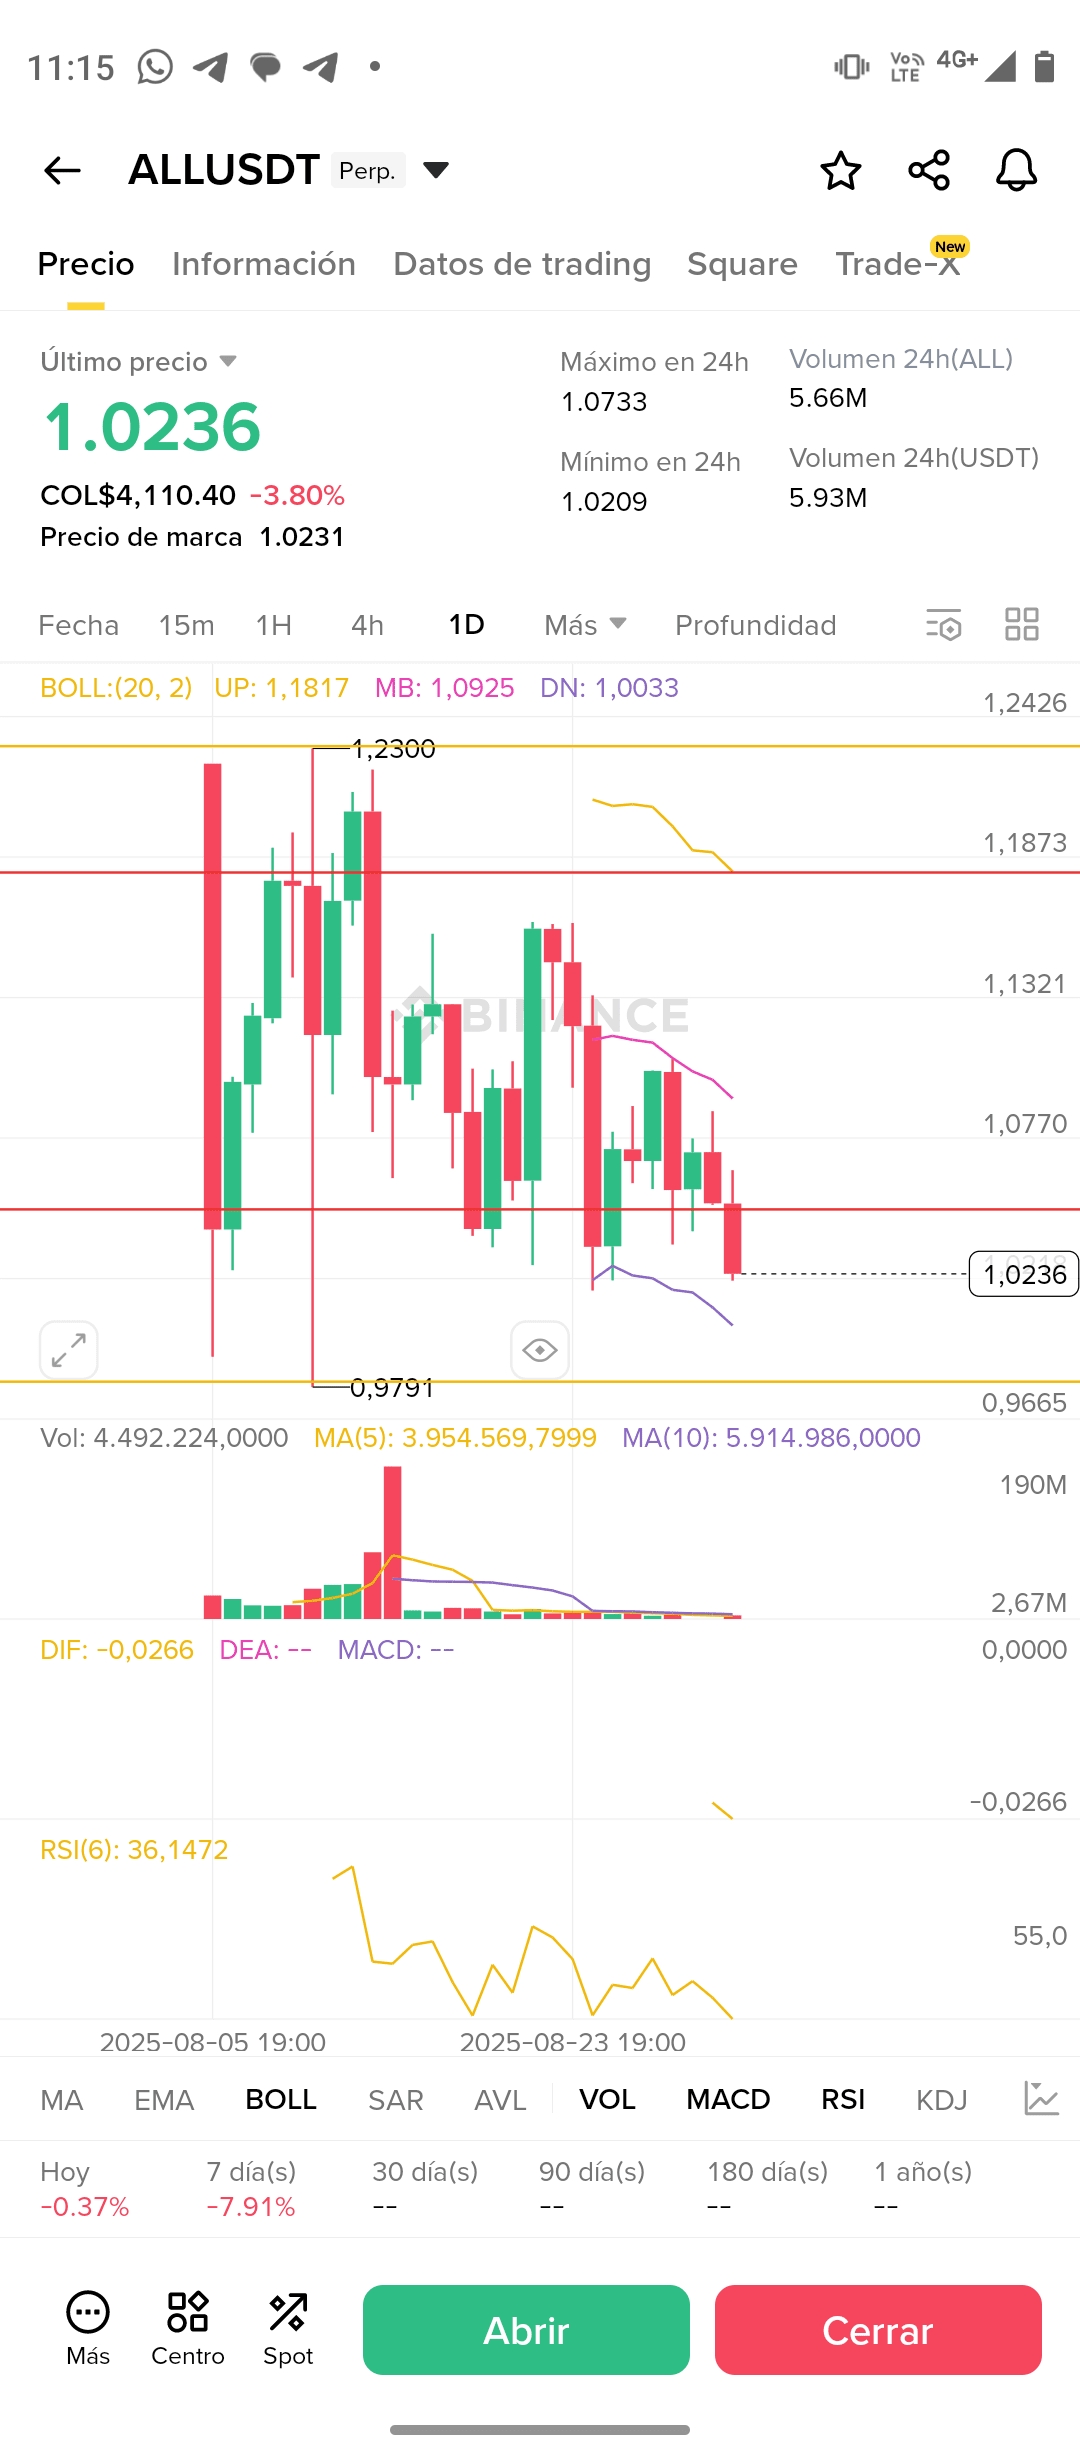
📉 What the ALLUSDT chart shows us
In the technical analysis of the chart:
Last price: $1.0236
Recent trend: a drop of -3.80% in 24h, with a retracement of -7.91% in 7 days.
Bollinger Bands (BOLL): the price is touching the lower part (1.0033), indicating bearish pressure and risk of breaking support.
RSI (36.14): the market is close to the oversold zone, showing weakness and a possible saturation of sales.
Volume: perceived as reduced compared to previous peaks → confirms that there is no strong buyer entry to support the price.
📊 Interpretation:
This behavior reflects that capital is leaving the crypto market towards more stable assets, mainly digital dollars (USDT/USDC) or even fiat currencies. It is a typical process in correction phases where traders prefer to protect their gains and wait for a new entry opportunity.
🔍 Fundamental analysis
Beyond the candles, there are clear signals:
1. Macroeconomic context: uncertainty in interest rates, monetary policies, and dollar movements directly impact crypto liquidity.
2. Capital rotation: when altcoins lose strength, investors often migrate to Bitcoin and stablecoins as a refuge, causing drops in indicators like ALLUSDT.
3. Market sentiment: the index's retracement shows a decrease in speculative confidence; traders are in defensive mode.
🚀 What does this mean for the futures trader on Binance?
In scenarios like this, opening long positions without confirmation is high risk.
The clearest opportunities arise in:
Short trades (selling in futures) taking advantage of the weakness.
Staggered entries at support, waiting for a technical rebound confirmed by volume.
At a strategic level, the key is to follow the money trail: if global capitalization falls, individual assets often follow the same pattern.
🔑 Motivational reflection
Money is like a river: it never disappears, it just changes course. Today, the ALLUSDT chart shows us that a large part of the flow is seeking refuge in dollars or outside the crypto ecosystem. But, like any river, it always returns to its main course when conditions are favorable.
The smart trader does not fight against the current: they observe it, understand it, and anticipate it. Those who can read these movements not only protect their capital but are also prepared to take advantage of the next waves of expansion.
📢 Final invitation
👉 If this analysis opened your eyes to how money really flows in the market:
Follow me for more reports on technical and fundamental analysis.
Like if you want me to keep sharing smart investment strategies.
Quote and share this article so more people can learn to read the pulse of the market.
🌍 Remember: knowledge is the most valuable asset. While others improvise, you prepare to win.


