
#trading
trading
118M views
771,691 Discussing
Hot
Latest

·
--
Trong_Hatachi:
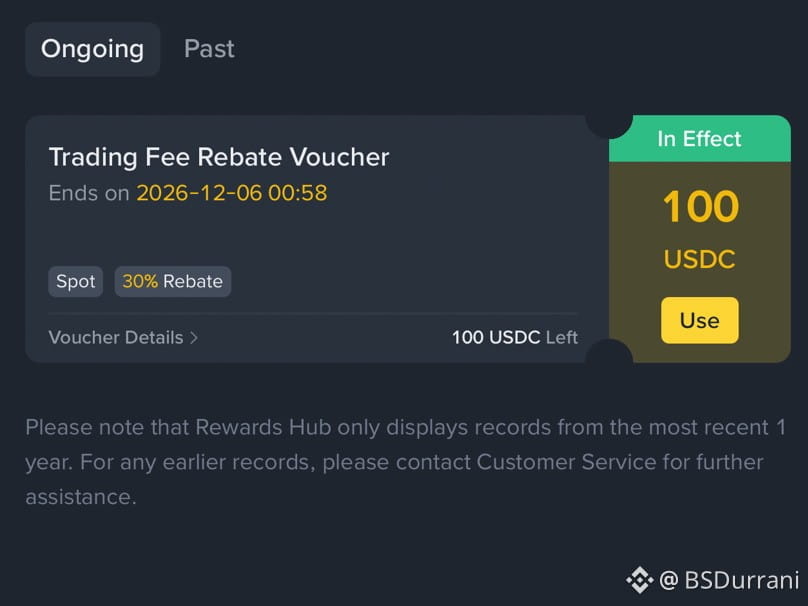
The 100 USDC voucher sounds like a nice fee break, though it’s worth checking the terms. What’s your favorite part of the reward? Follow me back if you’d like!
4
3
2.3k


·
--
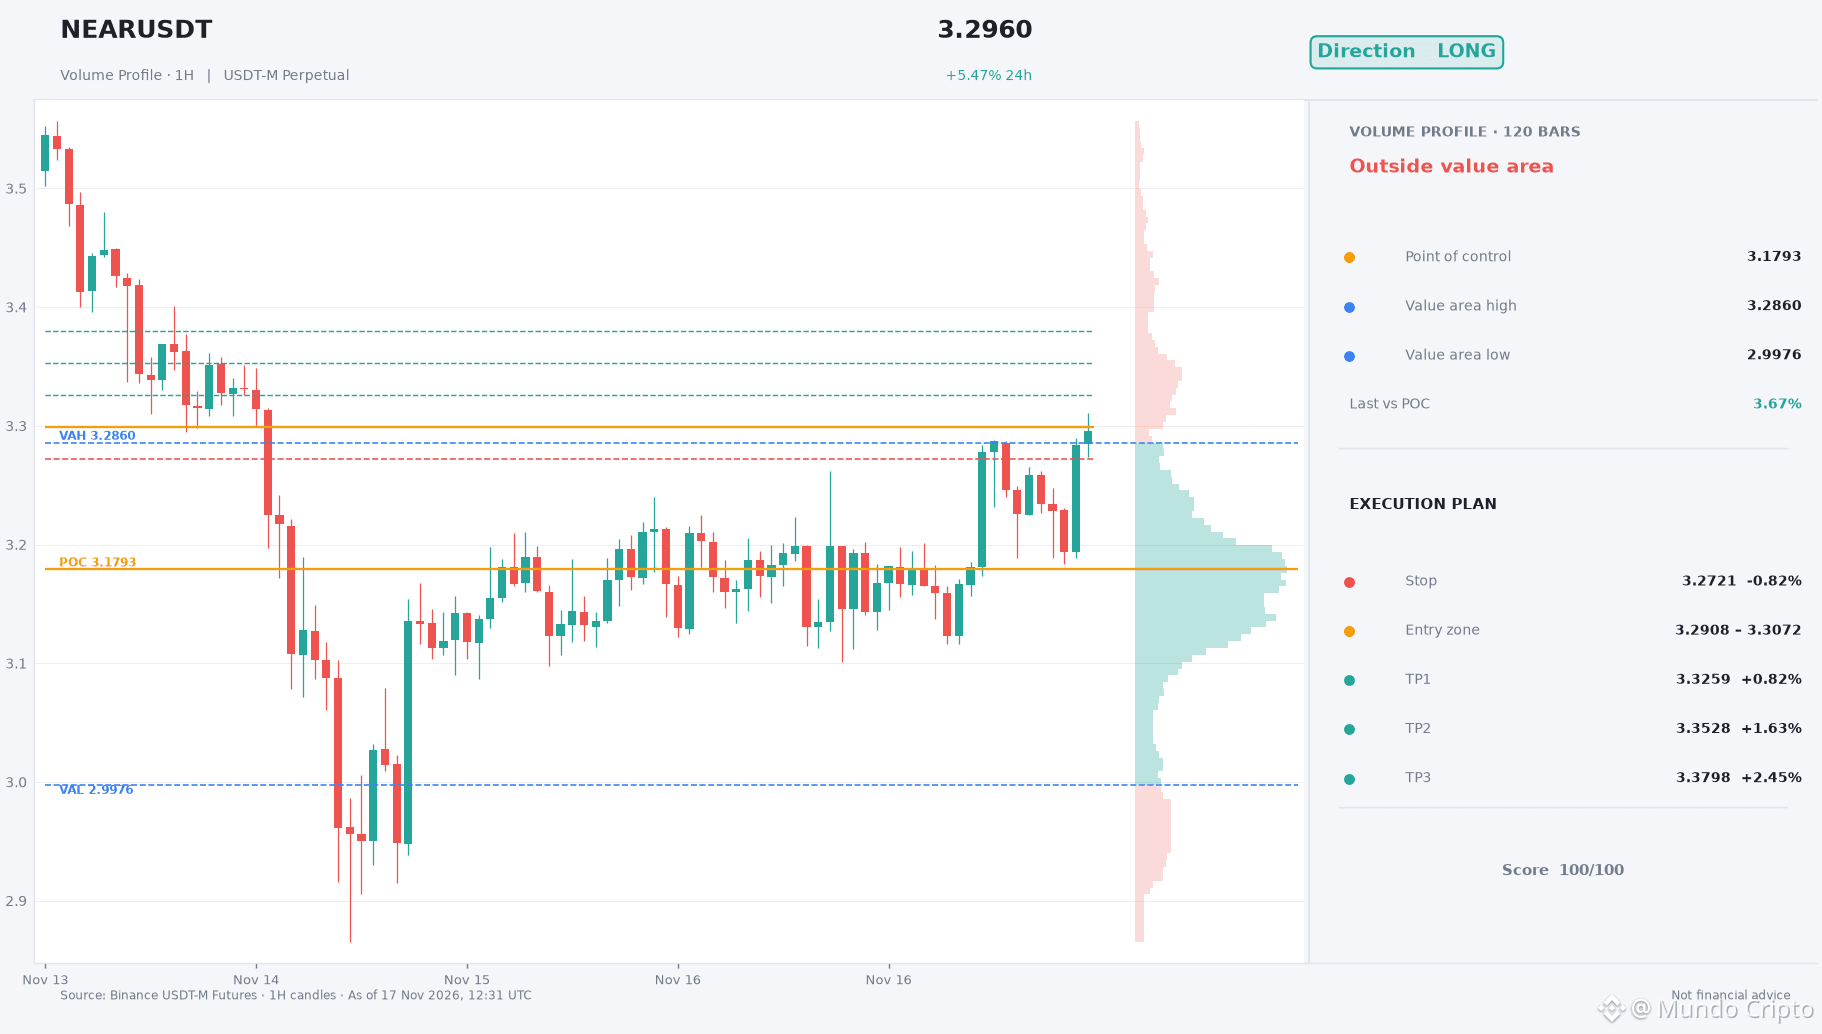
📈 $NEAR — LONG · high conviction — this is a full-size setup.
🎯 Entry $3.29 – $3.31
✅ TP1 $3.33
✅ TP2 $3.35
✅ TP3 $3.38
🛑 Stop $3.27
Why LONG?
• Trend is bullish (above EMA50 & EMA200)
• Buyers have the momentum (RSI 65.4)
• MACD trending bullish
• Elevated volume backing the move
Playing this setup? Let me know your target.
#NEAR #MundoCripto #Crypto #Trading
📈 $NEAR — LONG · high conviction — this is a full-size setup.
🎯 Entry $3.29 – $3.31
✅ TP1 $3.33
✅ TP2 $3.35
✅ TP3 $3.38
🛑 Stop $3.27
Why LONG?
• Trend is bullish (above EMA50 & EMA200)
• Buyers have the momentum (RSI 65.4)
• MACD trending bullish
• Elevated volume backing the move
Playing this setup? Let me know your target.
#NEAR #MundoCripto #Crypto #Trading
🎯 Entry $3.29 – $3.31
✅ TP1 $3.33
✅ TP2 $3.35
✅ TP3 $3.38
🛑 Stop $3.27
Why LONG?
• Trend is bullish (above EMA50 & EMA200)
• Buyers have the momentum (RSI 65.4)
• MACD trending bullish
• Elevated volume backing the move
Playing this setup? Let me know your target.
#NEAR #MundoCripto #Crypto #Trading
405

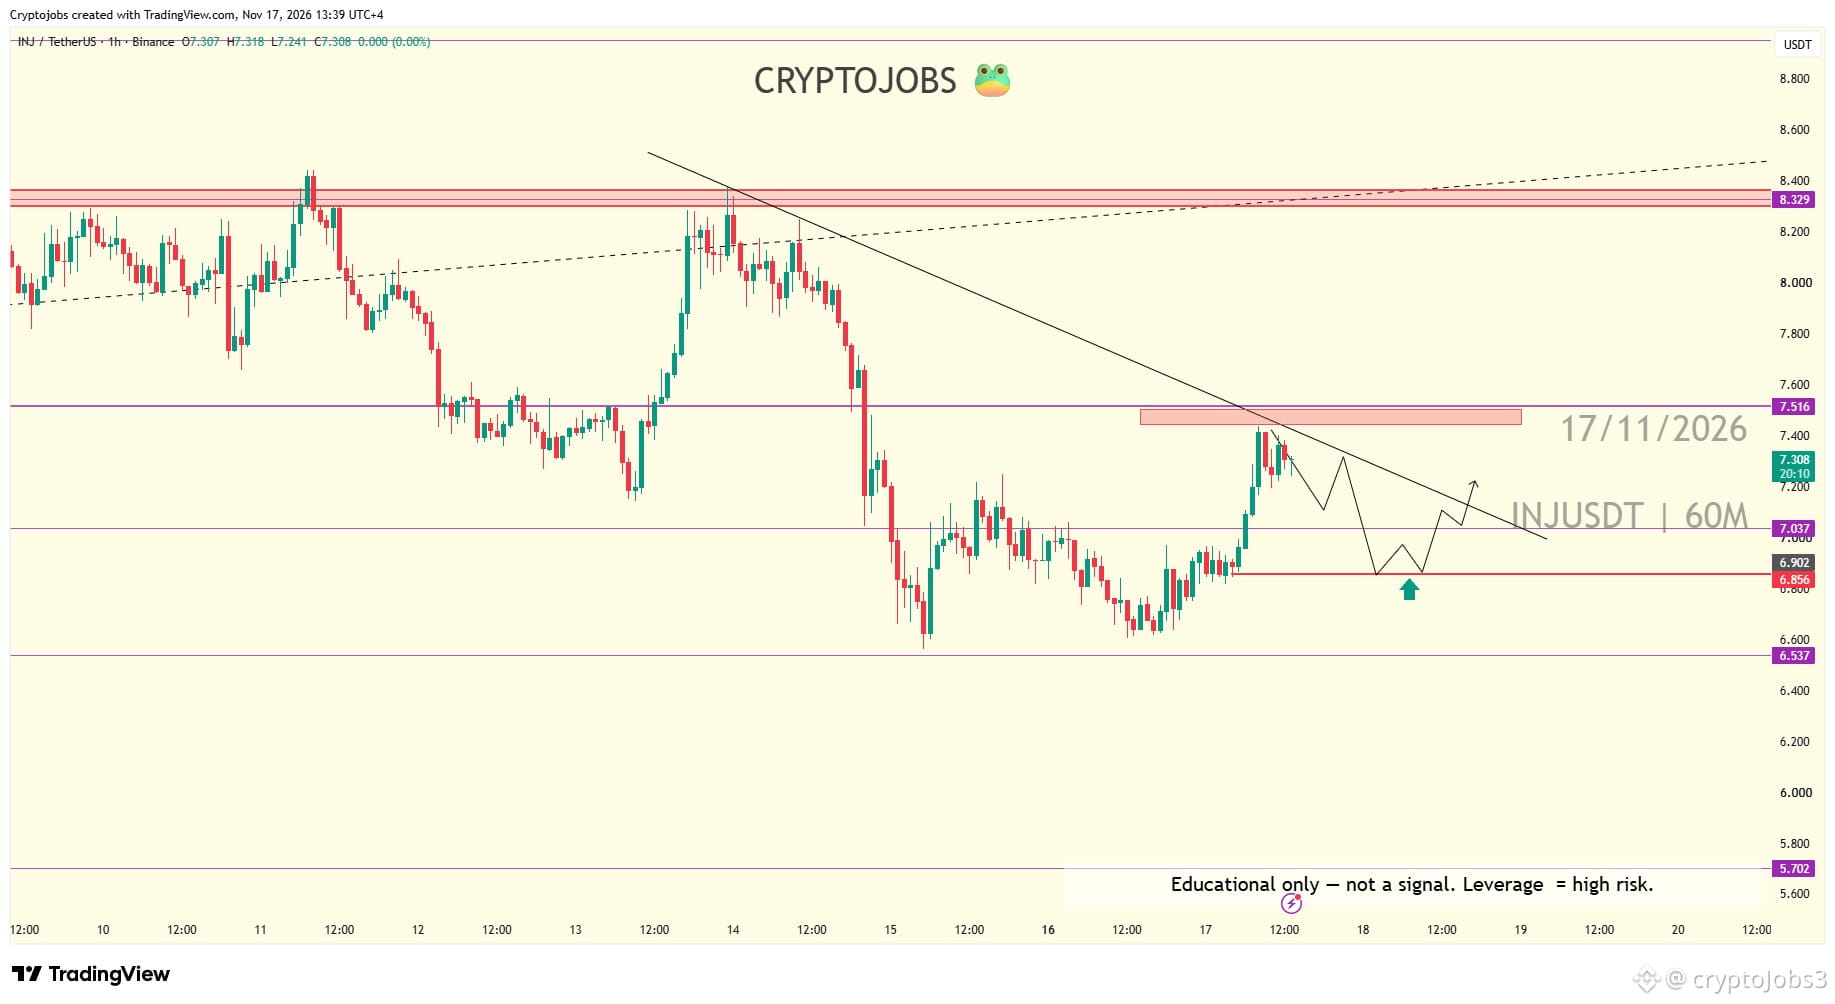

If $SOL drops to $60, I'm going in heavy.
Not blindly, though. I've watched enough cycles to know the best entries rarely feel good. At $60 the timeline will be panic, everyone calling for lower, nobody wanting to touch it. That's usually where the real opportunity sits. So I'd put most of my portfolio to work there, but in stages: a chunk at $60, more if it flushes lower, with a clear level where I admit I'm wrong.
I believe calculated risk is what separates winners from everyone else. Fear is loud at the bottom, and conviction backed by a plan is quiet. DYOR.
#Solana #SOL #Crypto #Trading $SOL
{future}(SOLUSDT)
If $SOL drops to $60, I'm going in heavy.
Not blindly, though. I've watched enough cycles to know the best entries rarely feel good. At $60 the timeline will be panic, everyone calling for lower, nobody wanting to touch it. That's usually where the real opportunity sits. So I'd put most of my portfolio to work there, but in stages: a chunk at $60, more if it flushes lower, with a clear level where I admit I'm wrong.
I believe calculated risk is what separates winners from everyone else. Fear is loud at the bottom, and conviction backed by a plan is quiet. DYOR.
#Solana #SOL #Crypto #Trading $SOL
Not blindly, though. I've watched enough cycles to know the best entries rarely feel good. At $60 the timeline will be panic, everyone calling for lower, nobody wanting to touch it. That's usually where the real opportunity sits. So I'd put most of my portfolio to work there, but in stages: a chunk at $60, more if it flushes lower, with a clear level where I admit I'm wrong.
I believe calculated risk is what separates winners from everyone else. Fear is loud at the bottom, and conviction backed by a plan is quiet. DYOR.
#Solana #SOL #Crypto #Trading $SOL
Alenk X - BNB:
Pode ir até 40, mas acho difícil chegar lá. No pior dos cenários, no máximo uns 58.
1
2
96

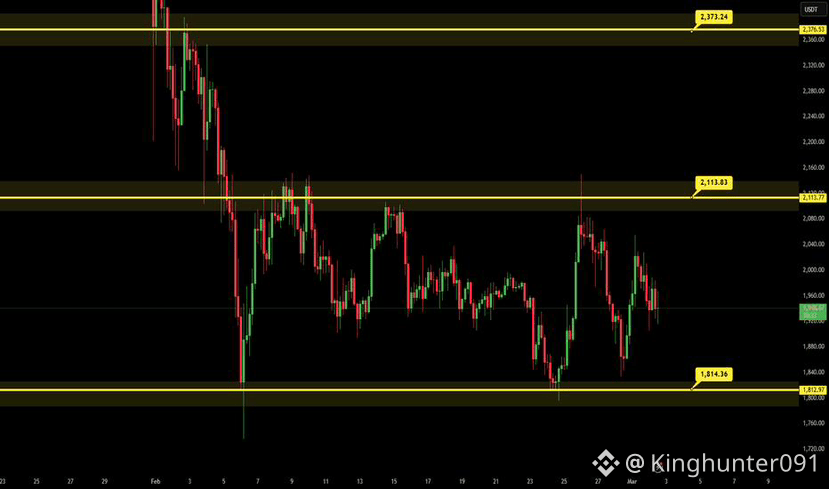
ETH TRADERS, KEEP $1,843 ON YOUR RADAR.
This is the resistance level I'm watching today.
If $ETH rallies into it and sellers defend the zone, $1,789 and $1,737 become important downside levels.
But if buyers reclaim resistance, the bearish setup loses strength.
Always have a plan before entering.
Are you bullish or bearish on $ETH ?
#ETH #Ethereum #Trading
ETH TRADERS, KEEP $1,843 ON YOUR RADAR.
This is the resistance level I'm watching today.
If $ETH rallies into it and sellers defend the zone, $1,789 and $1,737 become important downside levels.
But if buyers reclaim resistance, the bearish setup loses strength.
Always have a plan before entering.
Are you bullish or bearish on $ETH ?
#ETH #Ethereum #Trading
This is the resistance level I'm watching today.
If $ETH rallies into it and sellers defend the zone, $1,789 and $1,737 become important downside levels.
But if buyers reclaim resistance, the bearish setup loses strength.
Always have a plan before entering.
Are you bullish or bearish on $ETH ?
#ETH #Ethereum #Trading
1
353
·
--
Bearish
🔻$ZEC SHORT 🔴‼️
Pair: ZEC/USDT
Timeframe: 1H
Entry: 903 - 910
SL: 920
TP1: 890
TP2: 875
Leverage: 5x
Risk: 2% Only
#ZEC #CryptoSignal #Trading #CryptoPakistan
🔻$ZEC SHORT 🔴‼️
Pair: ZEC/USDT
Timeframe: 1H
Entry: 903 - 910
SL: 920
TP1: 890
TP2: 875
Leverage: 5x
Risk: 2% Only
#ZEC #CryptoSignal #Trading #CryptoPakistan
Pair: ZEC/USDT
Timeframe: 1H
Entry: 903 - 910
SL: 920
TP1: 890
TP2: 875
Leverage: 5x
Risk: 2% Only
#ZEC #CryptoSignal #Trading #CryptoPakistan
299

·
--
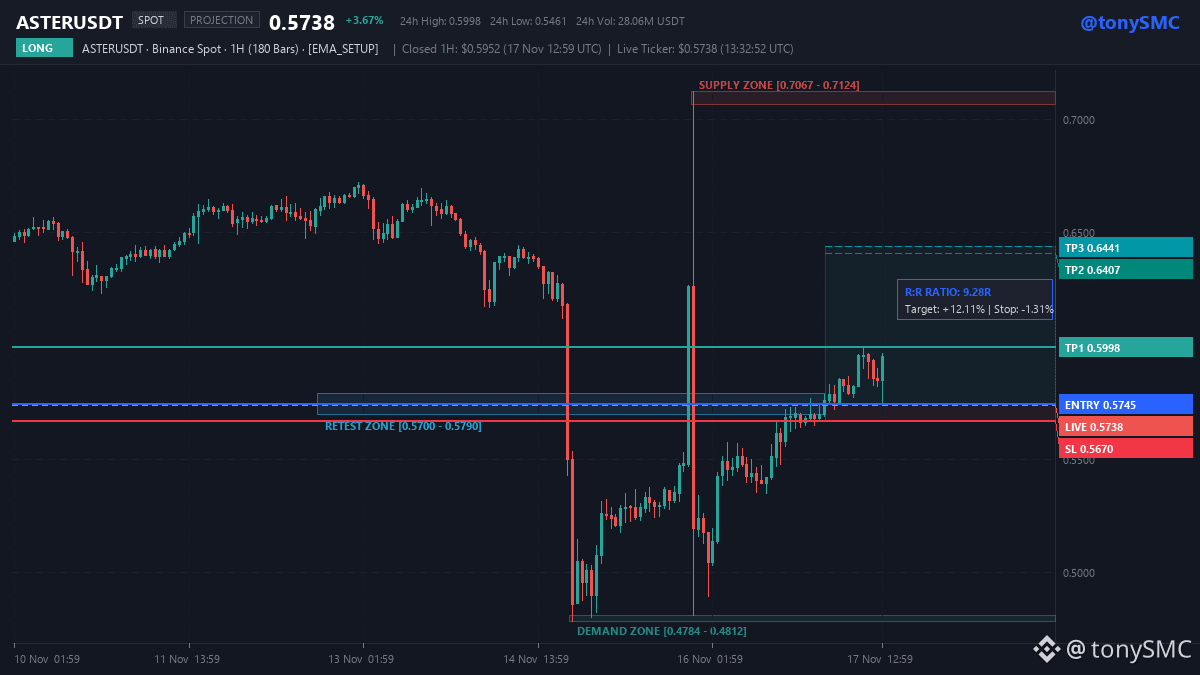
ASTERUSDT — LONG 🟢
Entry: $0.5745
Stop Loss: $0.5670
TP1: $0.5998
TP2: $0.6407
TP3: $0.6441
Risk-to-Reward: 3.37R to TP1, 8.83R to TP2 and 9.28R to TP3.
$ASTER bounced cleanly off dynamic trend support on the 1H chart. Trend structure remains bullish, favoring continuation toward $0.5998. A 1H close below $0.5670 invalidates the bullish thesis.
DYOR. Manage your risk.
#ASTER #Trading #Crypto
ASTERUSDT — LONG 🟢
Entry: $0.5745
Stop Loss: $0.5670
TP1: $0.5998
TP2: $0.6407
TP3: $0.6441
Risk-to-Reward: 3.37R to TP1, 8.83R to TP2 and 9.28R to TP3.
$ASTER bounced cleanly off dynamic trend support on the 1H chart. Trend structure remains bullish, favoring continuation toward $0.5998. A 1H close below $0.5670 invalidates the bullish thesis.
DYOR. Manage your risk.
#ASTER #Trading #Crypto
Entry: $0.5745
Stop Loss: $0.5670
TP1: $0.5998
TP2: $0.6407
TP3: $0.6441
Risk-to-Reward: 3.37R to TP1, 8.83R to TP2 and 9.28R to TP3.
$ASTER bounced cleanly off dynamic trend support on the 1H chart. Trend structure remains bullish, favoring continuation toward $0.5998. A 1H close below $0.5670 invalidates the bullish thesis.
DYOR. Manage your risk.
#ASTER #Trading #Crypto
1
345

·
--
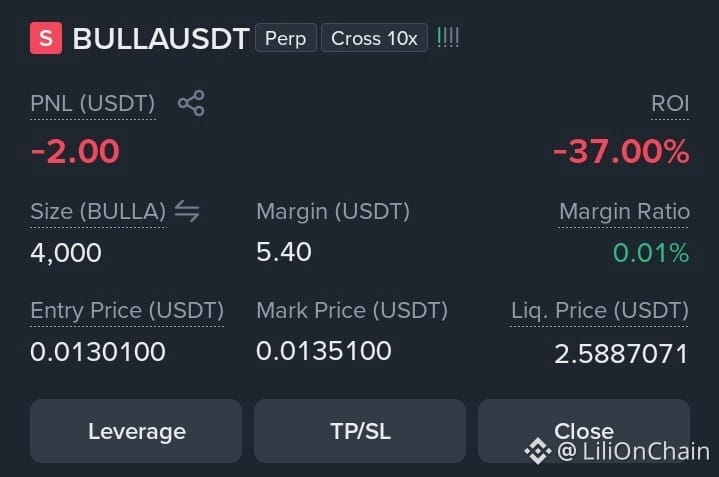
Not every trade ends green and I'm not going to hide the red ones! $BULLA SHORT didn't go as planned but I'm not done watching this chart!
Now looking at the 1H chart, #BULLA is trading around 0.01354 after bouncing from 0.01202.
My next bias: SHORT
Here's why:
Price is still below MA(25) at 0.01508 and MA(99) at 0.02442.
The overall 1H structure remains bearish.
The recent bounce looks like a recovery attempt, not yet a confirmed reversal.
RSI is around 44.9, showing limited bullish momentum.
🔴 Next SHORT setup:
TP1: 0.0130
TP2: 0.0125
SL: 0.0147
My entry before was wrong but no trader wins every single trade. What matters is managing risk, learning from mistakes, and coming back with a better plan.
OPEN TRADE 👇🏻
{future}(BULLAUSDT)
$HUMA #trading $BLESS
Not every trade ends green and I'm not going to hide the red ones! $BULLA SHORT didn't go as planned but I'm not done watching this chart!
Now looking at the 1H chart, #BULLA is trading around 0.01354 after bouncing from 0.01202.
My next bias: SHORT
Here's why:
Price is still below MA(25) at 0.01508 and MA(99) at 0.02442.
The overall 1H structure remains bearish.
The recent bounce looks like a recovery attempt, not yet a confirmed reversal.
RSI is around 44.9, showing limited bullish momentum.
🔴 Next SHORT setup:
TP1: 0.0130
TP2: 0.0125
SL: 0.0147
My entry before was wrong but no trader wins every single trade. What matters is managing risk, learning from mistakes, and coming back with a better plan.
OPEN TRADE 👇🏻
$HUMA #trading $BLESS
Now looking at the 1H chart, #BULLA is trading around 0.01354 after bouncing from 0.01202.
My next bias: SHORT
Here's why:
Price is still below MA(25) at 0.01508 and MA(99) at 0.02442.
The overall 1H structure remains bearish.
The recent bounce looks like a recovery attempt, not yet a confirmed reversal.
RSI is around 44.9, showing limited bullish momentum.
🔴 Next SHORT setup:
TP1: 0.0130
TP2: 0.0125
SL: 0.0147
My entry before was wrong but no trader wins every single trade. What matters is managing risk, learning from mistakes, and coming back with a better plan.
OPEN TRADE 👇🏻
$HUMA #trading $BLESS
4
843
·
--
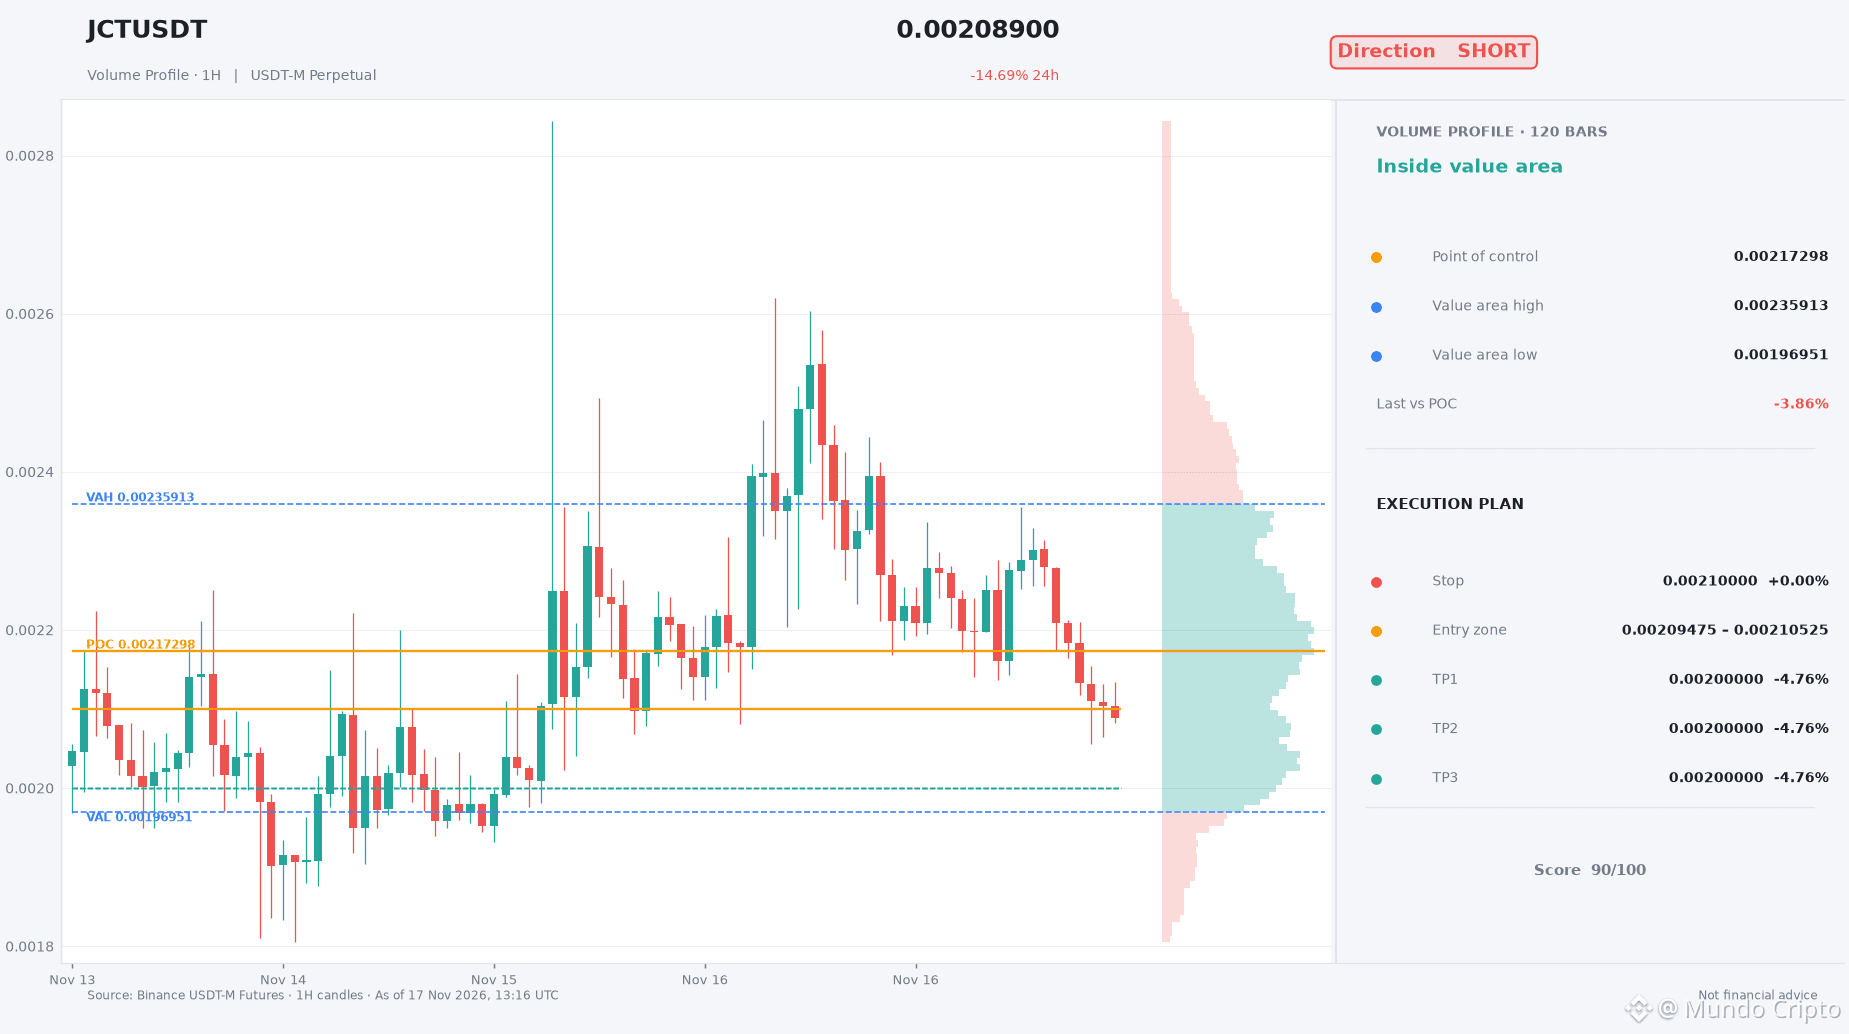
📉 $JCT — SHORT · high conviction — this is a full-size setup.
🎯 Entry $0.00209475 – $0.00210525
✅ TP1 $0.00200000
✅ TP2 $0.00200000
✅ TP3 $0.00200000
🛑 Stop $0.00210000
Why SHORT?
• Trend is bearish (below EMA50 & EMA200)
• Sellers have the momentum (RSI 29.9)
• MACD trending bearish
• Strong trend confirmed (ADX 29.8)
In or waiting? Tell me your level.
#JCT #MundoCripto #Crypto #Trading
📉 $JCT — SHORT · high conviction — this is a full-size setup.
🎯 Entry $0.00209475 – $0.00210525
✅ TP1 $0.00200000
✅ TP2 $0.00200000
✅ TP3 $0.00200000
🛑 Stop $0.00210000
Why SHORT?
• Trend is bearish (below EMA50 & EMA200)
• Sellers have the momentum (RSI 29.9)
• MACD trending bearish
• Strong trend confirmed (ADX 29.8)
In or waiting? Tell me your level.
#JCT #MundoCripto #Crypto #Trading
🎯 Entry $0.00209475 – $0.00210525
✅ TP1 $0.00200000
✅ TP2 $0.00200000
✅ TP3 $0.00200000
🛑 Stop $0.00210000
Why SHORT?
• Trend is bearish (below EMA50 & EMA200)
• Sellers have the momentum (RSI 29.9)
• MACD trending bearish
• Strong trend confirmed (ADX 29.8)
In or waiting? Tell me your level.
#JCT #MundoCripto #Crypto #Trading
580

·
--
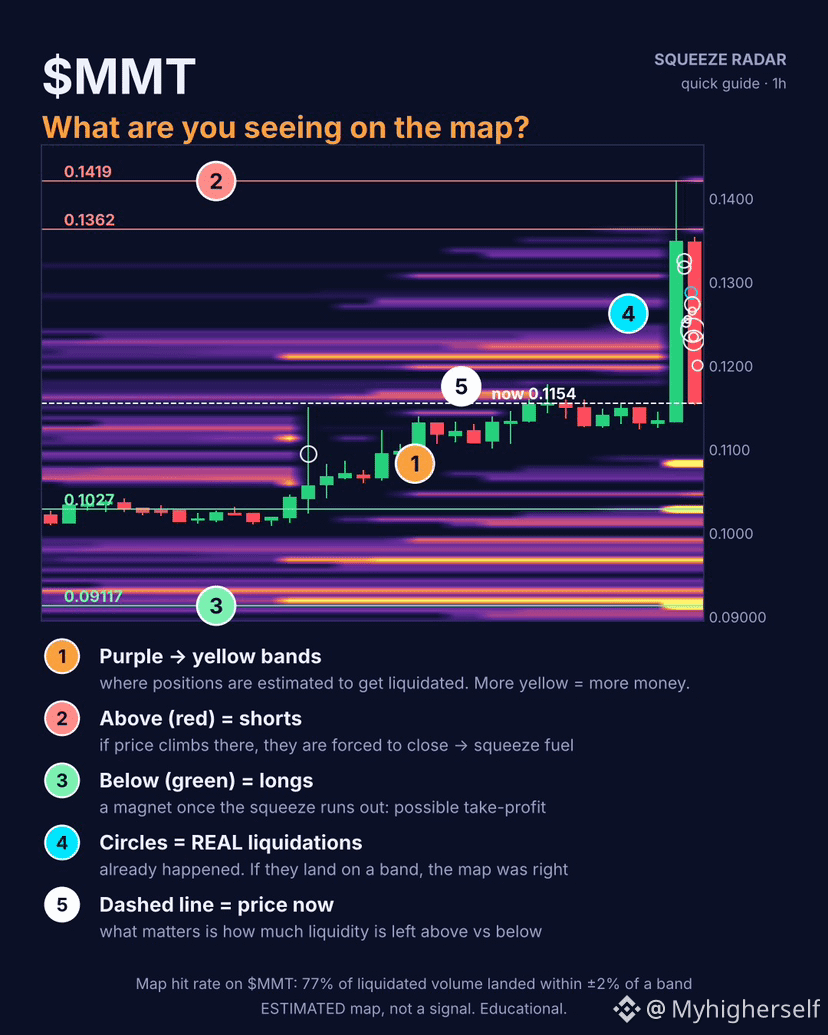
🔍 What are you seeing on a liquidation map? Quick guide with $MMT
A lot of you asked what the colors mean 👇
1️⃣ Purple → yellow bands: where positions are ESTIMATED to get liquidated. More yellow = more money stacked 💰
2️⃣ Above (red) = shorts. If price climbs there, they're forced to buy back → that's the fuel of a squeeze 🚀
3️⃣ Below (green) = longs. When the squeeze runs out, price often goes hunting them 🧲 (take-profit zone)
4️⃣ Circles = REAL liquidations that already happened. If they land on a band, the map was right ✅
5️⃣ Dashed line = price now. The key is comparing how much liquidity is left above vs below ⚖️
📊 $MMT today: pump on 12× volume, wick to 0.1420, now back to ~0.115. Only small bands left above (~10k); much more below (~186k at 0.103 and 0.091).
🎯 Map hit rate on $MMT: ~77% of liquidated volume landed within ±2% of an estimated band. Not 100%, and it never will be.
⚠️ ESTIMATED map. Educational only, not a signal or financial advice. Manage your risk.
#SqueezeRadar #MMT #Liquidation #Trading #Crypto
🔍 What are you seeing on a liquidation map? Quick guide with $MMT
A lot of you asked what the colors mean 👇
1️⃣ Purple → yellow bands: where positions are ESTIMATED to get liquidated. More yellow = more money stacked 💰
2️⃣ Above (red) = shorts. If price climbs there, they're forced to buy back → that's the fuel of a squeeze 🚀
3️⃣ Below (green) = longs. When the squeeze runs out, price often goes hunting them 🧲 (take-profit zone)
4️⃣ Circles = REAL liquidations that already happened. If they land on a band, the map was right ✅
5️⃣ Dashed line = price now. The key is comparing how much liquidity is left above vs below ⚖️
📊 $MMT today: pump on 12× volume, wick to 0.1420, now back to ~0.115. Only small bands left above (~10k); much more below (~186k at 0.103 and 0.091).
🎯 Map hit rate on $MMT : ~77% of liquidated volume landed within ±2% of an estimated band. Not 100%, and it never will be.
⚠️ ESTIMATED map. Educational only, not a signal or financial advice. Manage your risk.
#SqueezeRadar #MMT #Liquidation #Trading #Crypto
A lot of you asked what the colors mean 👇
1️⃣ Purple → yellow bands: where positions are ESTIMATED to get liquidated. More yellow = more money stacked 💰
2️⃣ Above (red) = shorts. If price climbs there, they're forced to buy back → that's the fuel of a squeeze 🚀
3️⃣ Below (green) = longs. When the squeeze runs out, price often goes hunting them 🧲 (take-profit zone)
4️⃣ Circles = REAL liquidations that already happened. If they land on a band, the map was right ✅
5️⃣ Dashed line = price now. The key is comparing how much liquidity is left above vs below ⚖️
📊 $MMT today: pump on 12× volume, wick to 0.1420, now back to ~0.115. Only small bands left above (~10k); much more below (~186k at 0.103 and 0.091).
🎯 Map hit rate on $MMT : ~77% of liquidated volume landed within ±2% of an estimated band. Not 100%, and it never will be.
⚠️ ESTIMATED map. Educational only, not a signal or financial advice. Manage your risk.
#SqueezeRadar #MMT #Liquidation #Trading #Crypto
456

🚨 $TRUMP : Can Bulls Regain Control?
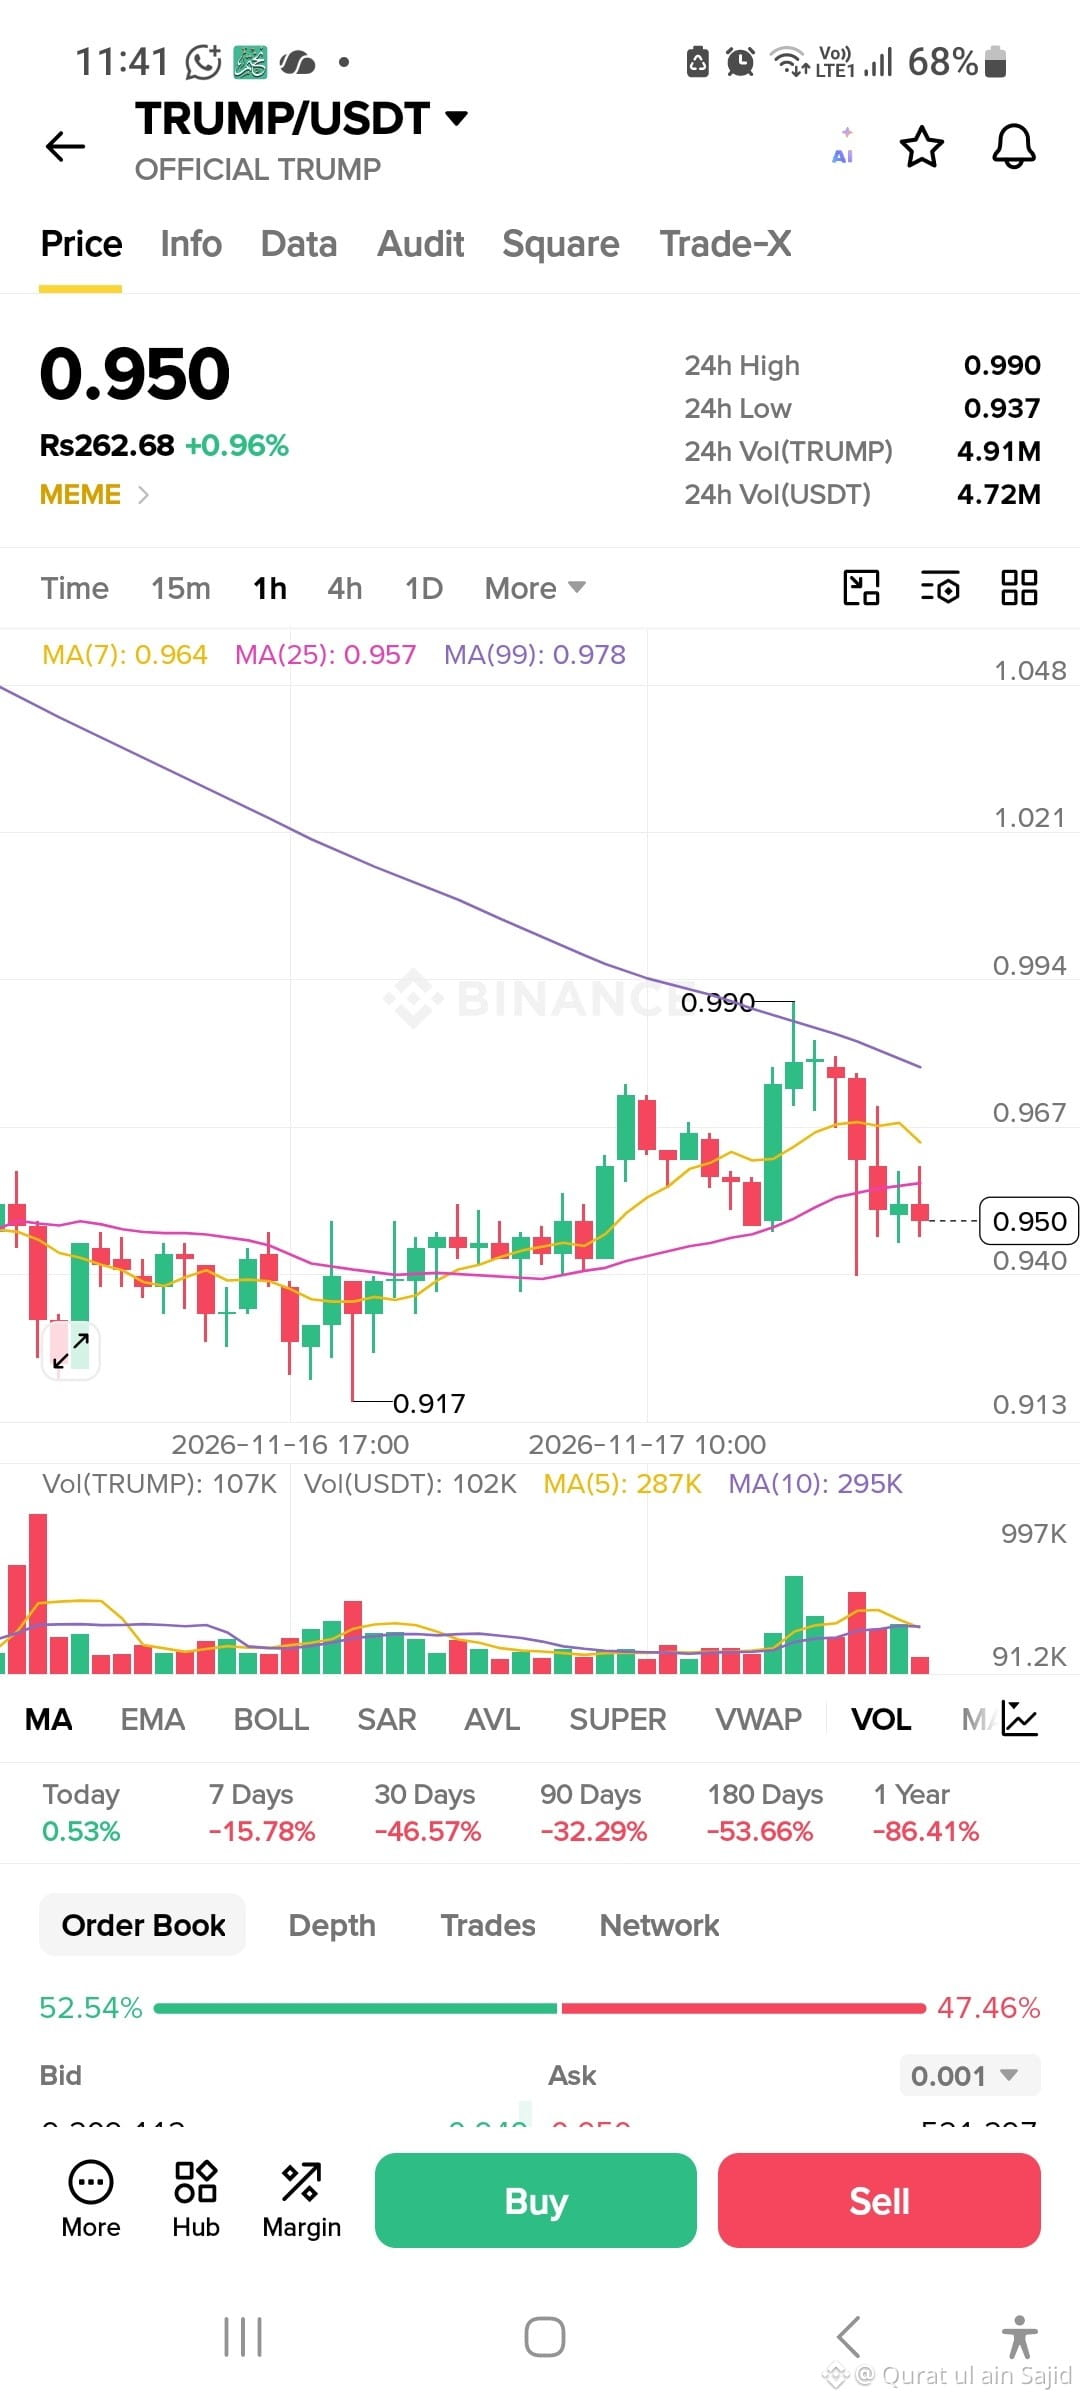
$TRUMP is trading at $0.950, up 0.96% in the last 24 hours.
📊 Key Technical Levels:
Resistance: $0.967 – $0.978
Major resistance: $0.990
Support: $0.940 – $0.937
Stronger support: $0.917
🔍 Market Outlook: The 1-hour chart shows short-term selling pressure, with price trading below MA(7), MA(25), and MA(99).
Bulls need to reclaim $0.967 to improve momentum. A break below $0.937 could bring further downside pressure.
👀 Key question: Will $TRUMP bounce from support or continue its bearish move?
What’s your view? Bullish 🟢 or Bearish 🔴?
#TRUMP #CryptoAnalysis #BinanceSquare #trading
{future}(TRUMPUSDT)
🚨 $TRUMP : Can Bulls Regain Control?
$TRUMP is trading at $0.950, up 0.96% in the last 24 hours.
📊 Key Technical Levels:
Resistance: $0.967 – $0.978
Major resistance: $0.990
Support: $0.940 – $0.937
Stronger support: $0.917
🔍 Market Outlook: The 1-hour chart shows short-term selling pressure, with price trading below MA(7), MA(25), and MA(99).
Bulls need to reclaim $0.967 to improve momentum. A break below $0.937 could bring further downside pressure.
👀 Key question: Will $TRUMP bounce from support or continue its bearish move?
What’s your view? Bullish 🟢 or Bearish 🔴?
#TRUMP #CryptoAnalysis #BinanceSquare #trading
$TRUMP is trading at $0.950, up 0.96% in the last 24 hours.
📊 Key Technical Levels:
Resistance: $0.967 – $0.978
Major resistance: $0.990
Support: $0.940 – $0.937
Stronger support: $0.917
🔍 Market Outlook: The 1-hour chart shows short-term selling pressure, with price trading below MA(7), MA(25), and MA(99).
Bulls need to reclaim $0.967 to improve momentum. A break below $0.937 could bring further downside pressure.
👀 Key question: Will $TRUMP bounce from support or continue its bearish move?
What’s your view? Bullish 🟢 or Bearish 🔴?
#TRUMP #CryptoAnalysis #BinanceSquare #trading
126

·
--
Bullish
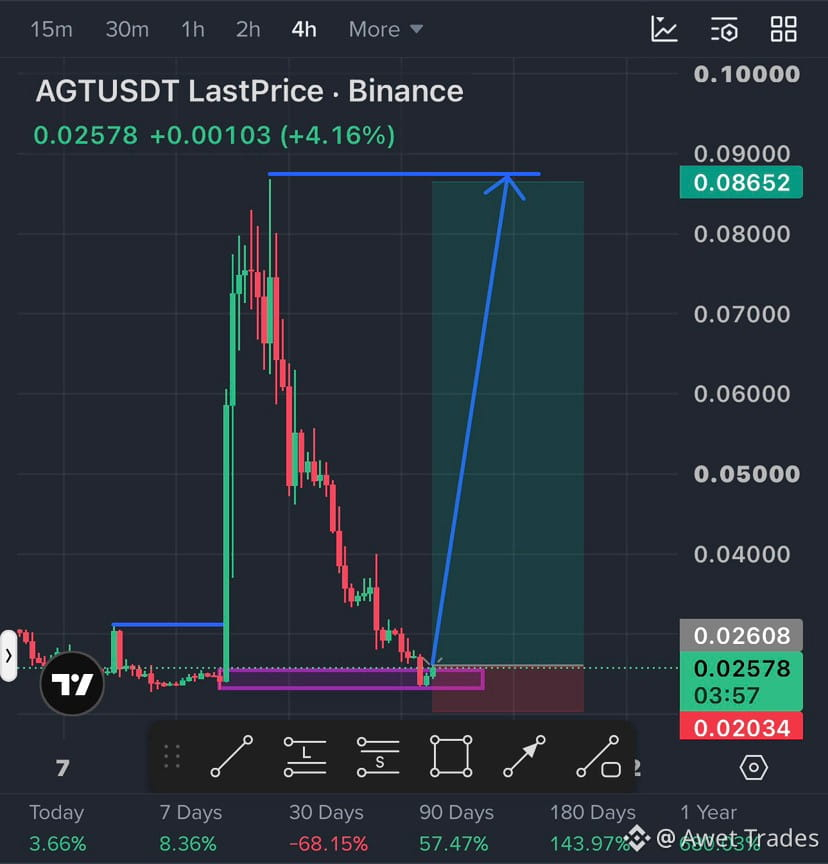
$AGT You sold AGT at the bottom again, didn't you?
You held it all the way down from 0.086 to 0.022, panic sold, and now it's bouncing.
Here's what I see on the chart...
AGT - 4h - Bullish
Price wicked into demand at 0.0220 - 0.0245 and is now holding at 0.02578. That was the bottom.
My plan: Long from demand. Entry ~0.0250. SL below 0.02034. TP 0.08652. If it closes below 0.02034, I'm wrong and I'm out.
You don't sell the bottom. You buy it.
Are you still holding AGT or did you sell the dip?
Not financial advice. DYOR.
#AGT #BinanceSquare #trading #Altcoins
$AGT You sold AGT at the bottom again, didn't you?
You held it all the way down from 0.086 to 0.022, panic sold, and now it's bouncing.
Here's what I see on the chart...
AGT - 4h - Bullish
Price wicked into demand at 0.0220 - 0.0245 and is now holding at 0.02578. That was the bottom.
My plan: Long from demand. Entry ~0.0250. SL below 0.02034. TP 0.08652. If it closes below 0.02034, I'm wrong and I'm out.
You don't sell the bottom. You buy it.
Are you still holding AGT or did you sell the dip?
Not financial advice. DYOR.
#AGT #BinanceSquare #trading #Altcoins
You held it all the way down from 0.086 to 0.022, panic sold, and now it's bouncing.
Here's what I see on the chart...
AGT - 4h - Bullish
Price wicked into demand at 0.0220 - 0.0245 and is now holding at 0.02578. That was the bottom.
My plan: Long from demand. Entry ~0.0250. SL below 0.02034. TP 0.08652. If it closes below 0.02034, I'm wrong and I'm out.
You don't sell the bottom. You buy it.
Are you still holding AGT or did you sell the dip?
Not financial advice. DYOR.
#AGT #BinanceSquare #trading #Altcoins
Papa scalper:
Tambien entre ayer 0.025. Tp0 0.079
1
834

·
--
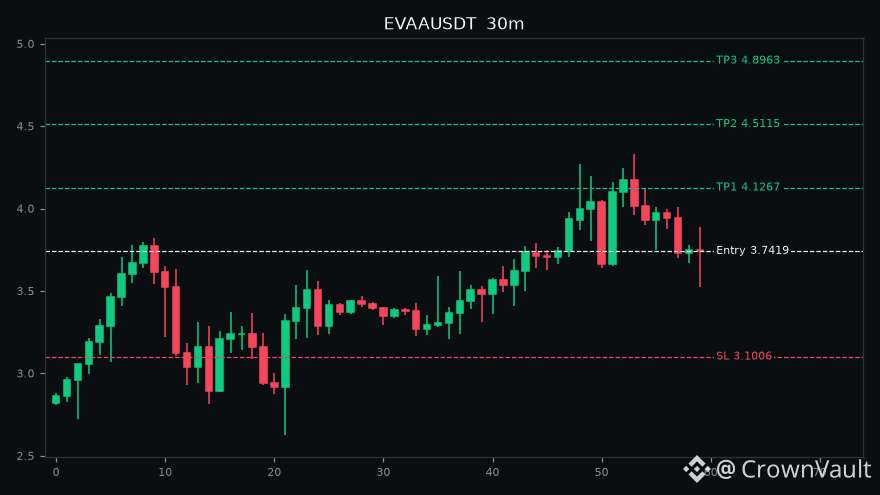
🔥 $EVAA IS TRYING TO RECOVER WHILE $龙虾 IS STABILIZING – WHICH COIN WILL WIN THE NEXT MOVE? 🚀
HIHP MARKET WATCH 📊
🟢 EVAA – $3.3578 (+15.05%)
EVAA is bouncing back after dropping from $3.5995. Buyers have stepped in near $3.2622, but price is still below its major moving averages. Can it reclaim $3.41 and push higher?
🟡 $龙虾 – $0.01441 (+7.06%)
After a sharp correction, the coin is showing a small recovery. Price is holding above MA(7), but resistance around $0.01481–$0.01497 needs attention.
🔥 3 HIHP TRADING TIPS:
1. Watch EVAA around $3.41 for a bullish recovery confirmation.
2. Watch break above $0.01497 with stronger volume.
3. Protect your capital with stop-losses and avoid chasing sudden pumps.
Two different charts, two recovery attempts – which one will surprise the market next? 👀
#EVAA #Crypto #Binance #Trading
🔥 $EVAA IS TRYING TO RECOVER WHILE $龙虾 IS STABILIZING – WHICH COIN WILL WIN THE NEXT MOVE? 🚀
HIHP MARKET WATCH 📊
🟢 EVAA – $3.3578 (+15.05%)
EVAA is bouncing back after dropping from $3.5995. Buyers have stepped in near $3.2622, but price is still below its major moving averages. Can it reclaim $3.41 and push higher?
🟡 $龙虾 – $0.01441 (+7.06%)
After a sharp correction, the coin is showing a small recovery. Price is holding above MA(7), but resistance around $0.01481–$0.01497 needs attention.
🔥 3 HIHP TRADING TIPS:
1. Watch EVAA around $3.41 for a bullish recovery confirmation.
2. Watch break above $0.01497 with stronger volume.
3. Protect your capital with stop-losses and avoid chasing sudden pumps.
Two different charts, two recovery attempts – which one will surprise the market next? 👀
#EVAA #Crypto #Binance #Trading
HIHP MARKET WATCH 📊
🟢 EVAA – $3.3578 (+15.05%)
EVAA is bouncing back after dropping from $3.5995. Buyers have stepped in near $3.2622, but price is still below its major moving averages. Can it reclaim $3.41 and push higher?
🟡 $龙虾 – $0.01441 (+7.06%)
After a sharp correction, the coin is showing a small recovery. Price is holding above MA(7), but resistance around $0.01481–$0.01497 needs attention.
🔥 3 HIHP TRADING TIPS:
1. Watch EVAA around $3.41 for a bullish recovery confirmation.
2. Watch break above $0.01497 with stronger volume.
3. Protect your capital with stop-losses and avoid chasing sudden pumps.
Two different charts, two recovery attempts – which one will surprise the market next? 👀
#EVAA #Crypto #Binance #Trading
2
844
·
--
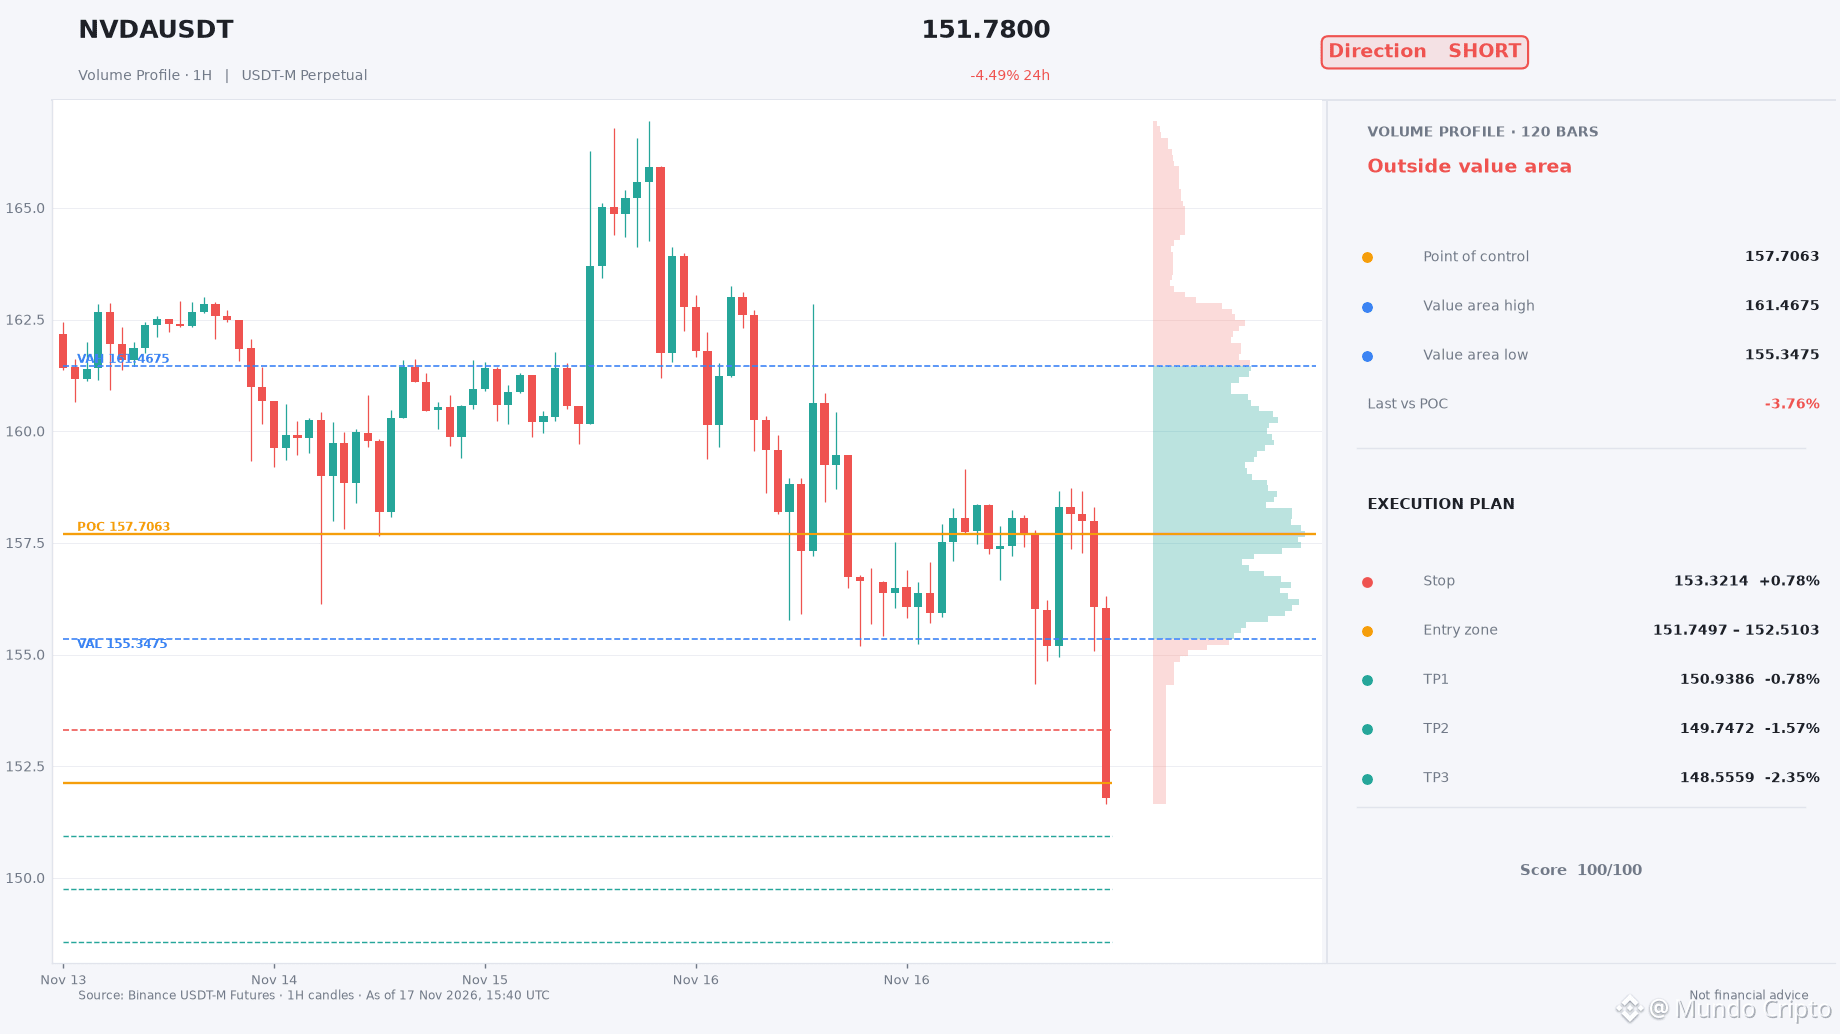
📉 $NVDA — SHORT · high conviction — this is a full-size setup.
🎯 Entry $151.75 – $152.51
✅ TP1 $150.94
✅ TP2 $149.75
✅ TP3 $148.56
🛑 Stop $153.32
Why SHORT?
• Trend is bearish (below EMA50 & EMA200)
• Sellers have the momentum (RSI 25.6)
• MACD trending bearish
• Elevated volume backing the move
Playing this setup? Let me know your target.
#NVDA #MundoCripto #Crypto #Trading
📉 $NVDA — SHORT · high conviction — this is a full-size setup.
🎯 Entry $151.75 – $152.51
✅ TP1 $150.94
✅ TP2 $149.75
✅ TP3 $148.56
🛑 Stop $153.32
Why SHORT?
• Trend is bearish (below EMA50 & EMA200)
• Sellers have the momentum (RSI 25.6)
• MACD trending bearish
• Elevated volume backing the move
Playing this setup? Let me know your target.
#NVDA #MundoCripto #Crypto #Trading
🎯 Entry $151.75 – $152.51
✅ TP1 $150.94
✅ TP2 $149.75
✅ TP3 $148.56
🛑 Stop $153.32
Why SHORT?
• Trend is bearish (below EMA50 & EMA200)
• Sellers have the momentum (RSI 25.6)
• MACD trending bearish
• Elevated volume backing the move
Playing this setup? Let me know your target.
#NVDA #MundoCripto #Crypto #Trading
Blay16:
How??
1
123

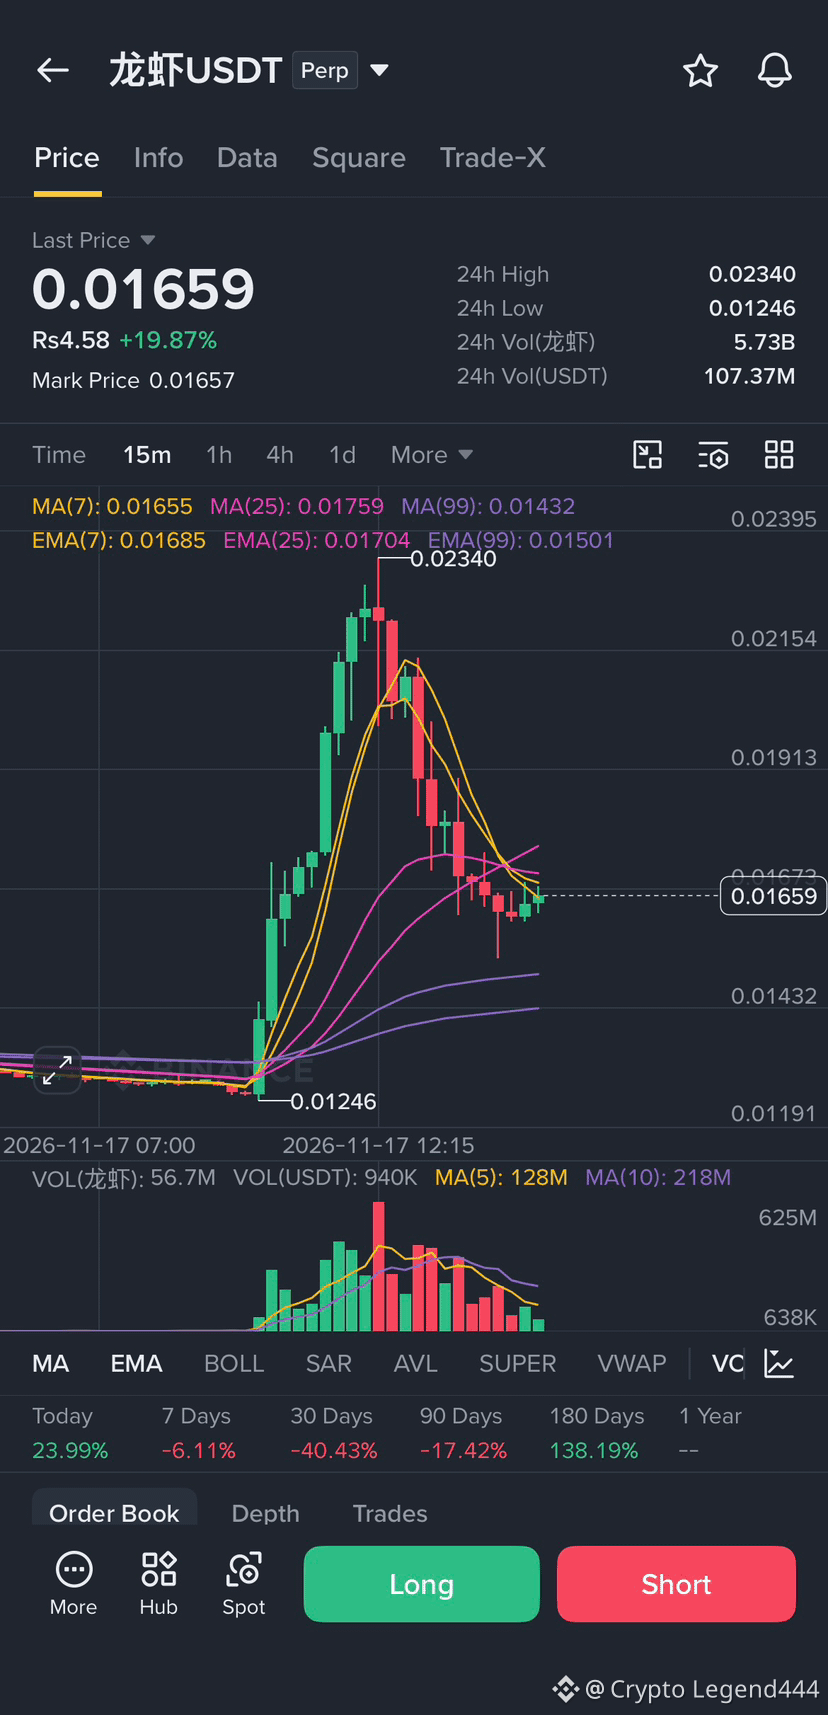
🚨 $龙虾 SHORT SETUP 🔻❤️
Entry Zone: 0.0165 – 0.0175
Stop Loss: 0.0185
🎯 TP1: 0.0150
🎯 TP2: 0.0135
🎯 TP3: 0.0125
Stay disciplined, protect your capital, and always use a stop loss! 🛡️🤝
#crypto #trading #ShortSetup
{future}(龙虾USDT)
🚨 $龙虾 SHORT SETUP 🔻❤️
Entry Zone: 0.0165 – 0.0175
Stop Loss: 0.0185
🎯 TP1: 0.0150
🎯 TP2: 0.0135
🎯 TP3: 0.0125
Stay disciplined, protect your capital, and always use a stop loss! 🛡️🤝
#crypto #trading #ShortSetup
Entry Zone: 0.0165 – 0.0175
Stop Loss: 0.0185
🎯 TP1: 0.0150
🎯 TP2: 0.0135
🎯 TP3: 0.0125
Stay disciplined, protect your capital, and always use a stop loss! 🛡️🤝
#crypto #trading #ShortSetup
1
104
·
--
Bullish
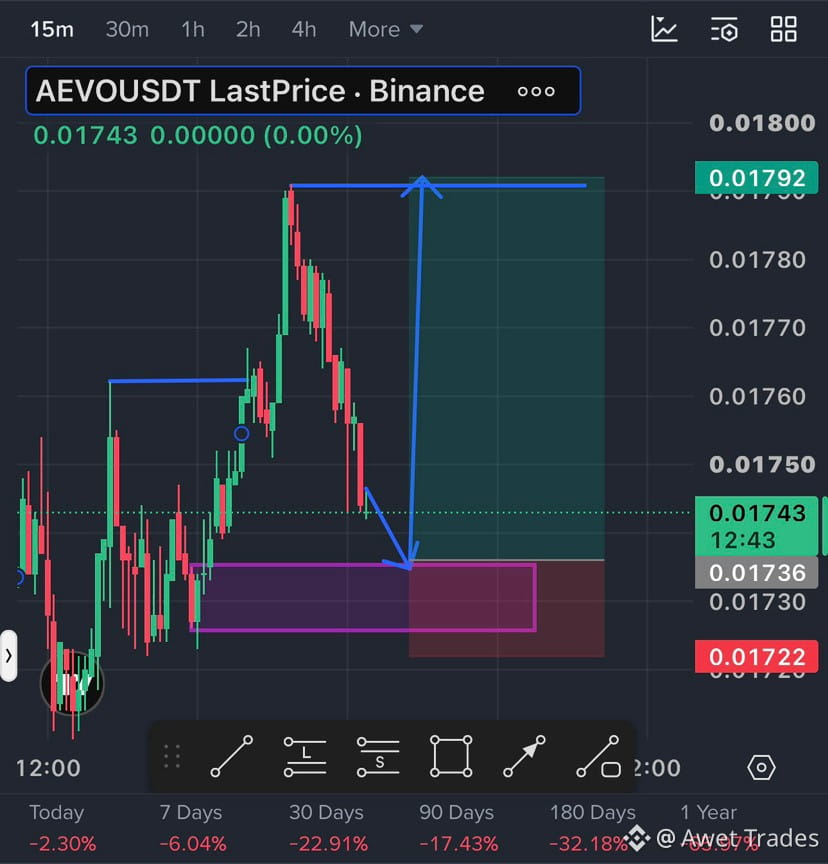
$AEVO Everyone is impatient with AEVO. That's why they lose.
AEVO - 15m - Bullish
Price at 0.01743. Demand at 0.01726 - 0.01736. I don't chase. I wait.
My plan: Long at 0.01730. SL below 0.01722. TP 0.01792. If it doesn't come to my zone, I don't trade. No FOMO. $AEVO
Not financial advice. DYOR.
#BinanceSquare #crypto #trading #Altcoins
{future}(AEVOUSDT)
$AEVO Everyone is impatient with AEVO. That's why they lose.
AEVO - 15m - Bullish
Price at 0.01743. Demand at 0.01726 - 0.01736. I don't chase. I wait.
My plan: Long at 0.01730. SL below 0.01722. TP 0.01792. If it doesn't come to my zone, I don't trade. No FOMO. $AEVO
Not financial advice. DYOR.
#BinanceSquare #crypto #trading #Altcoins
AEVO - 15m - Bullish
Price at 0.01743. Demand at 0.01726 - 0.01736. I don't chase. I wait.
My plan: Long at 0.01730. SL below 0.01722. TP 0.01792. If it doesn't come to my zone, I don't trade. No FOMO. $AEVO
Not financial advice. DYOR.
#BinanceSquare #crypto #trading #Altcoins
1
202

·
--
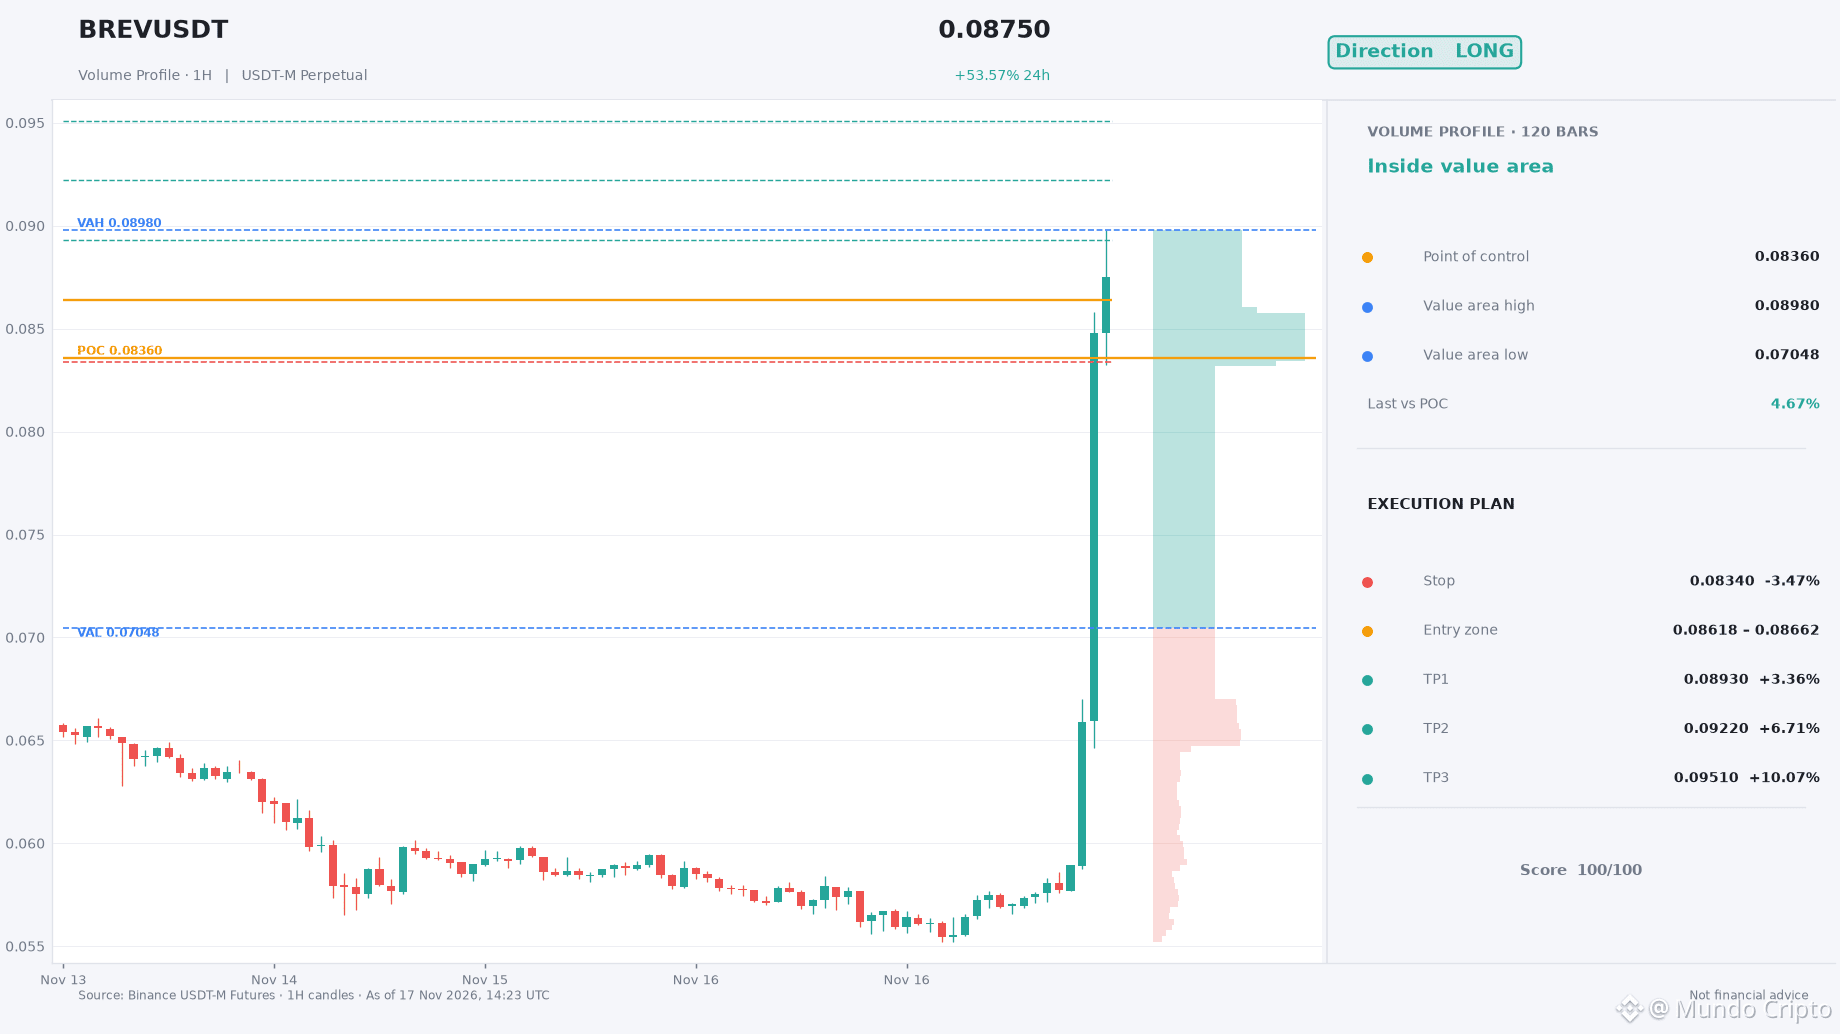
📈 $BREV — LONG · high conviction — this is a full-size setup.
🎯 Entry $0.08618 – $0.08662
✅ TP1 $0.08930
✅ TP2 $0.09220
✅ TP3 $0.09510
🛑 Stop $0.08340
Why LONG?
• Trend is bullish (above EMA50 & EMA200)
• Buyers have the momentum (RSI 90.4)
• MACD trending bullish
• Strong trend confirmed (ADX 62.0)
• Elevated volume backing the move
Where are you taking profits on BREV?
#BREV #MundoCripto #Crypto #Trading
📈 $BREV — LONG · high conviction — this is a full-size setup.
🎯 Entry $0.08618 – $0.08662
✅ TP1 $0.08930
✅ TP2 $0.09220
✅ TP3 $0.09510
🛑 Stop $0.08340
Why LONG?
• Trend is bullish (above EMA50 & EMA200)
• Buyers have the momentum (RSI 90.4)
• MACD trending bullish
• Strong trend confirmed (ADX 62.0)
• Elevated volume backing the move
Where are you taking profits on BREV?
#BREV #MundoCripto #Crypto #Trading
🎯 Entry $0.08618 – $0.08662
✅ TP1 $0.08930
✅ TP2 $0.09220
✅ TP3 $0.09510
🛑 Stop $0.08340
Why LONG?
• Trend is bullish (above EMA50 & EMA200)
• Buyers have the momentum (RSI 90.4)
• MACD trending bullish
• Strong trend confirmed (ADX 62.0)
• Elevated volume backing the move
Where are you taking profits on BREV?
#BREV #MundoCripto #Crypto #Trading
148

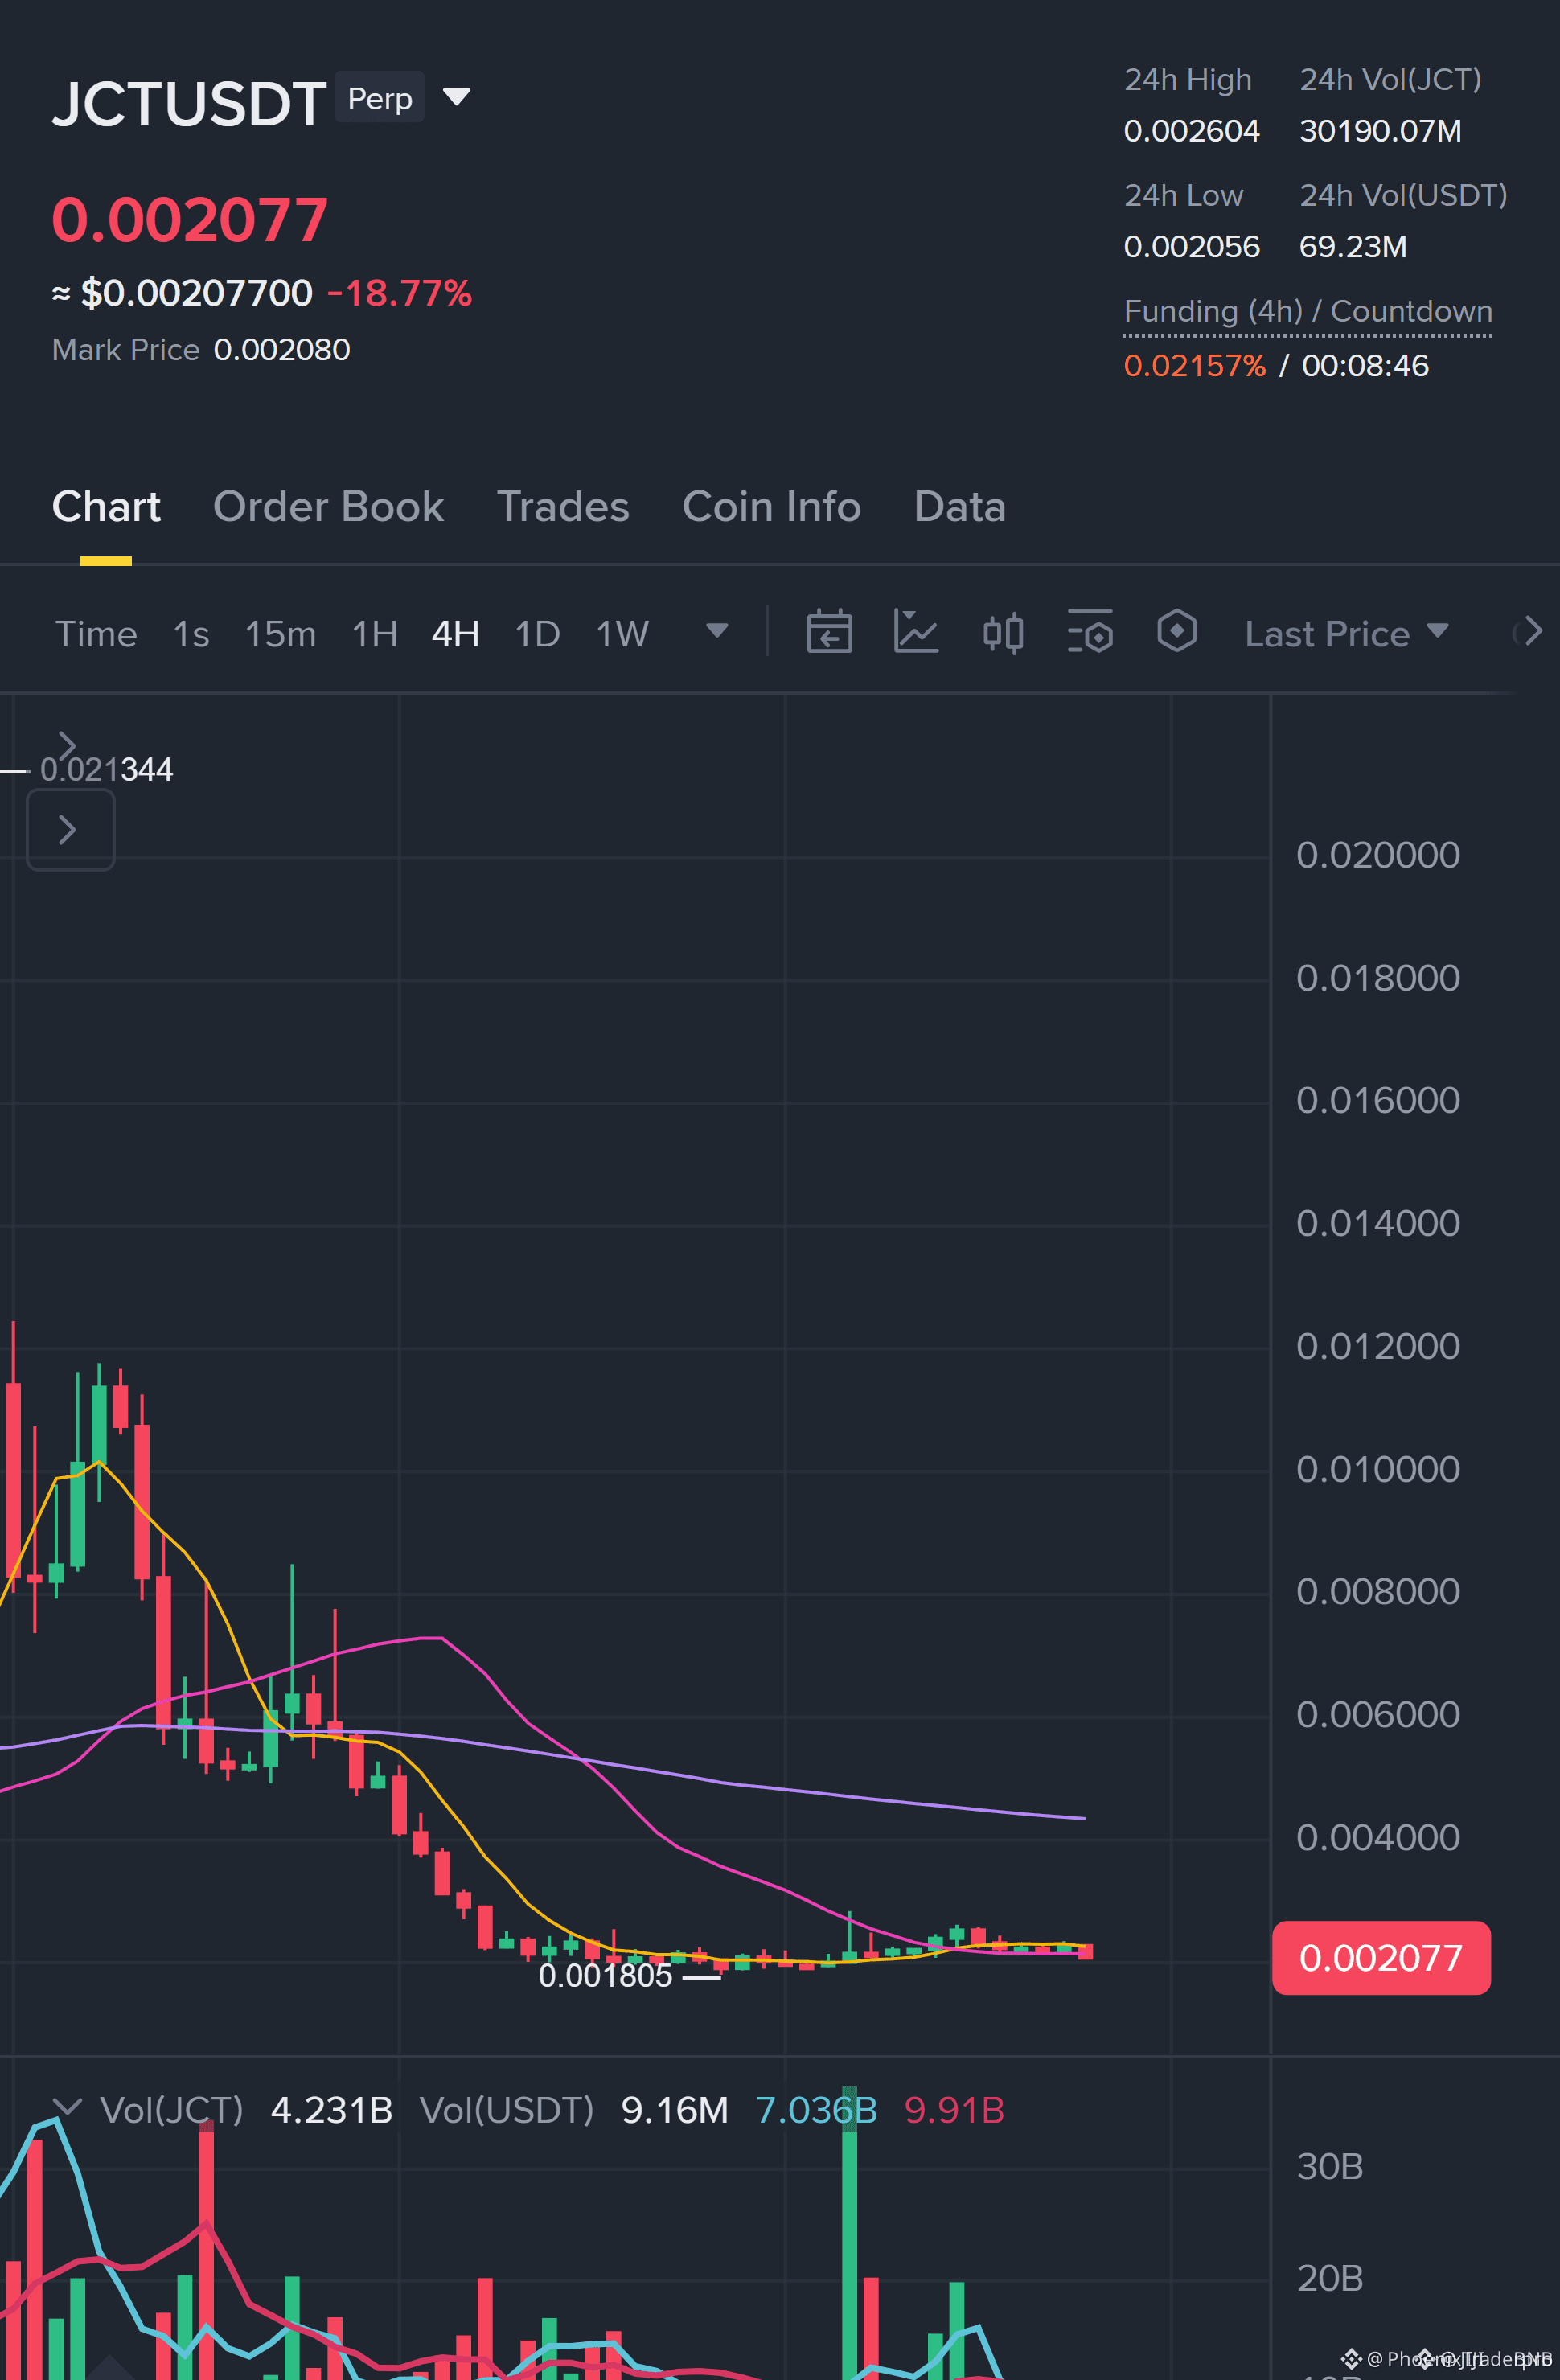
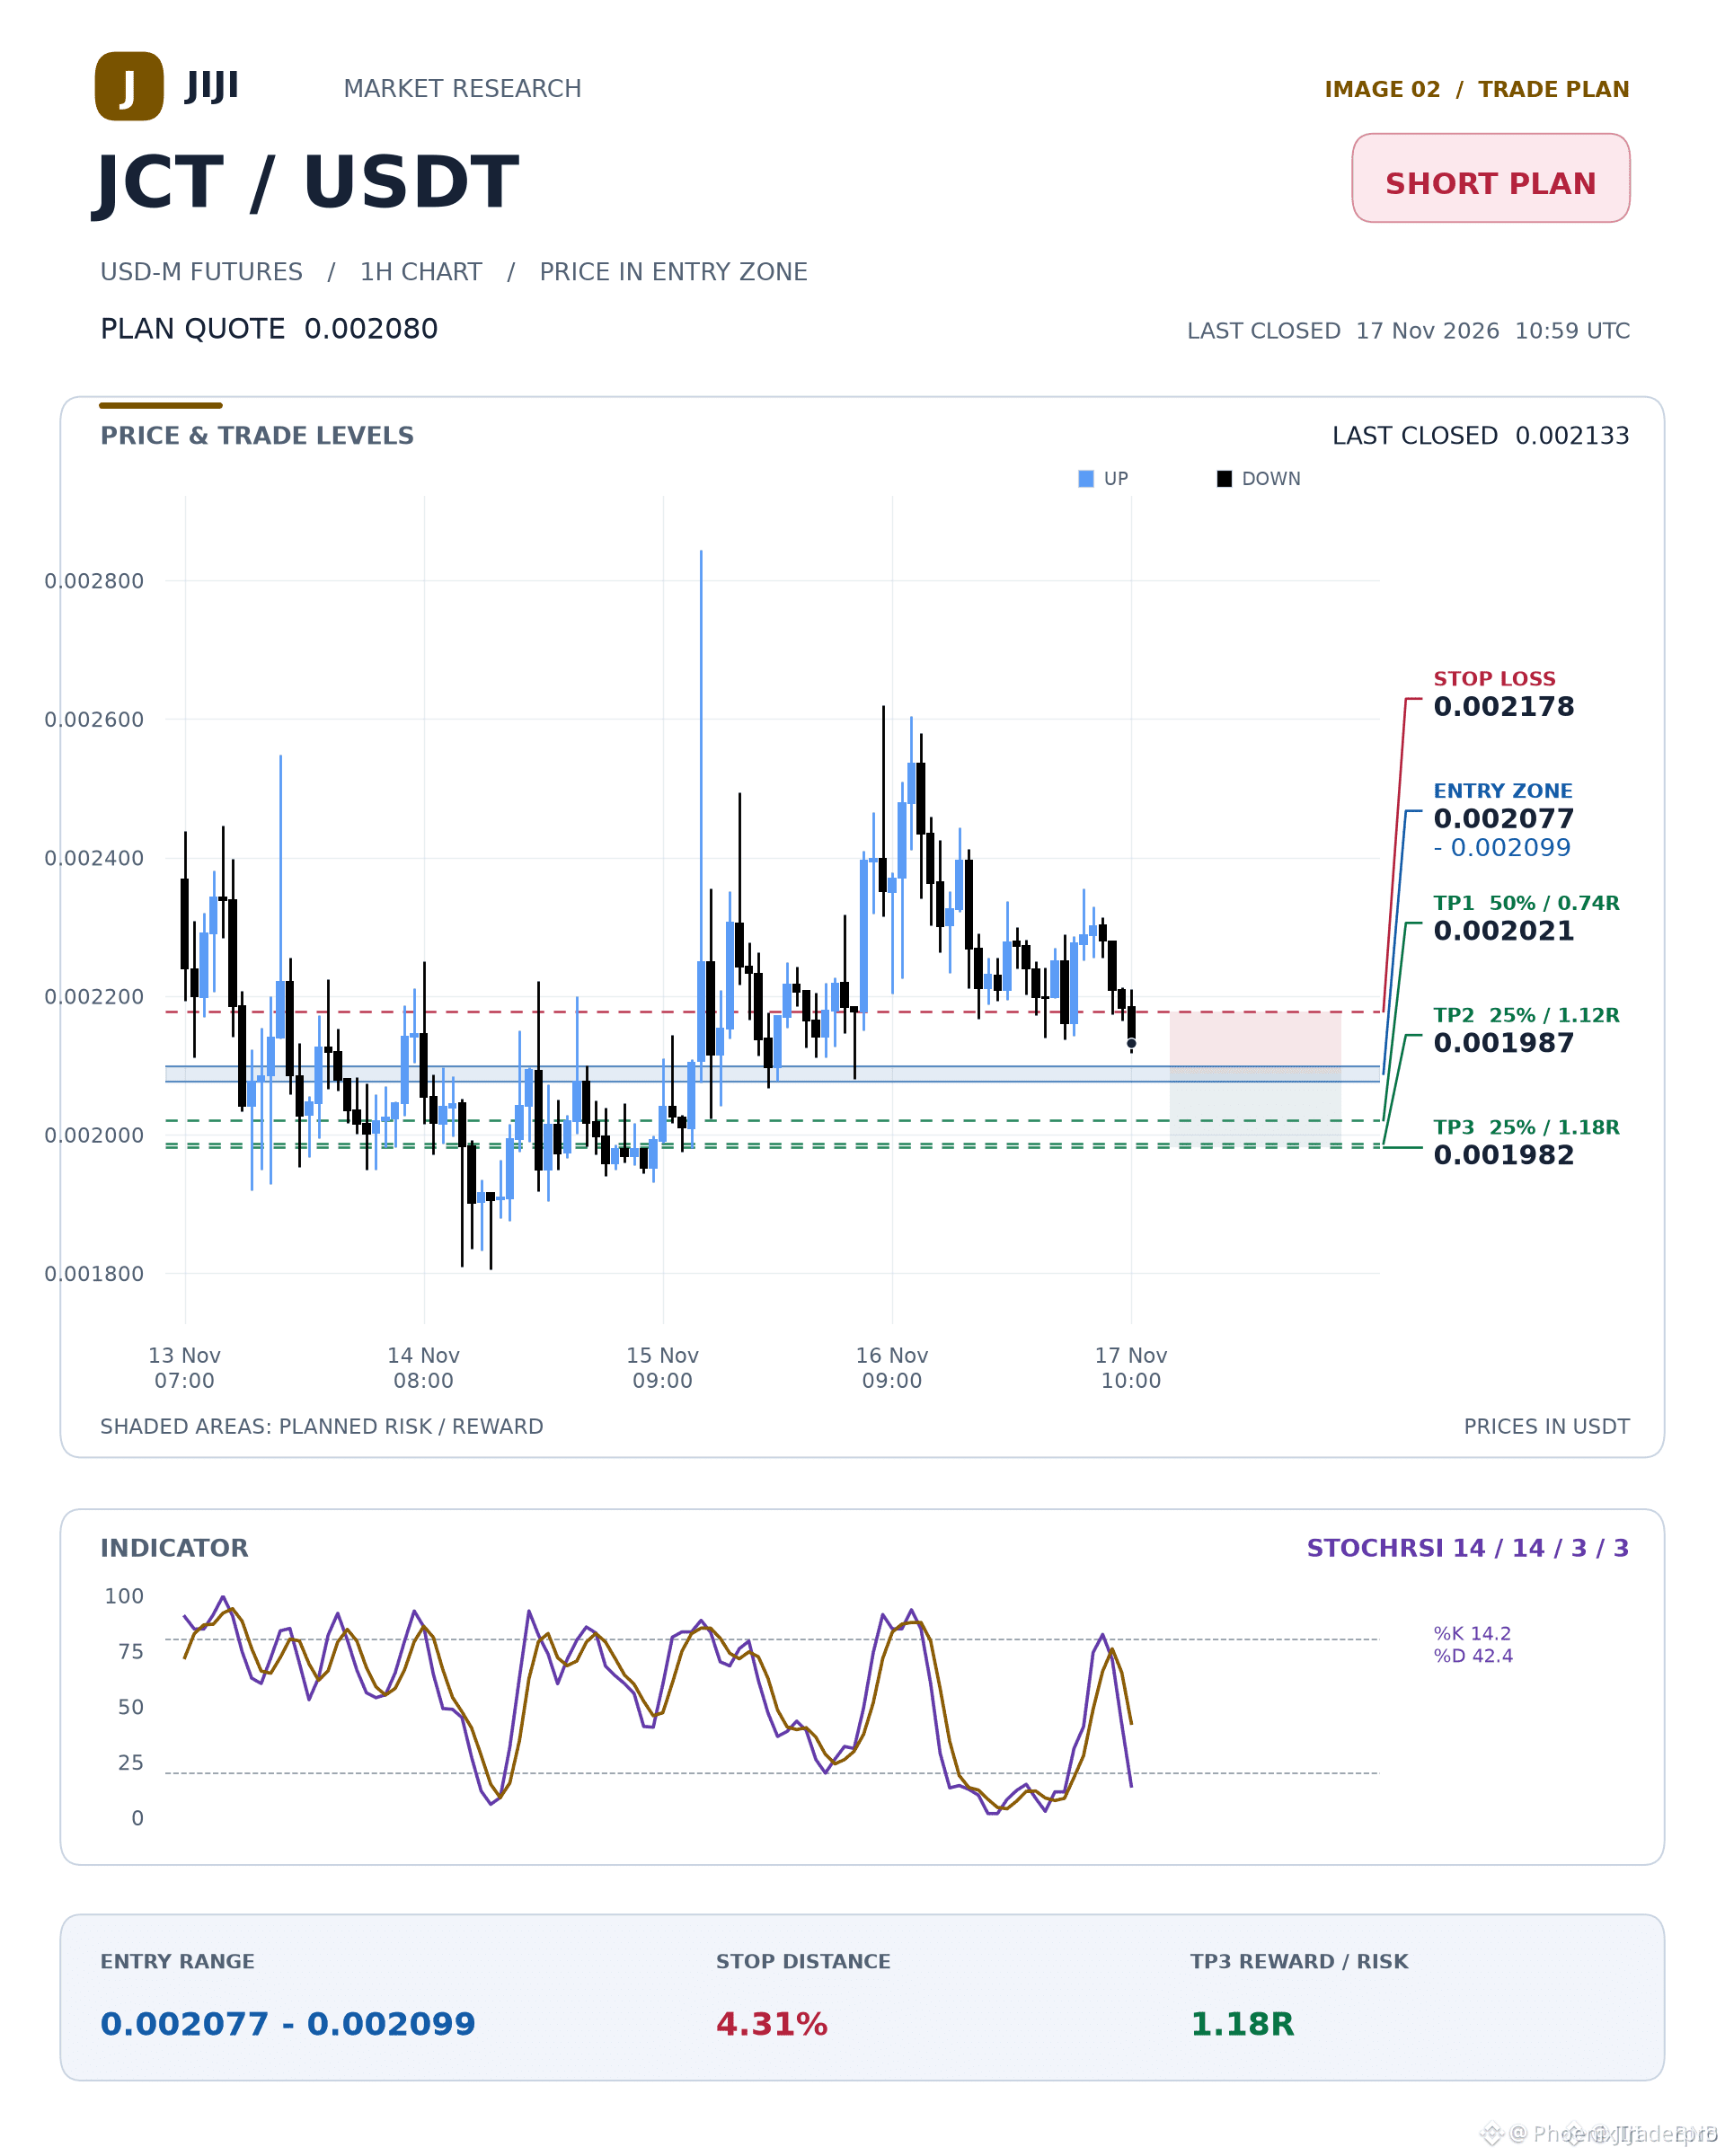
🔴 $JCT BEARS CIRCLING AS THE FOUR HOUR EMA STRUCTURE SLIDES LOWER 📉
Entry: 0.002077 - 0.002099 ⚡
Target: 0.001982 🚀
Stop Loss: 0.002178 ⚠️
Sellers are firmly in control of the tape as the four hour moving average structure leans heavily toward downside continuation. Price action is currently consolidating just above immediate one hour support, creating a textbook setup for short sellers waiting for a retracement into the upper supply pocket. 📊
Discipline defines longevity in this game. Waiting for a confirmed lower timeframe candle close ensures we avoid front-running a choppy bounce off local floor levels. 💡
Are you fading this bounce attempt or waiting for a complete break of support before entering? 👇
⚠️ Not financial advice. Always manage your risk. 🛡️
🏷️ #JCT #ShortSetup #CryptoFutures #Trading
📉 🦈
🔴 $JCT BEARS CIRCLING AS THE FOUR HOUR EMA STRUCTURE SLIDES LOWER 📉
Entry: 0.002077 - 0.002099 ⚡
Target: 0.001982 🚀
Stop Loss: 0.002178 ⚠️
Sellers are firmly in control of the tape as the four hour moving average structure leans heavily toward downside continuation. Price action is currently consolidating just above immediate one hour support, creating a textbook setup for short sellers waiting for a retracement into the upper supply pocket. 📊
Discipline defines longevity in this game. Waiting for a confirmed lower timeframe candle close ensures we avoid front-running a choppy bounce off local floor levels. 💡
Are you fading this bounce attempt or waiting for a complete break of support before entering? 👇
⚠️ Not financial advice. Always manage your risk. 🛡️
🏷️ #JCT #ShortSetup #CryptoFutures #Trading
📉 🦈
Entry: 0.002077 - 0.002099 ⚡
Target: 0.001982 🚀
Stop Loss: 0.002178 ⚠️
Sellers are firmly in control of the tape as the four hour moving average structure leans heavily toward downside continuation. Price action is currently consolidating just above immediate one hour support, creating a textbook setup for short sellers waiting for a retracement into the upper supply pocket. 📊
Discipline defines longevity in this game. Waiting for a confirmed lower timeframe candle close ensures we avoid front-running a choppy bounce off local floor levels. 💡
Are you fading this bounce attempt or waiting for a complete break of support before entering? 👇
⚠️ Not financial advice. Always manage your risk. 🛡️
🏷️ #JCT #ShortSetup #CryptoFutures #Trading
📉 🦈
33
Log in to explore more content
Join global crypto users on Binance Square
⚡️ Get latest and useful information about crypto.
💬 Trusted by the world’s largest crypto exchange.
👍 Discover real insights from verified creators.
Email / Phone number
Trending Topics
1
#NvidiaEarningsTonight:AIStocks’NextMove?
112,973 views
1,240 Discussing
2
#A Packed Week of Earnings and Data Tests Markets
143,540 views
652 Discussing
3
#AnthropicIPOTestsInvestorAppetiteForAI
317,533 views
2,851 Discussing
4
#NvidiaBoardNotConsideringHuang’sReturnasCEO
113,199 views
943 Discussing
5
#KOSPIFalls2.59%ToLowestCloseSinceFebruary
28,432 views
306 Discussing
6
#AnthropicClearedToListOnNasdaqAsANT
25,429 views
264 Discussing
7
#WhatInvestmentSignalsDo13FFilingsReveal?
61,941 views
659 Discussing
8
#TetherCapitalMakesStrategicInvestmentInStables
14,108 views
112 Discussing
9
#EvernorthRecords$505MImpairmentOnPreListingXRP
1,725 views
20 Discussing
10
#GoldmanSachsReports$1.22BInEtherETFHoldings
1,271 views
17 Discussing