
#writetoarn
writetoarn
721 views
10 Discussing
Hot
Latest

·
--
Day 4 - How I’m learning without losing money 📚
After yesterday’s trap, you asked me how I learn without taking risks. Here’s my simple method with 0$ lost.
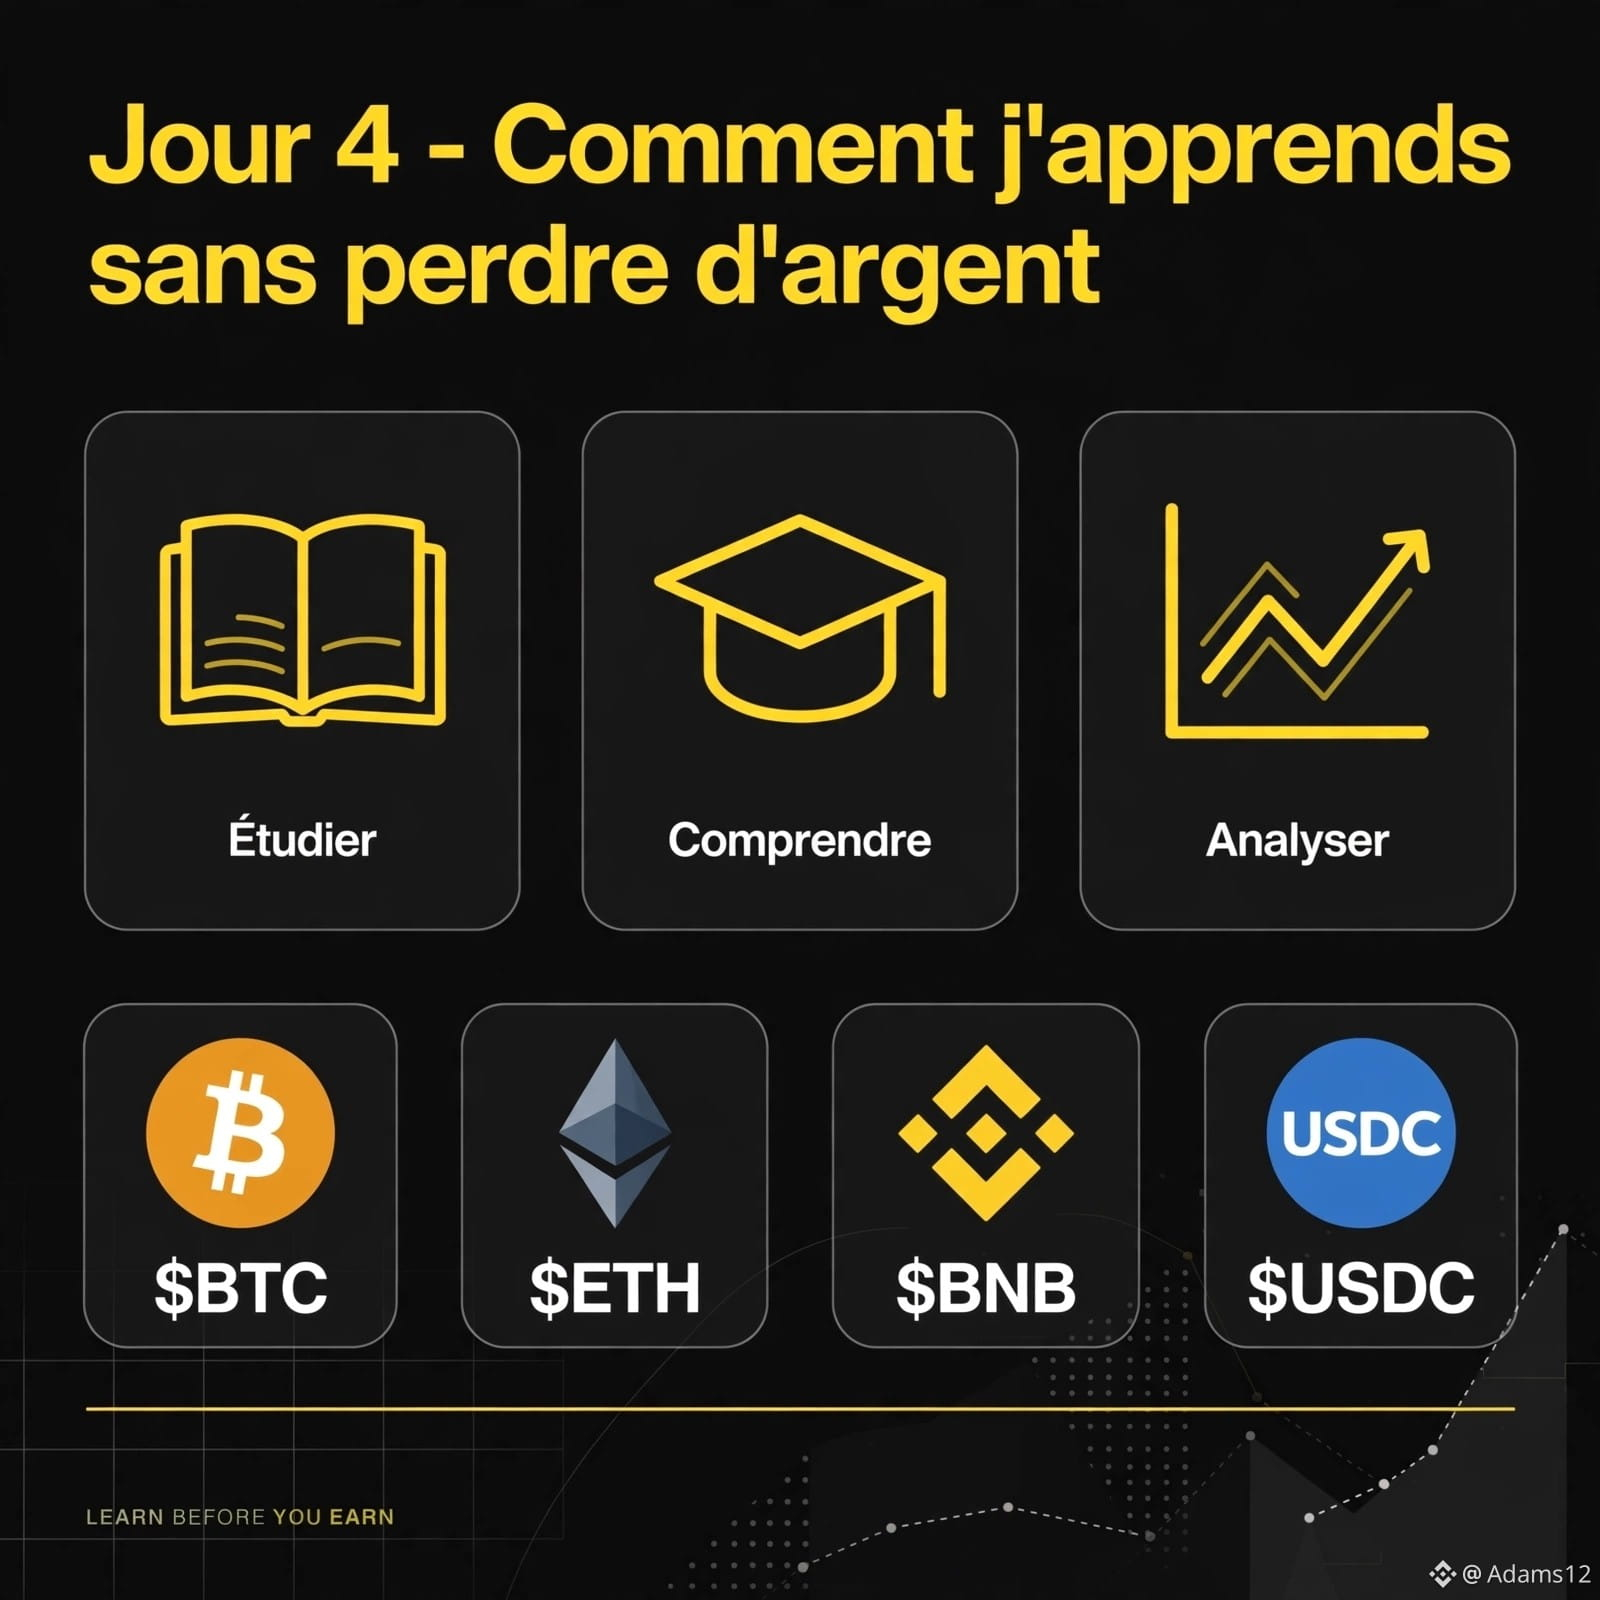
1. Binance Academy first: 30 minutes a day. I learned about $BTC and $ETH without paying.
2. Demo mode: I test on paper. I write “I’m buying $BNB at $600” and see if I was right the next day.
3. Small amount: When I’m sure, I put 2-3$ max into $USDC. No more than that.
The secret? Learn before you earn. Not the other way around.
And you, how did you learn at the beginning? Did you lose money at first, or did you learn beforehand?
$BTC $ETH $BNB $USDC #writetoarn #BinanceSquare #apprentissage #CryptoDebutant
Day 4 - How I’m learning without losing money 📚
After yesterday’s trap, you asked me how I learn without taking risks. Here’s my simple method with 0$ lost.
1. Binance Academy first: 30 minutes a day. I learned about $BTC and $ETH without paying.
2. Demo mode: I test on paper. I write “I’m buying $BNB at $600” and see if I was right the next day.
3. Small amount: When I’m sure, I put 2-3$ max into $USDC. No more than that.
The secret? Learn before you earn. Not the other way around.
And you, how did you learn at the beginning? Did you lose money at first, or did you learn beforehand?
$BTC $ETH $BNB $USDC #writetoarn #BinanceSquare #apprentissage #CryptoDebutant
After yesterday’s trap, you asked me how I learn without taking risks. Here’s my simple method with 0$ lost.
1. Binance Academy first: 30 minutes a day. I learned about $BTC and $ETH without paying.
2. Demo mode: I test on paper. I write “I’m buying $BNB at $600” and see if I was right the next day.
3. Small amount: When I’m sure, I put 2-3$ max into $USDC. No more than that.
The secret? Learn before you earn. Not the other way around.
And you, how did you learn at the beginning? Did you lose money at first, or did you learn beforehand?
$BTC $ETH $BNB $USDC #writetoarn #BinanceSquare #apprentissage #CryptoDebutant
1
1
682

/USDT Trading Update
🚨 DOS/USDT 1-Hour Chart Alert: Squeeze Play in Action! 🚨
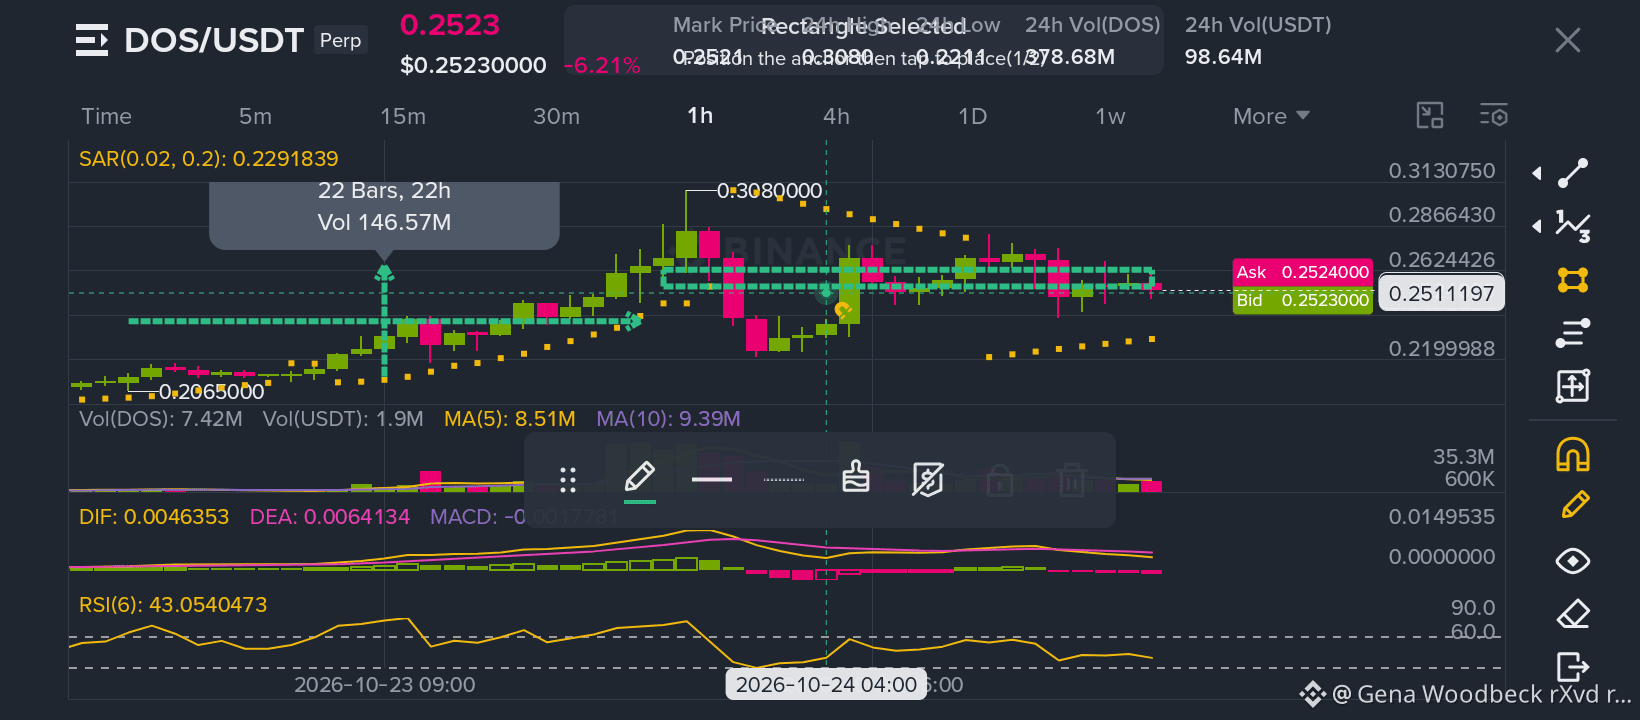
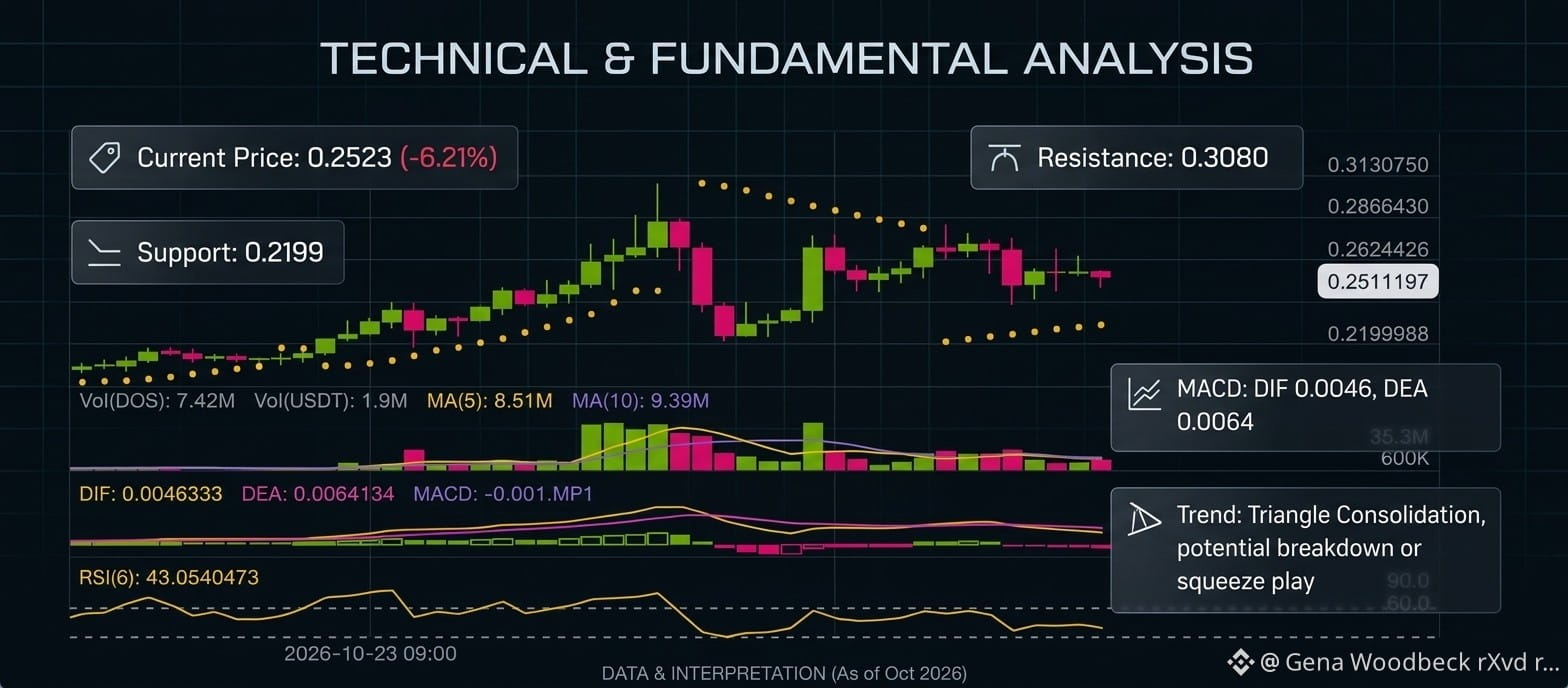
The DOS/USDT perpetual pair is flashing interesting signals on the 1H timeframe. Currently trading at 0.2523 (-6.21%), price action is compressing heavily inside a critical technical structure.
Here is my exclusive Technical and Fundamental breakdown:
🔹 Technical Breakdown & Triangle Structure:
• The Squeeze: Price is trapped inside a clear descending/symmetrical triangle structure. Volatility is dying out, meaning a massive breakout move is just around the corner.
• Key Resistance: Major ceiling identified at 0.3080 and immediate minor resistance near 0.2624. A breakout above this triangle confirms bullish continuation.
• Strong Support Zone: The ultimate demand zone lies tightly between 0.2199 and the historical low support zone near 0.2065.
🔹 Indicator Check:
• RSI (6): Sitting at 43.05 (Neutral zone). This shows room for expansion in either direction, but buyers are currently defending the lower boundary.
• MACD: The DIF (0.0046) and DEA (0.0064) lines are flattening. Watch out for a bullish crossover near the zero line for confirmation.
• Parabolic SAR: Dot is at 0.2291, hovering beneath the recent candles to act as a immediate defensive shield.
💡 Fundamental Perspective:
DOS network utility and decentralized data streaming are experiencing continuous integrations. With a solid 24h volume of $98.64M (USDT) and token volume over 146M, liquidity is strong. High liquidity inside a squeezing chart pattern always hints that whales are accumulating or preparing a volatile push.
🎯 Trading Strategy:
• Bullish Scenario: Wait for a clean 1H candle close above the upper resistance slope to long towards 0.2860 - 0.3130.
• Bearish Scenario: If support breaks, look for entries near the 0.2199 structural reload zone.
What is your bias on DOS? Breakout or Breakdown? Drop your charts below! 👇
#DOSUSDT #CryptoTrading #TechnicalAnalysis #Altcoins #BinanceSquare #write2earnonbinancesquare #writetoarn $DOS
{alpha}(560xb0f09ea9ae0515c3551080d4a745c8115aa30e37)
/USDT Trading Update
🚨 DOS/USDT 1-Hour Chart Alert: Squeeze Play in Action! 🚨
The DOS/USDT perpetual pair is flashing interesting signals on the 1H timeframe. Currently trading at 0.2523 (-6.21%), price action is compressing heavily inside a critical technical structure.
Here is my exclusive Technical and Fundamental breakdown:
🔹 Technical Breakdown & Triangle Structure:
• The Squeeze: Price is trapped inside a clear descending/symmetrical triangle structure. Volatility is dying out, meaning a massive breakout move is just around the corner.
• Key Resistance: Major ceiling identified at 0.3080 and immediate minor resistance near 0.2624. A breakout above this triangle confirms bullish continuation.
• Strong Support Zone: The ultimate demand zone lies tightly between 0.2199 and the historical low support zone near 0.2065.
🔹 Indicator Check:
• RSI (6): Sitting at 43.05 (Neutral zone). This shows room for expansion in either direction, but buyers are currently defending the lower boundary.
• MACD: The DIF (0.0046) and DEA (0.0064) lines are flattening. Watch out for a bullish crossover near the zero line for confirmation.
• Parabolic SAR: Dot is at 0.2291, hovering beneath the recent candles to act as a immediate defensive shield.
💡 Fundamental Perspective:
DOS network utility and decentralized data streaming are experiencing continuous integrations. With a solid 24h volume of $98.64M (USDT) and token volume over 146M, liquidity is strong. High liquidity inside a squeezing chart pattern always hints that whales are accumulating or preparing a volatile push.
🎯 Trading Strategy:
• Bullish Scenario: Wait for a clean 1H candle close above the upper resistance slope to long towards 0.2860 - 0.3130.
• Bearish Scenario: If support breaks, look for entries near the 0.2199 structural reload zone.
What is your bias on DOS? Breakout or Breakdown? Drop your charts below! 👇
#DOSUSDT #CryptoTrading #TechnicalAnalysis #Altcoins #BinanceSquare #write2earnonbinancesquare #writetoarn $DOS
🚨 DOS/USDT 1-Hour Chart Alert: Squeeze Play in Action! 🚨
The DOS/USDT perpetual pair is flashing interesting signals on the 1H timeframe. Currently trading at 0.2523 (-6.21%), price action is compressing heavily inside a critical technical structure.
Here is my exclusive Technical and Fundamental breakdown:
🔹 Technical Breakdown & Triangle Structure:
• The Squeeze: Price is trapped inside a clear descending/symmetrical triangle structure. Volatility is dying out, meaning a massive breakout move is just around the corner.
• Key Resistance: Major ceiling identified at 0.3080 and immediate minor resistance near 0.2624. A breakout above this triangle confirms bullish continuation.
• Strong Support Zone: The ultimate demand zone lies tightly between 0.2199 and the historical low support zone near 0.2065.
🔹 Indicator Check:
• RSI (6): Sitting at 43.05 (Neutral zone). This shows room for expansion in either direction, but buyers are currently defending the lower boundary.
• MACD: The DIF (0.0046) and DEA (0.0064) lines are flattening. Watch out for a bullish crossover near the zero line for confirmation.
• Parabolic SAR: Dot is at 0.2291, hovering beneath the recent candles to act as a immediate defensive shield.
💡 Fundamental Perspective:
DOS network utility and decentralized data streaming are experiencing continuous integrations. With a solid 24h volume of $98.64M (USDT) and token volume over 146M, liquidity is strong. High liquidity inside a squeezing chart pattern always hints that whales are accumulating or preparing a volatile push.
🎯 Trading Strategy:
• Bullish Scenario: Wait for a clean 1H candle close above the upper resistance slope to long towards 0.2860 - 0.3130.
• Bearish Scenario: If support breaks, look for entries near the 0.2199 structural reload zone.
What is your bias on DOS? Breakout or Breakdown? Drop your charts below! 👇
#DOSUSDT #CryptoTrading #TechnicalAnalysis #Altcoins #BinanceSquare #write2earnonbinancesquare #writetoarn $DOS
511
Log in to explore more content
Join global crypto users on Binance Square
⚡️ Get latest and useful information about crypto.
💬 Trusted by the world’s largest crypto exchange.
👍 Discover real insights from verified creators.
Email / Phone number
Trending Topics
1
#BitcoinRebounds$75KAsChipsLead
8,491 views
125 Discussing
2
#JobsReportRaisesHikeOdds
108,795 views
992 Discussing
3
#US Data Center Rules May Constrain AI Expansion
14,982 views
104 Discussing
4
#FinCENAndFedWithdraw$250CryptoTransferProposal
0 views
1 Discussing
5
#$2TWipedOutHedgeFundsFaceLiquidation
18,003 views
104 Discussing
6
#WillAnthropicListOnTime
19,913 views
310 Discussing
7
#USNovemberMichiganExpectationsIndexPrelimAt50.9
24,523 views
406 Discussing
8
#OilPlungesBelow$100
24,694 views
44 Discussing
9
#TradFiForBeginners
15,784 views
253 Discussing
10
#USMidtermsCouldShakeUpUS-IranTies
46,676 views
568 Discussing