
#tsla
tsla
1.2M views
4,392 Discussing
Hot
Latest

·
--
Bearish
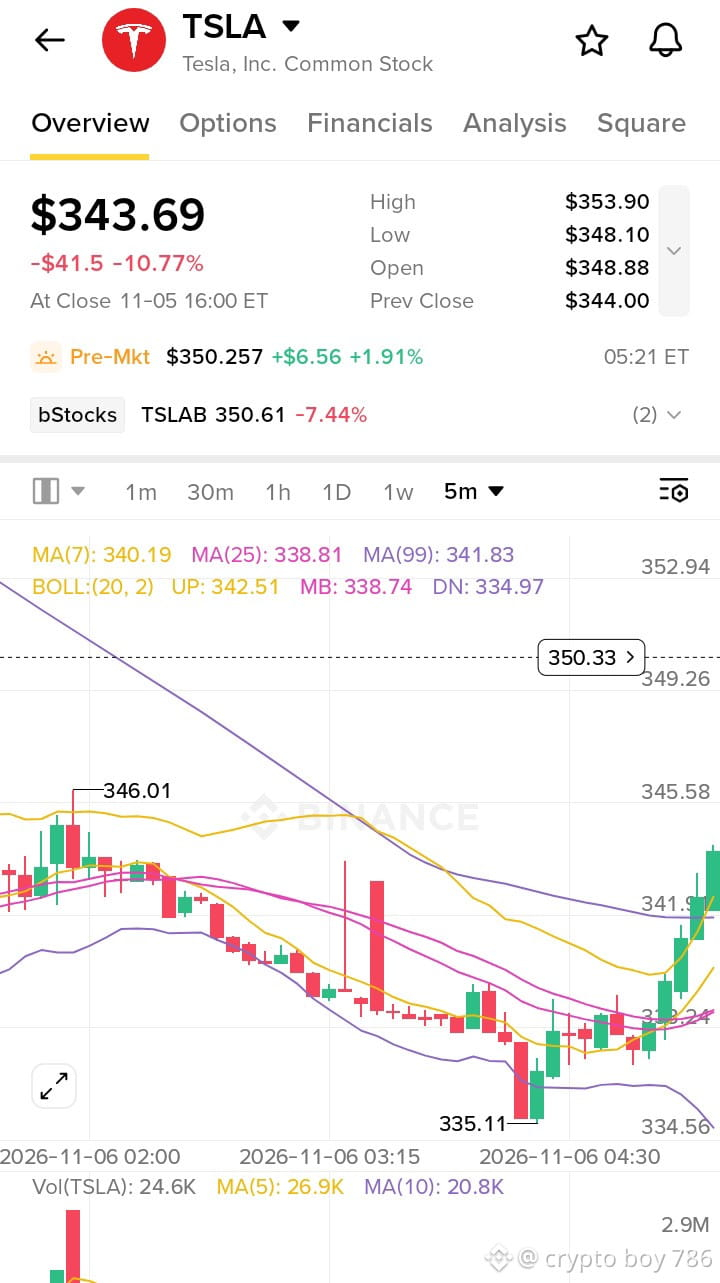
$TSLA – $350.68 (+2.03%)Tesla shares are moving higher, gaining 2.03% to reach $350.68. Investors continue watching the company's electric vehicle business, technology developments, and future growth opportunities. Today's gain shows encouraging momentum, although competition, delivery figures, and market sentiment remain important factors for Tesla's long-term performance.
$TSLA
{future}(TSLAUSDT)
#BinanceReopensWithdrawalsForMoreAssets #Write2Earn! #TSLA #Tesla #Investing
$TSLA – $350.68 (+2.03%)Tesla shares are moving higher, gaining 2.03% to reach $350.68. Investors continue watching the company's electric vehicle business, technology developments, and future growth opportunities. Today's gain shows encouraging momentum, although competition, delivery figures, and market sentiment remain important factors for Tesla's long-term performance.
$TSLA
#BinanceReopensWithdrawalsForMoreAssets #Write2Earn! #TSLA #Tesla #Investing
$TSLA
#BinanceReopensWithdrawalsForMoreAssets #Write2Earn! #TSLA #Tesla #Investing
87

·
--
Bullish
TSLA shorts are getting squeezed around $346.71531.
Buyers are forcing sellers out as upside liquidity clears.
$TSLA
{future}(TSLAUSDT)
$AKE
{future}(AKEUSDT)
$UAI
{future}(UAIUSDT)
🟢 LIQUIDITY ZONE HIT 🟢
Short liquidation spotted 🧨
$1.7682K cleared at $346.71531
Upside liquidity swept — watch reaction 👀
🎯 TP Targets:
TP1: ~$348.45
TP2: ~$350.18
TP3: ~$351.92
#TSLA
TSLA shorts are getting squeezed around $346.71531.
Buyers are forcing sellers out as upside liquidity clears.
$TSLA
$AKE
$UAI
🟢 LIQUIDITY ZONE HIT 🟢
Short liquidation spotted 🧨
$1.7682K cleared at $346.71531
Upside liquidity swept — watch reaction 👀
🎯 TP Targets:
TP1: ~$348.45
TP2: ~$350.18
TP3: ~$351.92
#TSLA
Buyers are forcing sellers out as upside liquidity clears.
$TSLA
$AKE
$UAI
🟢 LIQUIDITY ZONE HIT 🟢
Short liquidation spotted 🧨
$1.7682K cleared at $346.71531
Upside liquidity swept — watch reaction 👀
🎯 TP Targets:
TP1: ~$348.45
TP2: ~$350.18
TP3: ~$351.92
#TSLA
15

·
--
Bullish
🚀 $TSLA USDT – LONG OPPORTUNITY 📈
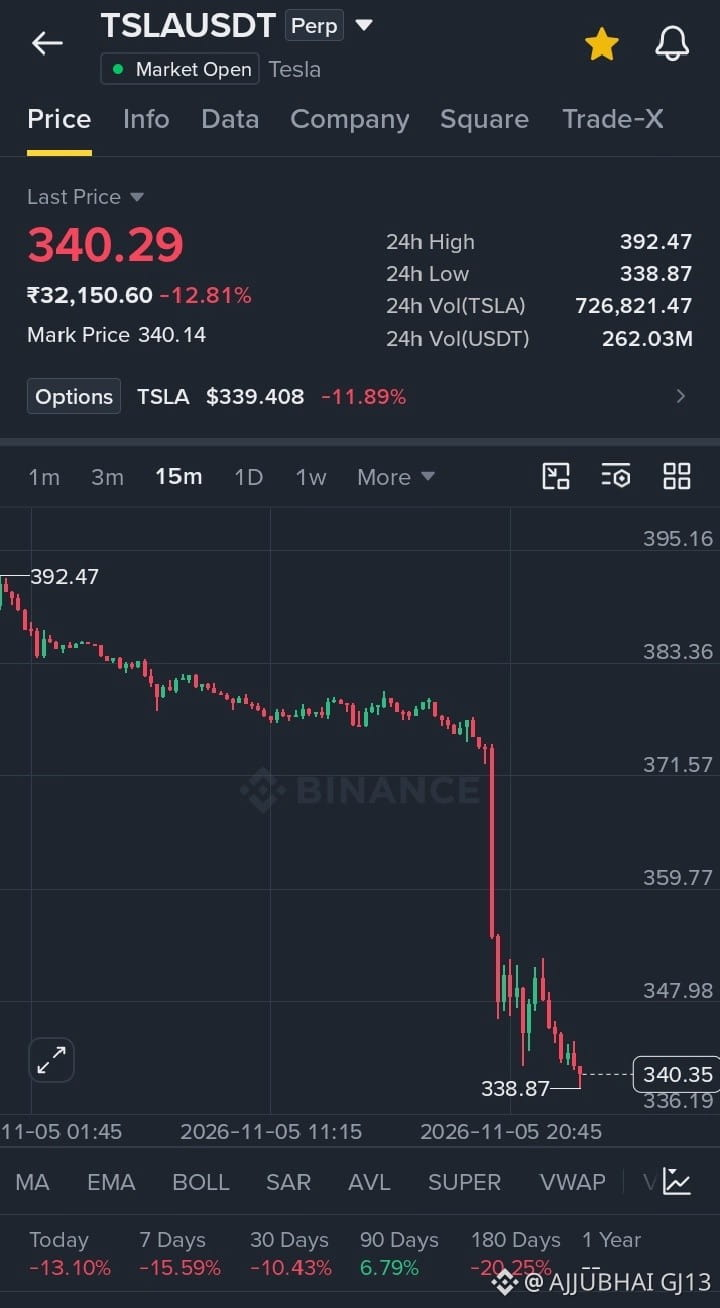
TSLA is trading near $340.29 after a strong correction. Price is approaching an important support zone around $338.87.
If buyers defend this support and reclaim the $345–$348 resistance zone, a bullish recovery could follow.
🎯 Potential Entry: $344–$348 (after confirmation)
🎯 Take Profit Levels:
- TP1: $352
- TP2: $359
- TP3: $368
🛑 Stop Loss: $336
📊 Market View: Short-term recovery setup. Wait for bullish confirmation before entering.
⚠️ High volatility – manage risk carefully. This is a technical setup, not a guaranteed trade.
#TSLA #Tesla #LONG #CryptoTrading
$TSLA
{future}(TSLAUSDT)
🚀 $TSLA USDT – LONG OPPORTUNITY 📈
TSLA is trading near $340.29 after a strong correction. Price is approaching an important support zone around $338.87.
If buyers defend this support and reclaim the $345–$348 resistance zone, a bullish recovery could follow.
🎯 Potential Entry: $344–$348 (after confirmation)
🎯 Take Profit Levels:
- TP1: $352
- TP2: $359
- TP3: $368
🛑 Stop Loss: $336
📊 Market View: Short-term recovery setup. Wait for bullish confirmation before entering.
⚠️ High volatility – manage risk carefully. This is a technical setup, not a guaranteed trade.
#TSLA #Tesla #LONG #CryptoTrading
$TSLA
TSLA is trading near $340.29 after a strong correction. Price is approaching an important support zone around $338.87.
If buyers defend this support and reclaim the $345–$348 resistance zone, a bullish recovery could follow.
🎯 Potential Entry: $344–$348 (after confirmation)
🎯 Take Profit Levels:
- TP1: $352
- TP2: $359
- TP3: $368
🛑 Stop Loss: $336
📊 Market View: Short-term recovery setup. Wait for bullish confirmation before entering.
⚠️ High volatility – manage risk carefully. This is a technical setup, not a guaranteed trade.
#TSLA #Tesla #LONG #CryptoTrading
$TSLA
2
163

·
--
🚨 $TSLA & $META PLUNGE AFTER DEMOCRATIC SWEEP! 💥
📊 The moment Democrats seized both chambers, the tech titans took a hit—$TSLA down 8.89%, $META sliding 3.13%. Market sentiment flipped faster than a candle on a 5‑minute chart, draining $2.3 T in a single session. ⚡
🦈 Smart‑money whales are likely hoarding liquidity below current levels, setting up a classic “liquidity sweep” that could force another short wave. Expect the order books to thin as sellers chase the last bids, while the next catalyst could be a policy tweak or earnings surprise. 📈
💬 Are you watching the depth for a re‑entry point, or sitting on the sidelines until the tide turns? 👇
⚠️ Not financial advice. Always manage your risk. 🛡️
🏷️ #TSLA #ShortSetup #MarketSwing #Crypto
🔥 💎
🚨 $TSLA & $META PLUNGE AFTER DEMOCRATIC SWEEP! 💥
📊 The moment Democrats seized both chambers, the tech titans took a hit—$TSLA down 8.89%, $META sliding 3.13%. Market sentiment flipped faster than a candle on a 5‑minute chart, draining $2.3 T in a single session. ⚡
🦈 Smart‑money whales are likely hoarding liquidity below current levels, setting up a classic “liquidity sweep” that could force another short wave. Expect the order books to thin as sellers chase the last bids, while the next catalyst could be a policy tweak or earnings surprise. 📈
💬 Are you watching the depth for a re‑entry point, or sitting on the sidelines until the tide turns? 👇
⚠️ Not financial advice. Always manage your risk. 🛡️
🏷️ #TSLA #ShortSetup #MarketSwing #Crypto
🔥 💎
📊 The moment Democrats seized both chambers, the tech titans took a hit—$TSLA down 8.89%, $META sliding 3.13%. Market sentiment flipped faster than a candle on a 5‑minute chart, draining $2.3 T in a single session. ⚡
🦈 Smart‑money whales are likely hoarding liquidity below current levels, setting up a classic “liquidity sweep” that could force another short wave. Expect the order books to thin as sellers chase the last bids, while the next catalyst could be a policy tweak or earnings surprise. 📈
💬 Are you watching the depth for a re‑entry point, or sitting on the sidelines until the tide turns? 👇
⚠️ Not financial advice. Always manage your risk. 🛡️
🏷️ #TSLA #ShortSetup #MarketSwing #Crypto
🔥 💎
25

·
--
🔴 $TSLA PLUNGES NEAR 9% AFTER DEMOCRATIC SWEEP! 🚨
📊 The fresh Democratic majority ignited a swift liquidity purge across the Magnificent 7, with $TSLA leading the charge at a near‑9% slide. 🦈
⚡ Smart money is likely harvesting stop‑loss clusters above recent highs, while the broader market sheds over $2.3 trillion in value, signaling aggressive short‑term pressure. 📉
💡 Watch the next 4‑hour candle for a potential continuation or a rapid rebound as traders recalibrate risk. 📈
💬 Are you positioning for a deeper dip or waiting for a rebound? 👇
⚠️ Not financial advice. Always manage your risk. 🛡️
🏷️ #TSLA #ShortSetup #LiquiditySweep #MarketShift
🚀 🦈
🔴 $TSLA PLUNGES NEAR 9% AFTER DEMOCRATIC SWEEP! 🚨
📊 The fresh Democratic majority ignited a swift liquidity purge across the Magnificent 7, with $TSLA leading the charge at a near‑9% slide. 🦈
⚡ Smart money is likely harvesting stop‑loss clusters above recent highs, while the broader market sheds over $2.3 trillion in value, signaling aggressive short‑term pressure. 📉
💡 Watch the next 4‑hour candle for a potential continuation or a rapid rebound as traders recalibrate risk. 📈
💬 Are you positioning for a deeper dip or waiting for a rebound? 👇
⚠️ Not financial advice. Always manage your risk. 🛡️
🏷️ #TSLA #ShortSetup #LiquiditySweep #MarketShift
🚀 🦈
📊 The fresh Democratic majority ignited a swift liquidity purge across the Magnificent 7, with $TSLA leading the charge at a near‑9% slide. 🦈
⚡ Smart money is likely harvesting stop‑loss clusters above recent highs, while the broader market sheds over $2.3 trillion in value, signaling aggressive short‑term pressure. 📉
💡 Watch the next 4‑hour candle for a potential continuation or a rapid rebound as traders recalibrate risk. 📈
💬 Are you positioning for a deeper dip or waiting for a rebound? 👇
⚠️ Not financial advice. Always manage your risk. 🛡️
🏷️ #TSLA #ShortSetup #LiquiditySweep #MarketShift
🚀 🦈
31

·
--
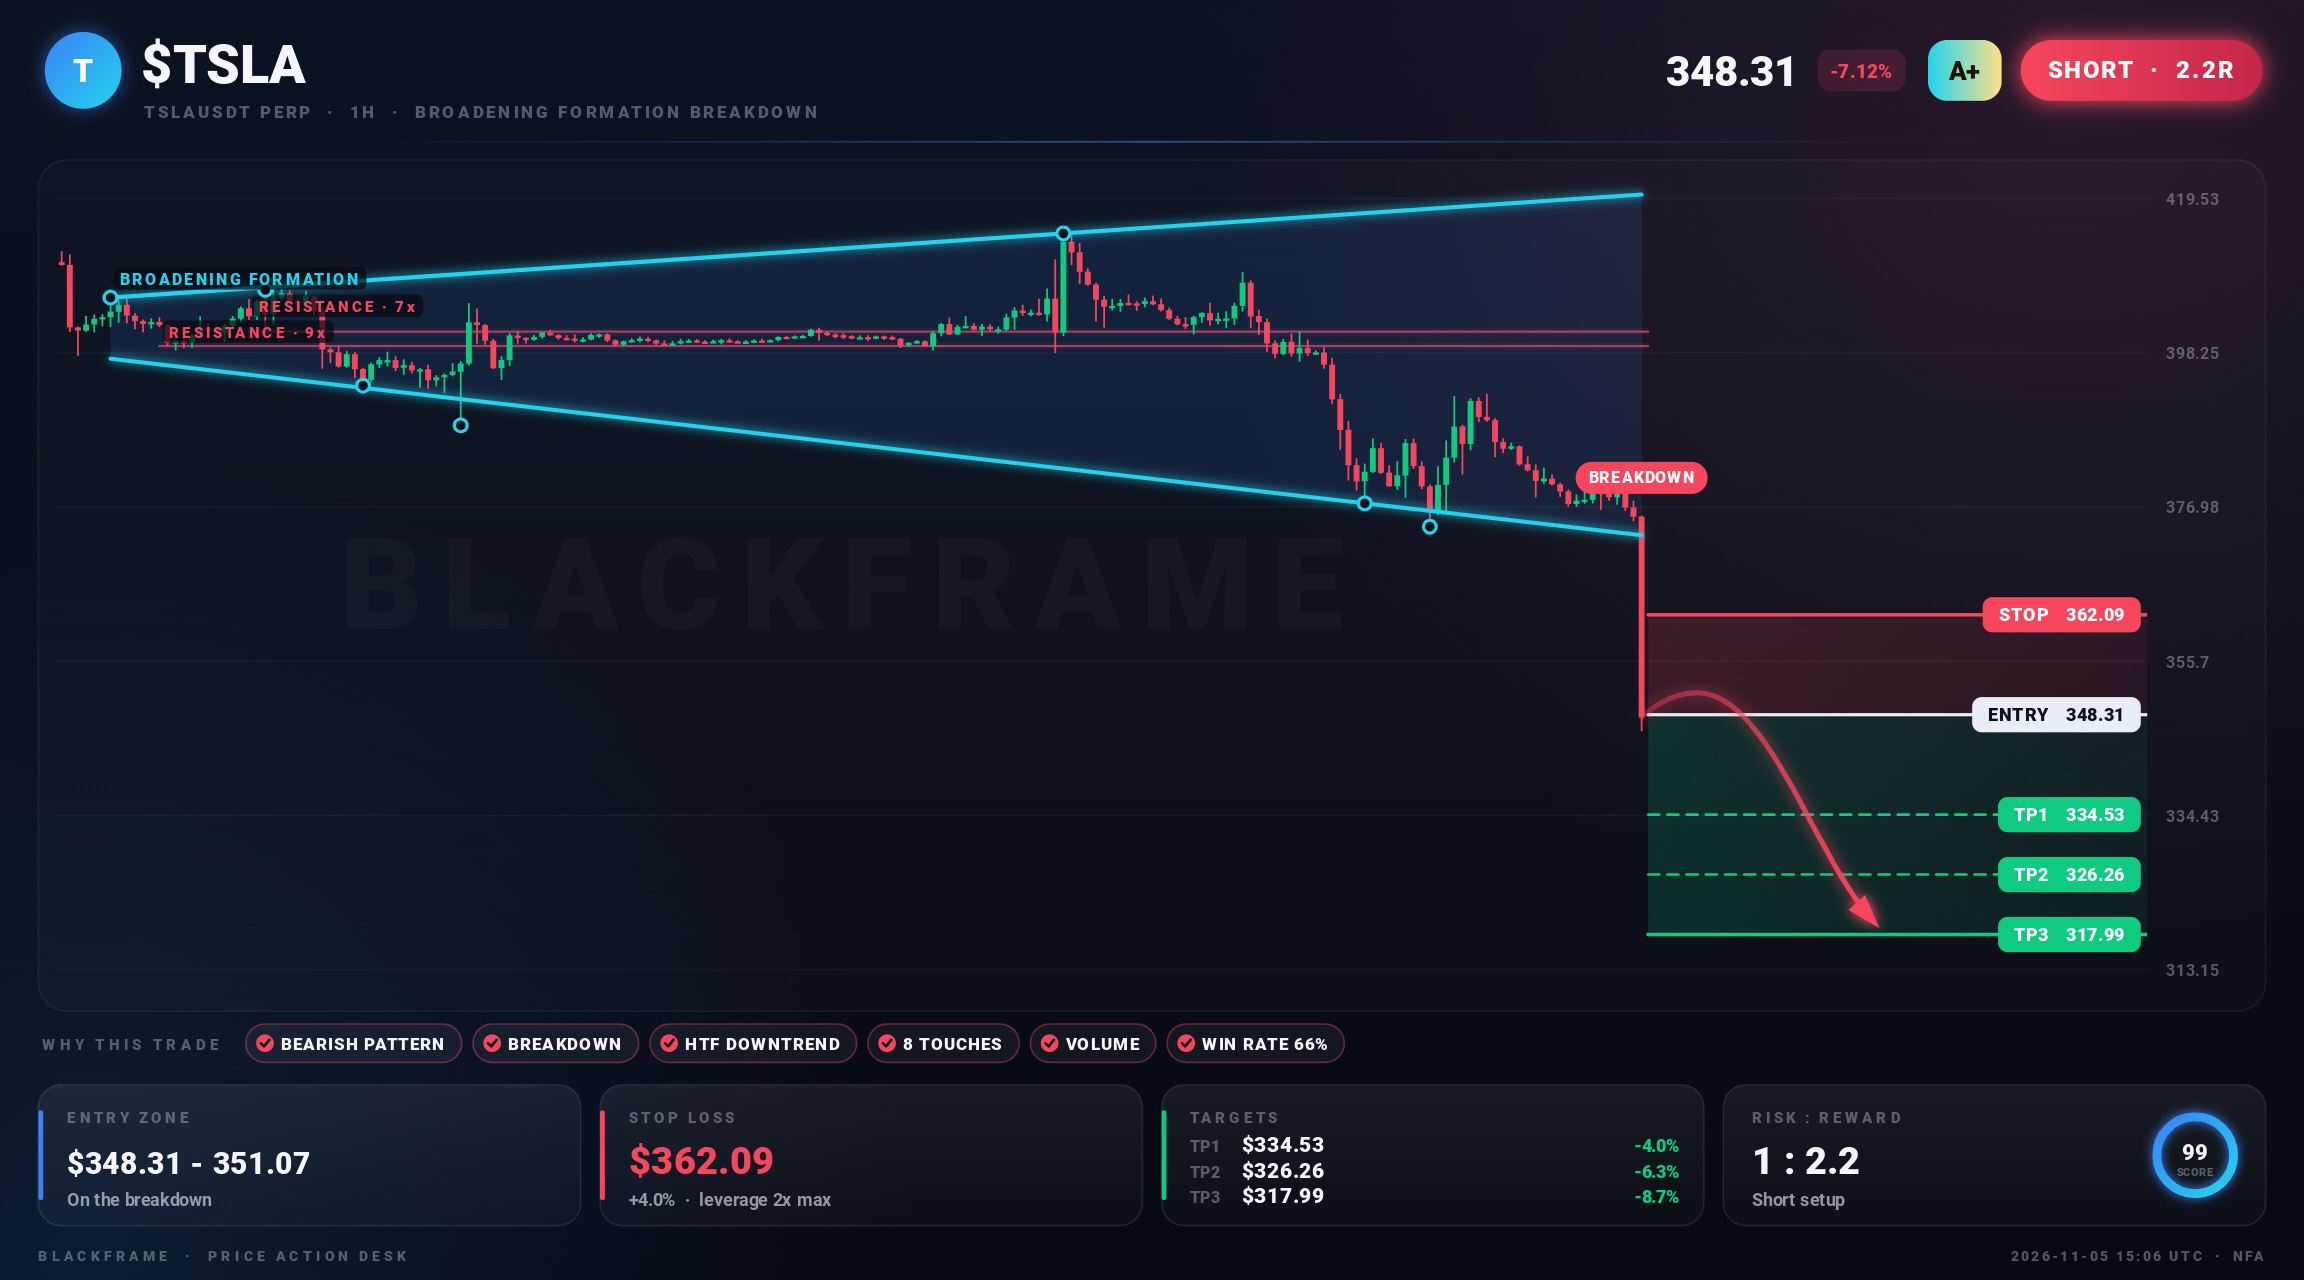
🩸 $TSLA just lost the floor
SHORT · 1H
Entry: $348.31 - $351.76
TP1: $334.53
TP2: $326.26
TP3: $317.99
SL: $362.09
A broadening formation has formed on the 1H, tested 8 times on its lines. Price broke down below the pattern and is holding. The higher timeframe trend agrees, and the target is the measured move of the pattern.
#TSLA #Binance #Crypto · NFA
🩸 $TSLA just lost the floor
SHORT · 1H
Entry: $348.31 - $351.76
TP1: $334.53
TP2: $326.26
TP3: $317.99
SL: $362.09
A broadening formation has formed on the 1H, tested 8 times on its lines. Price broke down below the pattern and is holding. The higher timeframe trend agrees, and the target is the measured move of the pattern.
#TSLA #Binance #Crypto · NFA
SHORT · 1H
Entry: $348.31 - $351.76
TP1: $334.53
TP2: $326.26
TP3: $317.99
SL: $362.09
A broadening formation has formed on the 1H, tested 8 times on its lines. Price broke down below the pattern and is holding. The higher timeframe trend agrees, and the target is the measured move of the pattern.
#TSLA #Binance #Crypto · NFA
1

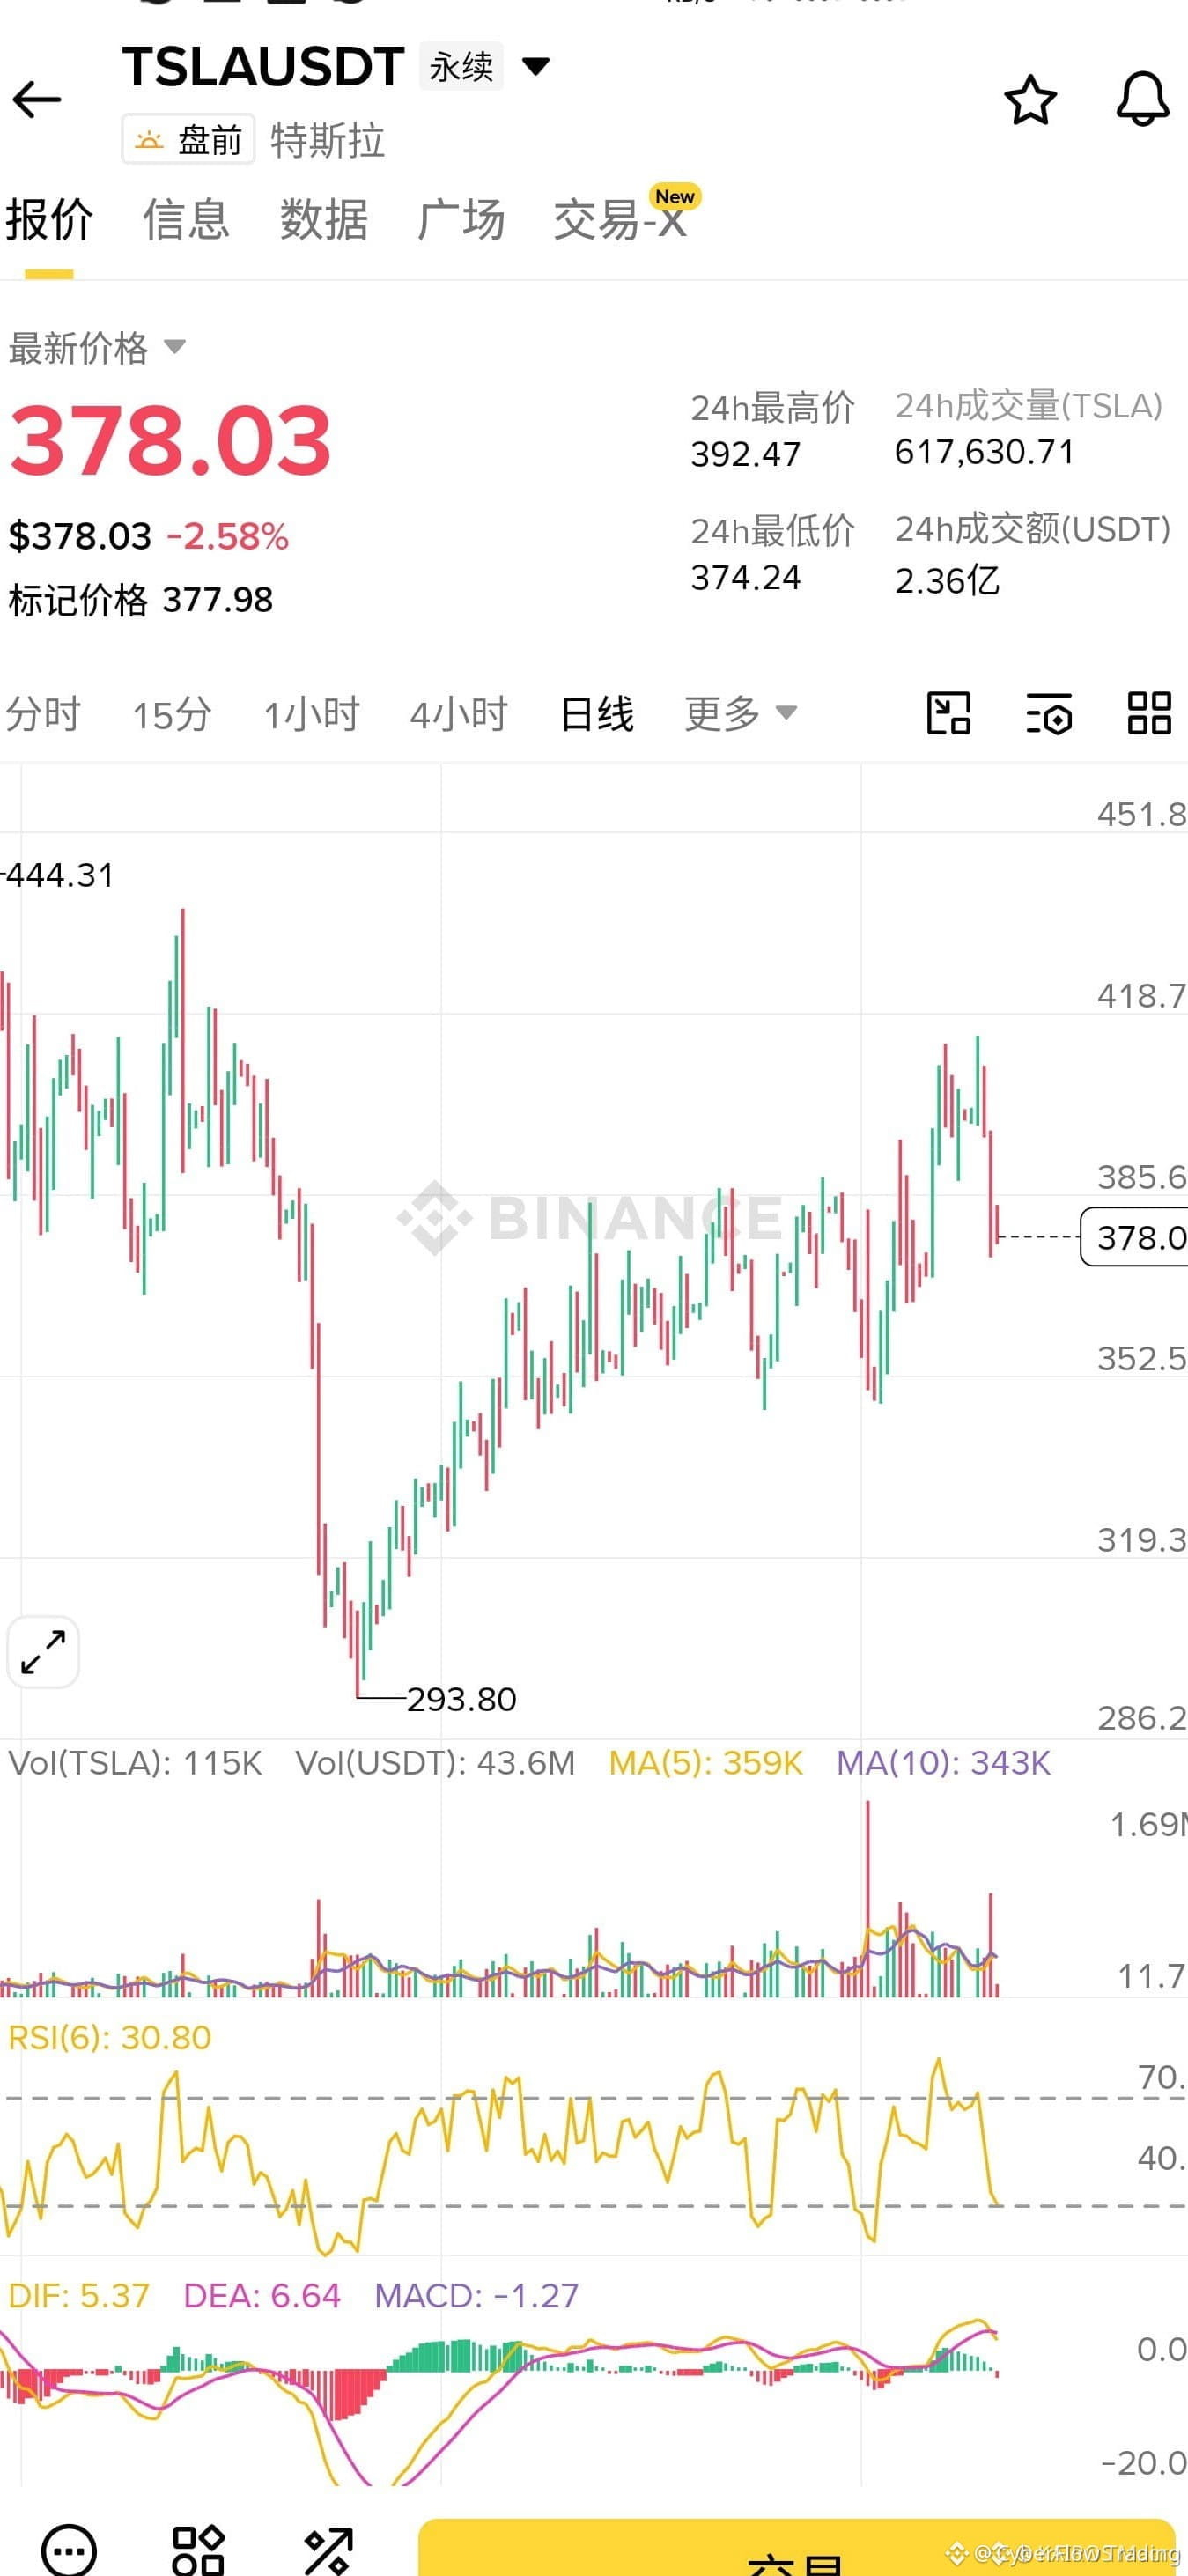
🚨 $TSLA PLUNGES INTO RED ZONE—SHORT NOW! 📉
Entry: 378.03 ⚡
Target: 357.03 🚀
Stop Loss: 385.03 ⚠️
The red candle slammed through 378, and every tentative uptick got crushed like a wave on a reef. 📉 The sell pressure is relentless, and the order flow shows a clean sweep of liquidity around the 378‑385 band.
Smart money is dragging the price lower, leaving a thin buying cushion. 📊 With volume spiking on the 15‑min chart, the odds tilt heavily toward a deeper dive to the 357 target. ⚡
💬 Are you stacking short bids now or waiting for the next reversal signal?
⚠️ Not financial advice. Always manage your risk. 🛡️
🏷️ #TSLA #ShortSetup #Bearish #Crypto
🔥 💎
🚨 $TSLA PLUNGES INTO RED ZONE—SHORT NOW! 📉
Entry: 378.03 ⚡
Target: 357.03 🚀
Stop Loss: 385.03 ⚠️
The red candle slammed through 378, and every tentative uptick got crushed like a wave on a reef. 📉 The sell pressure is relentless, and the order flow shows a clean sweep of liquidity around the 378‑385 band.
Smart money is dragging the price lower, leaving a thin buying cushion. 📊 With volume spiking on the 15‑min chart, the odds tilt heavily toward a deeper dive to the 357 target. ⚡
💬 Are you stacking short bids now or waiting for the next reversal signal?
⚠️ Not financial advice. Always manage your risk. 🛡️
🏷️ #TSLA #ShortSetup #Bearish #Crypto
🔥 💎
Entry: 378.03 ⚡
Target: 357.03 🚀
Stop Loss: 385.03 ⚠️
The red candle slammed through 378, and every tentative uptick got crushed like a wave on a reef. 📉 The sell pressure is relentless, and the order flow shows a clean sweep of liquidity around the 378‑385 band.
Smart money is dragging the price lower, leaving a thin buying cushion. 📊 With volume spiking on the 15‑min chart, the odds tilt heavily toward a deeper dive to the 357 target. ⚡
💬 Are you stacking short bids now or waiting for the next reversal signal?
⚠️ Not financial advice. Always manage your risk. 🛡️
🏷️ #TSLA #ShortSetup #Bearish #Crypto
🔥 💎
5

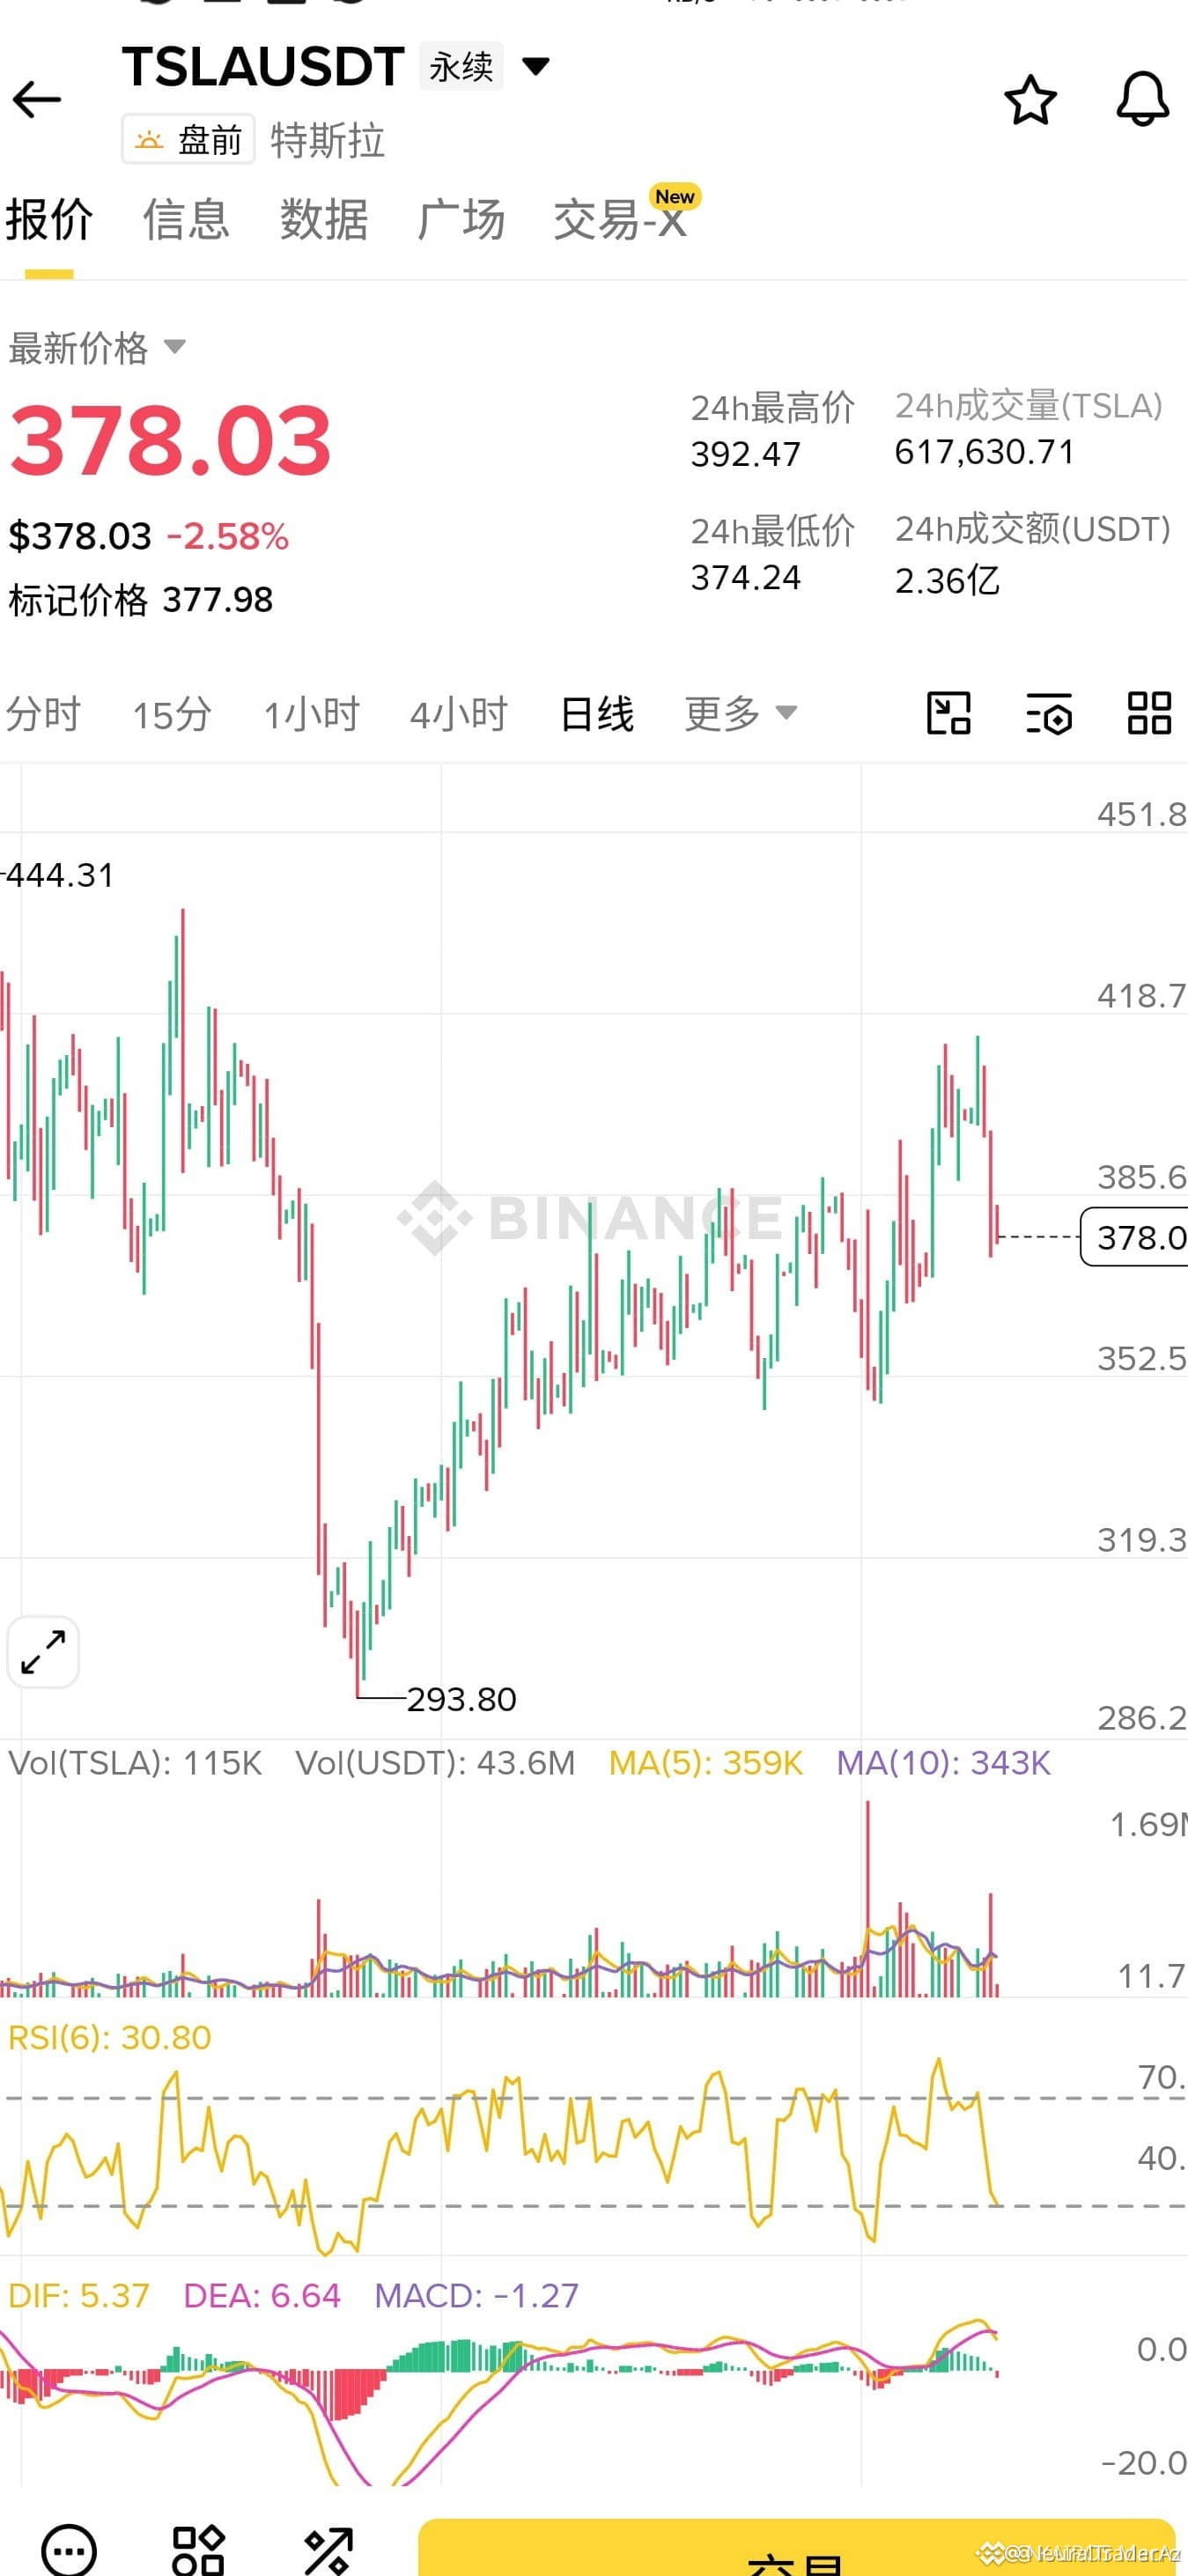
🚨 $TSLA SLIDES INTO RED ZONE – SHORT ALERT 📉
Entry: 378.03 ⚡
Target: 357.03 🚀
Stop Loss: 385.03 ⚠️
📊 The 378 level acted as a fresh liquidity sink, swallowing every bullish tick and confirming a dominant order block. 🦈 Smart money is now feeding the downside, and the weak rebound lacks the volume needed to sustain a reversal. ⚡ With each micro‑spike brutally quenched, the risk‑reward tilt favors a disciplined short play. 📌 Keep an eye on the 385 barrier – a breach would flip the bias instantly.
⚠️ Not financial advice. Always manage your risk. 🛡️
🏷️ #TSLA #ShortSetup #LiquiditySweep #TechAnalysis
🦈 🔥
🚨 $TSLA SLIDES INTO RED ZONE – SHORT ALERT 📉
Entry: 378.03 ⚡
Target: 357.03 🚀
Stop Loss: 385.03 ⚠️
📊 The 378 level acted as a fresh liquidity sink, swallowing every bullish tick and confirming a dominant order block. 🦈 Smart money is now feeding the downside, and the weak rebound lacks the volume needed to sustain a reversal. ⚡ With each micro‑spike brutally quenched, the risk‑reward tilt favors a disciplined short play. 📌 Keep an eye on the 385 barrier – a breach would flip the bias instantly.
⚠️ Not financial advice. Always manage your risk. 🛡️
🏷️ #TSLA #ShortSetup #LiquiditySweep #TechAnalysis
🦈 🔥
Entry: 378.03 ⚡
Target: 357.03 🚀
Stop Loss: 385.03 ⚠️
📊 The 378 level acted as a fresh liquidity sink, swallowing every bullish tick and confirming a dominant order block. 🦈 Smart money is now feeding the downside, and the weak rebound lacks the volume needed to sustain a reversal. ⚡ With each micro‑spike brutally quenched, the risk‑reward tilt favors a disciplined short play. 📌 Keep an eye on the 385 barrier – a breach would flip the bias instantly.
⚠️ Not financial advice. Always manage your risk. 🛡️
🏷️ #TSLA #ShortSetup #LiquiditySweep #TechAnalysis
🦈 🔥

·
--
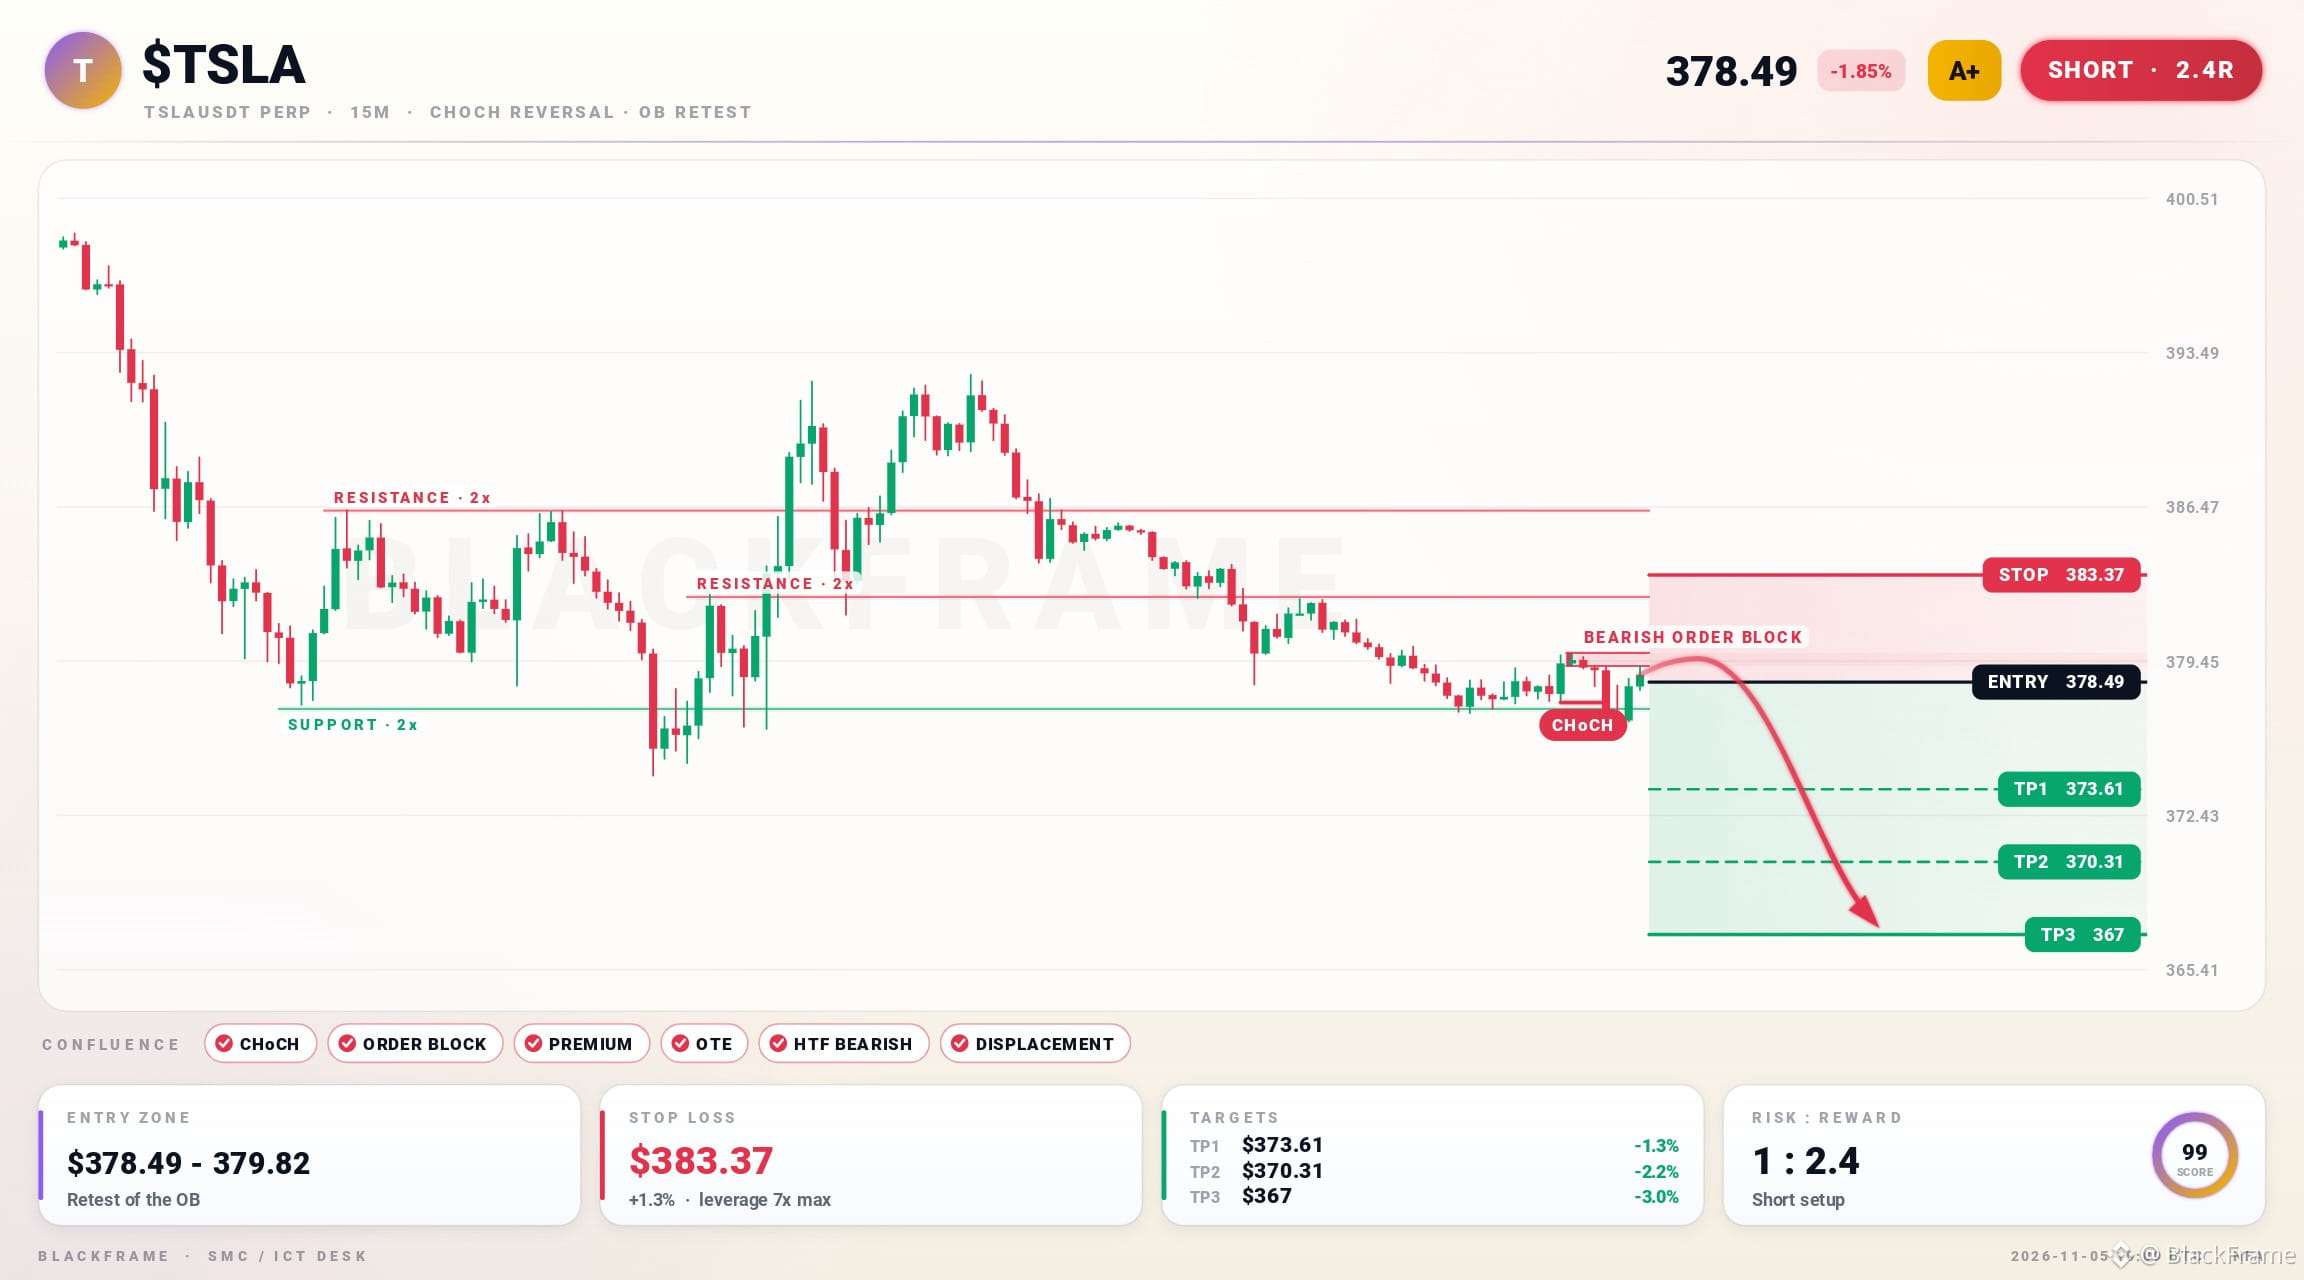
⚡️ $TSLA bearish flip in 15M
SHORT · 15M
Entry: $378.49 - $379.22
TP1: $373.61
TP2: $370.31
TP3: $367
SL: $383.37
CHoCH confirmed on the 15M and a fresh bearish order block retested. Entry at $378.49 inside the OTE pocket, selling from premium. Target is sell‑side liquidity at $367; stop at $383.37 invalidates the setup.
#TSLA #PriceAction · NFA
⚡️ $TSLA bearish flip in 15M
SHORT · 15M
Entry: $378.49 - $379.22
TP1: $373.61
TP2: $370.31
TP3: $367
SL: $383.37
CHoCH confirmed on the 15M and a fresh bearish order block retested. Entry at $378.49 inside the OTE pocket, selling from premium. Target is sell‑side liquidity at $367; stop at $383.37 invalidates the setup.
#TSLA #PriceAction · NFA
SHORT · 15M
Entry: $378.49 - $379.22
TP1: $373.61
TP2: $370.31
TP3: $367
SL: $383.37
CHoCH confirmed on the 15M and a fresh bearish order block retested. Entry at $378.49 inside the OTE pocket, selling from premium. Target is sell‑side liquidity at $367; stop at $383.37 invalidates the setup.
#TSLA #PriceAction · NFA
71
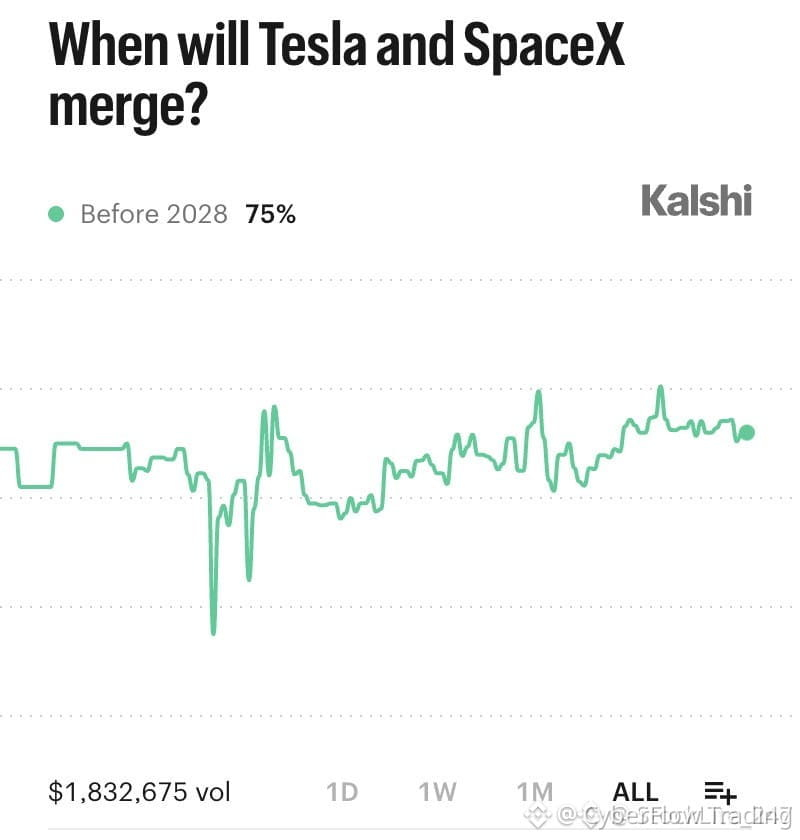
🚨 $TSLA & $SPCX SLIDE AFTER CONGRESS SWEEP WHILE MERGER ODDS HOLD 🟢
📊 The market’s reaction to the new Democratic majority feels like a swift liquidity sweep—price action bounces lower despite a stubborn 75% merger probability. ⚡ Smart money seems to be re‑pricing political risk faster than the headline news, carving out fresh buying zones beneath the sell‑off. 🌊 Meanwhile, the underlying merger thesis stays intact, hinting at a potential rebound once the political dust settles.
💬 How are you positioning $TSLA amid this political‑driven volatility? 👇
⚠️ Not financial advice. Always manage your risk. 🛡️
🏷️ #TSLA #SellOff #Merger #MarketMove #Crypto
🔥 💎
🚨 $TSLA & $SPCX SLIDE AFTER CONGRESS SWEEP WHILE MERGER ODDS HOLD 🟢
📊 The market’s reaction to the new Democratic majority feels like a swift liquidity sweep—price action bounces lower despite a stubborn 75% merger probability. ⚡ Smart money seems to be re‑pricing political risk faster than the headline news, carving out fresh buying zones beneath the sell‑off. 🌊 Meanwhile, the underlying merger thesis stays intact, hinting at a potential rebound once the political dust settles.
💬 How are you positioning $TSLA amid this political‑driven volatility? 👇
⚠️ Not financial advice. Always manage your risk. 🛡️
🏷️ #TSLA #SellOff #Merger #MarketMove #Crypto
🔥 💎
📊 The market’s reaction to the new Democratic majority feels like a swift liquidity sweep—price action bounces lower despite a stubborn 75% merger probability. ⚡ Smart money seems to be re‑pricing political risk faster than the headline news, carving out fresh buying zones beneath the sell‑off. 🌊 Meanwhile, the underlying merger thesis stays intact, hinting at a potential rebound once the political dust settles.
💬 How are you positioning $TSLA amid this political‑driven volatility? 👇
⚠️ Not financial advice. Always manage your risk. 🛡️
🏷️ #TSLA #SellOff #Merger #MarketMove #Crypto
🔥 💎

22

·
--
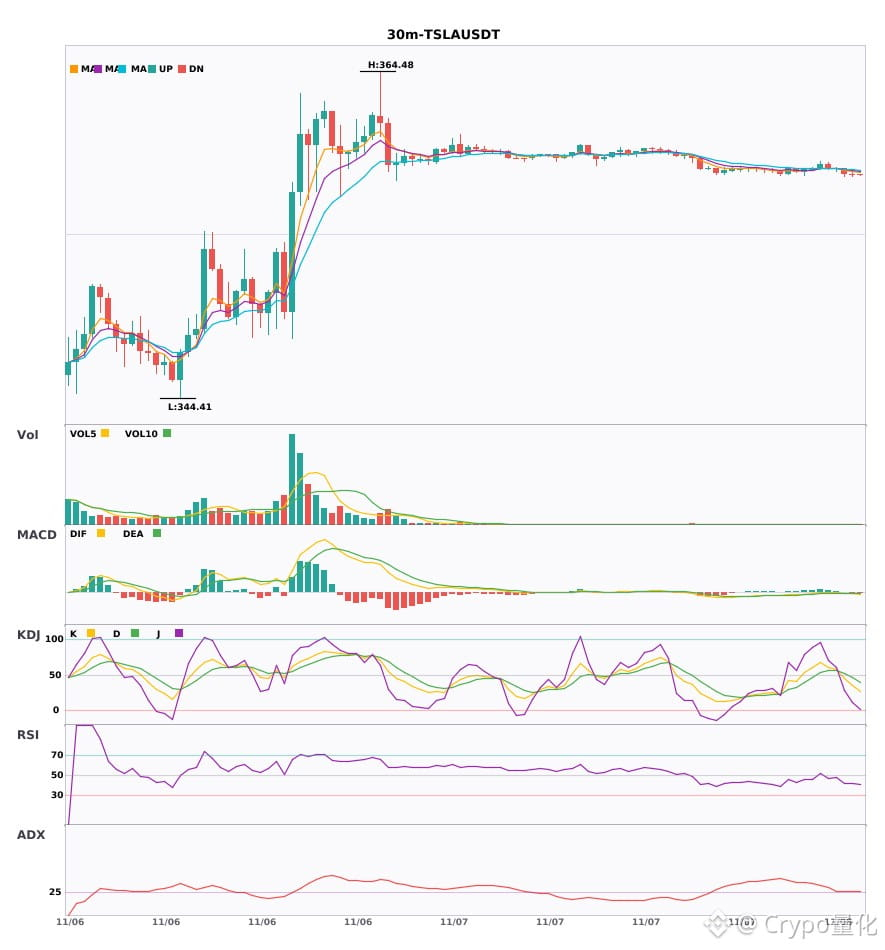
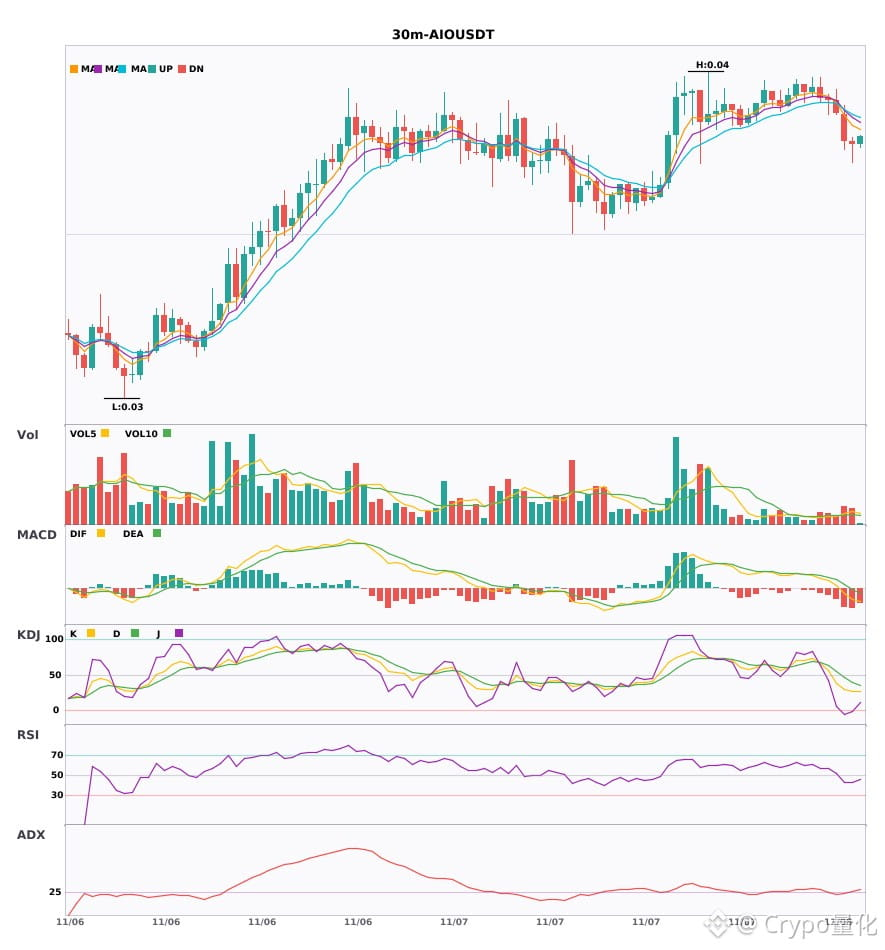
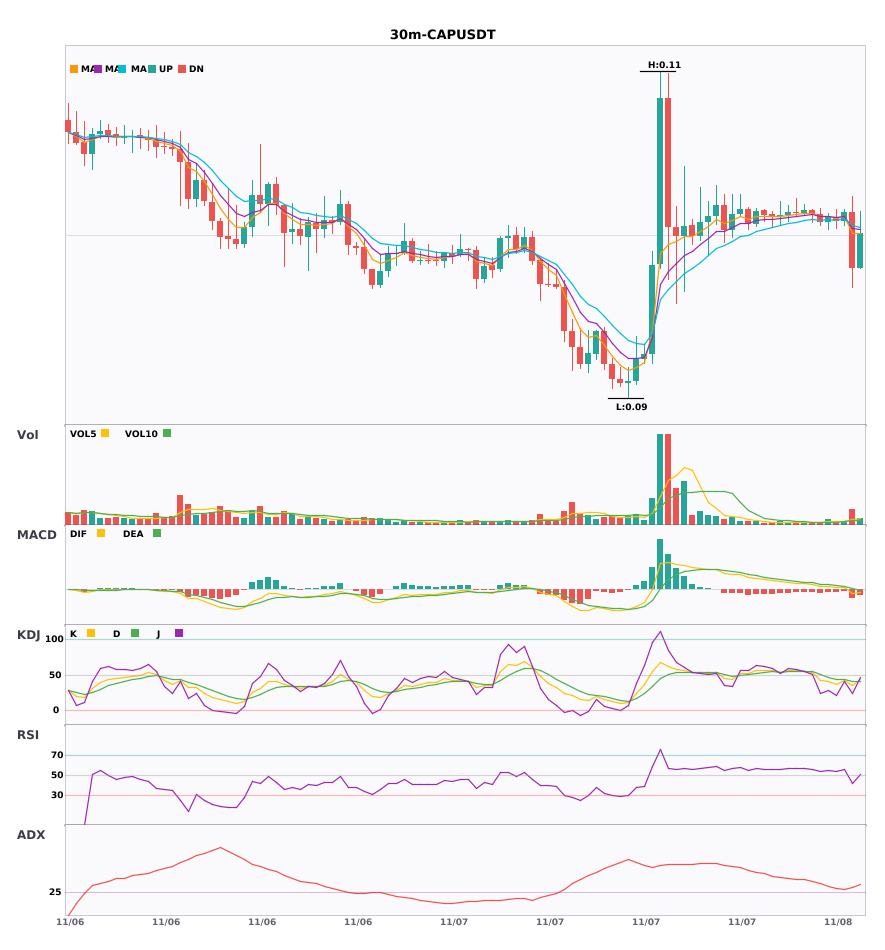
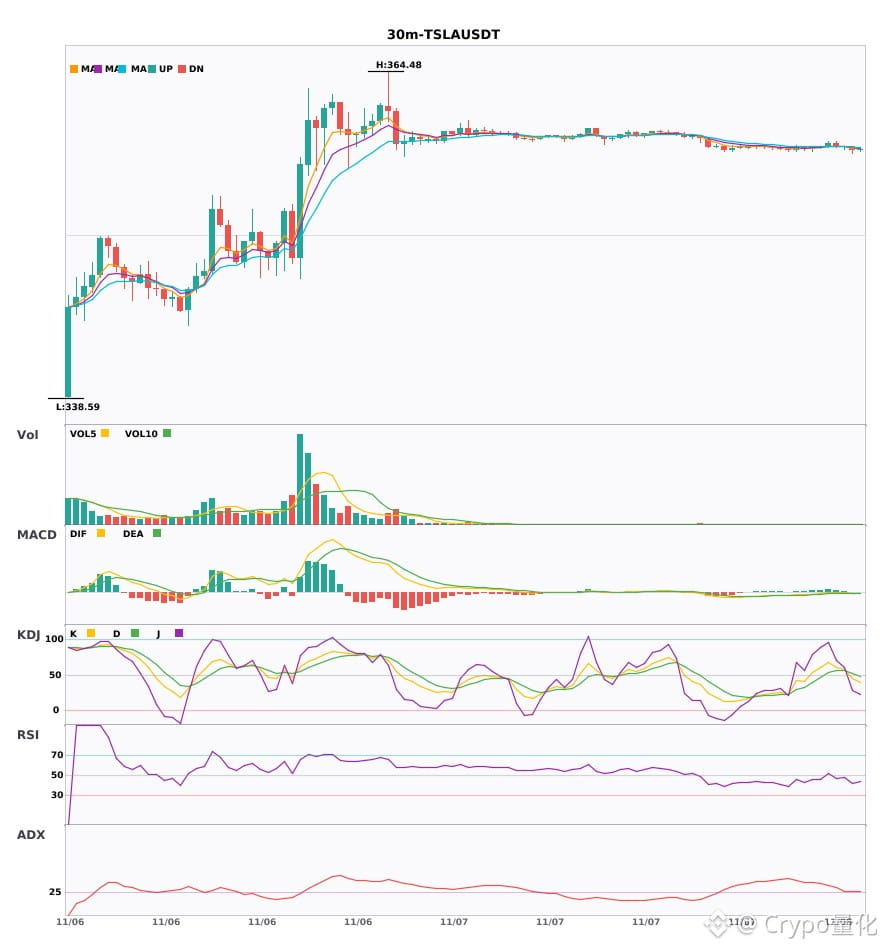
$TSLA / $AIO / $CAP 30-minute timeframe is leaning bearish, with short-term pressure 🔥
════════════════════
🟢 $TSLA 30-minute bearish signal
⚠️ Technical analysis: ADX(28): Trend is forming; opportunity to participate | MACD bearish crossover below zero, bearish momentum accelerating | EMA5 crosses below EMA8, short-term outlook turns bearish | KDJ bearish crossover, short-term outlook is bearish (K: 44.6, D: 52.6) | Volume increases (2.1x)
════════════════════
🟢 $AIO 30-minute bearish signal
⚠️ Technical analysis: ADX(25): Trend is forming; opportunity to participate | MACD DIF falls below zero, trend turns bearish | EMA5 < EMA8 < EMA13, bearish alignment | KDJ trading weakly, bears have the upper hand (K: 29.2, D: 46.8) | Volume increases (1.9x)
════════════════════
🟢 $CAP 30-minute bearish signal
⚠️ Technical analysis: ADX(28): Trend is forming; opportunity to participate | MACD DIF falls below zero, trend turns bearish | EMA5 crosses below EMA8, short-term outlook turns bearish | KDJ trading weakly, bears have the upper hand (K: 35.2, D: 40.5) | Volume surges (3.5x)
════════════════════
🔔 Follow for first-hand updates on unusual market movements 🔔
#技术分析 #TSLA #AIO #CAP
📌 When trading, check whether the candlestick pattern confirms the signal
$TSLA / $AIO / $CAP 30-minute timeframe is leaning bearish, with short-term pressure 🔥
════════════════════
🟢 $TSLA 30-minute bearish signal
⚠️ Technical analysis: ADX(28): Trend is forming; opportunity to participate | MACD bearish crossover below zero, bearish momentum accelerating | EMA5 crosses below EMA8, short-term outlook turns bearish | KDJ bearish crossover, short-term outlook is bearish (K: 44.6, D: 52.6) | Volume increases (2.1x)
════════════════════
🟢 $AIO 30-minute bearish signal
⚠️ Technical analysis: ADX(25): Trend is forming; opportunity to participate | MACD DIF falls below zero, trend turns bearish | EMA5 < EMA8 < EMA13, bearish alignment | KDJ trading weakly, bears have the upper hand (K: 29.2, D: 46.8) | Volume increases (1.9x)
════════════════════
🟢 $CAP 30-minute bearish signal
⚠️ Technical analysis: ADX(28): Trend is forming; opportunity to participate | MACD DIF falls below zero, trend turns bearish | EMA5 crosses below EMA8, short-term outlook turns bearish | KDJ trading weakly, bears have the upper hand (K: 35.2, D: 40.5) | Volume surges (3.5x)
════════════════════
🔔 Follow for first-hand updates on unusual market movements 🔔
#技术分析 #TSLA #AIO #CAP
📌 When trading, check whether the candlestick pattern confirms the signal
════════════════════
🟢 $TSLA 30-minute bearish signal
⚠️ Technical analysis: ADX(28): Trend is forming; opportunity to participate | MACD bearish crossover below zero, bearish momentum accelerating | EMA5 crosses below EMA8, short-term outlook turns bearish | KDJ bearish crossover, short-term outlook is bearish (K: 44.6, D: 52.6) | Volume increases (2.1x)
════════════════════
🟢 $AIO 30-minute bearish signal
⚠️ Technical analysis: ADX(25): Trend is forming; opportunity to participate | MACD DIF falls below zero, trend turns bearish | EMA5 < EMA8 < EMA13, bearish alignment | KDJ trading weakly, bears have the upper hand (K: 29.2, D: 46.8) | Volume increases (1.9x)
════════════════════
🟢 $CAP 30-minute bearish signal
⚠️ Technical analysis: ADX(28): Trend is forming; opportunity to participate | MACD DIF falls below zero, trend turns bearish | EMA5 crosses below EMA8, short-term outlook turns bearish | KDJ trading weakly, bears have the upper hand (K: 35.2, D: 40.5) | Volume surges (3.5x)
════════════════════
🔔 Follow for first-hand updates on unusual market movements 🔔
#技术分析 #TSLA #AIO #CAP
📌 When trading, check whether the candlestick pattern confirms the signal
12
·
--
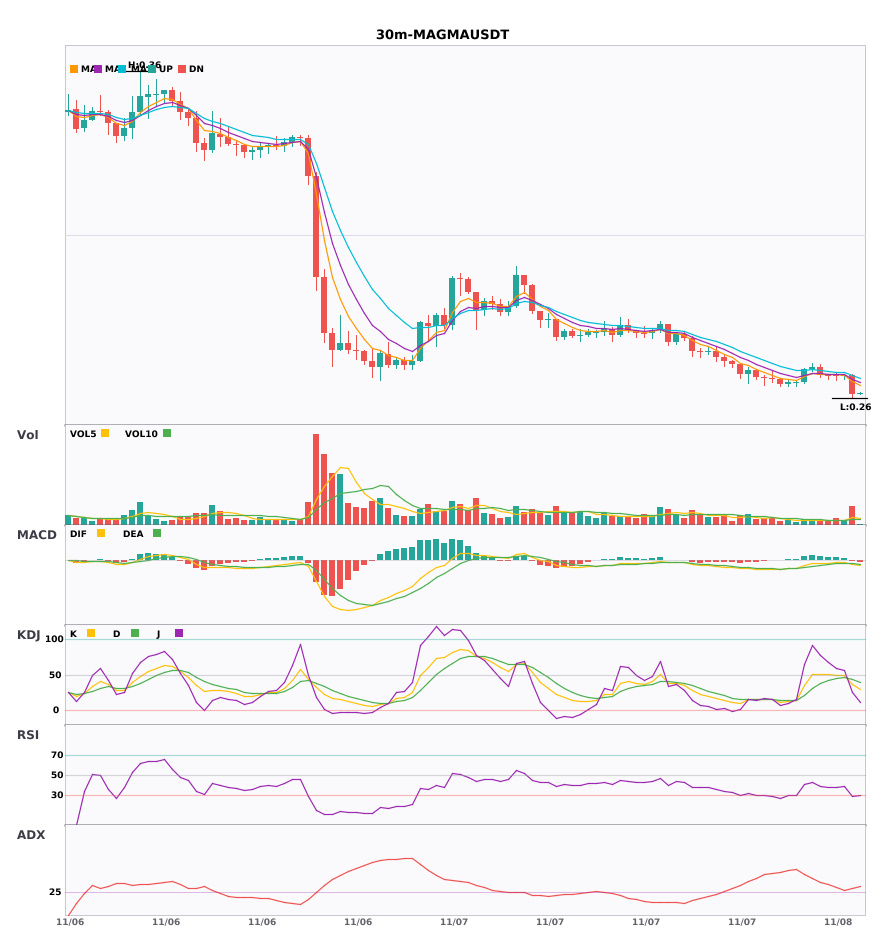
$Q / $TSLA / $MAGMA 30-minute timeframe is bearish, with short-term pressure 🔥
════════════════════
🟢 $Q 30-minute bearish signal
⚠️Technical analysis: ADX(35) indicates a clear trending market | MACD bearish crossover below zero, bearish momentum accelerating | EMA5 below EMA8 below EMA13, bearish alignment | KDJ bearish crossover, short-term outlook bearish (K is 21.3, D is 26.0) | Volume increased (1.6x)
════════════════════
🟢 $TSLA 30-minute bearish signal
⚠️Technical analysis: ADX(28) indicates a trend is forming and may be traded | MACD bearish crossover below zero, bearish momentum accelerating | EMA5 crossed below EMA8, short-term outlook turning bearish | KDJ bearish crossover, short-term outlook bearish (K is 44.6, D is 52.6) | Volume increased (2.1x)
════════════════════
🟢 $MAGMA 30-minute bearish signal
⚠️Technical analysis: ADX(29) indicates a trend is forming and may be traded | MACD bearish crossover below zero, bearish momentum accelerating | EMA5 below EMA8 below EMA13, bearish alignment | KDJ bearish crossover, short-term outlook bearish (K is 37.3, D is 43.3) | Volume surged (3.1x)
════════════════════
🔔 Follow for firsthand market alerts 🔔
#技术分析 #Q #TSLA #MAGMA
📌 When trading, pay attention to whether the candlestick patterns confirm the signal
$Q / $TSLA / $MAGMA 30-minute timeframe is bearish, with short-term pressure 🔥
════════════════════
🟢 $Q 30-minute bearish signal
⚠️Technical analysis: ADX(35) indicates a clear trending market | MACD bearish crossover below zero, bearish momentum accelerating | EMA5 below EMA8 below EMA13, bearish alignment | KDJ bearish crossover, short-term outlook bearish (K is 21.3, D is 26.0) | Volume increased (1.6x)
════════════════════
🟢 $TSLA 30-minute bearish signal
⚠️Technical analysis: ADX(28) indicates a trend is forming and may be traded | MACD bearish crossover below zero, bearish momentum accelerating | EMA5 crossed below EMA8, short-term outlook turning bearish | KDJ bearish crossover, short-term outlook bearish (K is 44.6, D is 52.6) | Volume increased (2.1x)
════════════════════
🟢 $MAGMA 30-minute bearish signal
⚠️Technical analysis: ADX(29) indicates a trend is forming and may be traded | MACD bearish crossover below zero, bearish momentum accelerating | EMA5 below EMA8 below EMA13, bearish alignment | KDJ bearish crossover, short-term outlook bearish (K is 37.3, D is 43.3) | Volume surged (3.1x)
════════════════════
🔔 Follow for firsthand market alerts 🔔
#技术分析 #Q #TSLA #MAGMA
📌 When trading, pay attention to whether the candlestick patterns confirm the signal
════════════════════
🟢 $Q 30-minute bearish signal
⚠️Technical analysis: ADX(35) indicates a clear trending market | MACD bearish crossover below zero, bearish momentum accelerating | EMA5 below EMA8 below EMA13, bearish alignment | KDJ bearish crossover, short-term outlook bearish (K is 21.3, D is 26.0) | Volume increased (1.6x)
════════════════════
🟢 $TSLA 30-minute bearish signal
⚠️Technical analysis: ADX(28) indicates a trend is forming and may be traded | MACD bearish crossover below zero, bearish momentum accelerating | EMA5 crossed below EMA8, short-term outlook turning bearish | KDJ bearish crossover, short-term outlook bearish (K is 44.6, D is 52.6) | Volume increased (2.1x)
════════════════════
🟢 $MAGMA 30-minute bearish signal
⚠️Technical analysis: ADX(29) indicates a trend is forming and may be traded | MACD bearish crossover below zero, bearish momentum accelerating | EMA5 below EMA8 below EMA13, bearish alignment | KDJ bearish crossover, short-term outlook bearish (K is 37.3, D is 43.3) | Volume surged (3.1x)
════════════════════
🔔 Follow for firsthand market alerts 🔔
#技术分析 #Q #TSLA #MAGMA
📌 When trading, pay attention to whether the candlestick patterns confirm the signal
12

·
--
Looking at the TSLA order book—don’t let this one candle spook you. What matters is whether selling pressure stays heavy in the next round.
Binance TradFi Perpetuals (traditional finance assets; high gap risk outside trading hours) | TSLA is down 8.23% over the past 24 hours, and weakness persists. For a recovery, first watch whether selling pressure eases. Current price is around 346.62, with 24h trading volume of about 299 million; the 30m volume ratio is just 0.4x, indicating weak participation. Positioning: 71% of accounts are long; the taker buy/sell ratio is 0.59 (taker selling dominates).
Reference indicators: The 30m RSI at 70.41 is overheated. The 24h trend remains weak, while the 30m rebound is already overheated, so don’t mistake a single bounce for a trend recovery. The 30m ATR trend band reference level is 339.810746; the current price is above it, suggesting the structure favors trend continuation.
The order book needs to give us two answers: Can the taker buy/sell ratio get back above 1, and can the 30m RSI at 70.4 first fall below 70? Only if both hold does it look like a recovery; if only one does, it’s still weak, range-bound trading.
#TSLA #Abnormal-Move Alert
Looking at the TSLA order book—don’t let this one candle spook you. What matters is whether selling pressure stays heavy in the next round.
Binance TradFi Perpetuals (traditional finance assets; high gap risk outside trading hours) | TSLA is down 8.23% over the past 24 hours, and weakness persists. For a recovery, first watch whether selling pressure eases. Current price is around 346.62, with 24h trading volume of about 299 million; the 30m volume ratio is just 0.4x, indicating weak participation. Positioning: 71% of accounts are long; the taker buy/sell ratio is 0.59 (taker selling dominates).
Reference indicators: The 30m RSI at 70.41 is overheated. The 24h trend remains weak, while the 30m rebound is already overheated, so don’t mistake a single bounce for a trend recovery. The 30m ATR trend band reference level is 339.810746; the current price is above it, suggesting the structure favors trend continuation.
The order book needs to give us two answers: Can the taker buy/sell ratio get back above 1, and can the 30m RSI at 70.4 first fall below 70? Only if both hold does it look like a recovery; if only one does, it’s still weak, range-bound trading.
#TSLA #Abnormal-Move Alert
Binance TradFi Perpetuals (traditional finance assets; high gap risk outside trading hours) | TSLA is down 8.23% over the past 24 hours, and weakness persists. For a recovery, first watch whether selling pressure eases. Current price is around 346.62, with 24h trading volume of about 299 million; the 30m volume ratio is just 0.4x, indicating weak participation. Positioning: 71% of accounts are long; the taker buy/sell ratio is 0.59 (taker selling dominates).
Reference indicators: The 30m RSI at 70.41 is overheated. The 24h trend remains weak, while the 30m rebound is already overheated, so don’t mistake a single bounce for a trend recovery. The 30m ATR trend band reference level is 339.810746; the current price is above it, suggesting the structure favors trend continuation.
The order book needs to give us two answers: Can the taker buy/sell ratio get back above 1, and can the 30m RSI at 70.4 first fall below 70? Only if both hold does it look like a recovery; if only one does, it’s still weak, range-bound trading.
#TSLA #Abnormal-Move Alert

·
--
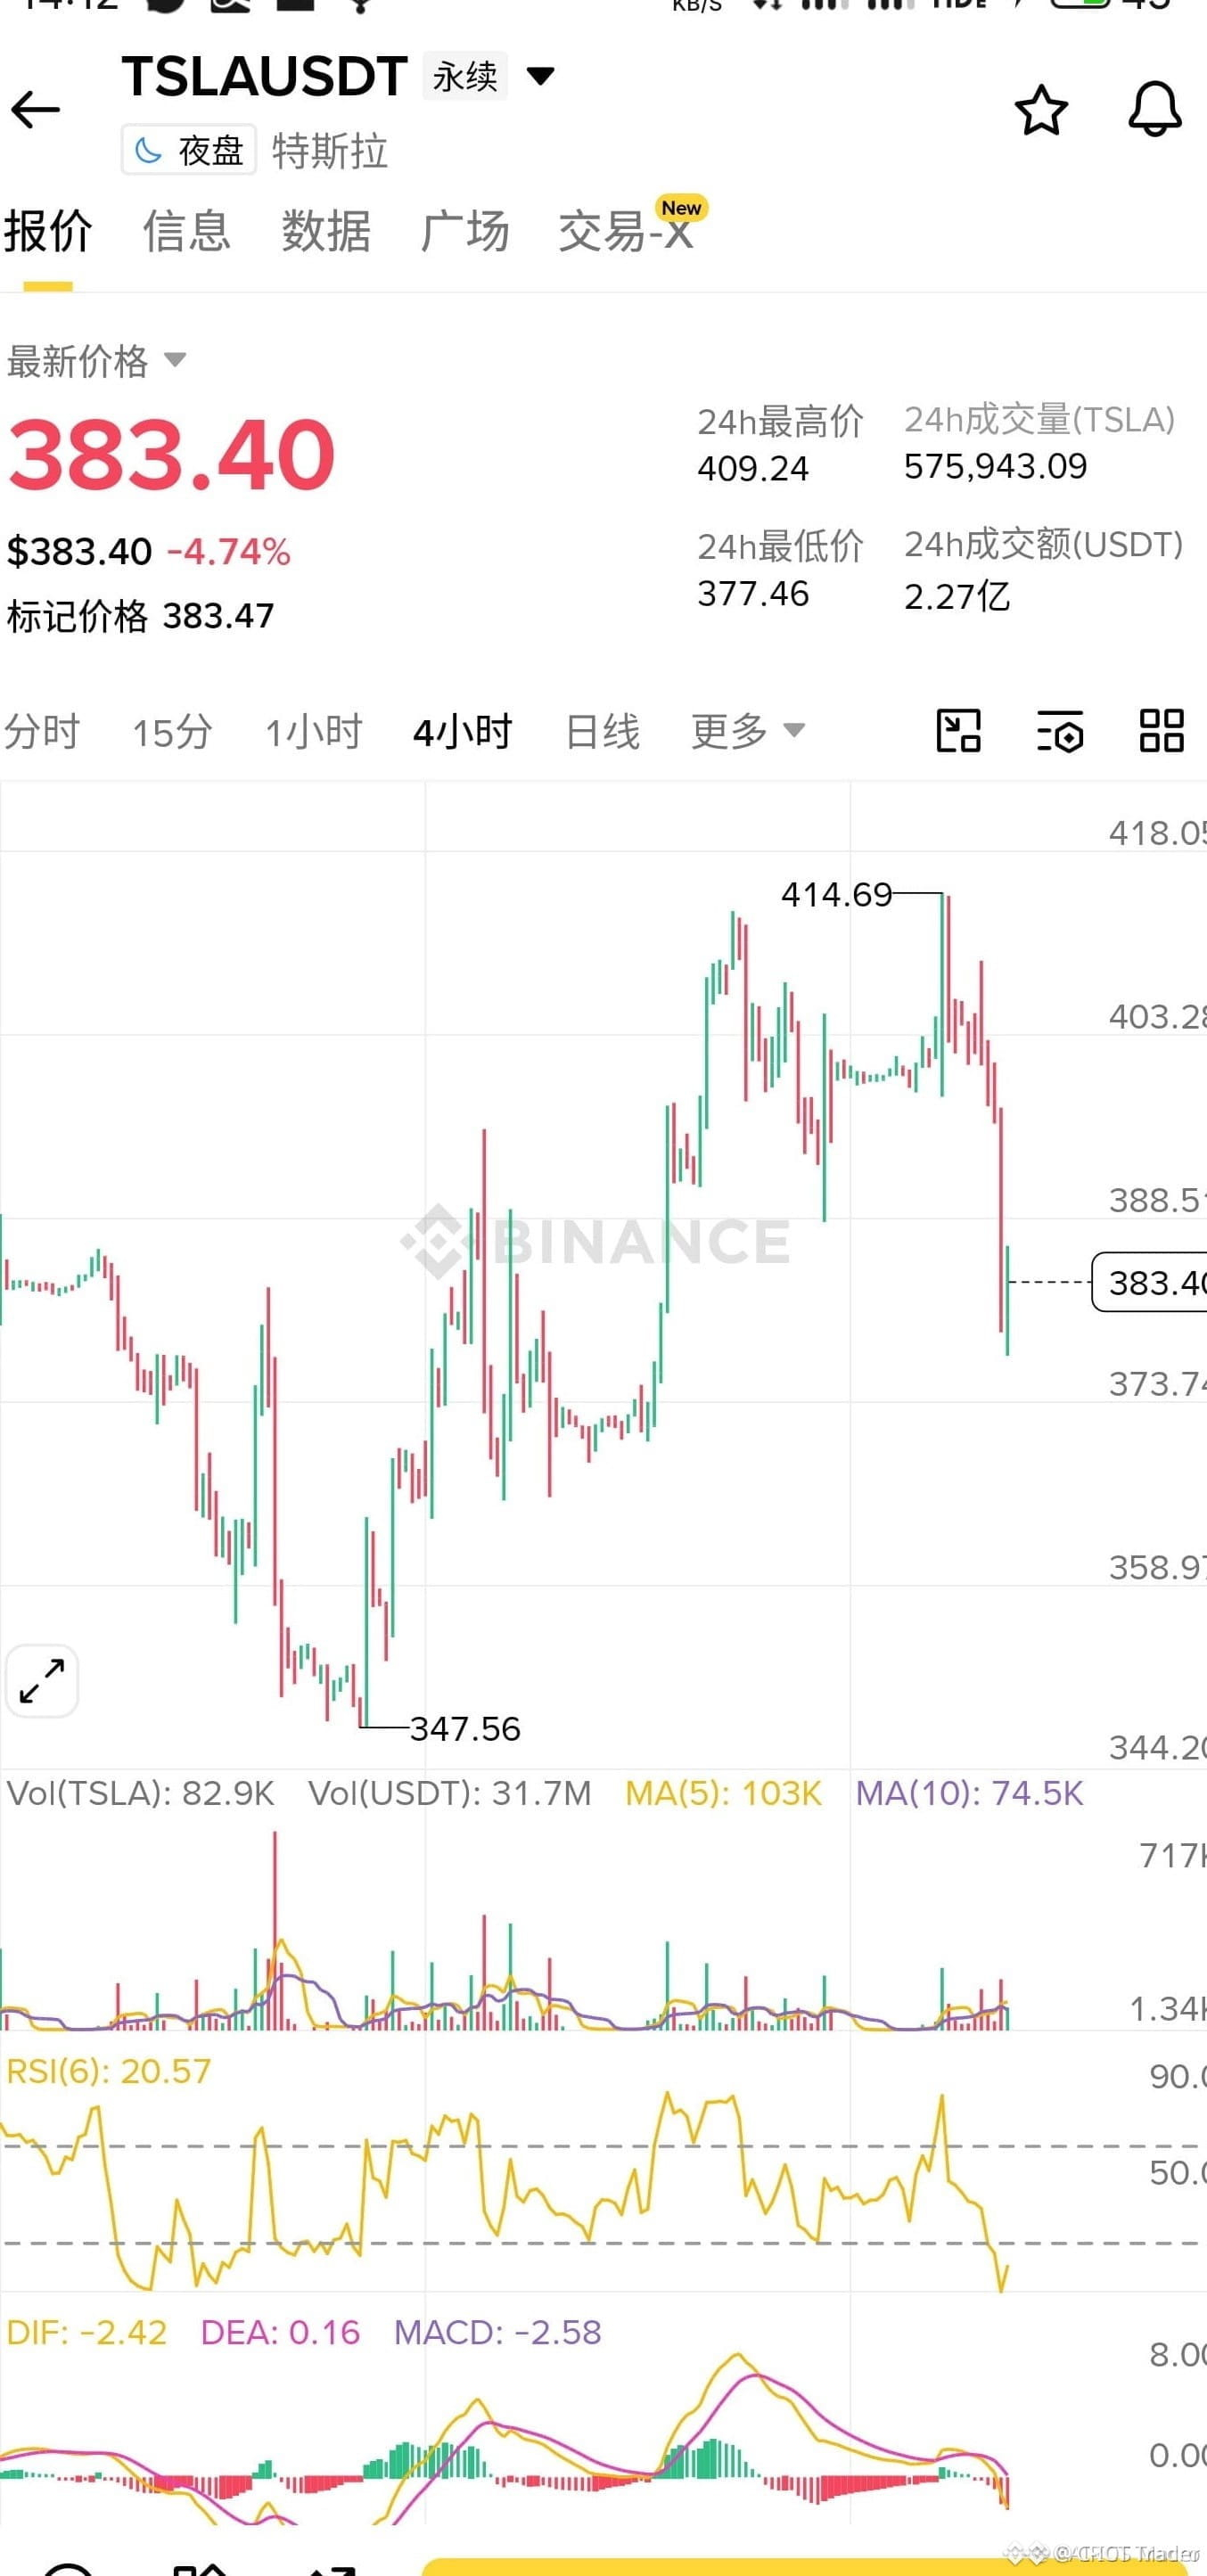
🚨 $TSLA SURFACES FROM DEEP OVERSOLD WITH A SWING REBOUND! 💥
Entry: 383.40 ⚡
Target: 395.00 🚀
Stop Loss: 377.00 ⚠️
📊 RSI on the 4‑hour chart plunged below 20, flagging a classic institutional capitulation zone. The long block at 383.40 has already absorbed three waves of selling, indicating that the panic‑driven liquidity pool is drying up. 🌊 A tight order block and a sharp foot‑pull on the downside suggest smart money is re‑positioning for a technical bounce. ⚡ The risk‑reward profile sits comfortably above 1:1, aligning with disciplined capital management.
💬 Are you ready to ride the recovery or waiting for the next liquidity trap? 👇
⚠️ Not financial advice. Always manage your risk. 🛡️
🏷️ #TSLA #LongSetup #SmartMoney #TechRecovery #Crypto
🚀 🔥
🚨 $TSLA SURFACES FROM DEEP OVERSOLD WITH A SWING REBOUND! 💥
Entry: 383.40 ⚡
Target: 395.00 🚀
Stop Loss: 377.00 ⚠️
📊 RSI on the 4‑hour chart plunged below 20, flagging a classic institutional capitulation zone. The long block at 383.40 has already absorbed three waves of selling, indicating that the panic‑driven liquidity pool is drying up. 🌊 A tight order block and a sharp foot‑pull on the downside suggest smart money is re‑positioning for a technical bounce. ⚡ The risk‑reward profile sits comfortably above 1:1, aligning with disciplined capital management.
💬 Are you ready to ride the recovery or waiting for the next liquidity trap? 👇
⚠️ Not financial advice. Always manage your risk. 🛡️
🏷️ #TSLA #LongSetup #SmartMoney #TechRecovery #Crypto
🚀 🔥
Entry: 383.40 ⚡
Target: 395.00 🚀
Stop Loss: 377.00 ⚠️
📊 RSI on the 4‑hour chart plunged below 20, flagging a classic institutional capitulation zone. The long block at 383.40 has already absorbed three waves of selling, indicating that the panic‑driven liquidity pool is drying up. 🌊 A tight order block and a sharp foot‑pull on the downside suggest smart money is re‑positioning for a technical bounce. ⚡ The risk‑reward profile sits comfortably above 1:1, aligning with disciplined capital management.
💬 Are you ready to ride the recovery or waiting for the next liquidity trap? 👇
⚠️ Not financial advice. Always manage your risk. 🛡️
🏷️ #TSLA #LongSetup #SmartMoney #TechRecovery #Crypto
🚀 🔥
6

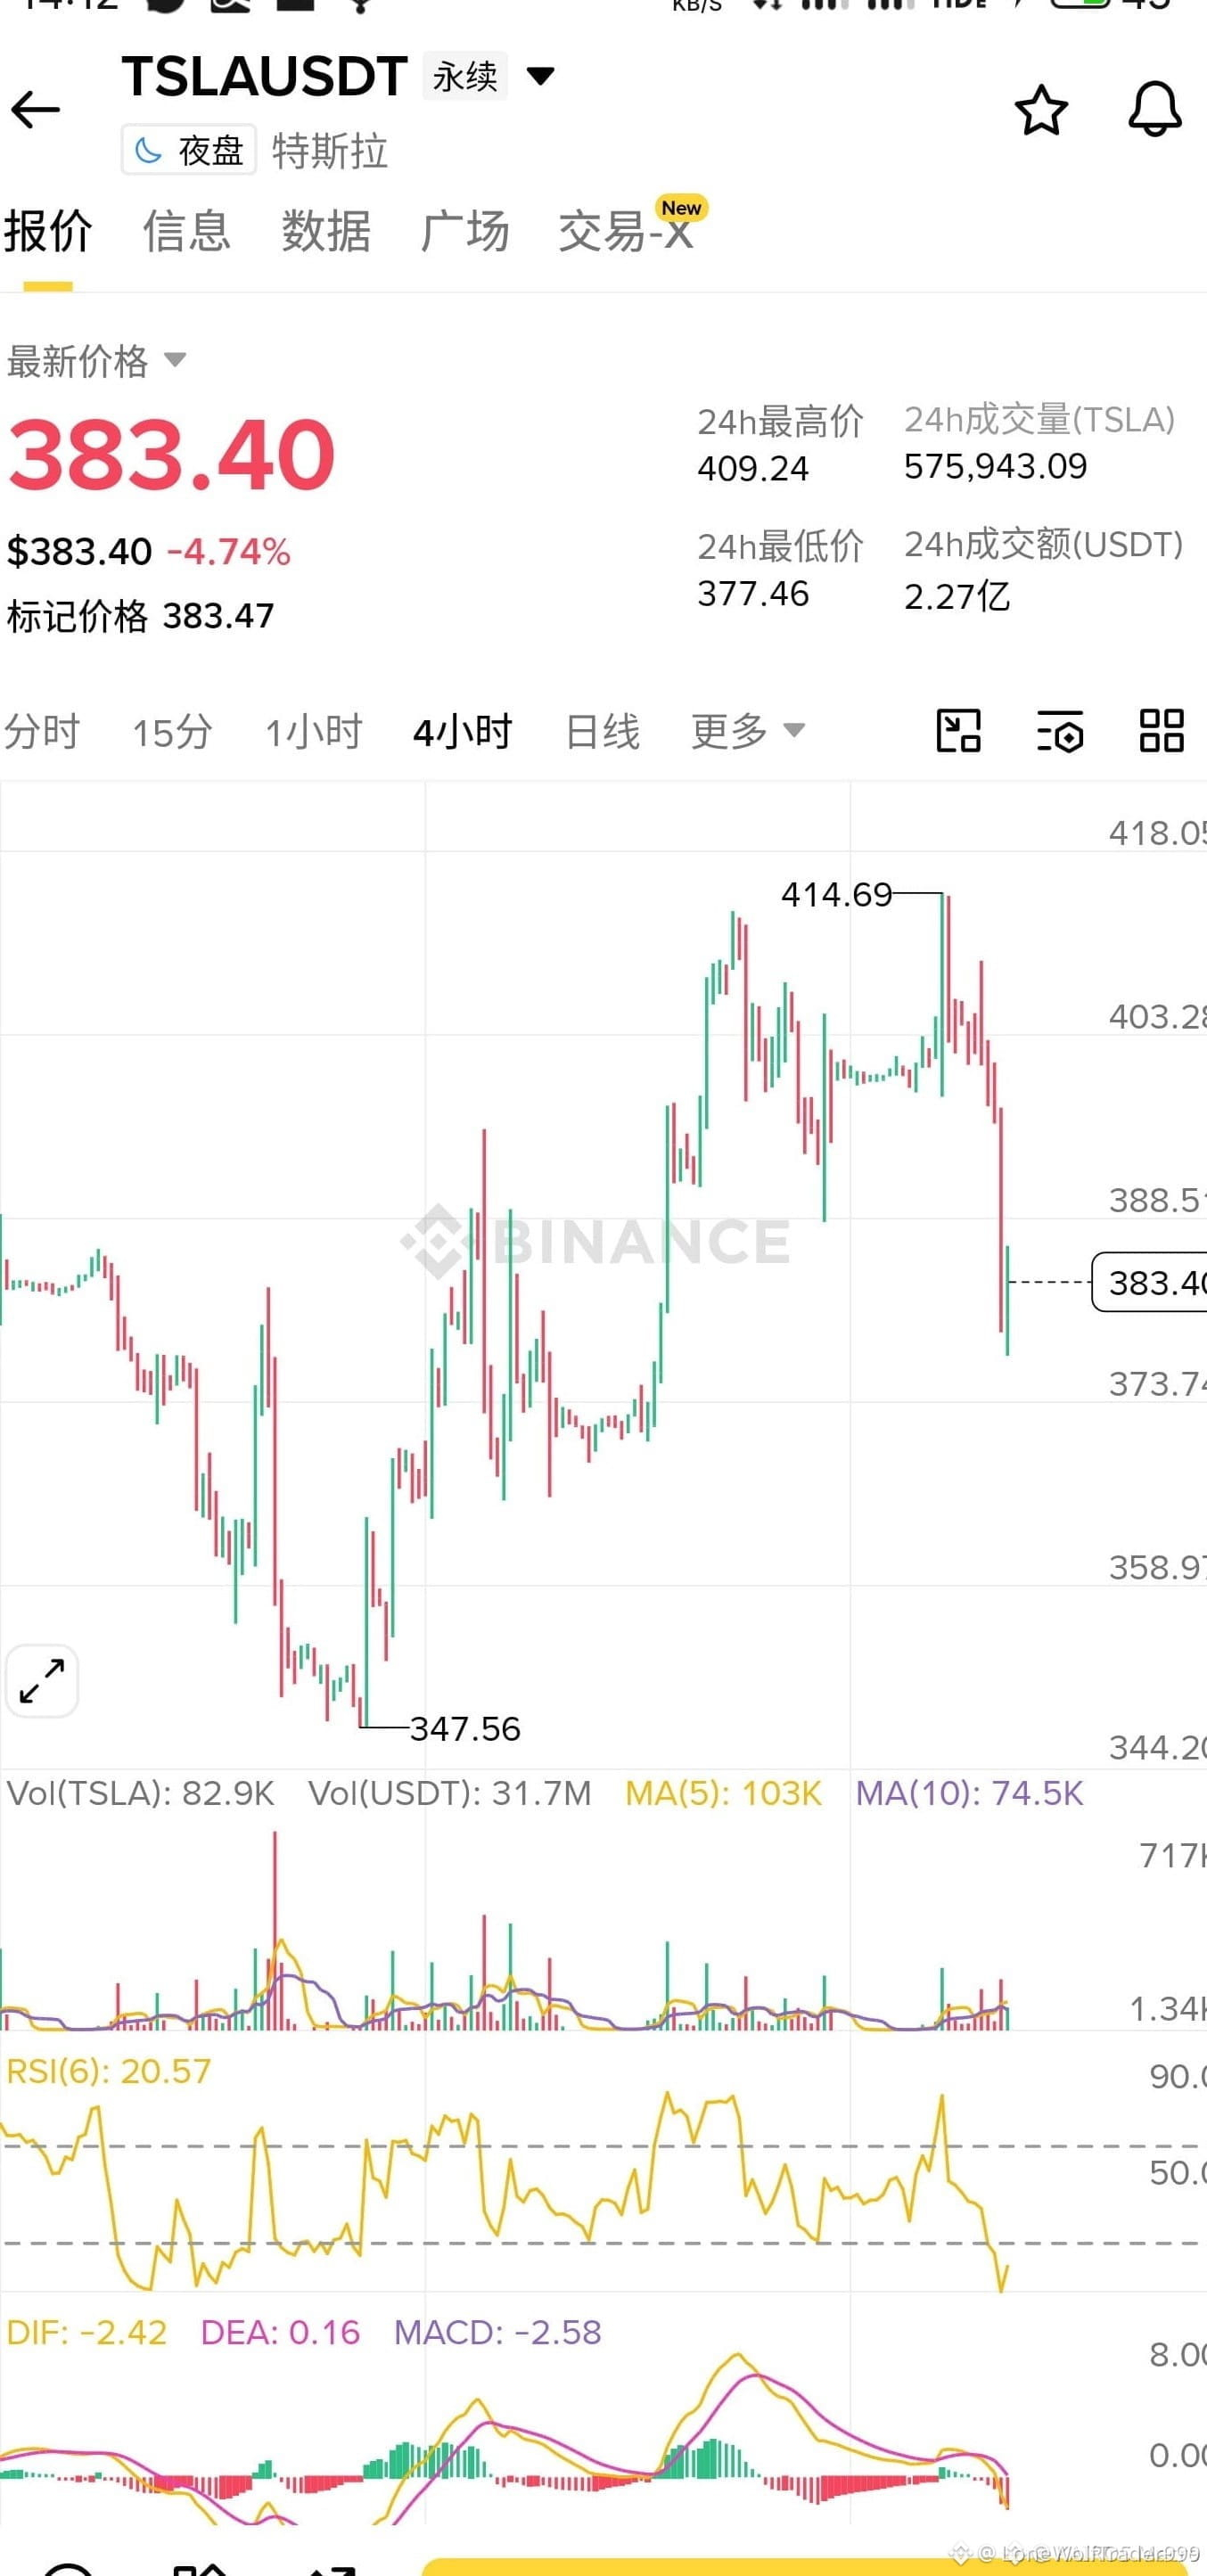
🚀 $TSLA REBOUND FROM 377 SLIDE TO 395 TARGET! ⚡
Entry: 383.40 ⚡
Target: 395.00 🚀
Stop Loss: 377.00 ⚠️
📊 RSI on the 4‑hour chart plunged into the 20‑zone, signaling a panic‑sell dump that’s now exhausted. 🦈 Smart money is likely gathering liquidity at the 383 level, and the sharp candle burn gave buyers a clean entry window. ⚡ With the sell pressure fading, a technical bounce is primed to flip the narrative from fear to upside momentum. 💡
💬 How are you positioning for the next swing—stacking in now or waiting for a tighter pullback? 👇
⚠️ Not financial advice. Always manage your risk. 🛡️
🏷️ #TSLA #LongSetup #TechStocks #Momentum #Crypto
🚀 ⚡
🚀 $TSLA REBOUND FROM 377 SLIDE TO 395 TARGET! ⚡
Entry: 383.40 ⚡
Target: 395.00 🚀
Stop Loss: 377.00 ⚠️
📊 RSI on the 4‑hour chart plunged into the 20‑zone, signaling a panic‑sell dump that’s now exhausted. 🦈 Smart money is likely gathering liquidity at the 383 level, and the sharp candle burn gave buyers a clean entry window. ⚡ With the sell pressure fading, a technical bounce is primed to flip the narrative from fear to upside momentum. 💡
💬 How are you positioning for the next swing—stacking in now or waiting for a tighter pullback? 👇
⚠️ Not financial advice. Always manage your risk. 🛡️
🏷️ #TSLA #LongSetup #TechStocks #Momentum #Crypto
🚀 ⚡
Entry: 383.40 ⚡
Target: 395.00 🚀
Stop Loss: 377.00 ⚠️
📊 RSI on the 4‑hour chart plunged into the 20‑zone, signaling a panic‑sell dump that’s now exhausted. 🦈 Smart money is likely gathering liquidity at the 383 level, and the sharp candle burn gave buyers a clean entry window. ⚡ With the sell pressure fading, a technical bounce is primed to flip the narrative from fear to upside momentum. 💡
💬 How are you positioning for the next swing—stacking in now or waiting for a tighter pullback? 👇
⚠️ Not financial advice. Always manage your risk. 🛡️
🏷️ #TSLA #LongSetup #TechStocks #Momentum #Crypto
🚀 ⚡
4

·
--
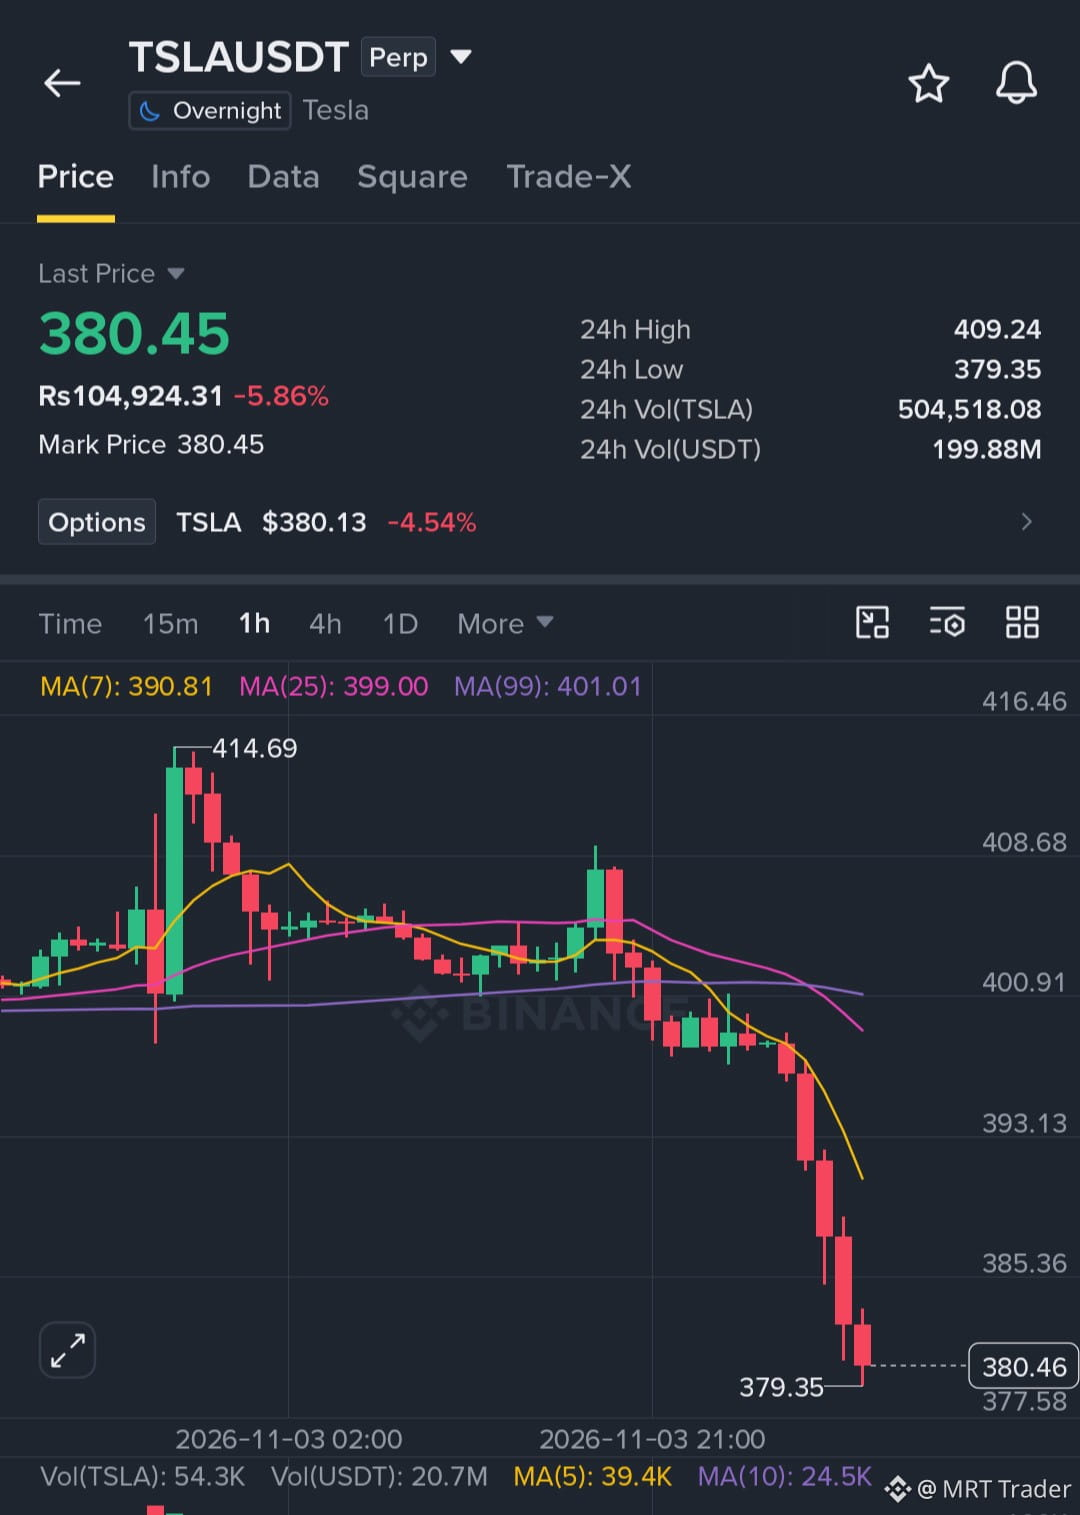
$TSLA is in a sharp downtrend and has broken below all its moving averages, with structure favoring another leg lower.
Key Level:
🔴 Bearish below: 378.90
Trade Setup (Short):
🔴 Entry Zone: 380.50 – 386.00
🎯 Targets: 375.40 / 368.20 / 359.50
⛔ Stop Loss: 392.60
Price is showing weakness. Enter on bounces and manage risk appropriately.
Click here to short now 👉 $TSLA
{future}(TSLAUSDT)
#TSLA #USOctoberNFP-AreRateCutsStillPossible
$TSLA is in a sharp downtrend and has broken below all its moving averages, with structure favoring another leg lower.
Key Level:
🔴 Bearish below: 378.90
Trade Setup (Short):
🔴 Entry Zone: 380.50 – 386.00
🎯 Targets: 375.40 / 368.20 / 359.50
⛔ Stop Loss: 392.60
Price is showing weakness. Enter on bounces and manage risk appropriately.
Click here to short now 👉 $TSLA
#TSLA #USOctoberNFP-AreRateCutsStillPossible
Key Level:
🔴 Bearish below: 378.90
Trade Setup (Short):
🔴 Entry Zone: 380.50 – 386.00
🎯 Targets: 375.40 / 368.20 / 359.50
⛔ Stop Loss: 392.60
Price is showing weakness. Enter on bounces and manage risk appropriately.
Click here to short now 👉 $TSLA
#TSLA #USOctoberNFP-AreRateCutsStillPossible
2
19

·
--
🚨 **TSLAUSDT – Short** – The market is tightening, and the price is screaming a break down.
**Entry zone:** ~404 **SL zone:** ~412 **TP1:** ~397 **TP2:** ~389 **TP3:** ~381
The trend and short‑term pattern have aligned – the move is coming.
Take the shot now, or watch it slip away.
Stay sharp, trade hard.
#TSLA #Crypto #SHORT #LovelyVincent
🚨 **TSLAUSDT – Short** – The market is tightening, and the price is screaming a break down.
**Entry zone:** ~404 **SL zone:** ~412 **TP1:** ~397 **TP2:** ~389 **TP3:** ~381
The trend and short‑term pattern have aligned – the move is coming.
Take the shot now, or watch it slip away.
Stay sharp, trade hard.
#TSLA #Crypto #SHORT #LovelyVincent
**Entry zone:** ~404 **SL zone:** ~412 **TP1:** ~397 **TP2:** ~389 **TP3:** ~381
The trend and short‑term pattern have aligned – the move is coming.
Take the shot now, or watch it slip away.
Stay sharp, trade hard.
#TSLA #Crypto #SHORT #LovelyVincent
213
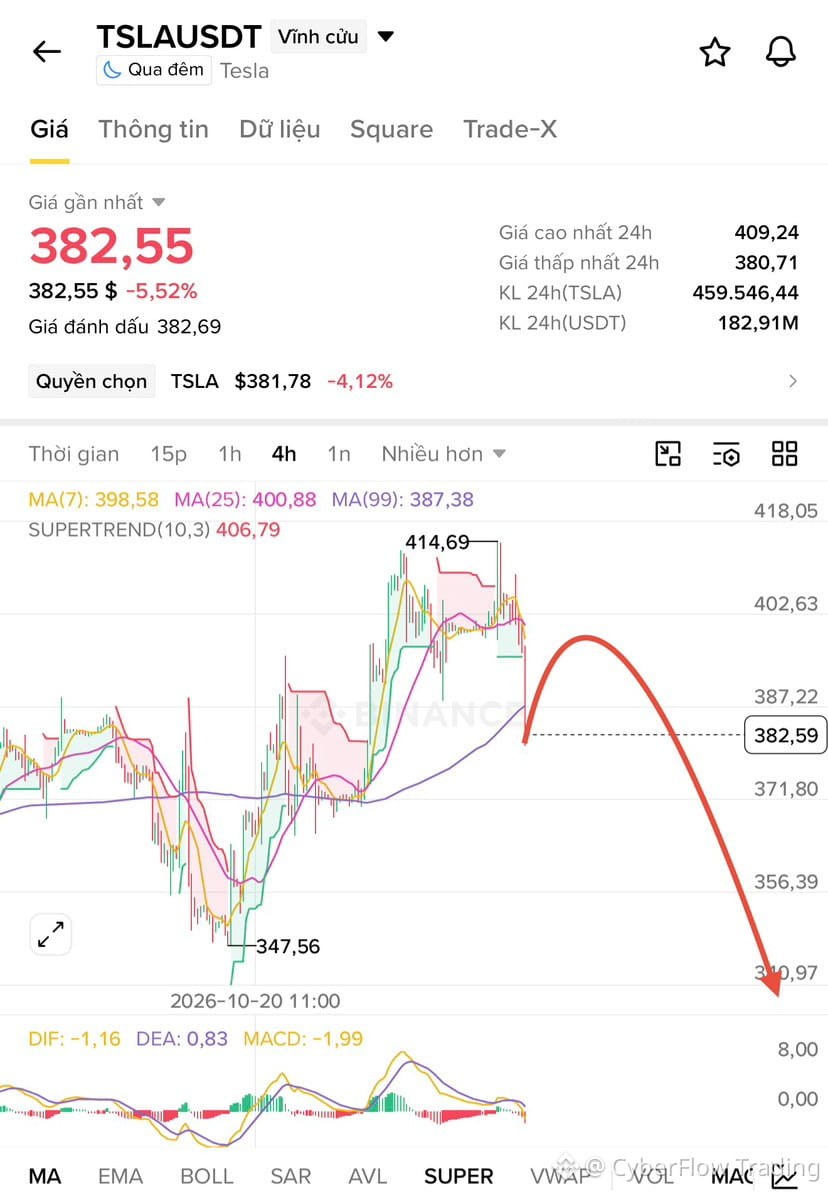
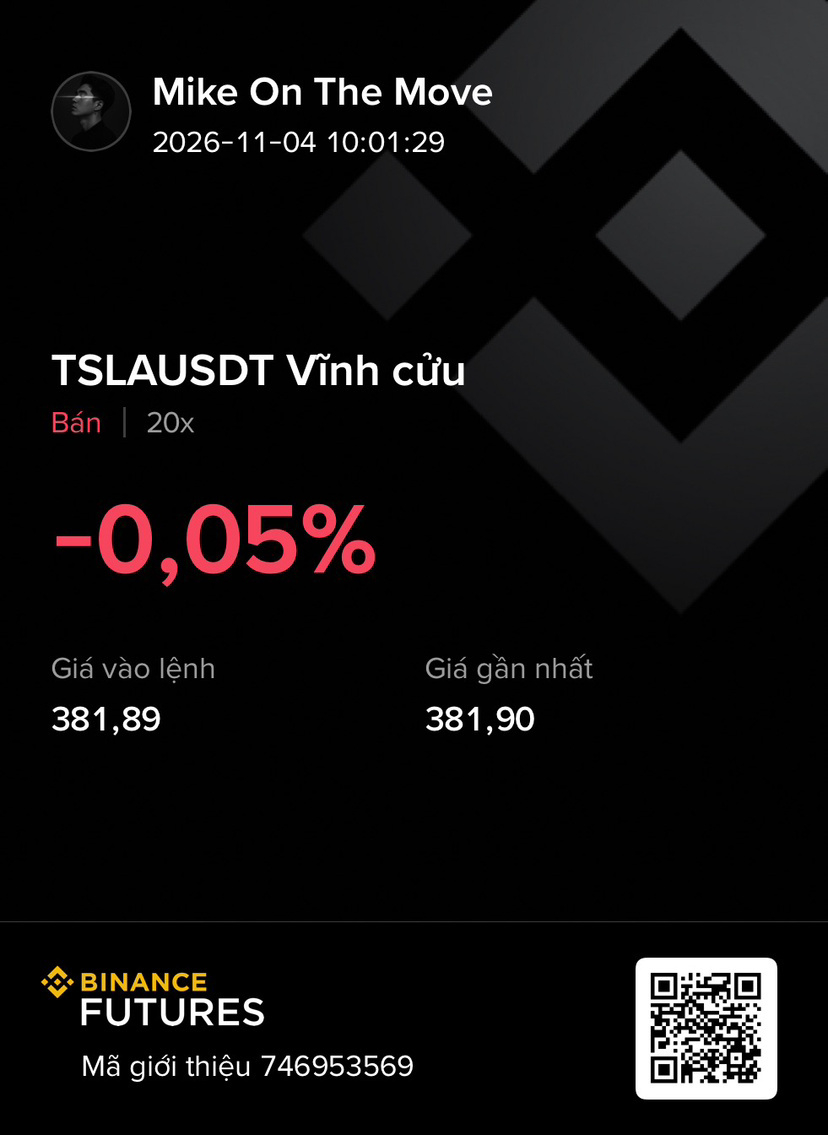
🚨 $TSLA BEARS READY TO SWEEP THE HIGHS! 🐻
Entry: 379.17-386.83 ⚡
Target: 369.60 🚀
Target: 358.10 🚀
Target: 350.40 🚀
Stop Loss: 415.00 ⚠️
📊 The order flow shows a massive liquidity grab as sellers dominate the 380‑390 zone, with smart‑money 🦈 stacking short positions. ⚡ Volume spikes on the 4H chart confirm the pressure is building, and the next demand block sits near 370, ready to snap lower. 📌 Each target aligns with historic swing lows, giving a clean risk‑reward edge for aggressive bears.
💬 Who’s positioning for the next wave of profit on $TSLA ? 👇
⚠️ Not financial advice. Always manage your risk. 🛡️
🏷️ #TSLA #ShortSetup #Bearish #LiquiditySweep #Crypto
🔥 💎
🚨 $TSLA BEARS READY TO SWEEP THE HIGHS! 🐻
Entry: 379.17-386.83 ⚡
Target: 369.60 🚀
Target: 358.10 🚀
Target: 350.40 🚀
Stop Loss: 415.00 ⚠️
📊 The order flow shows a massive liquidity grab as sellers dominate the 380‑390 zone, with smart‑money 🦈 stacking short positions. ⚡ Volume spikes on the 4H chart confirm the pressure is building, and the next demand block sits near 370, ready to snap lower. 📌 Each target aligns with historic swing lows, giving a clean risk‑reward edge for aggressive bears.
💬 Who’s positioning for the next wave of profit on $TSLA ? 👇
⚠️ Not financial advice. Always manage your risk. 🛡️
🏷️ #TSLA #ShortSetup #Bearish #LiquiditySweep #Crypto
🔥 💎
Entry: 379.17-386.83 ⚡
Target: 369.60 🚀
Target: 358.10 🚀
Target: 350.40 🚀
Stop Loss: 415.00 ⚠️
📊 The order flow shows a massive liquidity grab as sellers dominate the 380‑390 zone, with smart‑money 🦈 stacking short positions. ⚡ Volume spikes on the 4H chart confirm the pressure is building, and the next demand block sits near 370, ready to snap lower. 📌 Each target aligns with historic swing lows, giving a clean risk‑reward edge for aggressive bears.
💬 Who’s positioning for the next wave of profit on $TSLA ? 👇
⚠️ Not financial advice. Always manage your risk. 🛡️
🏷️ #TSLA #ShortSetup #Bearish #LiquiditySweep #Crypto
🔥 💎
5
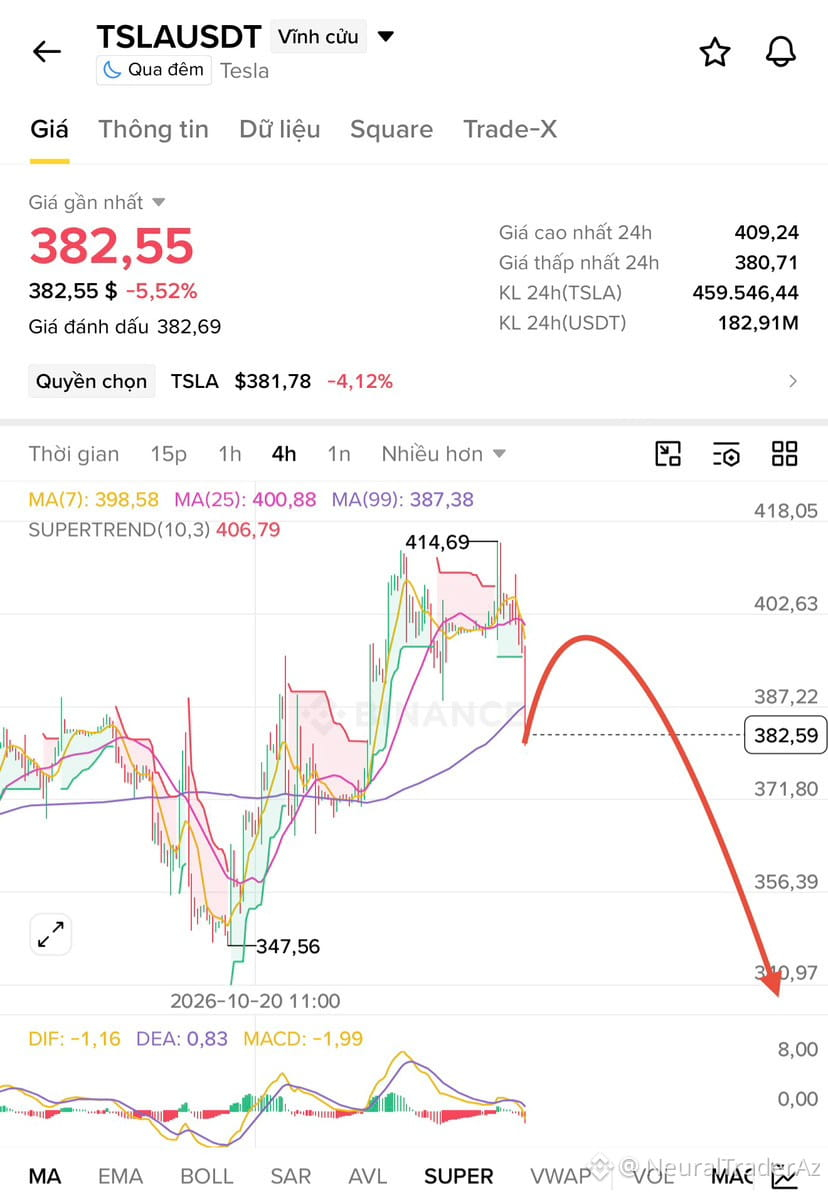
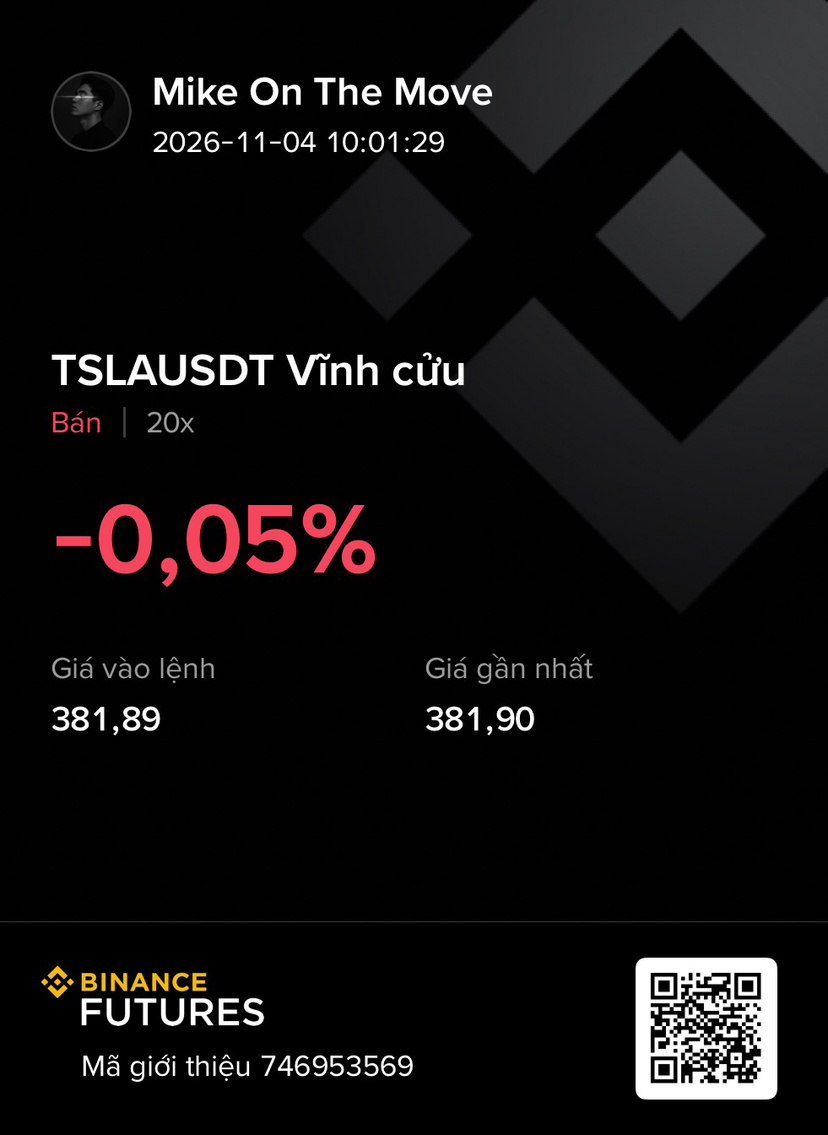
🔴 $TSLA PREPARES FOR SHARP DOWNWARD SWEEP – SHORT ALERT! 💥
Entry: 379.17-386.83 ⚡
Target: 369.60 🚀
Target: 358.10 🚀
Target: 350.40 🚀
Stop Loss: 415.00 ⚠️
📊 The recent demand block around 380 – 387 has been gobbled up by smart‑money sellers, leaving a deep liquidity pocket above 415. 📈 Volume spikes on the 4H confirm a decisive bearish pressure build‑up, while the RSI is sliding into oversold territory, hinting at a sustained downtrend. 🌊 Each target aligns with historic swing lows that acted as strong support before being breached, offering a clean risk‑reward profile for aggressive shorts. 💬 Are you positioning now to ride the next liquidity sweep below 370? 👇
⚠️ Not financial advice. Always manage your risk. 🛡️
🏷️ #TSLA #ShortSetup #LiquiditySweep #Bearish #Crypto
🦈 🔥
🔴 $TSLA PREPARES FOR SHARP DOWNWARD SWEEP – SHORT ALERT! 💥
Entry: 379.17-386.83 ⚡
Target: 369.60 🚀
Target: 358.10 🚀
Target: 350.40 🚀
Stop Loss: 415.00 ⚠️
📊 The recent demand block around 380 – 387 has been gobbled up by smart‑money sellers, leaving a deep liquidity pocket above 415. 📈 Volume spikes on the 4H confirm a decisive bearish pressure build‑up, while the RSI is sliding into oversold territory, hinting at a sustained downtrend. 🌊 Each target aligns with historic swing lows that acted as strong support before being breached, offering a clean risk‑reward profile for aggressive shorts. 💬 Are you positioning now to ride the next liquidity sweep below 370? 👇
⚠️ Not financial advice. Always manage your risk. 🛡️
🏷️ #TSLA #ShortSetup #LiquiditySweep #Bearish #Crypto
🦈 🔥
Entry: 379.17-386.83 ⚡
Target: 369.60 🚀
Target: 358.10 🚀
Target: 350.40 🚀
Stop Loss: 415.00 ⚠️
📊 The recent demand block around 380 – 387 has been gobbled up by smart‑money sellers, leaving a deep liquidity pocket above 415. 📈 Volume spikes on the 4H confirm a decisive bearish pressure build‑up, while the RSI is sliding into oversold territory, hinting at a sustained downtrend. 🌊 Each target aligns with historic swing lows that acted as strong support before being breached, offering a clean risk‑reward profile for aggressive shorts. 💬 Are you positioning now to ride the next liquidity sweep below 370? 👇
⚠️ Not financial advice. Always manage your risk. 🛡️
🏷️ #TSLA #ShortSetup #LiquiditySweep #Bearish #Crypto
🦈 🔥
5

·
--

Article
⚒️ TSLA ASSET ANALYSIS: TECHNICAL LEVELS, MARKET BENCHMARKS, AND PRICE DYNAMICS! 📈📉🚗⚡️Hello, Profit_Forge community! ⚒️🔥⚡️
The stock and tokenized stock markets continue to dictate tough rules, and one of the most popular assets—TSLA (Tesla)—is now firmly in our sights. This instrument allows crypto traders to trade the price movements of shares in the American automotive giant directly within the blockchain ecosystem, combining the liquidity of traditional stock markets with the flexibility of crypto. 📊
⚒️ TSLA ASSET ANALYSIS: TECHNICAL LEVELS, MARKET BENCHMARKS, AND PRICE DYNAMICS! 📈📉🚗⚡️
Hello, Profit_Forge community! ⚒️🔥⚡️
The stock and tokenized stock markets continue to dictate tough rules, and one of the most popular assets—TSLA (Tesla)—is now firmly in our sights. This instrument allows crypto traders to trade the price movements of shares in the American automotive giant directly within the blockchain ecosystem, combining the liquidity of traditional stock markets with the flexibility of crypto. 📊
The stock and tokenized stock markets continue to dictate tough rules, and one of the most popular assets—TSLA (Tesla)—is now firmly in our sights. This instrument allows crypto traders to trade the price movements of shares in the American automotive giant directly within the blockchain ecosystem, combining the liquidity of traditional stock markets with the flexibility of crypto. 📊
115
Log in to explore more content
Join global crypto users on Binance Square
⚡️ Get latest and useful information about crypto.
💬 Trusted by the world’s largest crypto exchange.
👍 Discover real insights from verified creators.
Email / Phone number
Trending Topics
1
#JobsReportRaisesHikeOdds
555,690 views
3,508 Discussing
2
#CPITestsDecemberRateOutlook
173,672 views
1,230 Discussing
3
#US Data Center Rules May Constrain AI Expansion
77,670 views
230 Discussing
4
#ARKPlans14ThematicETFsCoveringAIAndTokenizedMarkets
4,719 views
72 Discussing
5
#WillAnthropicListOnTime
170,802 views
1,442 Discussing
6
#WillUS-IranTensionsBoostSafe-HavenDemand?
80,661 views
571 Discussing
7
#BitcoinETFsSee$412MNetOutflows
16,893 views
79 Discussing
8
#HKSFCPlansToRestrictCryptoAndExchangeTerms
67,377 views
594 Discussing
9
#TradFiForBeginners
98,615 views
1,053 Discussing
10
#FinCENAndFedWithdraw$250CryptoTransferProposal
10,716 views
18 Discussing