
#t
t
524,844 views
3,902 Discussing
Hot
Latest

·
--
$T looks ready to bounce and go up
Entry zone 0.004606 to 0.004661
Stop 0.004493
Targets 0.004885 then 0.005042 then 0.005277
Trading volume is double the normal average
Price is sitting near the bottom of today's range
Tap $T to buy it here
#T #TradingSignals
$T looks ready to bounce and go up
Entry zone 0.004606 to 0.004661
Stop 0.004493
Targets 0.004885 then 0.005042 then 0.005277
Trading volume is double the normal average
Price is sitting near the bottom of today's range
Tap $T to buy it here
#T #TradingSignals
Entry zone 0.004606 to 0.004661
Stop 0.004493
Targets 0.004885 then 0.005042 then 0.005277
Trading volume is double the normal average
Price is sitting near the bottom of today's range
Tap $T to buy it here
#T #TradingSignals
8

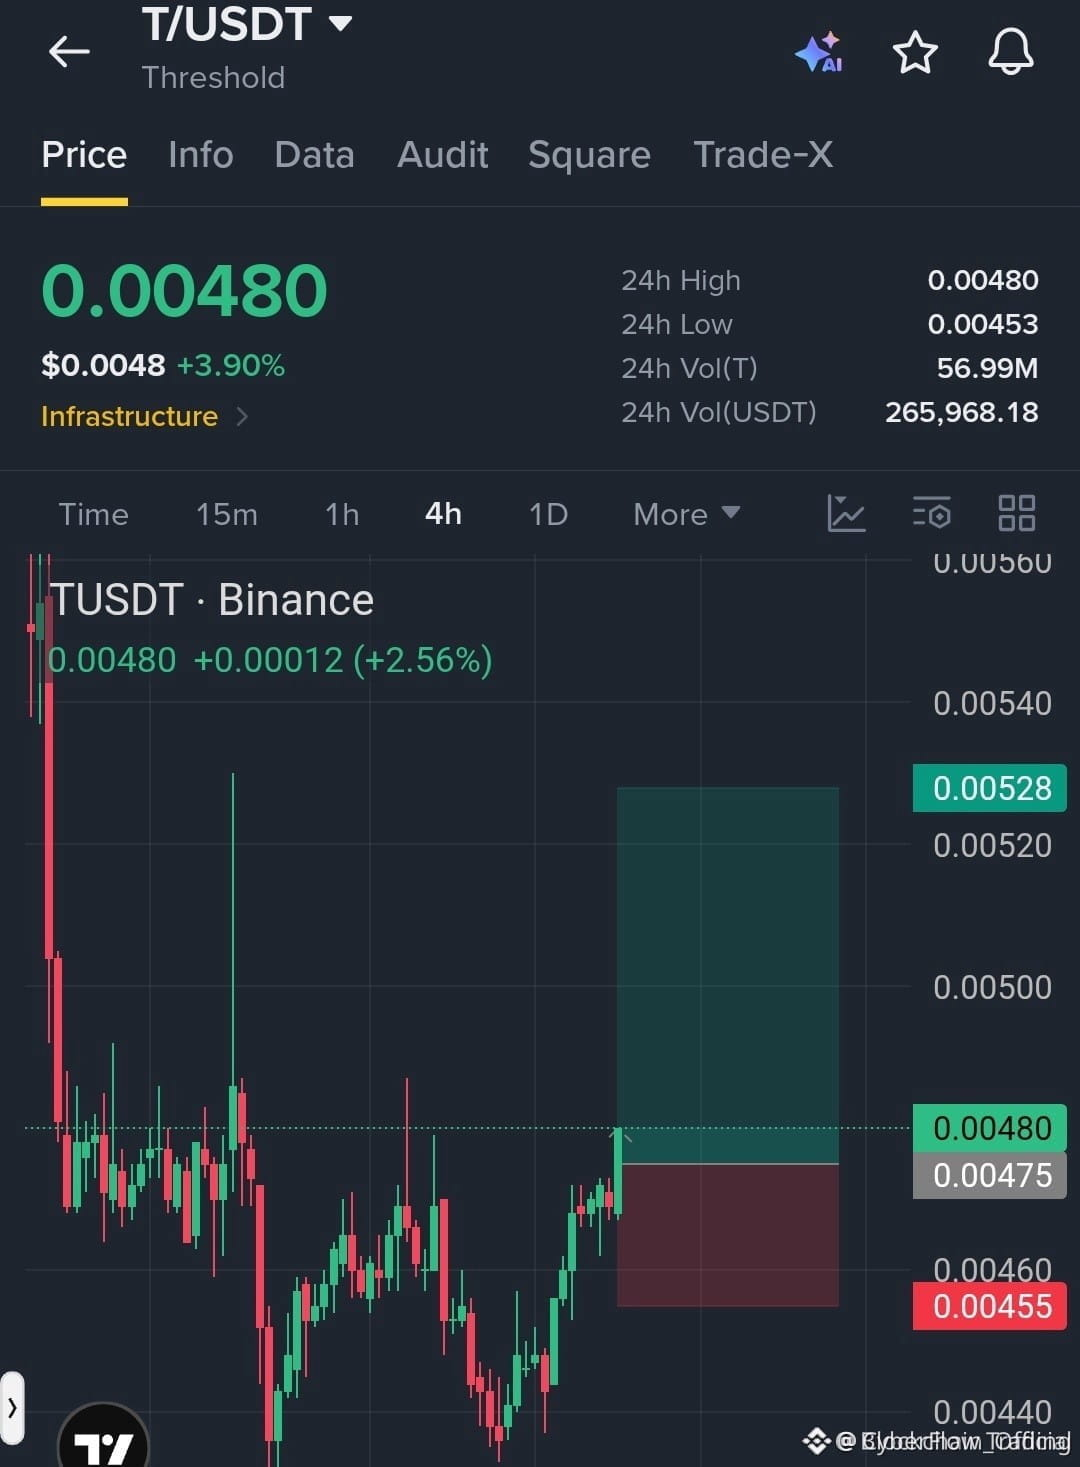
🚀 $T BULLISH RECOVERY KICKS OFF, EYES ON $0.00528 💥
Entry: $0.00475 ⚡
Target: $0.00528 🚀
Stop Loss: $0.00455 ⚠️
Buyers have reclaimed the $0.00475‑$0.00480 zone, swallowing the last of the sell‑off. 📊 Volume spikes on the 4‑hour chart signal a fresh liquidity sweep, and the order flow is turning green.
If the price holds above $0.00475, the ladder climbs to $0.00490, then $0.00510, with the final push to $0.00528 as resistance crumbles. 🦈 Smart money is stacking positions, and momentum gauges are flashing bullish.
💬 Are you ready to ride this recovery or waiting for the next pull? 👇
⚠️ Not financial advice. Always manage your risk. 🛡️
🏷️ #T #LongSetup #Bullish #Crypto
🔥 💎
🚀 $T BULLISH RECOVERY KICKS OFF, EYES ON $0.00528 💥
Entry: $0.00475 ⚡
Target: $0.00528 🚀
Stop Loss: $0.00455 ⚠️
Buyers have reclaimed the $0.00475‑$0.00480 zone, swallowing the last of the sell‑off. 📊 Volume spikes on the 4‑hour chart signal a fresh liquidity sweep, and the order flow is turning green.
If the price holds above $0.00475, the ladder climbs to $0.00490, then $0.00510, with the final push to $0.00528 as resistance crumbles. 🦈 Smart money is stacking positions, and momentum gauges are flashing bullish.
💬 Are you ready to ride this recovery or waiting for the next pull? 👇
⚠️ Not financial advice. Always manage your risk. 🛡️
🏷️ #T #LongSetup #Bullish #Crypto
🔥 💎
Entry: $0.00475 ⚡
Target: $0.00528 🚀
Stop Loss: $0.00455 ⚠️
Buyers have reclaimed the $0.00475‑$0.00480 zone, swallowing the last of the sell‑off. 📊 Volume spikes on the 4‑hour chart signal a fresh liquidity sweep, and the order flow is turning green.
If the price holds above $0.00475, the ladder climbs to $0.00490, then $0.00510, with the final push to $0.00528 as resistance crumbles. 🦈 Smart money is stacking positions, and momentum gauges are flashing bullish.
💬 Are you ready to ride this recovery or waiting for the next pull? 👇
⚠️ Not financial advice. Always manage your risk. 🛡️
🏷️ #T #LongSetup #Bullish #Crypto
🔥 💎
24

·
--
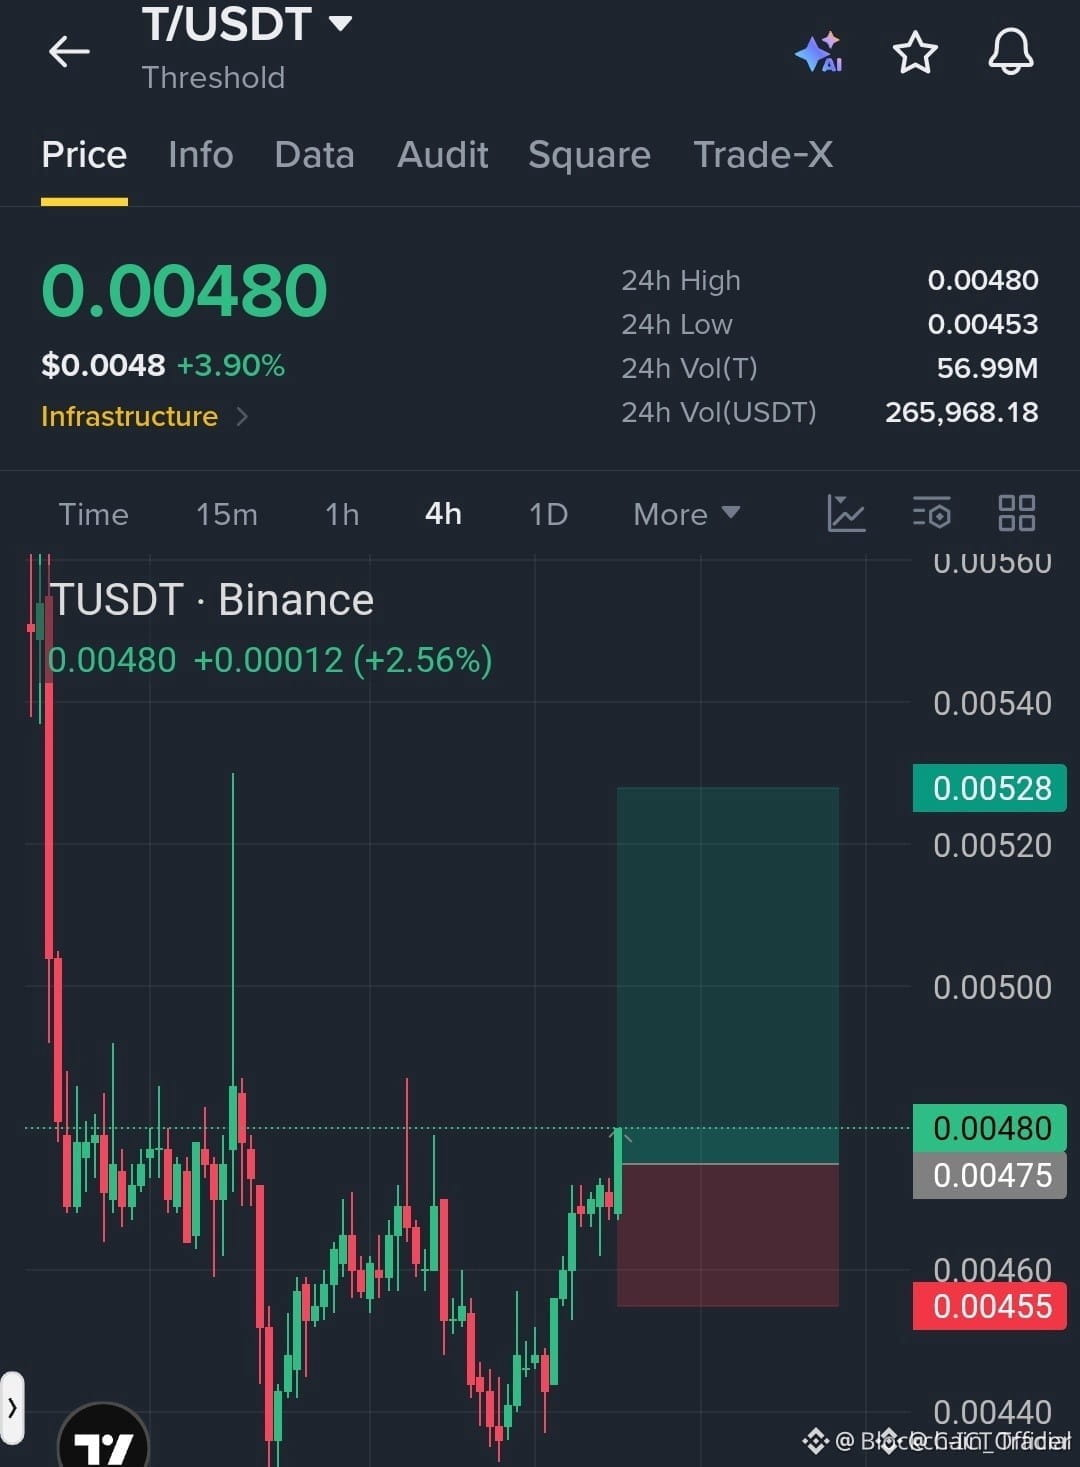
🚀 $T BULLISH RECOVERY SET TO TEST $0.00528 ZONE! 📈
Entry: 0.00475-0.00480 ⚡
Target: 0.00528 🚀
Stop Loss: 0.00455 ⚠️
📊 The demand block anchored at $0.00475 has repeatedly absorbed sell pressure, signaling smart‑money accumulation. 🦈 As price steadies above this zone, liquidity pools below are being cleared, paving the path for a clean upward thrust.
💡 With a risk‑to‑reward profile comfortably above 1:2, the setup aligns with historic swing patterns where institutional buying re‑engages after a brief pullback. 📈 Holding the level invites the next leg toward the $0.00528 ceiling.
💬 How are you timing your entry to ride this recovery? 👇
⚠️ Not financial advice. Always manage your risk. 🛡️
🏷️ #T #LongSetup #Recovery #Liquidity #Crypto
🦈 🔥
🚀 $T BULLISH RECOVERY SET TO TEST $0.00528 ZONE! 📈
Entry: 0.00475-0.00480 ⚡
Target: 0.00528 🚀
Stop Loss: 0.00455 ⚠️
📊 The demand block anchored at $0.00475 has repeatedly absorbed sell pressure, signaling smart‑money accumulation. 🦈 As price steadies above this zone, liquidity pools below are being cleared, paving the path for a clean upward thrust.
💡 With a risk‑to‑reward profile comfortably above 1:2, the setup aligns with historic swing patterns where institutional buying re‑engages after a brief pullback. 📈 Holding the level invites the next leg toward the $0.00528 ceiling.
💬 How are you timing your entry to ride this recovery? 👇
⚠️ Not financial advice. Always manage your risk. 🛡️
🏷️ #T #LongSetup #Recovery #Liquidity #Crypto
🦈 🔥
Entry: 0.00475-0.00480 ⚡
Target: 0.00528 🚀
Stop Loss: 0.00455 ⚠️
📊 The demand block anchored at $0.00475 has repeatedly absorbed sell pressure, signaling smart‑money accumulation. 🦈 As price steadies above this zone, liquidity pools below are being cleared, paving the path for a clean upward thrust.
💡 With a risk‑to‑reward profile comfortably above 1:2, the setup aligns with historic swing patterns where institutional buying re‑engages after a brief pullback. 📈 Holding the level invites the next leg toward the $0.00528 ceiling.
💬 How are you timing your entry to ride this recovery? 👇
⚠️ Not financial advice. Always manage your risk. 🛡️
🏷️ #T #LongSetup #Recovery #Liquidity #Crypto
🦈 🔥
6

T current price 0.004691, up 3.10% in 24 hours, but the 4-hour funding rate is -0.0276%. Let’s convert that: with 6 settlements per day, shorts pay 0.1656% of their notional principal per day; annualized, that’s about -60%. In other words, people shorting are willing to pay rent equal to 60% of their position’s value over a year just to hold it. The price is rising, and shorts are still paying out of pocket—this buying pressure isn’t being driven by perpetual longs.
First, get the direction of the funding rate straight. When the funding rate is negative, shorts pay and longs receive. That means shorts are the crowded side of the perpetual futures market. At 10x leverage, a short position’s daily funding cost eats up about 1.65% of its margin; at 20x, it’s 3.3%. This isn’t a one-time slippage cost—it’s an ongoing deduction, charged every day and every 4 hours. Shorts would accept this cost for only two possible reasons: either they’re certain the price will fall enough to cover it, or the short isn’t a directional bet at all, but a hedge against something elsewhere (spot, options, or another exchange). Perpetual prices weighed down by hedging positions often don’t reflect genuine bullish or bearish sentiment.
Second, look at the account structure. Long accounts make up 37.9%, which means 62.1% of accounts are short. Retail accounts are shorting against the price, while the price is rising. The implication is that retail isn’t driving the rally; retail is passively positioned on the opposite side. When the price rises, underwater shorts either add margin or close their positions. Closing means buying, creating a second wave of upward pressure. That’s why negative-funding environments can see brief, steep surges—not because buying demand is especially strong, but because shorts’ own stop-loss orders are buying.
Third, look at how shallow this pool is. 24-hour trading volume is 3.1M USDT, and open interest is 2.99 million USDT—almost the same order of magnitude. This means: first, a market order worth just tens of thousands of dollars can create a visible wick; second, a “60% annualized” negative funding rate sounds terrifying, but it’s calculated on notional value, and the market’s capacity is tiny. Big money can’t get in to capture this spread; only a few people watching the market closely can. Third, thin depth combined with crowded shorts is a common recipe for sharp wicks in either direction, so don’t assume the direction. Funding rates and prices in a thin pool can both be distorted in the short term by a single order. When you see an extreme, question liquidity first, then consider what it signals.
Fourth, here’s a framework you can use to verify things for yourself. To judge the nature of this rally, focus on the relationship between open interest and price: if the price keeps rising while open interest falls at the same time, that suggests short covering is driving the move. It’s a “fuel-burning” rally: it comes fast and fades fast, while funding gradually returns to neutral as shorts exit. If the price rises while open interest stays flat or increases, that suggests new shorts are entering at higher levels to take over. As more underwater shorts pile in, the rally may have more room to run because there are more positions that can be squeezed. These two scenarios call for completely opposite strategies, so don’t just look at the color of the candlesticks.
My own view is neutral, with a slight bullish bias—but not because “the price is rising.” It’s because shorting now comes with a clear holding cost, and the price hasn’t given shorts a chance to cash in. What you really need to watch out for is liquidity and volatility: with daily trading volume of 3.1M, any moderately large order could send the price somewhere you wouldn’t expect. Setting a stop-loss at a typical percentage distance in this pool is basically giving your money away.
Tracking the changes in open interest and funding rates together is more useful than watching the price.
#T #Crypto
T current price 0.004691, up 3.10% in 24 hours, but the 4-hour funding rate is -0.0276%. Let’s convert that: with 6 settlements per day, shorts pay 0.1656% of their notional principal per day; annualized, that’s about -60%. In other words, people shorting are willing to pay rent equal to 60% of their position’s value over a year just to hold it. The price is rising, and shorts are still paying out of pocket—this buying pressure isn’t being driven by perpetual longs.
First, get the direction of the funding rate straight. When the funding rate is negative, shorts pay and longs receive. That means shorts are the crowded side of the perpetual futures market. At 10x leverage, a short position’s daily funding cost eats up about 1.65% of its margin; at 20x, it’s 3.3%. This isn’t a one-time slippage cost—it’s an ongoing deduction, charged every day and every 4 hours. Shorts would accept this cost for only two possible reasons: either they’re certain the price will fall enough to cover it, or the short isn’t a directional bet at all, but a hedge against something elsewhere (spot, options, or another exchange). Perpetual prices weighed down by hedging positions often don’t reflect genuine bullish or bearish sentiment.
Second, look at the account structure. Long accounts make up 37.9%, which means 62.1% of accounts are short. Retail accounts are shorting against the price, while the price is rising. The implication is that retail isn’t driving the rally; retail is passively positioned on the opposite side. When the price rises, underwater shorts either add margin or close their positions. Closing means buying, creating a second wave of upward pressure. That’s why negative-funding environments can see brief, steep surges—not because buying demand is especially strong, but because shorts’ own stop-loss orders are buying.
Third, look at how shallow this pool is. 24-hour trading volume is 3.1M USDT, and open interest is 2.99 million USDT—almost the same order of magnitude. This means: first, a market order worth just tens of thousands of dollars can create a visible wick; second, a “60% annualized” negative funding rate sounds terrifying, but it’s calculated on notional value, and the market’s capacity is tiny. Big money can’t get in to capture this spread; only a few people watching the market closely can. Third, thin depth combined with crowded shorts is a common recipe for sharp wicks in either direction, so don’t assume the direction. Funding rates and prices in a thin pool can both be distorted in the short term by a single order. When you see an extreme, question liquidity first, then consider what it signals.
Fourth, here’s a framework you can use to verify things for yourself. To judge the nature of this rally, focus on the relationship between open interest and price: if the price keeps rising while open interest falls at the same time, that suggests short covering is driving the move. It’s a “fuel-burning” rally: it comes fast and fades fast, while funding gradually returns to neutral as shorts exit. If the price rises while open interest stays flat or increases, that suggests new shorts are entering at higher levels to take over. As more underwater shorts pile in, the rally may have more room to run because there are more positions that can be squeezed. These two scenarios call for completely opposite strategies, so don’t just look at the color of the candlesticks.
My own view is neutral, with a slight bullish bias—but not because “the price is rising.” It’s because shorting now comes with a clear holding cost, and the price hasn’t given shorts a chance to cash in. What you really need to watch out for is liquidity and volatility: with daily trading volume of 3.1M, any moderately large order could send the price somewhere you wouldn’t expect. Setting a stop-loss at a typical percentage distance in this pool is basically giving your money away.
Tracking the changes in open interest and funding rates together is more useful than watching the price.
#T #Crypto
First, get the direction of the funding rate straight. When the funding rate is negative, shorts pay and longs receive. That means shorts are the crowded side of the perpetual futures market. At 10x leverage, a short position’s daily funding cost eats up about 1.65% of its margin; at 20x, it’s 3.3%. This isn’t a one-time slippage cost—it’s an ongoing deduction, charged every day and every 4 hours. Shorts would accept this cost for only two possible reasons: either they’re certain the price will fall enough to cover it, or the short isn’t a directional bet at all, but a hedge against something elsewhere (spot, options, or another exchange). Perpetual prices weighed down by hedging positions often don’t reflect genuine bullish or bearish sentiment.
Second, look at the account structure. Long accounts make up 37.9%, which means 62.1% of accounts are short. Retail accounts are shorting against the price, while the price is rising. The implication is that retail isn’t driving the rally; retail is passively positioned on the opposite side. When the price rises, underwater shorts either add margin or close their positions. Closing means buying, creating a second wave of upward pressure. That’s why negative-funding environments can see brief, steep surges—not because buying demand is especially strong, but because shorts’ own stop-loss orders are buying.
Third, look at how shallow this pool is. 24-hour trading volume is 3.1M USDT, and open interest is 2.99 million USDT—almost the same order of magnitude. This means: first, a market order worth just tens of thousands of dollars can create a visible wick; second, a “60% annualized” negative funding rate sounds terrifying, but it’s calculated on notional value, and the market’s capacity is tiny. Big money can’t get in to capture this spread; only a few people watching the market closely can. Third, thin depth combined with crowded shorts is a common recipe for sharp wicks in either direction, so don’t assume the direction. Funding rates and prices in a thin pool can both be distorted in the short term by a single order. When you see an extreme, question liquidity first, then consider what it signals.
Fourth, here’s a framework you can use to verify things for yourself. To judge the nature of this rally, focus on the relationship between open interest and price: if the price keeps rising while open interest falls at the same time, that suggests short covering is driving the move. It’s a “fuel-burning” rally: it comes fast and fades fast, while funding gradually returns to neutral as shorts exit. If the price rises while open interest stays flat or increases, that suggests new shorts are entering at higher levels to take over. As more underwater shorts pile in, the rally may have more room to run because there are more positions that can be squeezed. These two scenarios call for completely opposite strategies, so don’t just look at the color of the candlesticks.
My own view is neutral, with a slight bullish bias—but not because “the price is rising.” It’s because shorting now comes with a clear holding cost, and the price hasn’t given shorts a chance to cash in. What you really need to watch out for is liquidity and volatility: with daily trading volume of 3.1M, any moderately large order could send the price somewhere you wouldn’t expect. Setting a stop-loss at a typical percentage distance in this pool is basically giving your money away.
Tracking the changes in open interest and funding rates together is more useful than watching the price.
#T #Crypto
5
·
--
$T moves 1.4 percent an hour. Most people size it like a bitcoin
Volatility means nothing until you tie it to your risk
Here is the math on a one thousand dollar account
You want a one percent loss limit which is ten dollars
The hourly swing is 1.4 percent of the current price at 0.004570
That move is 0.000064 per coin
Divide ten dollars by that swing to get your total size
That gives you roughly 156000 tokens for the trade
Keep your position tied to the noise so one bad hour does not wipe you out
Open $T and set an alert at that level
What stop distance do you use on small caps
#T #TradingTips
$T moves 1.4 percent an hour. Most people size it like a bitcoin
Volatility means nothing until you tie it to your risk
Here is the math on a one thousand dollar account
You want a one percent loss limit which is ten dollars
The hourly swing is 1.4 percent of the current price at 0.004570
That move is 0.000064 per coin
Divide ten dollars by that swing to get your total size
That gives you roughly 156000 tokens for the trade
Keep your position tied to the noise so one bad hour does not wipe you out
Open $T and set an alert at that level
What stop distance do you use on small caps
#T #TradingTips
Volatility means nothing until you tie it to your risk
Here is the math on a one thousand dollar account
You want a one percent loss limit which is ten dollars
The hourly swing is 1.4 percent of the current price at 0.004570
That move is 0.000064 per coin
Divide ten dollars by that swing to get your total size
That gives you roughly 156000 tokens for the trade
Keep your position tied to the noise so one bad hour does not wipe you out
Open $T and set an alert at that level
What stop distance do you use on small caps
#T #TradingTips
5

·
--
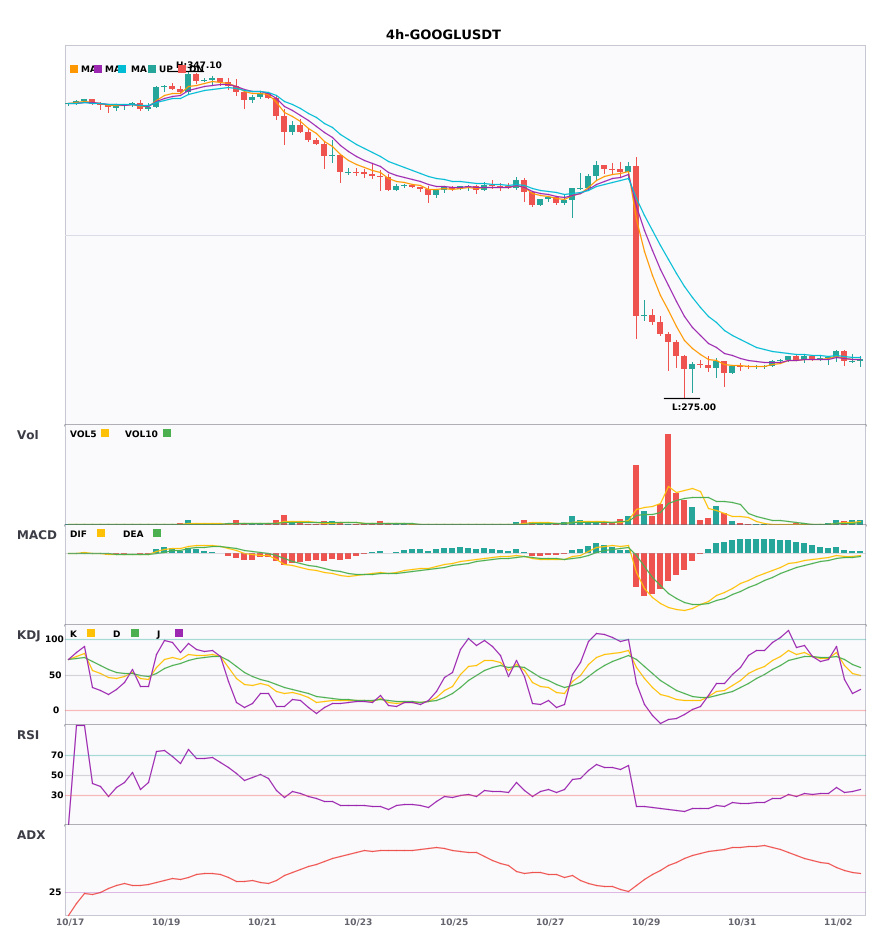
$GOOGL / $T 4-hour short + daily short in the same direction; multi-timeframe confluence turns bearish 🔥
════════════════════
🟢 $GOOGL 4-hour short signal
⚠️Technical analysis: Daily bearish confluence confirmed | 4-hour entry: EMA5 crosses below EMA8, indicating a short-term bearish turn | KDJ is running strong, with bulls in control (K: 51.6, D: 65.1) | Volume increased (2.5x)
════════════════════
🟢 $T 4-hour short signal
⚠️Technical analysis: Daily bearish confluence confirmed | 4-hour entry: MACD DIF fell below the zero line, indicating a bearish trend reversal | EMA5 < EMA8 < EMA13, bearish alignment | KDJ is running weak, with bears in control (K: 27.5, D: 40.0) | Volume is normal (1.3x)
════════════════════
🔔 Follow for first-hand market movement updates 🔔
#多周期共振 #GOOGL #T
📌 When trading, pay attention to whether the candlestick pattern aligns
$GOOGL / $T 4-hour short + daily short in the same direction; multi-timeframe confluence turns bearish 🔥
════════════════════
🟢 $GOOGL 4-hour short signal
⚠️Technical analysis: Daily bearish confluence confirmed | 4-hour entry: EMA5 crosses below EMA8, indicating a short-term bearish turn | KDJ is running strong, with bulls in control (K: 51.6, D: 65.1) | Volume increased (2.5x)
════════════════════
🟢 $T 4-hour short signal
⚠️Technical analysis: Daily bearish confluence confirmed | 4-hour entry: MACD DIF fell below the zero line, indicating a bearish trend reversal | EMA5 < EMA8 < EMA13, bearish alignment | KDJ is running weak, with bears in control (K: 27.5, D: 40.0) | Volume is normal (1.3x)
════════════════════
🔔 Follow for first-hand market movement updates 🔔
#多周期共振 #GOOGL #T
📌 When trading, pay attention to whether the candlestick pattern aligns
════════════════════
🟢 $GOOGL 4-hour short signal
⚠️Technical analysis: Daily bearish confluence confirmed | 4-hour entry: EMA5 crosses below EMA8, indicating a short-term bearish turn | KDJ is running strong, with bulls in control (K: 51.6, D: 65.1) | Volume increased (2.5x)
════════════════════
🟢 $T 4-hour short signal
⚠️Technical analysis: Daily bearish confluence confirmed | 4-hour entry: MACD DIF fell below the zero line, indicating a bearish trend reversal | EMA5 < EMA8 < EMA13, bearish alignment | KDJ is running weak, with bears in control (K: 27.5, D: 40.0) | Volume is normal (1.3x)
════════════════════
🔔 Follow for first-hand market movement updates 🔔
#多周期共振 #GOOGL #T
📌 When trading, pay attention to whether the candlestick pattern aligns
22
·
--
$T 4-hour bearish + daily bearish in the same direction; multi-timeframe confluence—trade with the trend 🔥
════════════════════
🟢 $T 4-hour bearish signal
⚠️ Technical analysis: Daily bearish confluence confirmed | 4-hour entry: MACD DIF breaks below the zero line, trend turns bearish | EMA5 < EMA8 < EMA13, bearish alignment | KDJ weak, bears in control (K: 27.5, D: 40.0) | Volume normal (1.3x)
════════════════════
🔔 Follow for first-hand market updates 🔔
#多周期共振 #T
📌 When trading, check whether the candlestick pattern matches
$T 4-hour bearish + daily bearish in the same direction; multi-timeframe confluence—trade with the trend 🔥
════════════════════
🟢 $T 4-hour bearish signal
⚠️ Technical analysis: Daily bearish confluence confirmed | 4-hour entry: MACD DIF breaks below the zero line, trend turns bearish | EMA5 < EMA8 < EMA13, bearish alignment | KDJ weak, bears in control (K: 27.5, D: 40.0) | Volume normal (1.3x)
════════════════════
🔔 Follow for first-hand market updates 🔔
#多周期共振 #T
📌 When trading, check whether the candlestick pattern matches
════════════════════
🟢 $T 4-hour bearish signal
⚠️ Technical analysis: Daily bearish confluence confirmed | 4-hour entry: MACD DIF breaks below the zero line, trend turns bearish | EMA5 < EMA8 < EMA13, bearish alignment | KDJ weak, bears in control (K: 27.5, D: 40.0) | Volume normal (1.3x)
════════════════════
🔔 Follow for first-hand market updates 🔔
#多周期共振 #T
📌 When trading, check whether the candlestick pattern matches
7

·
--
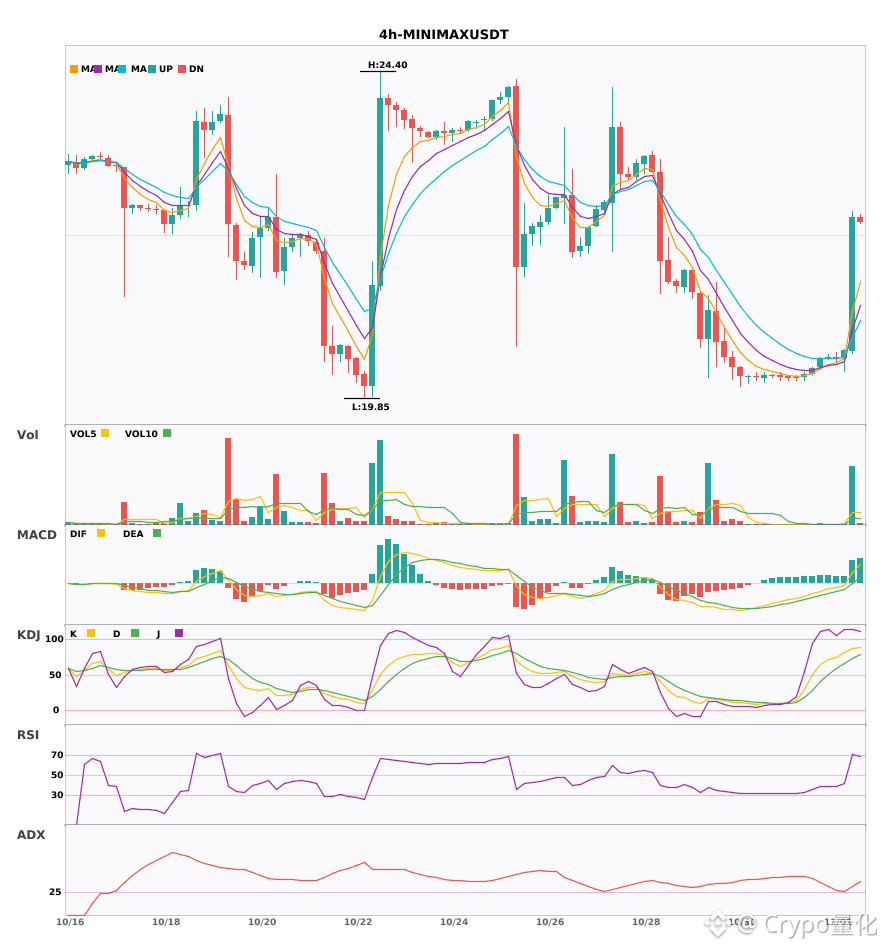
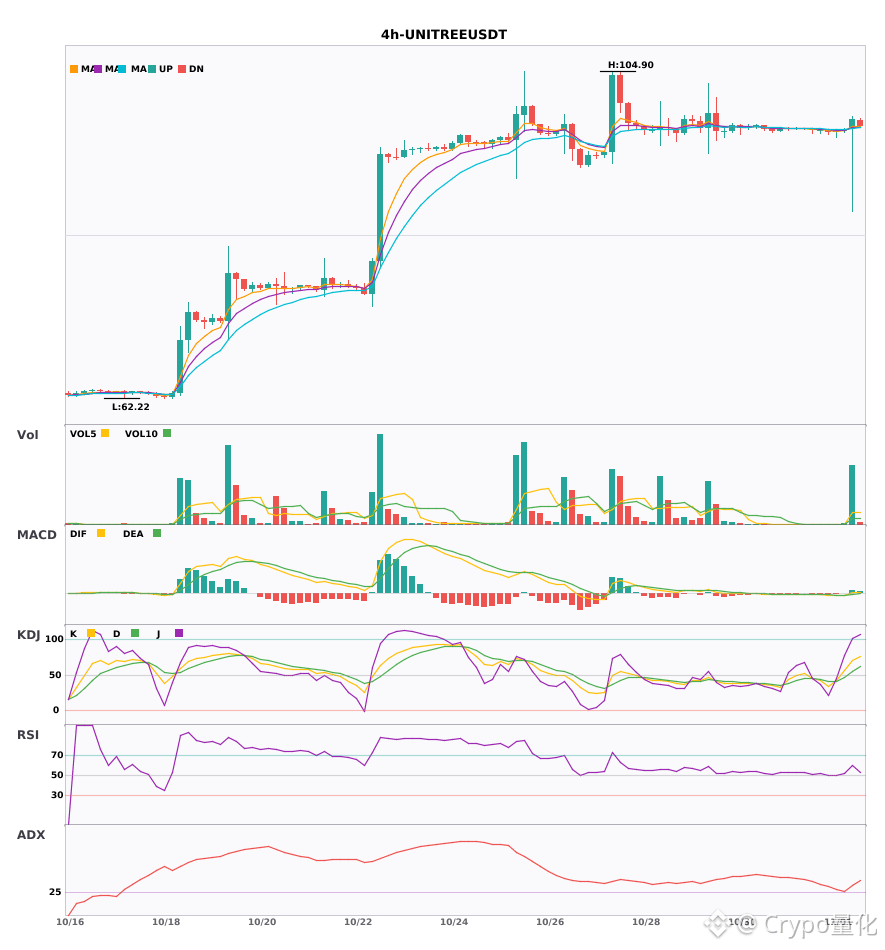
3 4-hour bullish signals appeared simultaneously: $MINIMAX / $UNITREE / $T🔥
════════════════════
🔴 $MINIMAX 4-hour bullish signal
⚠️Technical analysis: ADX(35) indicates a clear trend | MACD DIF broke above zero, turning the trend bullish | EMA5 > EMA8 > EMA13, bullish alignment | KDJ is strong, with bulls in control (K: 87.0, D: 73.4) | Volume surge (8.9x)
════════════════════
🔴 $UNITREE 4-hour bullish signal
⚠️Technical analysis: ADX(31) indicates a clear trend | MACD DIF broke above zero, turning the trend bullish | EMA5 crossed above EMA8, short-term outlook turns bullish | KDJ is strong, with bulls in control (K: 70.2, D: 54.4) | Volume surge (9.1x)
════════════════════
🔴 $T 4-hour bullish signal
⚠️Technical analysis: ADX(29) trend is forming; participation is possible | MACD bullish crossover above zero, releasing bullish momentum | EMA5 > EMA8 > EMA13, bullish alignment | Volume increase (2.4x)
════════════════════
🔔 Follow for first-hand market alerts 🔔
#技术分析 #MINIMAX #UNITREE #T
📌 When trading, watch whether the candlestick patterns align
3 4-hour bullish signals appeared simultaneously: $MINIMAX / $UNITREE / $T 🔥
════════════════════
🔴 $MINIMAX 4-hour bullish signal
⚠️Technical analysis: ADX(35) indicates a clear trend | MACD DIF broke above zero, turning the trend bullish | EMA5 > EMA8 > EMA13, bullish alignment | KDJ is strong, with bulls in control (K: 87.0, D: 73.4) | Volume surge (8.9x)
════════════════════
🔴 $UNITREE 4-hour bullish signal
⚠️Technical analysis: ADX(31) indicates a clear trend | MACD DIF broke above zero, turning the trend bullish | EMA5 crossed above EMA8, short-term outlook turns bullish | KDJ is strong, with bulls in control (K: 70.2, D: 54.4) | Volume surge (9.1x)
════════════════════
🔴 $T 4-hour bullish signal
⚠️Technical analysis: ADX(29) trend is forming; participation is possible | MACD bullish crossover above zero, releasing bullish momentum | EMA5 > EMA8 > EMA13, bullish alignment | Volume increase (2.4x)
════════════════════
🔔 Follow for first-hand market alerts 🔔
#技术分析 #MINIMAX #UNITREE #T
📌 When trading, watch whether the candlestick patterns align
════════════════════
🔴 $MINIMAX 4-hour bullish signal
⚠️Technical analysis: ADX(35) indicates a clear trend | MACD DIF broke above zero, turning the trend bullish | EMA5 > EMA8 > EMA13, bullish alignment | KDJ is strong, with bulls in control (K: 87.0, D: 73.4) | Volume surge (8.9x)
════════════════════
🔴 $UNITREE 4-hour bullish signal
⚠️Technical analysis: ADX(31) indicates a clear trend | MACD DIF broke above zero, turning the trend bullish | EMA5 crossed above EMA8, short-term outlook turns bullish | KDJ is strong, with bulls in control (K: 70.2, D: 54.4) | Volume surge (9.1x)
════════════════════
🔴 $T 4-hour bullish signal
⚠️Technical analysis: ADX(29) trend is forming; participation is possible | MACD bullish crossover above zero, releasing bullish momentum | EMA5 > EMA8 > EMA13, bullish alignment | Volume increase (2.4x)
════════════════════
🔔 Follow for first-hand market alerts 🔔
#技术分析 #MINIMAX #UNITREE #T
📌 When trading, watch whether the candlestick patterns align
12

Anyone else get it, fam!
$T hit a new high! It broke through the 24-hour high.
Current price: 0.00477. The previous high of 0.004704 is now behind us.
When things are going well, protecting your profits is harder than chasing gains. Do you think this move was driven by big money or retail investors?
#T
Just chatting—whether you win or lose, you have to own it yourself.
Anyone else get it, fam!
$T hit a new high! It broke through the 24-hour high.
Current price: 0.00477. The previous high of 0.004704 is now behind us.
When things are going well, protecting your profits is harder than chasing gains. Do you think this move was driven by big money or retail investors?
#T
Just chatting—whether you win or lose, you have to own it yourself.
$T hit a new high! It broke through the 24-hour high.
Current price: 0.00477. The previous high of 0.004704 is now behind us.
When things are going well, protecting your profits is harder than chasing gains. Do you think this move was driven by big money or retail investors?
#T
Just chatting—whether you win or lose, you have to own it yourself.
26
·
--
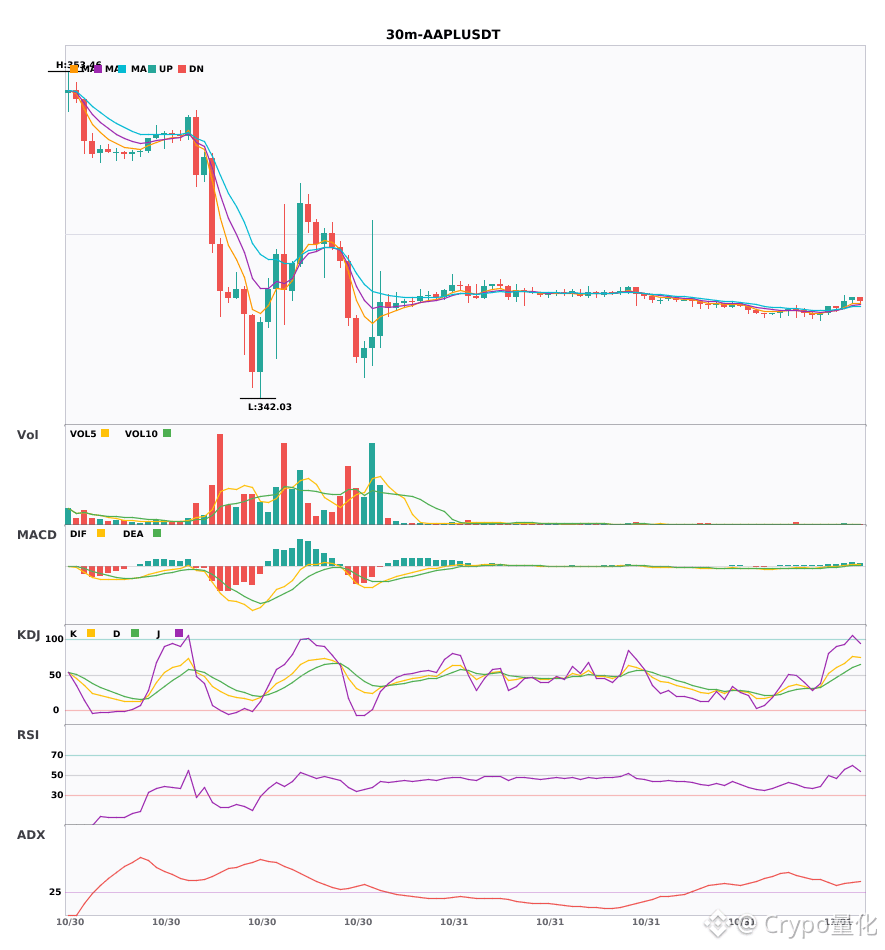
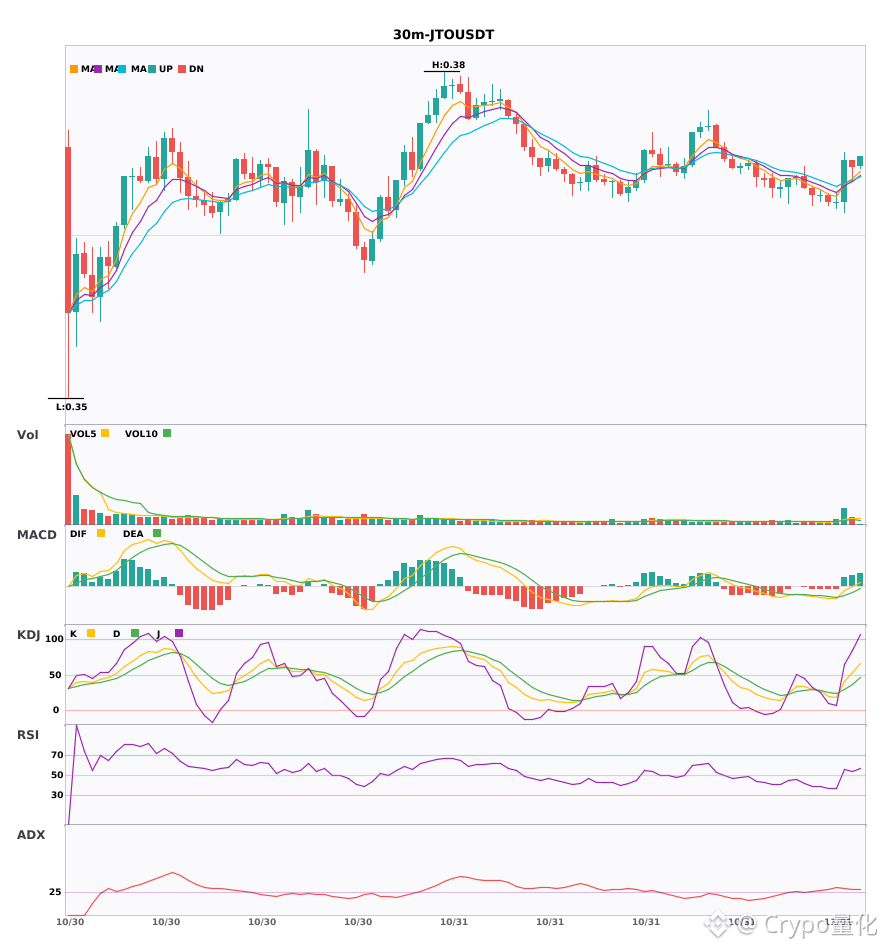
$AAPL / $JTO / $T 30-minute timeframe bullish bias, short-term confluence opportunity 🔥
════════════════════
🔴 $AAPL 30-minute bullish signal
⚠️ Technical analysis: ADX(36) indicates a clear trending market | MACD DIF crossed above the zero line, turning the trend bullish | EMA5 > EMA8 > EMA13, bullish alignment | KDJ is running strong, with bulls in control (K: 66.3, D: 52.9) | Volume increased (2.1x)
════════════════════
🔴 $JTO 30-minute bullish signal
⚠️ Technical analysis: ADX(32) indicates a clear trending market | MACD DIF crossed above the zero line, turning the trend bullish | Moving averages are converging and building momentum; a direction is likely to emerge soon | Volume surged (3.7x)
════════════════════
🔴 $T 30-minute bullish signal
⚠️ Technical analysis: ADX(31) indicates a clear trending market | MACD DIF crossed above the zero line, turning the trend bullish | EMA5 > EMA8 > EMA13, bullish alignment | KDJ is running strong, with bulls in control (K: 55.0, D: 50.7) | Volume surged (4.7x)
════════════════════
🔔 Follow for first-hand market movement alerts 🔔
#技术分析 #AAPL #JTO #T
📌 When trading, pay attention to whether the candlestick pattern matches
$AAPL / $JTO / $T 30-minute timeframe bullish bias, short-term confluence opportunity 🔥
════════════════════
🔴 $AAPL 30-minute bullish signal
⚠️ Technical analysis: ADX(36) indicates a clear trending market | MACD DIF crossed above the zero line, turning the trend bullish | EMA5 > EMA8 > EMA13, bullish alignment | KDJ is running strong, with bulls in control (K: 66.3, D: 52.9) | Volume increased (2.1x)
════════════════════
🔴 $JTO 30-minute bullish signal
⚠️ Technical analysis: ADX(32) indicates a clear trending market | MACD DIF crossed above the zero line, turning the trend bullish | Moving averages are converging and building momentum; a direction is likely to emerge soon | Volume surged (3.7x)
════════════════════
🔴 $T 30-minute bullish signal
⚠️ Technical analysis: ADX(31) indicates a clear trending market | MACD DIF crossed above the zero line, turning the trend bullish | EMA5 > EMA8 > EMA13, bullish alignment | KDJ is running strong, with bulls in control (K: 55.0, D: 50.7) | Volume surged (4.7x)
════════════════════
🔔 Follow for first-hand market movement alerts 🔔
#技术分析 #AAPL #JTO #T
📌 When trading, pay attention to whether the candlestick pattern matches
════════════════════
🔴 $AAPL 30-minute bullish signal
⚠️ Technical analysis: ADX(36) indicates a clear trending market | MACD DIF crossed above the zero line, turning the trend bullish | EMA5 > EMA8 > EMA13, bullish alignment | KDJ is running strong, with bulls in control (K: 66.3, D: 52.9) | Volume increased (2.1x)
════════════════════
🔴 $JTO 30-minute bullish signal
⚠️ Technical analysis: ADX(32) indicates a clear trending market | MACD DIF crossed above the zero line, turning the trend bullish | Moving averages are converging and building momentum; a direction is likely to emerge soon | Volume surged (3.7x)
════════════════════
🔴 $T 30-minute bullish signal
⚠️ Technical analysis: ADX(31) indicates a clear trending market | MACD DIF crossed above the zero line, turning the trend bullish | EMA5 > EMA8 > EMA13, bullish alignment | KDJ is running strong, with bulls in control (K: 55.0, D: 50.7) | Volume surged (4.7x)
════════════════════
🔔 Follow for first-hand market movement alerts 🔔
#技术分析 #AAPL #JTO #T
📌 When trading, pay attention to whether the candlestick pattern matches
7

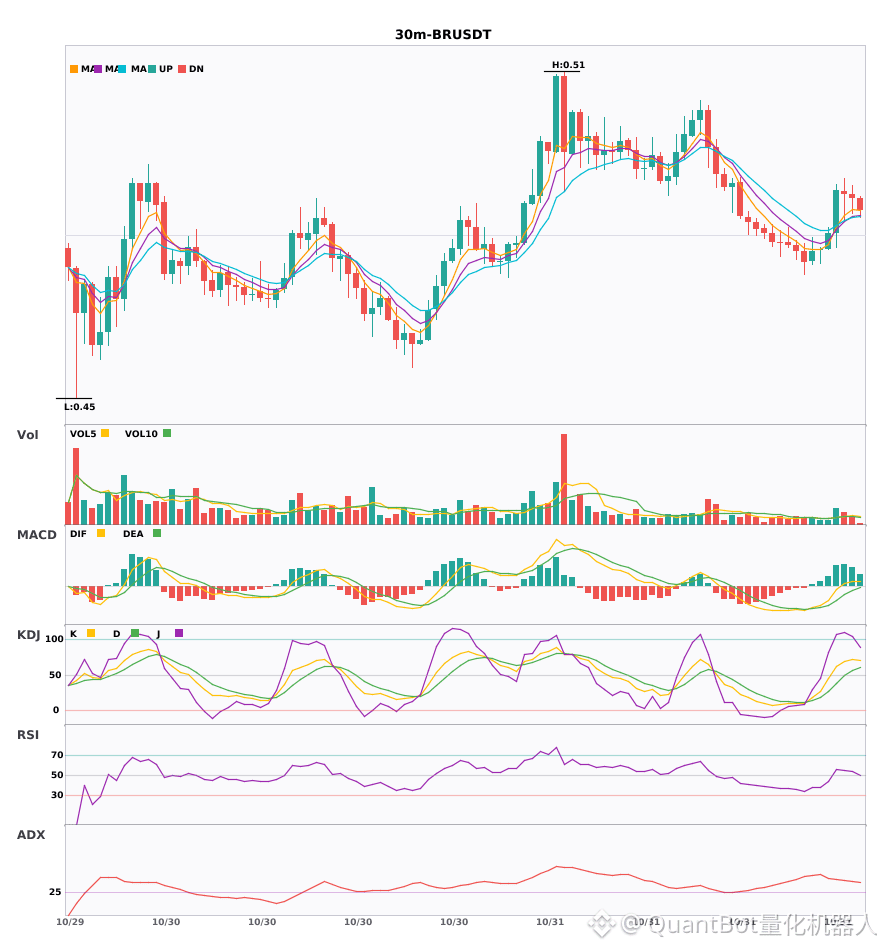
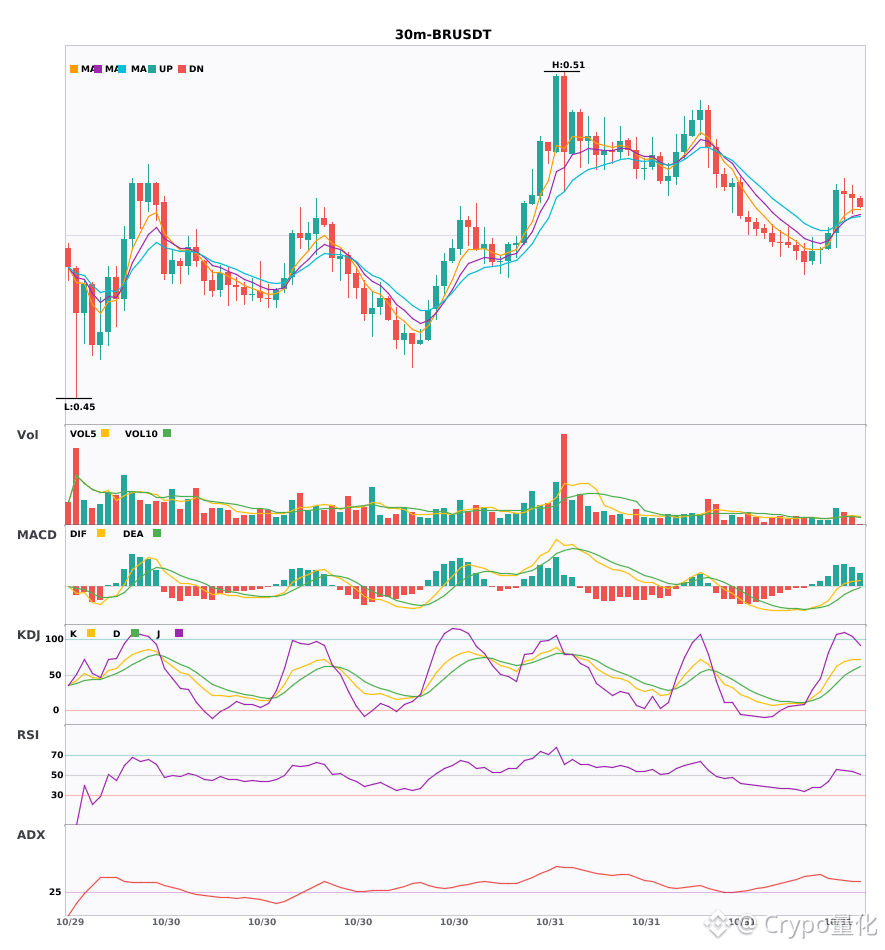
Two 30-minute bullish signals appeared simultaneously: $T / $BR
📈 $T | 30-minute bullish signal
━━━━━━━━━━━━━━━━━━
Technical analysis: ADX(31): clear trending market | MACD DIF broke above zero, trend turning bullish | EMA5 > EMA8 > EMA13: bullish alignment | KDJ showing strength, bulls in control (K at 55.0, D at 50.7) | Volume surge (4.7x)
Price change: 0.3700%
📈 $BR | 30-minute bullish signal
━━━━━━━━━━━━━━━━━━
Technical analysis: ADX(42): clear trending market | MACD DIF broke above zero, trend turning bullish | Moving averages converging and building momentum, direction about to be chosen | Volume increased (2.3x)
Price change: -0.1200%
━━━━━━━━━━━━━━━━━━
#技术分析 #T #BR
📌 The above is for reference only and does not constitute investment advice
Two 30-minute bullish signals appeared simultaneously: $T / $BR
📈 $T | 30-minute bullish signal
━━━━━━━━━━━━━━━━━━
Technical analysis: ADX(31): clear trending market | MACD DIF broke above zero, trend turning bullish | EMA5 > EMA8 > EMA13: bullish alignment | KDJ showing strength, bulls in control (K at 55.0, D at 50.7) | Volume surge (4.7x)
Price change: 0.3700%
📈 $BR | 30-minute bullish signal
━━━━━━━━━━━━━━━━━━
Technical analysis: ADX(42): clear trending market | MACD DIF broke above zero, trend turning bullish | Moving averages converging and building momentum, direction about to be chosen | Volume increased (2.3x)
Price change: -0.1200%
━━━━━━━━━━━━━━━━━━
#技术分析 #T #BR
📌 The above is for reference only and does not constitute investment advice
📈 $T | 30-minute bullish signal
━━━━━━━━━━━━━━━━━━
Technical analysis: ADX(31): clear trending market | MACD DIF broke above zero, trend turning bullish | EMA5 > EMA8 > EMA13: bullish alignment | KDJ showing strength, bulls in control (K at 55.0, D at 50.7) | Volume surge (4.7x)
Price change: 0.3700%
📈 $BR | 30-minute bullish signal
━━━━━━━━━━━━━━━━━━
Technical analysis: ADX(42): clear trending market | MACD DIF broke above zero, trend turning bullish | Moving averages converging and building momentum, direction about to be chosen | Volume increased (2.3x)
Price change: -0.1200%
━━━━━━━━━━━━━━━━━━
#技术分析 #T #BR
📌 The above is for reference only and does not constitute investment advice
31
·
--
$T / $BR 30-minute technical indicators are strengthening simultaneously. Which has greater explosive potential? 🔥
════════════════════
🔴 $T 30-minute bullish signal
⚠️Technical analysis: ADX(31) Clear trending market | MACD DIF breaks above the zero line, trend turns bullish | EMA5 > EMA8 > EMA13 bullish alignment | KDJ running strong, bulls in control (K=55.0 D=50.7) | Volume surge (4.7x)
════════════════════
🔴 $BR 30-minute bullish signal
⚠️Technical analysis: ADX(42) Clear trending market | MACD DIF breaks above the zero line, trend turns bullish | Moving averages are converging, building momentum and about to choose a direction | Volume increases (2.3x)
════════════════════
🔔 Follow for the latest market movements 🔔
#技术分析 #T #BR
📌 When trading, pay attention to whether the candlestick patterns confirm
$T / $BR 30-minute technical indicators are strengthening simultaneously. Which has greater explosive potential? 🔥
════════════════════
🔴 $T 30-minute bullish signal
⚠️Technical analysis: ADX(31) Clear trending market | MACD DIF breaks above the zero line, trend turns bullish | EMA5 > EMA8 > EMA13 bullish alignment | KDJ running strong, bulls in control (K=55.0 D=50.7) | Volume surge (4.7x)
════════════════════
🔴 $BR 30-minute bullish signal
⚠️Technical analysis: ADX(42) Clear trending market | MACD DIF breaks above the zero line, trend turns bullish | Moving averages are converging, building momentum and about to choose a direction | Volume increases (2.3x)
════════════════════
🔔 Follow for the latest market movements 🔔
#技术分析 #T #BR
📌 When trading, pay attention to whether the candlestick patterns confirm
════════════════════
🔴 $T 30-minute bullish signal
⚠️Technical analysis: ADX(31) Clear trending market | MACD DIF breaks above the zero line, trend turns bullish | EMA5 > EMA8 > EMA13 bullish alignment | KDJ running strong, bulls in control (K=55.0 D=50.7) | Volume surge (4.7x)
════════════════════
🔴 $BR 30-minute bullish signal
⚠️Technical analysis: ADX(42) Clear trending market | MACD DIF breaks above the zero line, trend turns bullish | Moving averages are converging, building momentum and about to choose a direction | Volume increases (2.3x)
════════════════════
🔔 Follow for the latest market movements 🔔
#技术分析 #T #BR
📌 When trading, pay attention to whether the candlestick patterns confirm
29
·
--
$T 24h volume is 0.3x its weekly average and most traders miss the trap
When a coin drops 4.9 percent on weak volume it means nobody cares
Look at $T trading at $0.004490 right now sitting in the middle of its daily range
The 24h volume is $1.2M while the 7 day average is triple that size
That low number tells you the drop lacks real selling pressure behind it
To check this ratio on your chart just open the volume moving average and compare today to the weekly line
Never trust a price move unless the volume matches the story
What volume filter do you use before opening a chart
#T #TradingTips
$T 24h volume is 0.3x its weekly average and most traders miss the trap
When a coin drops 4.9 percent on weak volume it means nobody cares
Look at $T trading at $0.004490 right now sitting in the middle of its daily range
The 24h volume is $1.2M while the 7 day average is triple that size
That low number tells you the drop lacks real selling pressure behind it
To check this ratio on your chart just open the volume moving average and compare today to the weekly line
Never trust a price move unless the volume matches the story
What volume filter do you use before opening a chart
#T #TradingTips
When a coin drops 4.9 percent on weak volume it means nobody cares
Look at $T trading at $0.004490 right now sitting in the middle of its daily range
The 24h volume is $1.2M while the 7 day average is triple that size
That low number tells you the drop lacks real selling pressure behind it
To check this ratio on your chart just open the volume moving average and compare today to the weekly line
Never trust a price move unless the volume matches the story
What volume filter do you use before opening a chart
#T #TradingTips
5

·
--
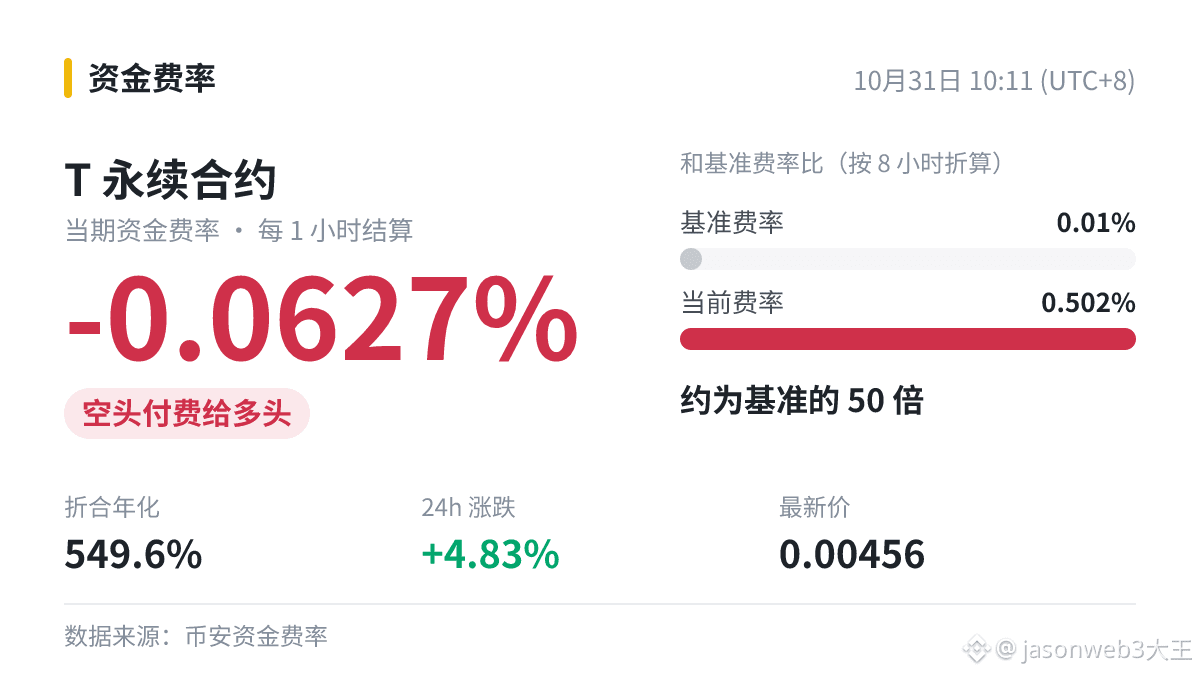
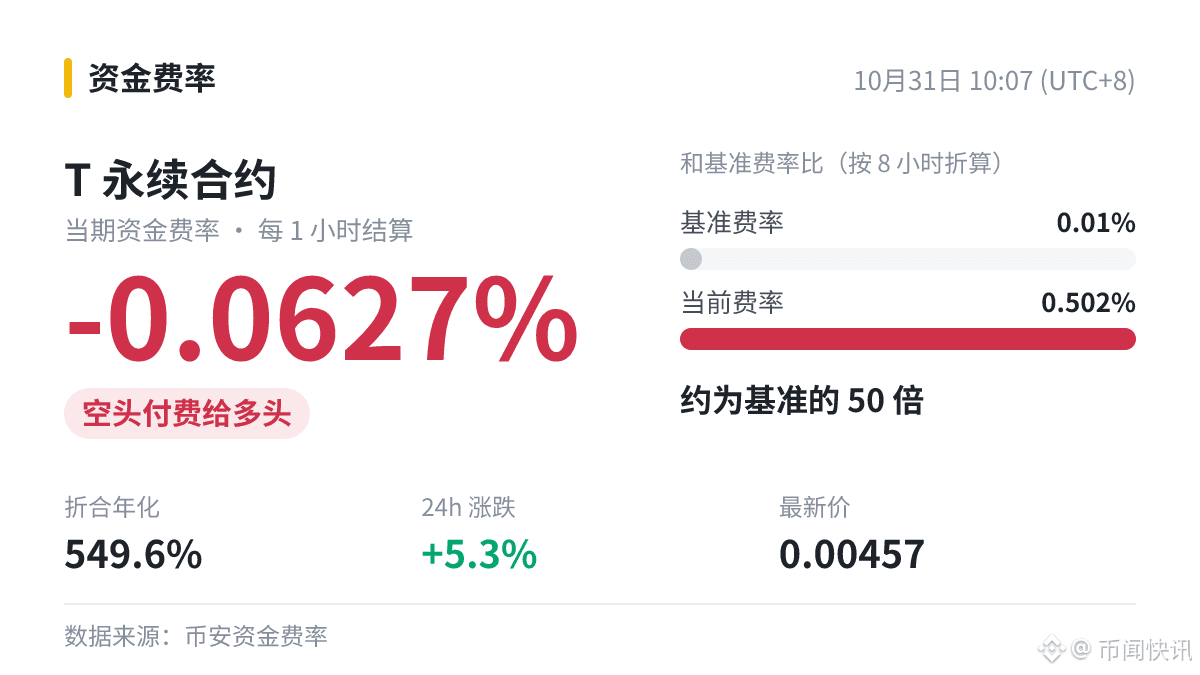
🗒️ $T Current funding rate: -0.0627% (settled every 1 hour). Shorts pay. Simply annualized based on this period, it’s approximately 549.6%.
[Glossary] What is a funding rate?
Funding fees are calculated by multiplying the notional value of a position by the rate: for a position with a notional value of 10,000 U, a rate of 0.01% means a fee of 1 U for each period.
The rate only indicates an imbalance between supply and demand in the futures market; it does not indicate the strength of spot buying.
The same reading can mean very different things under different market conditions, so don’t blindly apply a single rule of thumb.
#T
🗒️ $T Current funding rate: -0.0627% (settled every 1 hour). Shorts pay. Simply annualized based on this period, it’s approximately 549.6%.
[Glossary] What is a funding rate?
Funding fees are calculated by multiplying the notional value of a position by the rate: for a position with a notional value of 10,000 U, a rate of 0.01% means a fee of 1 U for each period.
The rate only indicates an imbalance between supply and demand in the futures market; it does not indicate the strength of spot buying.
The same reading can mean very different things under different market conditions, so don’t blindly apply a single rule of thumb.
#T
[Glossary] What is a funding rate?
Funding fees are calculated by multiplying the notional value of a position by the rate: for a position with a notional value of 10,000 U, a rate of 0.01% means a fee of 1 U for each period.
The rate only indicates an imbalance between supply and demand in the futures market; it does not indicate the strength of spot buying.
The same reading can mean very different things under different market conditions, so don’t blindly apply a single rule of thumb.
#T
51

·
--
$T Shorts are paying funding, with a rate of -0.0627% and an annualized rate of about 549.6%; 24h +4.57%.
In other words: so many people are short that they’re lining up, and the “toll” has even gone negative 🚇
No matter how large the liquidation amount is, it’s all in the past. What matters is how positions build up from here. Follow me for a few laughs while we watch the charts.
#T
$T Shorts are paying funding, with a rate of -0.0627% and an annualized rate of about 549.6%; 24h +4.57%.
In other words: so many people are short that they’re lining up, and the “toll” has even gone negative 🚇
No matter how large the liquidation amount is, it’s all in the past. What matters is how positions build up from here. Follow me for a few laughs while we watch the charts.
#T
In other words: so many people are short that they’re lining up, and the “toll” has even gone negative 🚇
No matter how large the liquidation amount is, it’s all in the past. What matters is how positions build up from here. Follow me for a few laughs while we watch the charts.
#T
48

·
--
$T Current funding rate: -0.0627% (settled every 1 hour); shorts pay.
Folks, what exactly is a funding rate? Here's the short version:
This money is settled between traders; it is not a fee charged by the exchange.
Funding rates for small-cap coins tend to fluctuate more. A high rate at one point doesn't necessarily indicate a trend, while extreme rates are less common for major coins.
Extreme readings often come with bigger price swings. In these situations, it's better to reduce your position rather than make a big bet.
#T
I may not be right, so don't take this as advice.
$T Current funding rate: -0.0627% (settled every 1 hour); shorts pay.
Folks, what exactly is a funding rate? Here's the short version:
This money is settled between traders; it is not a fee charged by the exchange.
Funding rates for small-cap coins tend to fluctuate more. A high rate at one point doesn't necessarily indicate a trend, while extreme rates are less common for major coins.
Extreme readings often come with bigger price swings. In these situations, it's better to reduce your position rather than make a big bet.
#T
I may not be right, so don't take this as advice.
Folks, what exactly is a funding rate? Here's the short version:
This money is settled between traders; it is not a fee charged by the exchange.
Funding rates for small-cap coins tend to fluctuate more. A high rate at one point doesn't necessarily indicate a trend, while extreme rates are less common for major coins.
Extreme readings often come with bigger price swings. In these situations, it's better to reduce your position rather than make a big bet.
#T
I may not be right, so don't take this as advice.
9


·
--
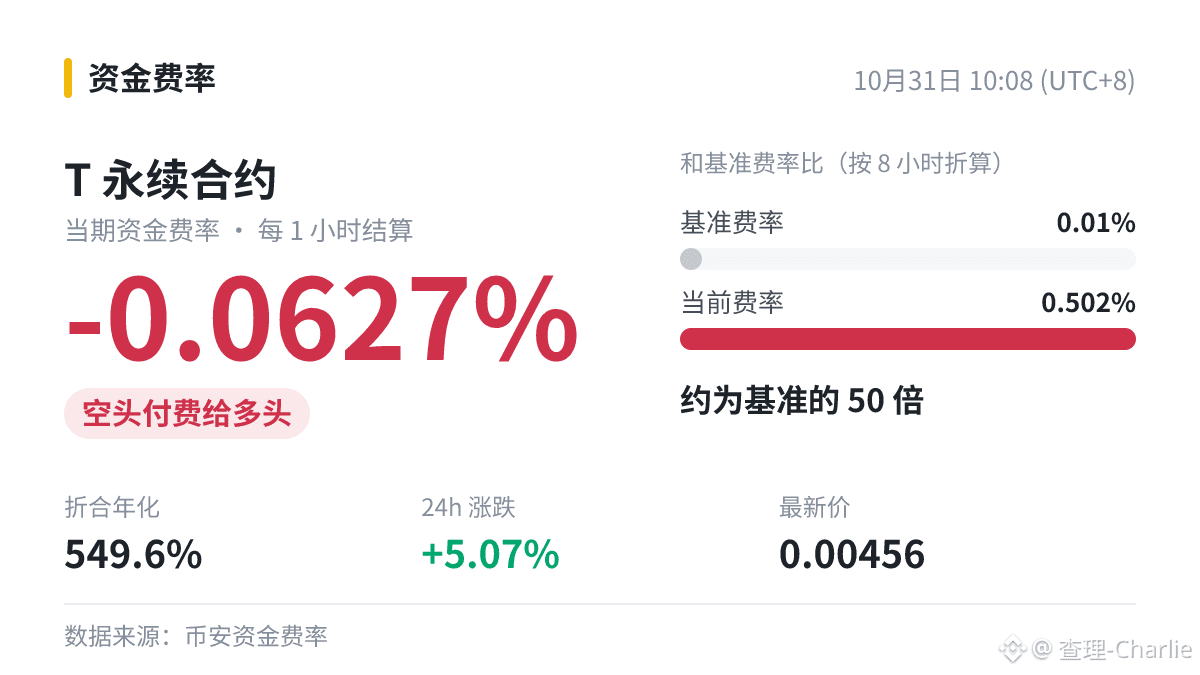
$T Funding rate: -0.0627% | Annualized: 549.6% | Current price: 0.00456
When the funding rate is extreme, opening a position in the same direction means piling into the most crowded trade. Think carefully before opening a position.
#T
$T Funding rate: -0.0627% | Annualized: 549.6% | Current price: 0.00456
When the funding rate is extreme, opening a position in the same direction means piling into the most crowded trade. Think carefully before opening a position.
#T
When the funding rate is extreme, opening a position in the same direction means piling into the most crowded trade. Think carefully before opening a position.
#T
21

·
--
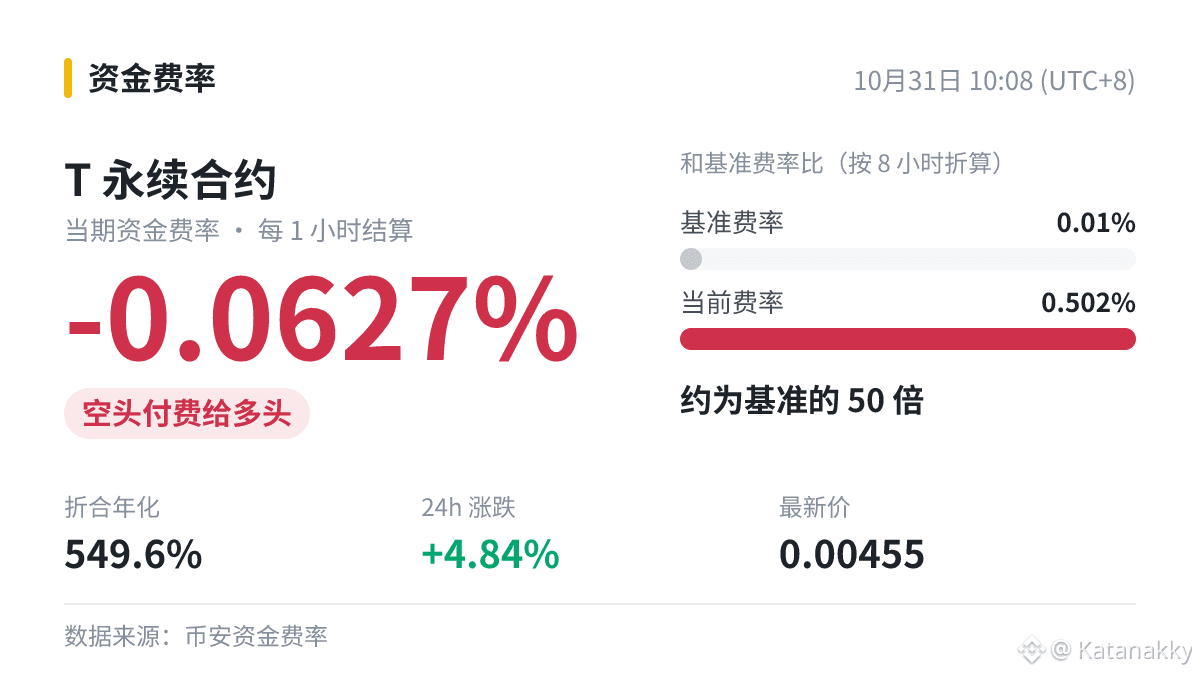
$T Shorts are paying, with a funding rate of -0.0627%.
Sentiment is picking up, but the money hasn’t followed. This kind of buzz often doesn’t last long.
#T
I can’t guarantee I’m right. Make your own decision.
$T Shorts are paying, with a funding rate of -0.0627%.
Sentiment is picking up, but the money hasn’t followed. This kind of buzz often doesn’t last long.
#T
I can’t guarantee I’m right. Make your own decision.
Sentiment is picking up, but the money hasn’t followed. This kind of buzz often doesn’t last long.
#T
I can’t guarantee I’m right. Make your own decision.
31

·
--
$T Funding rate dropped to -0.0627%🧊
Funding rates often return to normal as prices pull back. Until then, the crowded side should be more cautious with its positions. How long do you think this move can continue?
#T
$T Funding rate dropped to -0.0627%🧊
Funding rates often return to normal as prices pull back. Until then, the crowded side should be more cautious with its positions. How long do you think this move can continue?
#T
Funding rates often return to normal as prices pull back. Until then, the crowded side should be more cautious with its positions. How long do you think this move can continue?
#T
53

·
--
Don't scroll away—this unusual move may be related to your positions!
$T Funding rate: -0.0627% (shorts pay, approximately 549.6% annualized)!
No matter how wild the market gets, set your stop-loss first.
#T
Don't scroll away—this unusual move may be related to your positions!
$T Funding rate: -0.0627% (shorts pay, approximately 549.6% annualized)!
No matter how wild the market gets, set your stop-loss first.
#T
$T Funding rate: -0.0627% (shorts pay, approximately 549.6% annualized)!
No matter how wild the market gets, set your stop-loss first.
#T
15
Log in to explore more content
Join global crypto users on Binance Square
⚡️ Get latest and useful information about crypto.
💬 Trusted by the world’s largest crypto exchange.
👍 Discover real insights from verified creators.
Email / Phone number
Trending Topics
1
#CPITestsDecemberRateOutlook
0 views
3 Discussing
2
#BitcoinRebounds$75KAsChipsLead
15,144 views
183 Discussing
3
#JobsReportRaisesHikeOdds
173,953 views
1,476 Discussing
4
#US Data Center Rules May Constrain AI Expansion
27,626 views
136 Discussing
5
#WillAnthropicListOnTime
38,685 views
517 Discussing
6
#BitcoinETFsSee$412MNetOutflows
141 views
30 Discussing
7
#HKSFCPlansToRestrictCryptoAndExchangeTerms
2,736 views
100 Discussing
8
#AnthropicStillPlansPreThanksgivingIPO
12,877 views
184 Discussing
9
#FinCENAndFedWithdraw$250CryptoTransferProposal
3,890 views
13 Discussing
10
#TradFiForBeginners
26,413 views
435 Discussing