
#pildorasbinance
pildorasbinance
1,616 views
26 Discussing
Hot
Latest

·
--
#PildorasCrypto10 and #pildorasBinance
YOU DECIDE?
Tomorrow, our #PildorasBinance No. 7 arrives, and I want you to choose what we're going to learn.
What topic would you like us to talk about?
1️⃣ RSI and MACD indicators
2️⃣ Support and resistance
3️⃣ Risk management in trading
4️⃣ How to identify whale movements
5️⃣ Trading psychology
Leave your number in the comments! The most-voted topic will be the focus of our next bite-sized lesson.
Here, we learn and grow together!
#BinaceSquare
#PildorasCrypto10
@CriptoMaster007
@SpaceandTimeDB
#PildorasCrypto10 and #pildorasBinance
YOU DECIDE?
Tomorrow, our #PildorasBinance No. 7 arrives, and I want you to choose what we're going to learn.
What topic would you like us to talk about?
1️⃣ RSI and MACD indicators
2️⃣ Support and resistance
3️⃣ Risk management in trading
4️⃣ How to identify whale movements
5️⃣ Trading psychology
Leave your number in the comments! The most-voted topic will be the focus of our next bite-sized lesson.
Here, we learn and grow together!
#BinaceSquare
#PildorasCrypto10
@CriptoMaster007
@SpaceandTime
YOU DECIDE?
Tomorrow, our #PildorasBinance No. 7 arrives, and I want you to choose what we're going to learn.
What topic would you like us to talk about?
1️⃣ RSI and MACD indicators
2️⃣ Support and resistance
3️⃣ Risk management in trading
4️⃣ How to identify whale movements
5️⃣ Trading psychology
Leave your number in the comments! The most-voted topic will be the focus of our next bite-sized lesson.
Here, we learn and grow together!
#BinaceSquare
#PildorasCrypto10
@CriptoMaster007
@SpaceandTime
1
89
·
--
#PildorasCrypto10 and #pildorasBinance
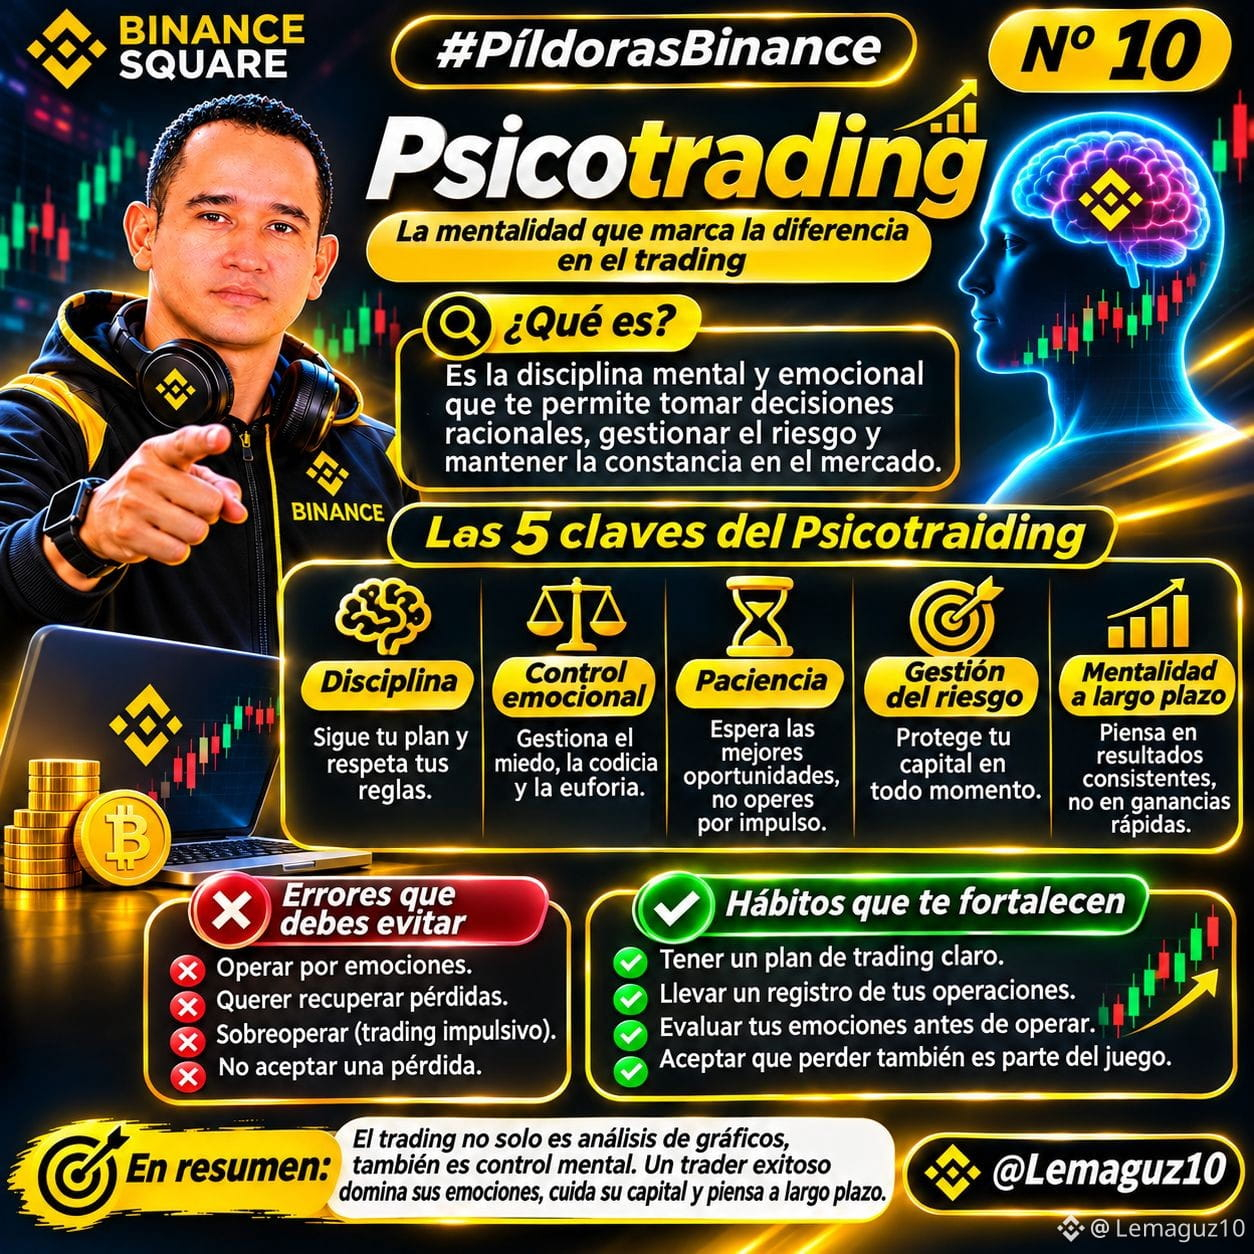
PSYCHOTRADING
YOUR BIGGEST ENEMY IN TRADING ISN'T ALWAYS THE MARKET, BUT YOUR OWN EMOTIONS.
Welcome to a new installment of #PildorasBinance.
Today we'll learn about PSYCHOTRADING, an essential tool for developing discipline, patience, and self-control when trading cryptocurrencies.
WHAT IS PSYCHOTRADING?
It's the study and management of the emotions, thoughts, and behaviors that influence our financial decisions.
A disciplined trader doesn't need to be right every time. They need to make decisions based on a strategy, not on impulse.
5 EMOTIONS AND BEHAVIORS YOU NEED TO LEARN TO CONTROL:
1. FEAR: It can make you close trades too soon or miss opportunities that fit your strategy.
2. GREED: Chasing excessive profits can lead you to take unnecessary risks.
3. FOMO: The fear of missing out on an opportunity can drive you to buy when the price has already risen too much.
4. REVENGE TRADING: Trying to quickly recover a loss can lead to impulsive decisions and further losses.
5. OVERCONFIDENCE: A winning streak doesn't mean the market will always be in your favor.
HOW CAN YOU STRENGTHEN YOUR PSYCHOLOGY AS A TRADER?
✅ Create a plan before you trade.
✅ Set your Stop Loss and Take Profit.
✅ Stick to your risk management plan.
✅ Learn to accept losses.
✅ Avoid trading when stressed or anxious.
✅ Keep a trading journal to analyze your decisions.
You can't control the market, but you can control your decisions.
Patience, discipline, and emotional management are just as important as technical analysis.
Which emotion has caused you to make the most trading mistakes?
A. Fear
B. Greed
C. FOMO
D. Wanting to recover losses
Share your experience in the comments! Let's learn together how to develop a more disciplined mindset.
Remember: before mastering the market, learn to master your decisions.
#PildorasBinance
#PsicologiaDelTrading
@99PARAGUAYO
@CriptoMaster007
@iQ-Star
#PildorasCrypto10 and #pildorasBinance
PSYCHOTRADING
YOUR BIGGEST ENEMY IN TRADING ISN'T ALWAYS THE MARKET, BUT YOUR OWN EMOTIONS.
Welcome to a new installment of #PildorasBinance.
Today we'll learn about PSYCHOTRADING, an essential tool for developing discipline, patience, and self-control when trading cryptocurrencies.
WHAT IS PSYCHOTRADING?
It's the study and management of the emotions, thoughts, and behaviors that influence our financial decisions.
A disciplined trader doesn't need to be right every time. They need to make decisions based on a strategy, not on impulse.
5 EMOTIONS AND BEHAVIORS YOU NEED TO LEARN TO CONTROL:
1. FEAR: It can make you close trades too soon or miss opportunities that fit your strategy.
2. GREED: Chasing excessive profits can lead you to take unnecessary risks.
3. FOMO: The fear of missing out on an opportunity can drive you to buy when the price has already risen too much.
4. REVENGE TRADING: Trying to quickly recover a loss can lead to impulsive decisions and further losses.
5. OVERCONFIDENCE: A winning streak doesn't mean the market will always be in your favor.
HOW CAN YOU STRENGTHEN YOUR PSYCHOLOGY AS A TRADER?
✅ Create a plan before you trade.
✅ Set your Stop Loss and Take Profit.
✅ Stick to your risk management plan.
✅ Learn to accept losses.
✅ Avoid trading when stressed or anxious.
✅ Keep a trading journal to analyze your decisions.
You can't control the market, but you can control your decisions.
Patience, discipline, and emotional management are just as important as technical analysis.
Which emotion has caused you to make the most trading mistakes?
A. Fear
B. Greed
C. FOMO
D. Wanting to recover losses
Share your experience in the comments! Let's learn together how to develop a more disciplined mindset.
Remember: before mastering the market, learn to master your decisions.
#PildorasBinance
#PsicologiaDelTrading
@99PARAGUAYO
@CriptoMaster007
@SpaceTime Anylise
PSYCHOTRADING
YOUR BIGGEST ENEMY IN TRADING ISN'T ALWAYS THE MARKET, BUT YOUR OWN EMOTIONS.
Welcome to a new installment of #PildorasBinance.
Today we'll learn about PSYCHOTRADING, an essential tool for developing discipline, patience, and self-control when trading cryptocurrencies.
WHAT IS PSYCHOTRADING?
It's the study and management of the emotions, thoughts, and behaviors that influence our financial decisions.
A disciplined trader doesn't need to be right every time. They need to make decisions based on a strategy, not on impulse.
5 EMOTIONS AND BEHAVIORS YOU NEED TO LEARN TO CONTROL:
1. FEAR: It can make you close trades too soon or miss opportunities that fit your strategy.
2. GREED: Chasing excessive profits can lead you to take unnecessary risks.
3. FOMO: The fear of missing out on an opportunity can drive you to buy when the price has already risen too much.
4. REVENGE TRADING: Trying to quickly recover a loss can lead to impulsive decisions and further losses.
5. OVERCONFIDENCE: A winning streak doesn't mean the market will always be in your favor.
HOW CAN YOU STRENGTHEN YOUR PSYCHOLOGY AS A TRADER?
✅ Create a plan before you trade.
✅ Set your Stop Loss and Take Profit.
✅ Stick to your risk management plan.
✅ Learn to accept losses.
✅ Avoid trading when stressed or anxious.
✅ Keep a trading journal to analyze your decisions.
You can't control the market, but you can control your decisions.
Patience, discipline, and emotional management are just as important as technical analysis.
Which emotion has caused you to make the most trading mistakes?
A. Fear
B. Greed
C. FOMO
D. Wanting to recover losses
Share your experience in the comments! Let's learn together how to develop a more disciplined mindset.
Remember: before mastering the market, learn to master your decisions.
#PildorasBinance
#PsicologiaDelTrading
@99PARAGUAYO
@CriptoMaster007
@SpaceTime Anylise
1
74
·
--
#PildorasCrypto10
HODL: IS PATIENCE THE SECRET?
Did you know that not all investors want to buy and sell cryptocurrencies every day?
In the crypto world, there’s a strategy known as HODL.
WHAT DOES HODL MEAN?
The term originated from a typo of HOLD in a Bitcoin forum in 2013.
Today, it’s used to describe the decision to hold on to cryptocurrencies for long periods, even when the market experiences major swings.
3 LESSONS YOU SHOULD KNOW
1. Patience matters: not every fluctuation requires an immediate decision.
2. Research is essential: holding an asset for years doesn’t guarantee gains. Its project and risks should be evaluated periodically.
3. Having a strategy is essential: define your goals, understand volatility, and avoid investing money you need for your expenses.
EDUCATIONAL EXAMPLE
Imagine you buy a cryptocurrency for $100.
If it drops to $70, your investment loses 30% of its value.
If it later rises to $130, you would have a 30% gain compared to the purchase price, before fees.
But it could also keep falling and never recover its initial price.
HODL doesn’t mean always making a profit. It means holding a position according to a strategy, while accepting its risks.
“Patience can be valuable, but it should never replace knowledge.
If you had to choose a strategy, which one would you study first?
🅰️ Long-term HODL.
🅱️ Short-term trading.
🅲 A combination of both.
Comment A, B, or C and explain your choice.
Educational content; this does not constitute financial advice.
One daily bite, one new insight.
#PildorasBinance
#BinanceSquare
#HODL
@CriptoMaster007
@Binance_Labs
@usualmoney
#PildorasCrypto10
HODL: IS PATIENCE THE SECRET?
Did you know that not all investors want to buy and sell cryptocurrencies every day?
In the crypto world, there’s a strategy known as HODL.
WHAT DOES HODL MEAN?
The term originated from a typo of HOLD in a Bitcoin forum in 2013.
Today, it’s used to describe the decision to hold on to cryptocurrencies for long periods, even when the market experiences major swings.
3 LESSONS YOU SHOULD KNOW
1. Patience matters: not every fluctuation requires an immediate decision.
2. Research is essential: holding an asset for years doesn’t guarantee gains. Its project and risks should be evaluated periodically.
3. Having a strategy is essential: define your goals, understand volatility, and avoid investing money you need for your expenses.
EDUCATIONAL EXAMPLE
Imagine you buy a cryptocurrency for $100.
If it drops to $70, your investment loses 30% of its value.
If it later rises to $130, you would have a 30% gain compared to the purchase price, before fees.
But it could also keep falling and never recover its initial price.
HODL doesn’t mean always making a profit. It means holding a position according to a strategy, while accepting its risks.
“Patience can be valuable, but it should never replace knowledge.
If you had to choose a strategy, which one would you study first?
🅰️ Long-term HODL.
🅱️ Short-term trading.
🅲 A combination of both.
Comment A, B, or C and explain your choice.
Educational content; this does not constitute financial advice.
One daily bite, one new insight.
#PildorasBinance
#BinanceSquare
#HODL
@CriptoMaster007
@Binance Labs
@Usual Official
HODL: IS PATIENCE THE SECRET?
Did you know that not all investors want to buy and sell cryptocurrencies every day?
In the crypto world, there’s a strategy known as HODL.
WHAT DOES HODL MEAN?
The term originated from a typo of HOLD in a Bitcoin forum in 2013.
Today, it’s used to describe the decision to hold on to cryptocurrencies for long periods, even when the market experiences major swings.
3 LESSONS YOU SHOULD KNOW
1. Patience matters: not every fluctuation requires an immediate decision.
2. Research is essential: holding an asset for years doesn’t guarantee gains. Its project and risks should be evaluated periodically.
3. Having a strategy is essential: define your goals, understand volatility, and avoid investing money you need for your expenses.
EDUCATIONAL EXAMPLE
Imagine you buy a cryptocurrency for $100.
If it drops to $70, your investment loses 30% of its value.
If it later rises to $130, you would have a 30% gain compared to the purchase price, before fees.
But it could also keep falling and never recover its initial price.
HODL doesn’t mean always making a profit. It means holding a position according to a strategy, while accepting its risks.
“Patience can be valuable, but it should never replace knowledge.
If you had to choose a strategy, which one would you study first?
🅰️ Long-term HODL.
🅱️ Short-term trading.
🅲 A combination of both.
Comment A, B, or C and explain your choice.
Educational content; this does not constitute financial advice.
One daily bite, one new insight.
#PildorasBinance
#BinanceSquare
#HODL
@CriptoMaster007
@Binance Labs
@Usual Official

1
2
113
·
--
#PildorasCrypto10 y #pildorasBinance
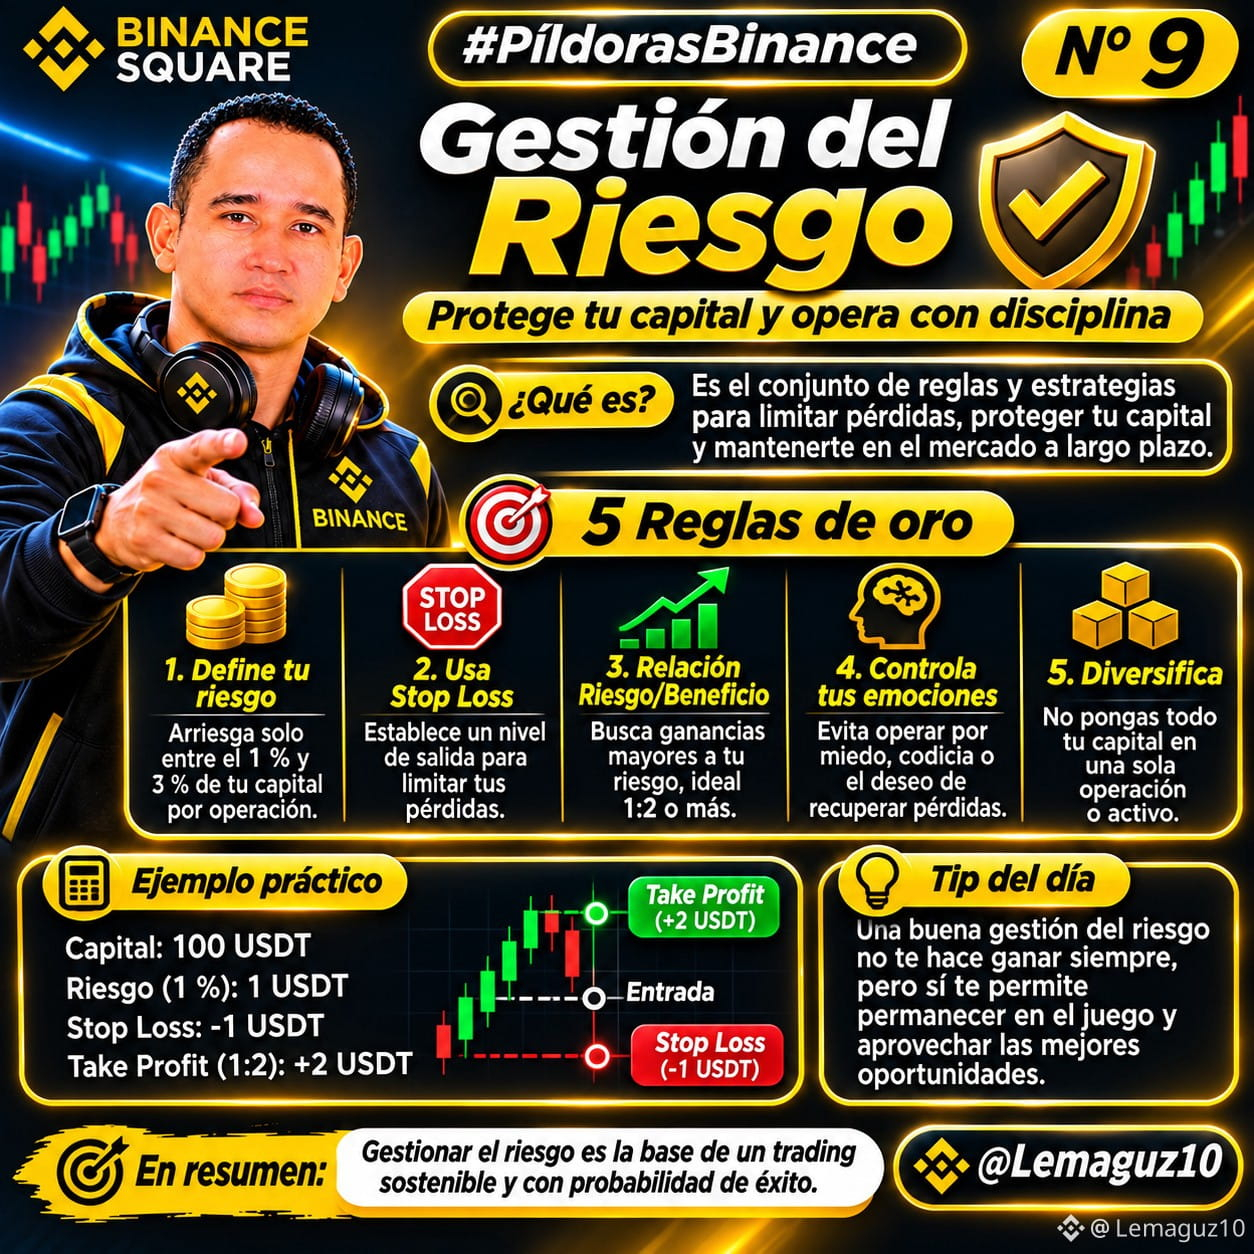
RISK MANAGEMENT.
In trading, success doesn’t go to those who take the biggest risks, but to those who best protect their capital.
Today, we’ll learn about one of the fundamental pillars of trading in the cryptocurrency market: RISK MANAGEMENT.
What is risk management?
It’s a set of strategies that allow us to control potential losses, protect our capital, and make more responsible decisions when trading.
5 GOLDEN RULES EVERY TRADER SHOULD KNOW:
✅ Define how much you’re willing to lose: Some traders use a guideline of risking between 1% and 2% of their capital per trade.
✅Use Stop Loss: Set an exit level in advance to limit losses. Remember that the execution price may vary.
✅Apply the risk-reward ratio: A 1:2 ratio means aiming to make 2 USDT for every 1 USDT risked.
✅Control your emotions: Don’t let fear, greed, or the desire to recover losses control your decisions.
✅Diversify your capital: Avoid concentrating all your money in a single trade or cryptocurrency.
PRACTICAL EXAMPLE:
Available capital: 100 USDT
1. Planned risk (1%): 1 USDT
2. Maximum anticipated loss: 1 USDT
3. Target profit (1:2): 2 USDT
Educational example, excluding fees and slippage.
THE MOST IMPORTANT LESSON:
You don’t need to win every trade to achieve positive results. The key is to manage your losses, stay disciplined, and follow a strategy that makes sense in the long term.
No strategy guarantees profits, and there is always a risk of losing capital.
What do you consider most important in trading?
1. Making higher profits.
2. Protecting your capital and controlling losses.
Learn today, protect your capital, and make better decisions tomorrow.
#BinaneSquare
#GestionDelRiesgo
#EducacionFinanciera
@99PARAGUAYO
@CriptoMaster007
#PildorasCrypto10 y #pildorasBinance
RISK MANAGEMENT.
In trading, success doesn’t go to those who take the biggest risks, but to those who best protect their capital.
Today, we’ll learn about one of the fundamental pillars of trading in the cryptocurrency market: RISK MANAGEMENT.
What is risk management?
It’s a set of strategies that allow us to control potential losses, protect our capital, and make more responsible decisions when trading.
5 GOLDEN RULES EVERY TRADER SHOULD KNOW:
✅ Define how much you’re willing to lose: Some traders use a guideline of risking between 1% and 2% of their capital per trade.
✅Use Stop Loss: Set an exit level in advance to limit losses. Remember that the execution price may vary.
✅Apply the risk-reward ratio: A 1:2 ratio means aiming to make 2 USDT for every 1 USDT risked.
✅Control your emotions: Don’t let fear, greed, or the desire to recover losses control your decisions.
✅Diversify your capital: Avoid concentrating all your money in a single trade or cryptocurrency.
PRACTICAL EXAMPLE:
Available capital: 100 USDT
1. Planned risk (1%): 1 USDT
2. Maximum anticipated loss: 1 USDT
3. Target profit (1:2): 2 USDT
Educational example, excluding fees and slippage.
THE MOST IMPORTANT LESSON:
You don’t need to win every trade to achieve positive results. The key is to manage your losses, stay disciplined, and follow a strategy that makes sense in the long term.
No strategy guarantees profits, and there is always a risk of losing capital.
What do you consider most important in trading?
1. Making higher profits.
2. Protecting your capital and controlling losses.
Learn today, protect your capital, and make better decisions tomorrow.
#BinaneSquare
#GestionDelRiesgo
#EducacionFinanciera
@99PARAGUAYO
@CriptoMaster007
RISK MANAGEMENT.
In trading, success doesn’t go to those who take the biggest risks, but to those who best protect their capital.
Today, we’ll learn about one of the fundamental pillars of trading in the cryptocurrency market: RISK MANAGEMENT.
What is risk management?
It’s a set of strategies that allow us to control potential losses, protect our capital, and make more responsible decisions when trading.
5 GOLDEN RULES EVERY TRADER SHOULD KNOW:
✅ Define how much you’re willing to lose: Some traders use a guideline of risking between 1% and 2% of their capital per trade.
✅Use Stop Loss: Set an exit level in advance to limit losses. Remember that the execution price may vary.
✅Apply the risk-reward ratio: A 1:2 ratio means aiming to make 2 USDT for every 1 USDT risked.
✅Control your emotions: Don’t let fear, greed, or the desire to recover losses control your decisions.
✅Diversify your capital: Avoid concentrating all your money in a single trade or cryptocurrency.
PRACTICAL EXAMPLE:
Available capital: 100 USDT
1. Planned risk (1%): 1 USDT
2. Maximum anticipated loss: 1 USDT
3. Target profit (1:2): 2 USDT
Educational example, excluding fees and slippage.
THE MOST IMPORTANT LESSON:
You don’t need to win every trade to achieve positive results. The key is to manage your losses, stay disciplined, and follow a strategy that makes sense in the long term.
No strategy guarantees profits, and there is always a risk of losing capital.
What do you consider most important in trading?
1. Making higher profits.
2. Protecting your capital and controlling losses.
Learn today, protect your capital, and make better decisions tomorrow.
#BinaneSquare
#GestionDelRiesgo
#EducacionFinanciera
@99PARAGUAYO
@CriptoMaster007
1
91
·
--
#PildorasCrypto10 y #BitcoinActiveSupplyInProfitDropsBelow45%
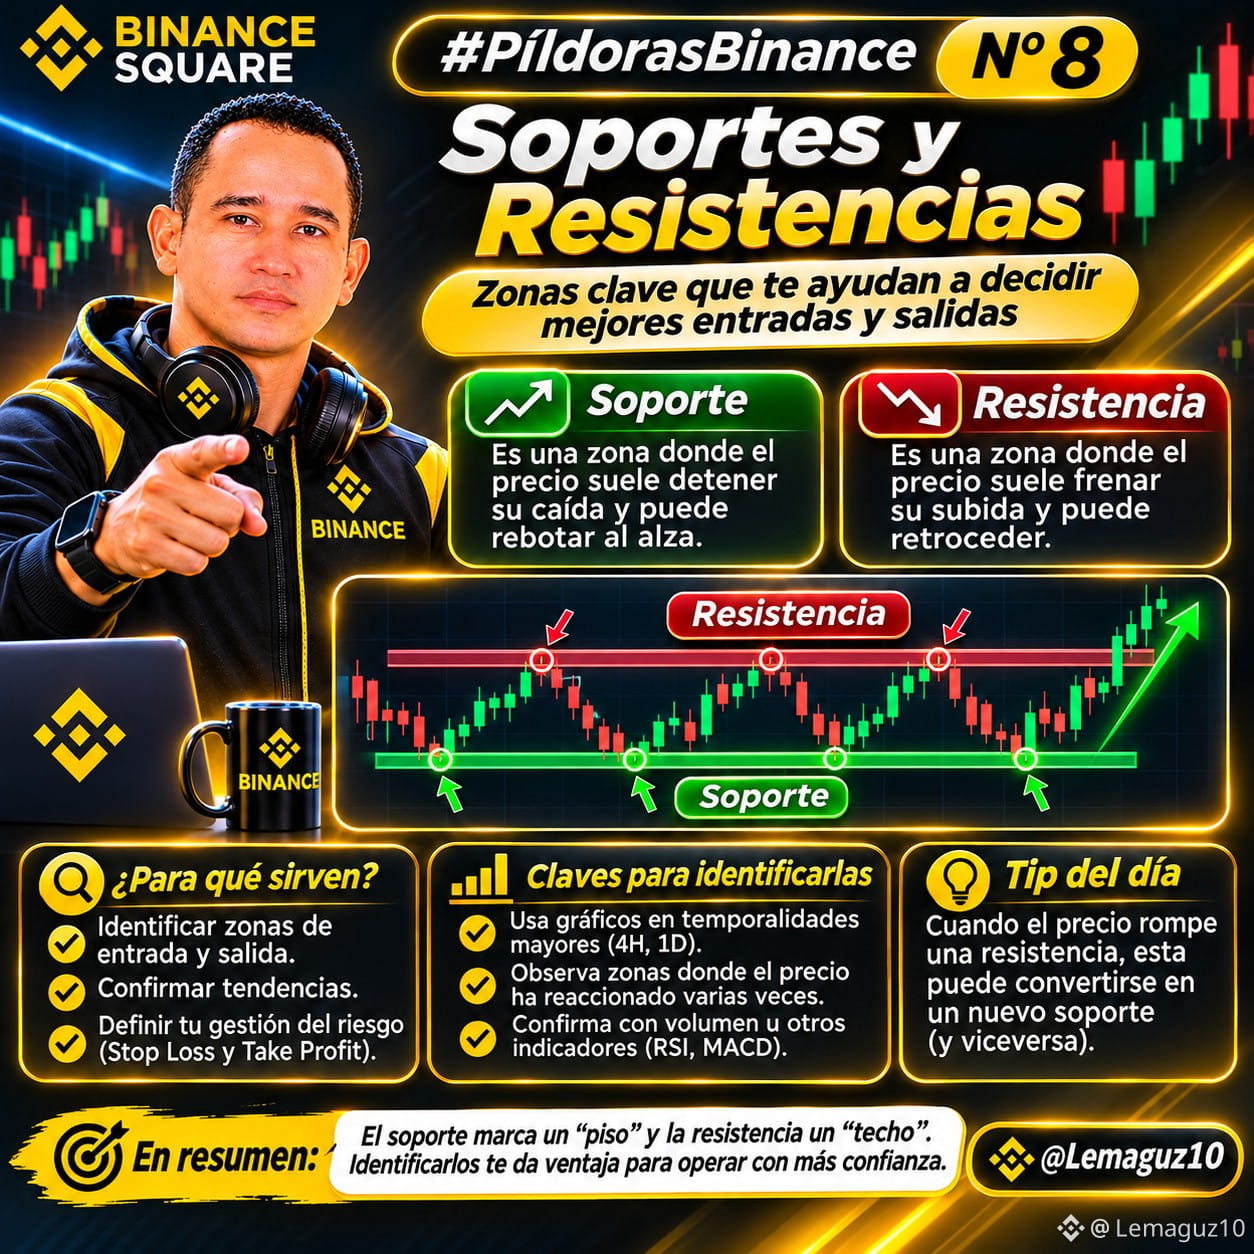
SUPPORTS AND RESISTANCE: LEARN TO READ PRICE MOVEMENTS.
Did you know that the price of Bitcoin and other cryptocurrencies tends to react in certain market zones?
Understanding support and resistance can help you interpret charts better and avoid impulsive decisions.
1. WHAT IS SUPPORT?
It’s a zone where buying pressure may be strong enough to halt a decline.
When the price reaches support, it may bounce back.
If it breaks through with force, it could continue falling.
2. WHAT IS RESISTANCE?
It’s a zone where selling pressure may make it difficult for the price to keep rising.
When the price reaches resistance, it may pull back.
If it manages to break through on high volume, it could continue its upward trend.
PRACTICAL EXAMPLE WITH BITCOIN
Imagine BTC is trading at US$65,000:
🟢 Hypothetical support: US$62,000.
🔴 Hypothetical resistance: US$68,000.
If BTC rises above US$68,000 and confirms the breakout, it could show greater bullish strength.
If it falls below US$62,000, selling pressure could increase.
These levels are illustrative and do not reflect an up-to-date chart analysis.
Don’t mistake a breakout for a definitive signal.
Before making decisions, look at:
✅ Trading volume.
✅ Breakout confirmation.
✅ Japanese candlestick behavior.
✅ RSI and MACD indicators.
✅ Risk management.
REMEMBER: Support and resistance are zones of probability, not barriers that the price will always respect.
Educational content. This is not financial advice.
#CryptoSelloffTriggersMultipleWhaleLiquidations
#PildorasBinance
#SoportesYResistencias
@CriptoMaster007
@99PARAGUAYO
#PildorasCrypto10 y #BitcoinActiveSupplyInProfitDropsBelow45%
SUPPORTS AND RESISTANCE: LEARN TO READ PRICE MOVEMENTS.
Did you know that the price of Bitcoin and other cryptocurrencies tends to react in certain market zones?
Understanding support and resistance can help you interpret charts better and avoid impulsive decisions.
1. WHAT IS SUPPORT?
It’s a zone where buying pressure may be strong enough to halt a decline.
When the price reaches support, it may bounce back.
If it breaks through with force, it could continue falling.
2. WHAT IS RESISTANCE?
It’s a zone where selling pressure may make it difficult for the price to keep rising.
When the price reaches resistance, it may pull back.
If it manages to break through on high volume, it could continue its upward trend.
PRACTICAL EXAMPLE WITH BITCOIN
Imagine BTC is trading at US$65,000:
🟢 Hypothetical support: US$62,000.
🔴 Hypothetical resistance: US$68,000.
If BTC rises above US$68,000 and confirms the breakout, it could show greater bullish strength.
If it falls below US$62,000, selling pressure could increase.
These levels are illustrative and do not reflect an up-to-date chart analysis.
Don’t mistake a breakout for a definitive signal.
Before making decisions, look at:
✅ Trading volume.
✅ Breakout confirmation.
✅ Japanese candlestick behavior.
✅ RSI and MACD indicators.
✅ Risk management.
REMEMBER: Support and resistance are zones of probability, not barriers that the price will always respect.
Educational content. This is not financial advice.
#CryptoSelloffTriggersMultipleWhaleLiquidations
#PildorasBinance
#SoportesYResistencias
@CriptoMaster007
@99PARAGUAYO
SUPPORTS AND RESISTANCE: LEARN TO READ PRICE MOVEMENTS.
Did you know that the price of Bitcoin and other cryptocurrencies tends to react in certain market zones?
Understanding support and resistance can help you interpret charts better and avoid impulsive decisions.
1. WHAT IS SUPPORT?
It’s a zone where buying pressure may be strong enough to halt a decline.
When the price reaches support, it may bounce back.
If it breaks through with force, it could continue falling.
2. WHAT IS RESISTANCE?
It’s a zone where selling pressure may make it difficult for the price to keep rising.
When the price reaches resistance, it may pull back.
If it manages to break through on high volume, it could continue its upward trend.
PRACTICAL EXAMPLE WITH BITCOIN
Imagine BTC is trading at US$65,000:
🟢 Hypothetical support: US$62,000.
🔴 Hypothetical resistance: US$68,000.
If BTC rises above US$68,000 and confirms the breakout, it could show greater bullish strength.
If it falls below US$62,000, selling pressure could increase.
These levels are illustrative and do not reflect an up-to-date chart analysis.
Don’t mistake a breakout for a definitive signal.
Before making decisions, look at:
✅ Trading volume.
✅ Breakout confirmation.
✅ Japanese candlestick behavior.
✅ RSI and MACD indicators.
✅ Risk management.
REMEMBER: Support and resistance are zones of probability, not barriers that the price will always respect.
Educational content. This is not financial advice.
#CryptoSelloffTriggersMultipleWhaleLiquidations
#PildorasBinance
#SoportesYResistencias
@CriptoMaster007
@99PARAGUAYO
2
113
·
--
#SXT and @SpaceandTimeDB Space and Time (SXT): the artificial intelligence revolution and financial privacy are already underway
During Digital Asset Summit London 2026, Nate Holiday, co-founder of Space and Time, highlighted a challenge for financial institutions: harnessing artificial intelligence without compromising data privacy.
What does Space and Time propose?
✅ Verify results using cryptographic proofs (ZK).
✅ Protect confidential financial information.
✅ Integrate artificial intelligence into existing business systems.
✅ Advance verifiable data applications for AI, DeFi, and tokenization.
With Space and Time Enterprise, companies can run SQL queries and generate verifiable proofs without revealing their private records.
What does this mean for $SXT?
These innovations could drive new use cases and institutional adoption opportunities, although their development does not guarantee an increase in the token's price.
The future of blockchain lies not only in cryptocurrencies, but also in data trust and security.
Do you think Space and Time (SXT) could become an important infrastructure for artificial intelligence and finance?
Educational content. Not financial advice.
#SXT
#SpaceAndTime
#PildorasBinance
@SpaceandTimeDB
#SXT and @SpaceandTime Space and Time (SXT): the artificial intelligence revolution and financial privacy are already underway
During Digital Asset Summit London 2026, Nate Holiday, co-founder of Space and Time, highlighted a challenge for financial institutions: harnessing artificial intelligence without compromising data privacy.
What does Space and Time propose?
✅ Verify results using cryptographic proofs (ZK).
✅ Protect confidential financial information.
✅ Integrate artificial intelligence into existing business systems.
✅ Advance verifiable data applications for AI, DeFi, and tokenization.
With Space and Time Enterprise, companies can run SQL queries and generate verifiable proofs without revealing their private records.
What does this mean for $SXT?
These innovations could drive new use cases and institutional adoption opportunities, although their development does not guarantee an increase in the token's price.
The future of blockchain lies not only in cryptocurrencies, but also in data trust and security.
Do you think Space and Time (SXT) could become an important infrastructure for artificial intelligence and finance?
Educational content. Not financial advice.
#SXT
#SpaceAndTime
#PildorasBinance
@SpaceandTime
During Digital Asset Summit London 2026, Nate Holiday, co-founder of Space and Time, highlighted a challenge for financial institutions: harnessing artificial intelligence without compromising data privacy.
What does Space and Time propose?
✅ Verify results using cryptographic proofs (ZK).
✅ Protect confidential financial information.
✅ Integrate artificial intelligence into existing business systems.
✅ Advance verifiable data applications for AI, DeFi, and tokenization.
With Space and Time Enterprise, companies can run SQL queries and generate verifiable proofs without revealing their private records.
What does this mean for $SXT?
These innovations could drive new use cases and institutional adoption opportunities, although their development does not guarantee an increase in the token's price.
The future of blockchain lies not only in cryptocurrencies, but also in data trust and security.
Do you think Space and Time (SXT) could become an important infrastructure for artificial intelligence and finance?
Educational content. Not financial advice.
#SXT
#SpaceAndTime
#PildorasBinance
@SpaceandTime
1
395
·
--
#PildorasCrypto10 y #pildorasBinance
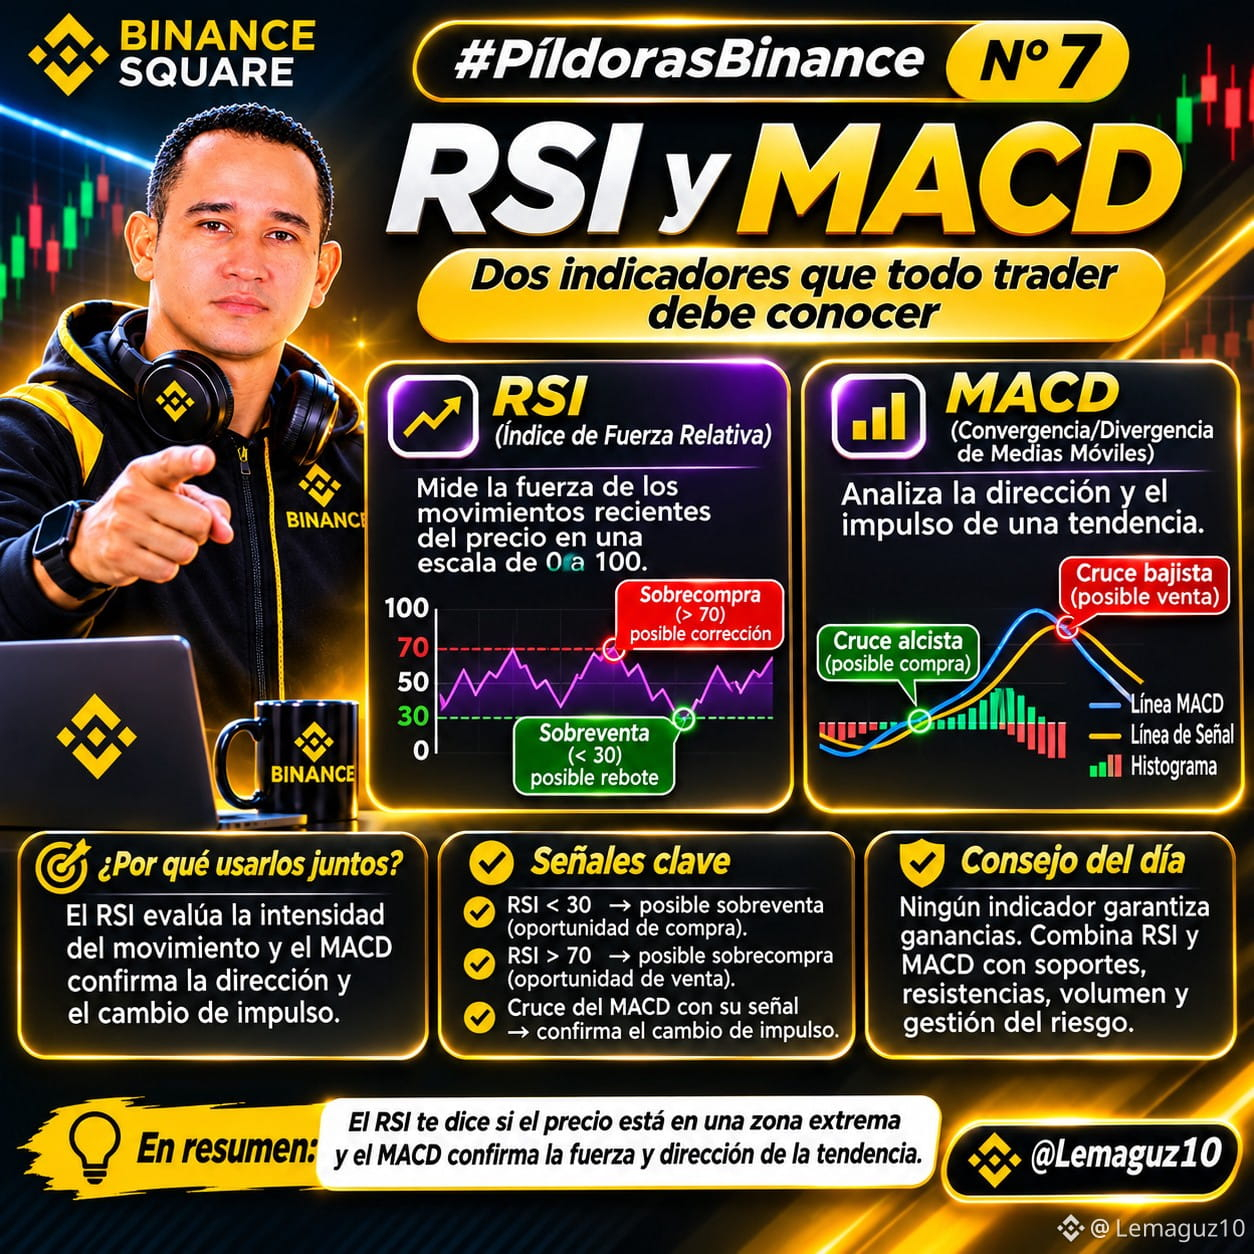
RSI AND MACD: LEARN TO READ THE MARKET!
Did you know there are indicators that can help you identify a cryptocurrency’s momentum and possible trend changes?
1. RSI (Relative Strength Index)
Measures the strength of recent price movements on a scale from 0 to 100.
🟢 RSI below 30: possible oversold conditions.
🔴 RSI above 70: possible overbought conditions.
IMPORTANT: Overbought does not mean the price will fall immediately, nor does oversold mean it will rise.
2. MACD (Moving Average Convergence/Divergence)
Helps analyze the direction and momentum of a trend.
1. MACD crosses above its signal line: possible bullish momentum.
2. MACD crosses below its signal line: possible bearish momentum.
3. The histogram shows the difference between the two lines.
Why use them together?
RSI helps assess the intensity of the movement, while MACD lets you observe changes in momentum and trend.
TIP: No indicator guarantees profits. Combine RSI and MACD with support levels, resistance levels, volume, and risk management before making decisions.
Which do you use more in your analysis: RSI or MACD?
#BinanceSquare
#MACD
#TradingEducativo
@CriptoMaster007
@99PARAGUAYO
@SpaceandTimeDB
#PildorasCrypto10 y #pildorasBinance
RSI AND MACD: LEARN TO READ THE MARKET!
Did you know there are indicators that can help you identify a cryptocurrency’s momentum and possible trend changes?
1. RSI (Relative Strength Index)
Measures the strength of recent price movements on a scale from 0 to 100.
🟢 RSI below 30: possible oversold conditions.
🔴 RSI above 70: possible overbought conditions.
IMPORTANT: Overbought does not mean the price will fall immediately, nor does oversold mean it will rise.
2. MACD (Moving Average Convergence/Divergence)
Helps analyze the direction and momentum of a trend.
1. MACD crosses above its signal line: possible bullish momentum.
2. MACD crosses below its signal line: possible bearish momentum.
3. The histogram shows the difference between the two lines.
Why use them together?
RSI helps assess the intensity of the movement, while MACD lets you observe changes in momentum and trend.
TIP: No indicator guarantees profits. Combine RSI and MACD with support levels, resistance levels, volume, and risk management before making decisions.
Which do you use more in your analysis: RSI or MACD?
#BinanceSquare
#MACD
#TradingEducativo
@CriptoMaster007
@99PARAGUAYO
@SpaceandTime
RSI AND MACD: LEARN TO READ THE MARKET!
Did you know there are indicators that can help you identify a cryptocurrency’s momentum and possible trend changes?
1. RSI (Relative Strength Index)
Measures the strength of recent price movements on a scale from 0 to 100.
🟢 RSI below 30: possible oversold conditions.
🔴 RSI above 70: possible overbought conditions.
IMPORTANT: Overbought does not mean the price will fall immediately, nor does oversold mean it will rise.
2. MACD (Moving Average Convergence/Divergence)
Helps analyze the direction and momentum of a trend.
1. MACD crosses above its signal line: possible bullish momentum.
2. MACD crosses below its signal line: possible bearish momentum.
3. The histogram shows the difference between the two lines.
Why use them together?
RSI helps assess the intensity of the movement, while MACD lets you observe changes in momentum and trend.
TIP: No indicator guarantees profits. Combine RSI and MACD with support levels, resistance levels, volume, and risk management before making decisions.
Which do you use more in your analysis: RSI or MACD?
#BinanceSquare
#MACD
#TradingEducativo
@CriptoMaster007
@99PARAGUAYO
@SpaceandTime
1
4
123
·
--
#PildorasCrypto10 AND #pildorasBinance
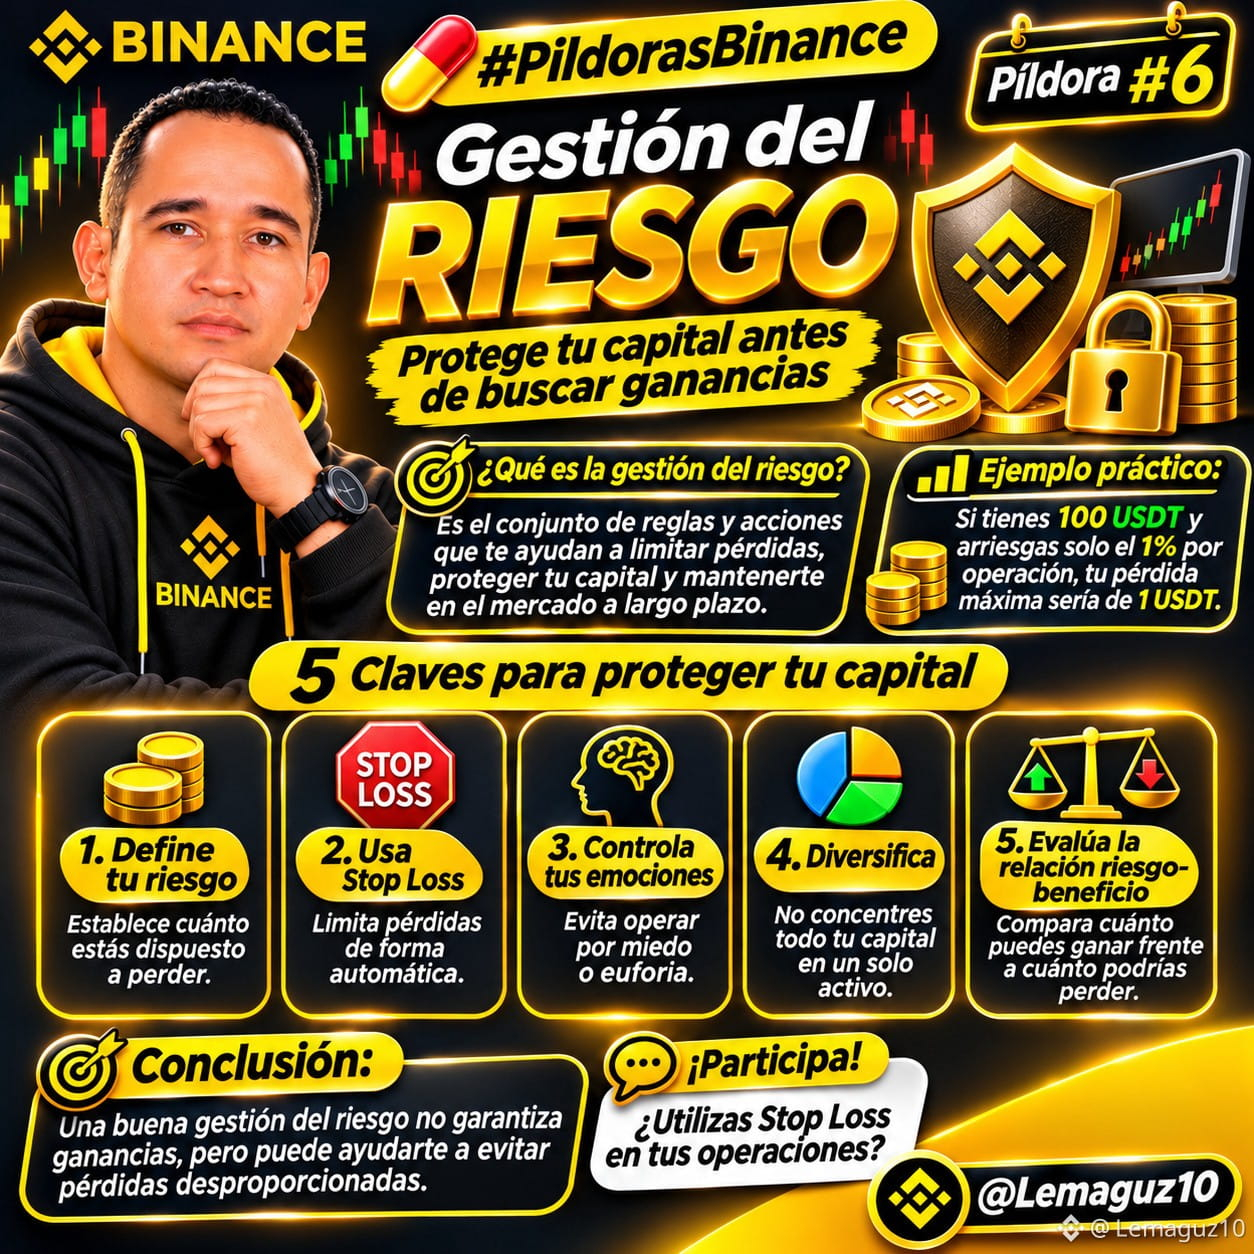
THE SECRET ISN’T ALWAYS WINNING; IT’S KNOWING HOW TO PROTECT YOUR CAPITAL.
Did you know you can make several successful trades and still lose money?
In trading, it’s not enough to identify trends, interpret Japanese candlesticks, or apply strategies like DCA. You also need to learn how to manage risk.
5 KEYS TO PROTECTING YOUR CAPITAL
✅ 1. Decide how much you’re willing to risk: Before trading, set a maximum loss you can afford.
✅ 2. Understand Stop Loss: It’s a tool that lets you set an automatic exit to limit losses, although it doesn’t guarantee the exact execution price.
✅ 3. Avoid investing based on emotions: Fear and euphoria can lead you to make the wrong decisions.
✅ 4. Don’t put all your capital in one place: Diversifying can help reduce risk, although it doesn’t eliminate losses.
✅ 5. Assess the risk-reward ratio: Before entering a trade, compare how much you could lose with how much you expect to gain.
EDUCATIONAL EXAMPLE:
If you have 100 USDT and set a maximum risk of 1% per trade, your planned loss would be 1 USDT, not including fees or potential slippage.
Good risk management doesn’t guarantee profits, but it can help you avoid disproportionate losses.
TRADER MINDSET: Protecting your capital is also part of a good strategy.
Do you use Stop Loss on your trades?
Share your experience. Let’s learn together!
Educational content. This does not constitute financial advice.
#PildorasBinance
#BinanceSquare
#TradingParaPrincipiantes
@CriptoMaster007
@99PARAGUAYO
@SpaceandTimeDB
$SXT
{future}(SXTUSDT)
#PildorasCrypto10 AND #pildorasBinance
THE SECRET ISN’T ALWAYS WINNING; IT’S KNOWING HOW TO PROTECT YOUR CAPITAL.
Did you know you can make several successful trades and still lose money?
In trading, it’s not enough to identify trends, interpret Japanese candlesticks, or apply strategies like DCA. You also need to learn how to manage risk.
5 KEYS TO PROTECTING YOUR CAPITAL
✅ 1. Decide how much you’re willing to risk: Before trading, set a maximum loss you can afford.
✅ 2. Understand Stop Loss: It’s a tool that lets you set an automatic exit to limit losses, although it doesn’t guarantee the exact execution price.
✅ 3. Avoid investing based on emotions: Fear and euphoria can lead you to make the wrong decisions.
✅ 4. Don’t put all your capital in one place: Diversifying can help reduce risk, although it doesn’t eliminate losses.
✅ 5. Assess the risk-reward ratio: Before entering a trade, compare how much you could lose with how much you expect to gain.
EDUCATIONAL EXAMPLE:
If you have 100 USDT and set a maximum risk of 1% per trade, your planned loss would be 1 USDT, not including fees or potential slippage.
Good risk management doesn’t guarantee profits, but it can help you avoid disproportionate losses.
TRADER MINDSET: Protecting your capital is also part of a good strategy.
Do you use Stop Loss on your trades?
Share your experience. Let’s learn together!
Educational content. This does not constitute financial advice.
#PildorasBinance
#BinanceSquare
#TradingParaPrincipiantes
@CriptoMaster007
@99PARAGUAYO
@SpaceandTime
$SXT
THE SECRET ISN’T ALWAYS WINNING; IT’S KNOWING HOW TO PROTECT YOUR CAPITAL.
Did you know you can make several successful trades and still lose money?
In trading, it’s not enough to identify trends, interpret Japanese candlesticks, or apply strategies like DCA. You also need to learn how to manage risk.
5 KEYS TO PROTECTING YOUR CAPITAL
✅ 1. Decide how much you’re willing to risk: Before trading, set a maximum loss you can afford.
✅ 2. Understand Stop Loss: It’s a tool that lets you set an automatic exit to limit losses, although it doesn’t guarantee the exact execution price.
✅ 3. Avoid investing based on emotions: Fear and euphoria can lead you to make the wrong decisions.
✅ 4. Don’t put all your capital in one place: Diversifying can help reduce risk, although it doesn’t eliminate losses.
✅ 5. Assess the risk-reward ratio: Before entering a trade, compare how much you could lose with how much you expect to gain.
EDUCATIONAL EXAMPLE:
If you have 100 USDT and set a maximum risk of 1% per trade, your planned loss would be 1 USDT, not including fees or potential slippage.
Good risk management doesn’t guarantee profits, but it can help you avoid disproportionate losses.
TRADER MINDSET: Protecting your capital is also part of a good strategy.
Do you use Stop Loss on your trades?
Share your experience. Let’s learn together!
Educational content. This does not constitute financial advice.
#PildorasBinance
#BinanceSquare
#TradingParaPrincipiantes
@CriptoMaster007
@99PARAGUAYO
@SpaceandTime
$SXT
1
2
317
·
--
#PildorasCrypto10 and #pildorasbinance
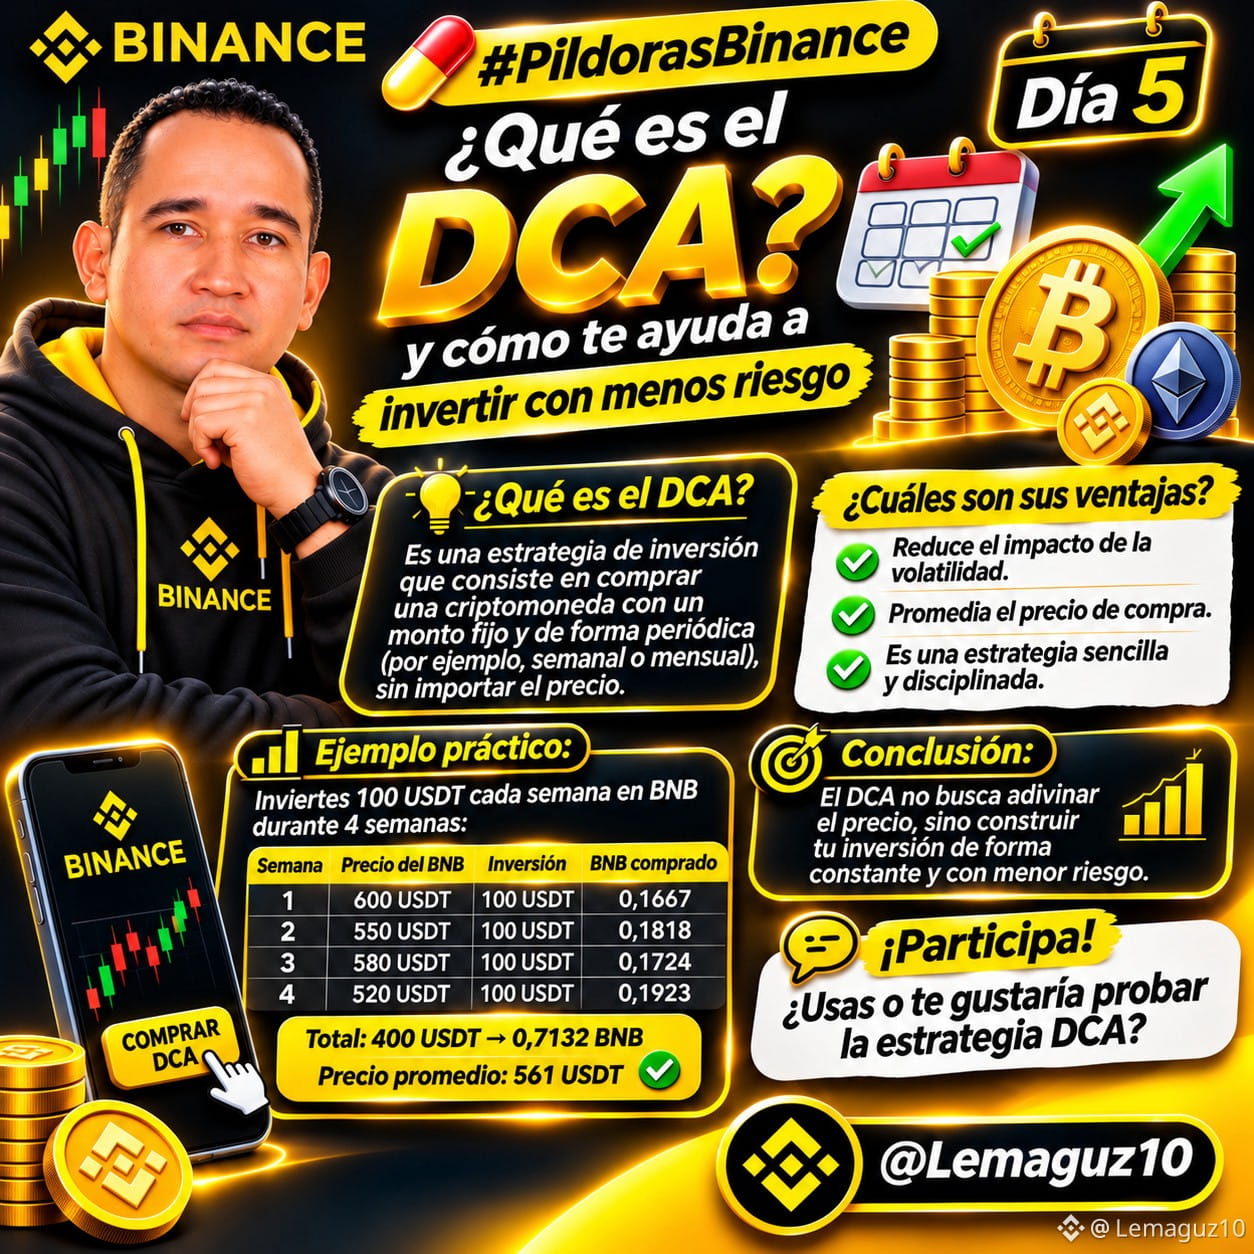
DCA: CONSISTENCY CAN MAKE A DIFFERENCE!
Did you know you don’t need to guess the best time to buy cryptocurrency?
One of the biggest challenges of investing in cryptocurrency is volatility. Many people buy when prices rise for fear of missing an opportunity and sell when they fall for fear of greater losses.
This is where DCA (Dollar-Cost Averaging) comes in—a strategy that involves investing a fixed amount of money regularly, regardless of whether the market goes up or down.
WHY IS IT IMPORTANT TO KNOW ABOUT THIS STRATEGY?
✅ Financial discipline: helps you follow a buying plan without constantly relying on emotions.
✅ Less dependence on timing your entry: avoids putting your entire investment into a single price point.
✅ Buying during downturns: when the price falls, the same amount of money lets you acquire more units.
✅ Average purchase price: spreads purchases across different price levels.
✅ Flexibility: can be applied through daily, weekly, or monthly purchases.
SOMETHING MANY BEGINNERS DON’T KNOW
DCA doesn’t mean always buying at the lowest price. If the market rises steadily, investing all your capital from the start could produce better results than spreading out your purchases.
That’s why DCA isn’t a magic formula for making money. It’s a way to organize purchases and reduce dependence on timing your entry correctly.
HOW CAN YOU MAKE THE MOST OF WHAT YOU LEARN ABOUT DCA?
1. Research the project before investing.
2. Understand the differences between buying daily, weekly, or monthly.
3. Check the fees, as they can affect the outcome.
4. Periodically assess whether your strategy is still right for your goals.
Remember that no strategy eliminates the risk of losing capital.
Educational content. This is not financial advice.
#binancesquare
#TradFiForBeginners
@CriptoMaster007
@99PARAGUAYO
#PildorasCrypto10 and #pildorasbinance
DCA: CONSISTENCY CAN MAKE A DIFFERENCE!
Did you know you don’t need to guess the best time to buy cryptocurrency?
One of the biggest challenges of investing in cryptocurrency is volatility. Many people buy when prices rise for fear of missing an opportunity and sell when they fall for fear of greater losses.
This is where DCA (Dollar-Cost Averaging) comes in—a strategy that involves investing a fixed amount of money regularly, regardless of whether the market goes up or down.
WHY IS IT IMPORTANT TO KNOW ABOUT THIS STRATEGY?
✅ Financial discipline: helps you follow a buying plan without constantly relying on emotions.
✅ Less dependence on timing your entry: avoids putting your entire investment into a single price point.
✅ Buying during downturns: when the price falls, the same amount of money lets you acquire more units.
✅ Average purchase price: spreads purchases across different price levels.
✅ Flexibility: can be applied through daily, weekly, or monthly purchases.
SOMETHING MANY BEGINNERS DON’T KNOW
DCA doesn’t mean always buying at the lowest price. If the market rises steadily, investing all your capital from the start could produce better results than spreading out your purchases.
That’s why DCA isn’t a magic formula for making money. It’s a way to organize purchases and reduce dependence on timing your entry correctly.
HOW CAN YOU MAKE THE MOST OF WHAT YOU LEARN ABOUT DCA?
1. Research the project before investing.
2. Understand the differences between buying daily, weekly, or monthly.
3. Check the fees, as they can affect the outcome.
4. Periodically assess whether your strategy is still right for your goals.
Remember that no strategy eliminates the risk of losing capital.
Educational content. This is not financial advice.
#binancesquare
#TradFiForBeginners
@CriptoMaster007
@99PARAGUAYO
DCA: CONSISTENCY CAN MAKE A DIFFERENCE!
Did you know you don’t need to guess the best time to buy cryptocurrency?
One of the biggest challenges of investing in cryptocurrency is volatility. Many people buy when prices rise for fear of missing an opportunity and sell when they fall for fear of greater losses.
This is where DCA (Dollar-Cost Averaging) comes in—a strategy that involves investing a fixed amount of money regularly, regardless of whether the market goes up or down.
WHY IS IT IMPORTANT TO KNOW ABOUT THIS STRATEGY?
✅ Financial discipline: helps you follow a buying plan without constantly relying on emotions.
✅ Less dependence on timing your entry: avoids putting your entire investment into a single price point.
✅ Buying during downturns: when the price falls, the same amount of money lets you acquire more units.
✅ Average purchase price: spreads purchases across different price levels.
✅ Flexibility: can be applied through daily, weekly, or monthly purchases.
SOMETHING MANY BEGINNERS DON’T KNOW
DCA doesn’t mean always buying at the lowest price. If the market rises steadily, investing all your capital from the start could produce better results than spreading out your purchases.
That’s why DCA isn’t a magic formula for making money. It’s a way to organize purchases and reduce dependence on timing your entry correctly.
HOW CAN YOU MAKE THE MOST OF WHAT YOU LEARN ABOUT DCA?
1. Research the project before investing.
2. Understand the differences between buying daily, weekly, or monthly.
3. Check the fees, as they can affect the outcome.
4. Periodically assess whether your strategy is still right for your goals.
Remember that no strategy eliminates the risk of losing capital.
Educational content. This is not financial advice.
#binancesquare
#TradFiForBeginners
@CriptoMaster007
@99PARAGUAYO
2
114
·
--
#PildorasCrypto10 y #HotCPIDecemberHikePriced
DID YOU KNOW THAT JAPANESE CANDLESTICKS CAN REVEAL CLUES ABOUT THE MARKET?
#PildorasBinance | Day 4
Many people watch to see whether Bitcoin or BNB goes up or down, but few beginners understand what their candlesticks show.
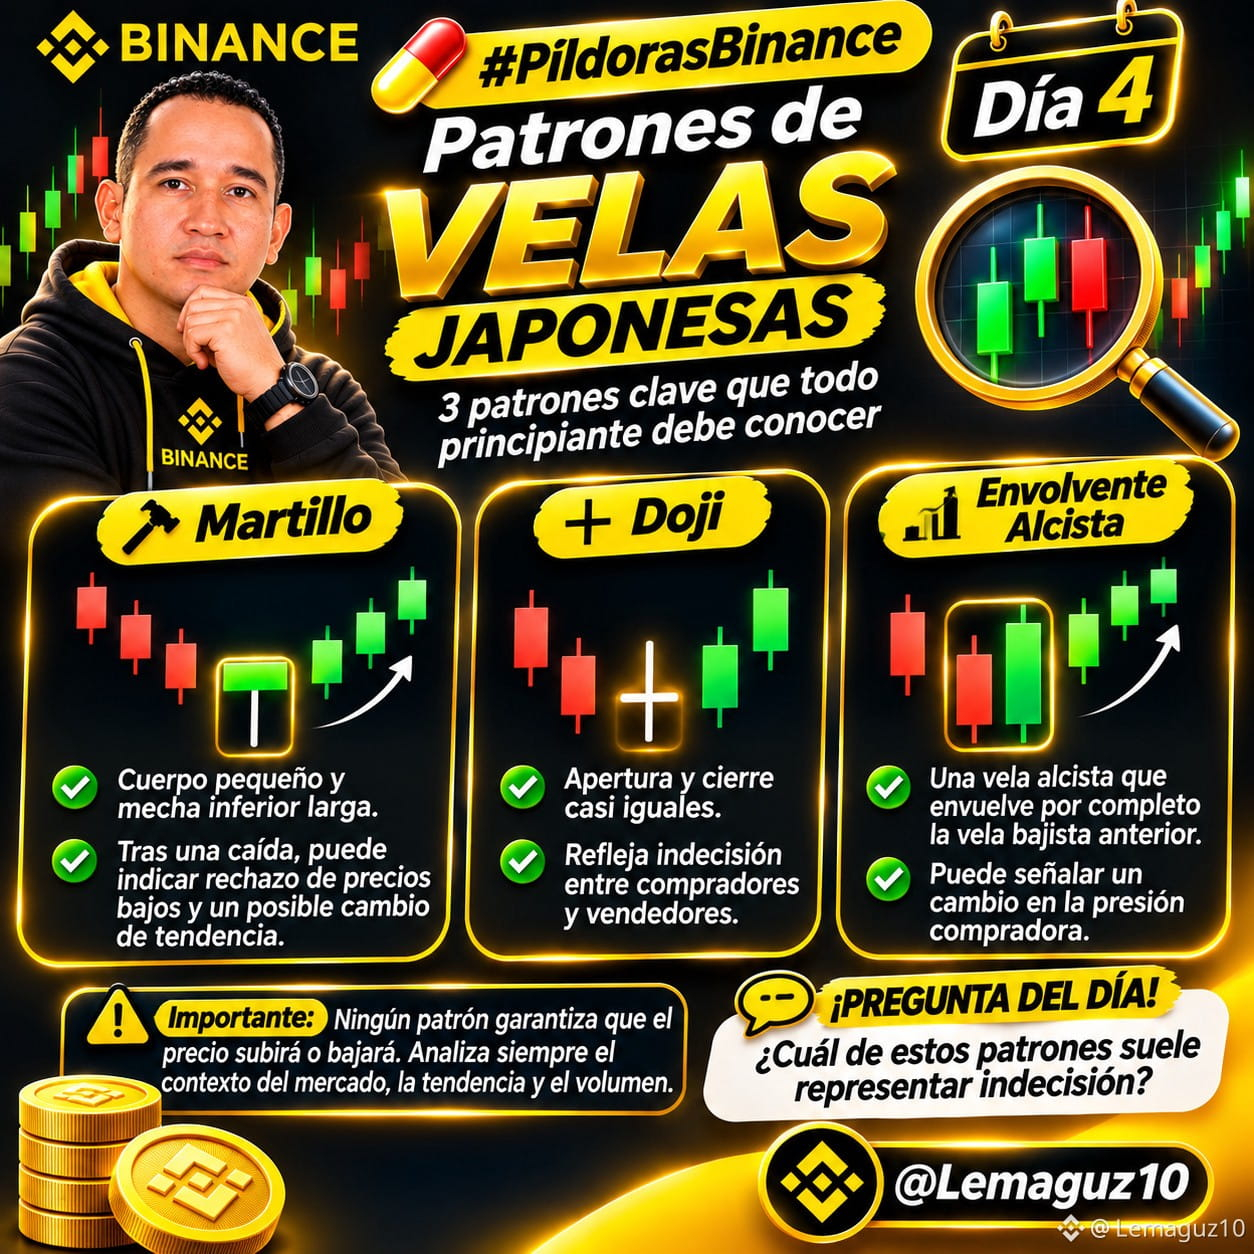
3 PATTERNS YOU SHOULD KNOW:
1. HAMMER: has a small body and a long lower wick. After a decline, it may indicate rejection of lower prices and a possible trend reversal.
2. DOJI: its opening and closing prices are almost the same. It may reflect indecision between buyers and sellers.
3. BULLISH ENGULFING: appears when a bullish candlestick has a body that engulfs the body of the previous bearish candlestick. It may signal a change in buying pressure.
No pattern guarantees that the price will rise or fall. Always analyze the context, the trend, and the volume.
Candlesticks don't predict the future; they help interpret what's happening in the market.
Which of these patterns usually represents indecision?
🅰️ Hammer 🔨
🅱️ Doji ➕
🅲 Bullish engulfing 📈
Comment A, B, or C! Do you know the answer?
Educational content; this does not constitute financial advice.
#BinanceSquare
#VelasJaponesas
@CriptoMaster007
@99PARAGUAYO
@Mireyacuai
@NONOcalde
$BTC
#PildorasCrypto10 y #HotCPIDecemberHikePriced
DID YOU KNOW THAT JAPANESE CANDLESTICKS CAN REVEAL CLUES ABOUT THE MARKET?
#PildorasBinance | Day 4
Many people watch to see whether Bitcoin or BNB goes up or down, but few beginners understand what their candlesticks show.
3 PATTERNS YOU SHOULD KNOW:
1. HAMMER: has a small body and a long lower wick. After a decline, it may indicate rejection of lower prices and a possible trend reversal.
2. DOJI: its opening and closing prices are almost the same. It may reflect indecision between buyers and sellers.
3. BULLISH ENGULFING: appears when a bullish candlestick has a body that engulfs the body of the previous bearish candlestick. It may signal a change in buying pressure.
No pattern guarantees that the price will rise or fall. Always analyze the context, the trend, and the volume.
Candlesticks don't predict the future; they help interpret what's happening in the market.
Which of these patterns usually represents indecision?
🅰️ Hammer 🔨
🅱️ Doji ➕
🅲 Bullish engulfing 📈
Comment A, B, or C! Do you know the answer?
Educational content; this does not constitute financial advice.
#BinanceSquare
#VelasJaponesas
@CriptoMaster007
@99PARAGUAYO
@Mireya29
@NONOcalde
$BTC
DID YOU KNOW THAT JAPANESE CANDLESTICKS CAN REVEAL CLUES ABOUT THE MARKET?
#PildorasBinance | Day 4
Many people watch to see whether Bitcoin or BNB goes up or down, but few beginners understand what their candlesticks show.
3 PATTERNS YOU SHOULD KNOW:
1. HAMMER: has a small body and a long lower wick. After a decline, it may indicate rejection of lower prices and a possible trend reversal.
2. DOJI: its opening and closing prices are almost the same. It may reflect indecision between buyers and sellers.
3. BULLISH ENGULFING: appears when a bullish candlestick has a body that engulfs the body of the previous bearish candlestick. It may signal a change in buying pressure.
No pattern guarantees that the price will rise or fall. Always analyze the context, the trend, and the volume.
Candlesticks don't predict the future; they help interpret what's happening in the market.
Which of these patterns usually represents indecision?
🅰️ Hammer 🔨
🅱️ Doji ➕
🅲 Bullish engulfing 📈
Comment A, B, or C! Do you know the answer?
Educational content; this does not constitute financial advice.
#BinanceSquare
#VelasJaponesas
@CriptoMaster007
@99PARAGUAYO
@Mireya29
@NONOcalde
$BTC
2
91
·
--
#PildorasCrypto10
JAPANESE CANDLESTICKS: DO YOU KNOW WHAT THE MARKET IS TRYING TO TELL YOU?
#pildorasBinance | Crypto Learning
Don’t just look at the price—learn to interpret candlesticks!
Did you know that each Japanese candlestick tells a little story about the behavior of buyers and sellers?
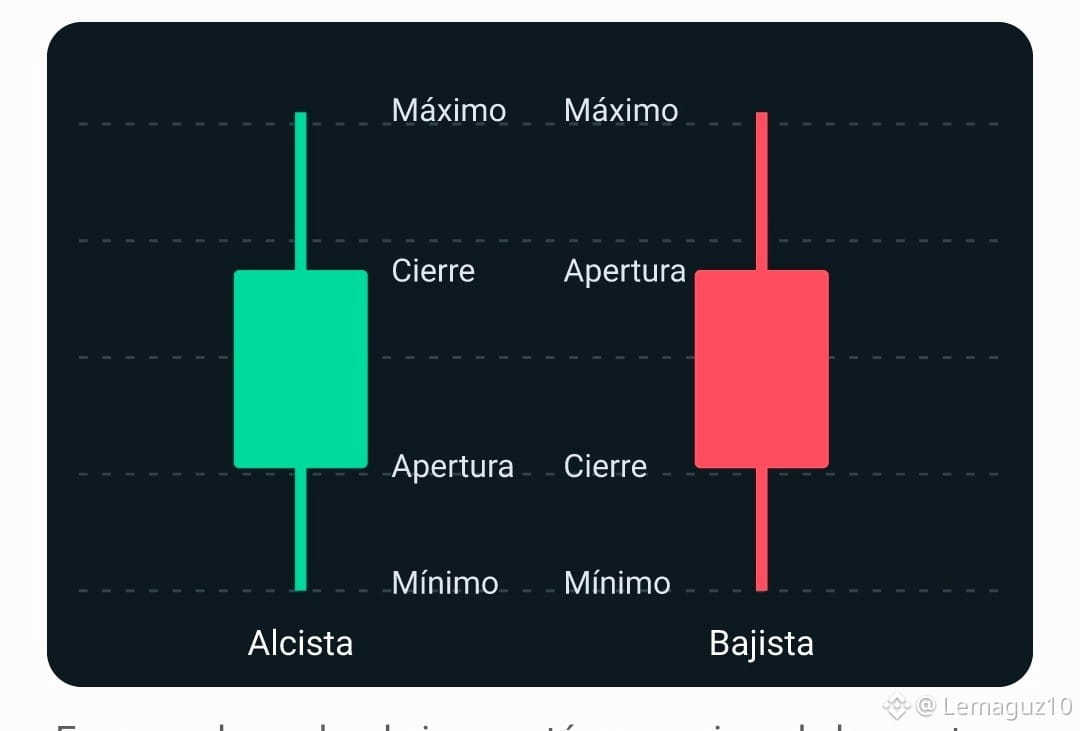
WHAT ARE JAPANESE CANDLESTICKS?
They are chart representations that show four key price points over a given period:
✅ Open: the price at the start of the period.
✅ Close: the price at the end of the period.
✅ High: the highest price reached.
✅ Low: the lowest price recorded.
🟢 GREEN CANDLE: the price closed above its opening price.
🔴 RED CANDLE: the price closed below its opening price.
WHAT DO THEIR SHAPES MEAN?
🟩 Long body: indicates a significant move between the opening and closing prices.
➖ Long wicks: show that the price reached levels it later failed to hold.
✚ Doji: the opening and closing prices are very close, which may reflect indecision.
A green candle doesn’t guarantee that the price will keep rising, and a red one doesn’t mean it will keep falling.
WHY IS IT IMPORTANT TO LEARN HOW TO READ THEM?
Because they help you understand volatility, identify potential areas of interest, and analyze price behavior.
However, they should be interpreted alongside volume, the trend, and other elements of technical analysis.
LET’S TEST YOUR KNOWLEDGE!
If you see a candle with a very long upper wick, what might it indicate?
🅰️ That the price is certain to rise.
🅱️ That higher prices were rejected.
🅲 That the market stopped trading.
👇 Comment A, B, or C! Do you know the answer?
Educational content. Not financial advice.
A daily dose, a new piece of knowledge.
#BinanceSquare
#VelasJaponesas
#CryptoEducation
@CriptoMaster007
@NONOcalde
@99PARAGUAYO
#PildorasCrypto10
JAPANESE CANDLESTICKS: DO YOU KNOW WHAT THE MARKET IS TRYING TO TELL YOU?
#pildorasBinance | Crypto Learning
Don’t just look at the price—learn to interpret candlesticks!
Did you know that each Japanese candlestick tells a little story about the behavior of buyers and sellers?
WHAT ARE JAPANESE CANDLESTICKS?
They are chart representations that show four key price points over a given period:
✅ Open: the price at the start of the period.
✅ Close: the price at the end of the period.
✅ High: the highest price reached.
✅ Low: the lowest price recorded.
🟢 GREEN CANDLE: the price closed above its opening price.
🔴 RED CANDLE: the price closed below its opening price.
WHAT DO THEIR SHAPES MEAN?
🟩 Long body: indicates a significant move between the opening and closing prices.
➖ Long wicks: show that the price reached levels it later failed to hold.
✚ Doji: the opening and closing prices are very close, which may reflect indecision.
A green candle doesn’t guarantee that the price will keep rising, and a red one doesn’t mean it will keep falling.
WHY IS IT IMPORTANT TO LEARN HOW TO READ THEM?
Because they help you understand volatility, identify potential areas of interest, and analyze price behavior.
However, they should be interpreted alongside volume, the trend, and other elements of technical analysis.
LET’S TEST YOUR KNOWLEDGE!
If you see a candle with a very long upper wick, what might it indicate?
🅰️ That the price is certain to rise.
🅱️ That higher prices were rejected.
🅲 That the market stopped trading.
👇 Comment A, B, or C! Do you know the answer?
Educational content. Not financial advice.
A daily dose, a new piece of knowledge.
#BinanceSquare
#VelasJaponesas
#CryptoEducation
@CriptoMaster007
@NONOcalde
@99PARAGUAYO
JAPANESE CANDLESTICKS: DO YOU KNOW WHAT THE MARKET IS TRYING TO TELL YOU?
#pildorasBinance | Crypto Learning
Don’t just look at the price—learn to interpret candlesticks!
Did you know that each Japanese candlestick tells a little story about the behavior of buyers and sellers?
WHAT ARE JAPANESE CANDLESTICKS?
They are chart representations that show four key price points over a given period:
✅ Open: the price at the start of the period.
✅ Close: the price at the end of the period.
✅ High: the highest price reached.
✅ Low: the lowest price recorded.
🟢 GREEN CANDLE: the price closed above its opening price.
🔴 RED CANDLE: the price closed below its opening price.
WHAT DO THEIR SHAPES MEAN?
🟩 Long body: indicates a significant move between the opening and closing prices.
➖ Long wicks: show that the price reached levels it later failed to hold.
✚ Doji: the opening and closing prices are very close, which may reflect indecision.
A green candle doesn’t guarantee that the price will keep rising, and a red one doesn’t mean it will keep falling.
WHY IS IT IMPORTANT TO LEARN HOW TO READ THEM?
Because they help you understand volatility, identify potential areas of interest, and analyze price behavior.
However, they should be interpreted alongside volume, the trend, and other elements of technical analysis.
LET’S TEST YOUR KNOWLEDGE!
If you see a candle with a very long upper wick, what might it indicate?
🅰️ That the price is certain to rise.
🅱️ That higher prices were rejected.
🅲 That the market stopped trading.
👇 Comment A, B, or C! Do you know the answer?
Educational content. Not financial advice.
A daily dose, a new piece of knowledge.
#BinanceSquare
#VelasJaponesas
#CryptoEducation
@CriptoMaster007
@NONOcalde
@99PARAGUAYO
2
1
2
59
Log in to explore more content
Join global crypto users on Binance Square
⚡️ Get latest and useful information about crypto.
💬 Trusted by the world’s largest crypto exchange.
👍 Discover real insights from verified creators.
Email / Phone number
Trending Topics
1
#NvidiaBeatsEstimatesWith$130BQ4Outlook
3,334 views
75 Discussing
2
#AnthropicIPOPriceCouldExceed$80
7,553 views
77 Discussing
3
#CanNvidia’sDataCenterGrowthContinue?
17,244 views
316 Discussing
4
#BankOfEnglandUnveilsClearingHousePathwayCoveringDLTFirms
0 views
2 Discussing
5
#DBSAndCirclePartnerToExpandAsianInstitutionsUSDCAccess
1,108 views
25 Discussing
6
#LedgerHardwareImplantReportsExtendToDubai
391 views
43 Discussing
7
#NvidiaBoardNotConsideringHuang’sReturnasCEO
177,008 views
1,296 Discussing
8
#KOSPIFalls2.59%ToLowestCloseSinceFebruary
48,702 views
551 Discussing
9
#AnthropicClearedToListOnNasdaqAsANT
42,604 views
432 Discussing
10
#WhatInvestmentSignalsDo13FFilingsReveal?
94,581 views
833 Discussing