

#marscion
marscion
27,971 views
18 Discussing
Hot
Latest

·
--
After the interest rate hike was announced at dawn, it didn’t cause much of a shock to the market. There was only a brief period of volatility, and then it rebounded and pulled back. If there aren’t any major negative developments in the future, it should be hard for it to plunge deeper again.
#pons Last night didn’t set a new low. Spot has no trades, and there were no trades in the orders posted—only about 3,000 U成交 around 0.55 on the contract order book. Binance currently holds 35,000 U, and the neighboring platform holds 40,000+ U in long positions. This morning, I withdrew the 400 U earnings from mining in the two small liquidity pools over the past few days and re-invested the funds into pons.
#marscion These days it has been swinging widely between 0.08 and 0.1. It seems the market maker is carrying out the final round of shakeout. The coin price didn’t make a new low—yesterday it also didn’t have any order-book trades. These two early bottom low points have already been tested and confirmed, and the negative impact from the interest rate hike has passed. Unless there’s some major “black swan” event by the end of the year, the coin price likely won’t make new lows again. In the future, it should gradually digest the trapped sell orders above the market, setting the stage for the next major upswing.
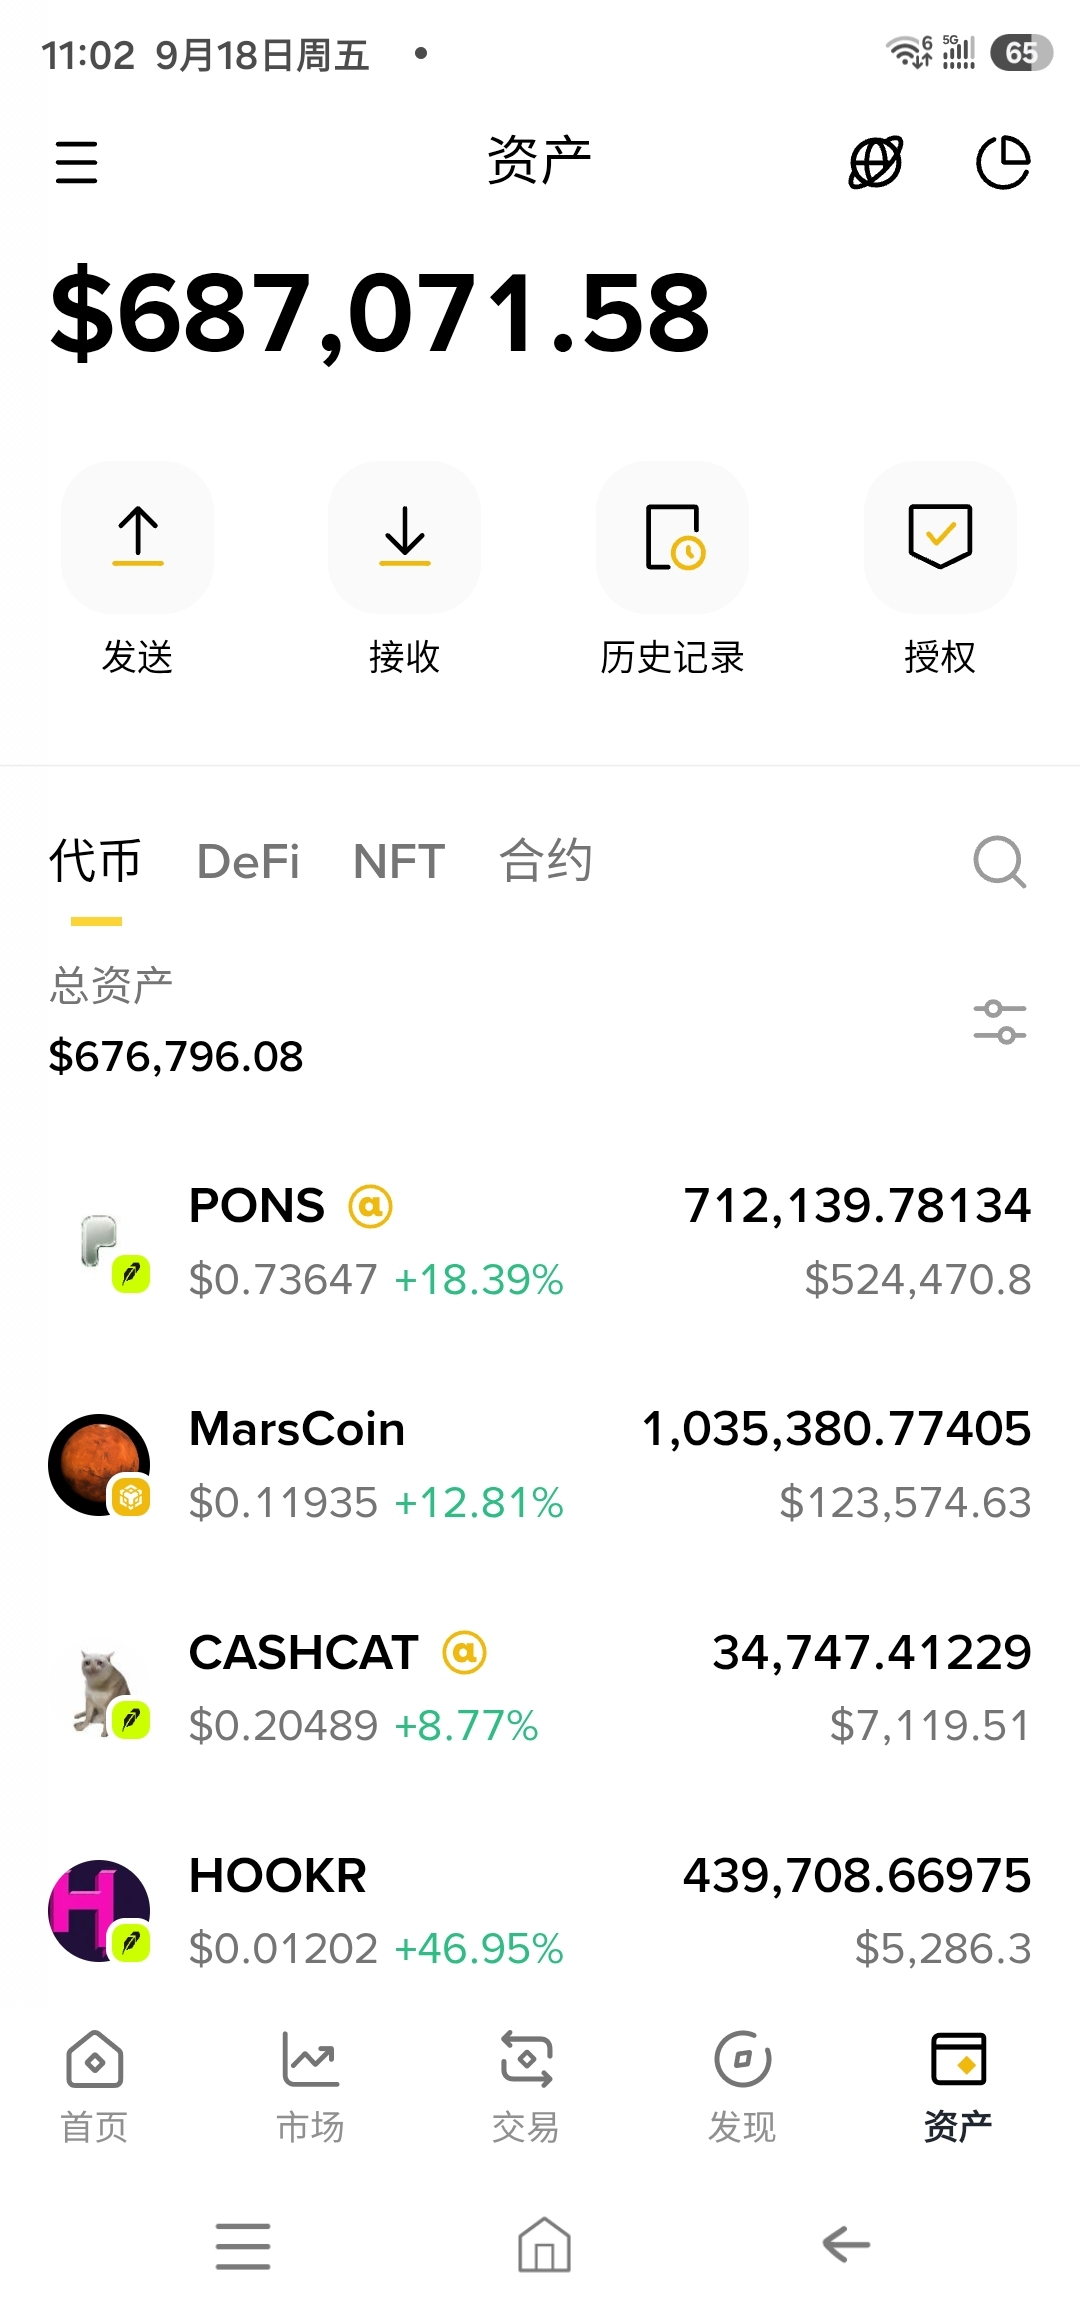
As of now, the results of accumulating coins for long-term positions in this bear market are as follows:
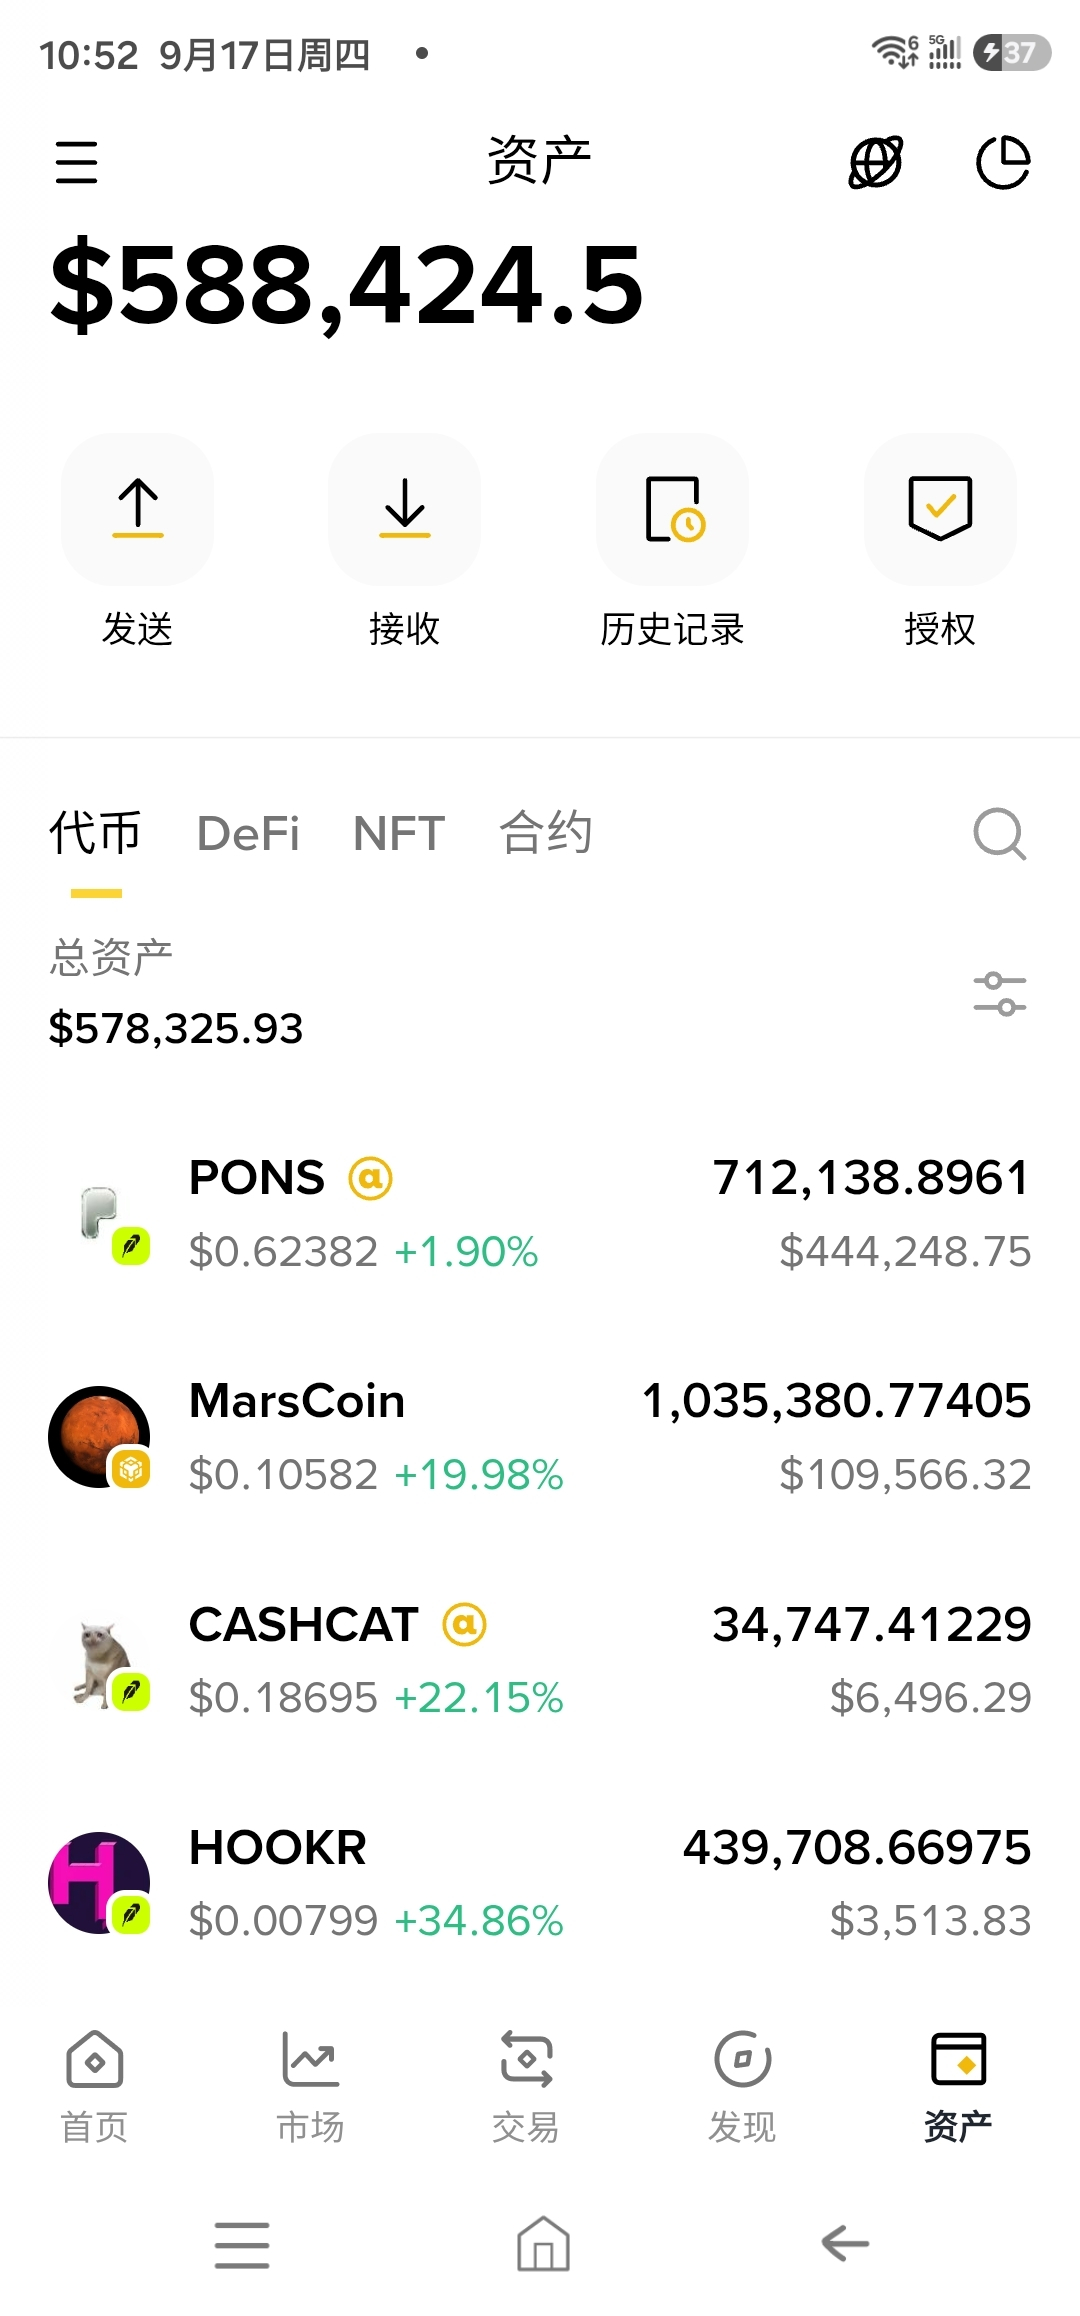
pons spot: total holdings 712,138, total investment 58,700 U, and the average spot cost is 0.0825 U
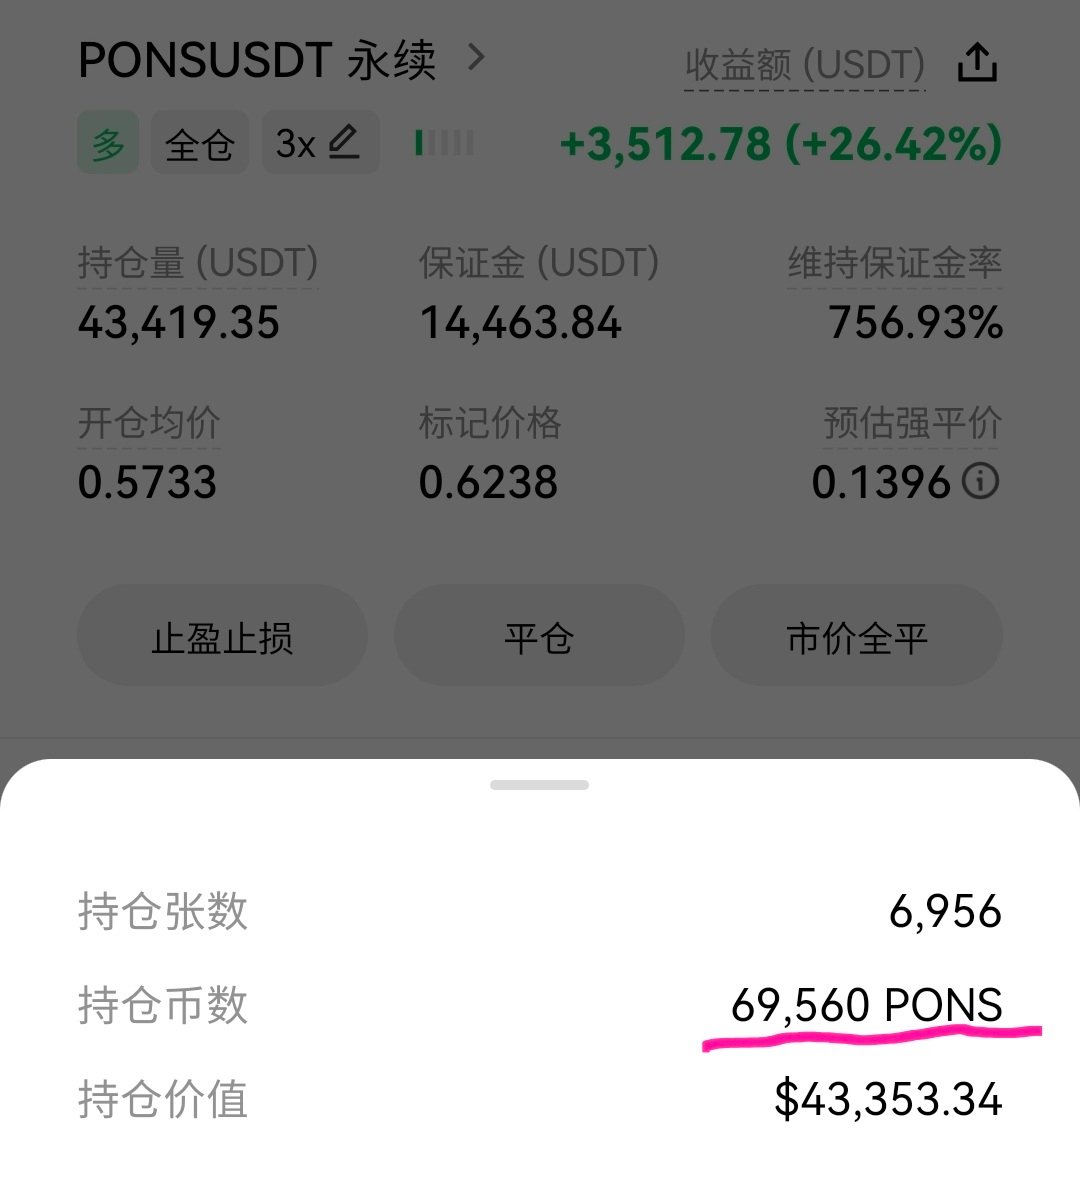
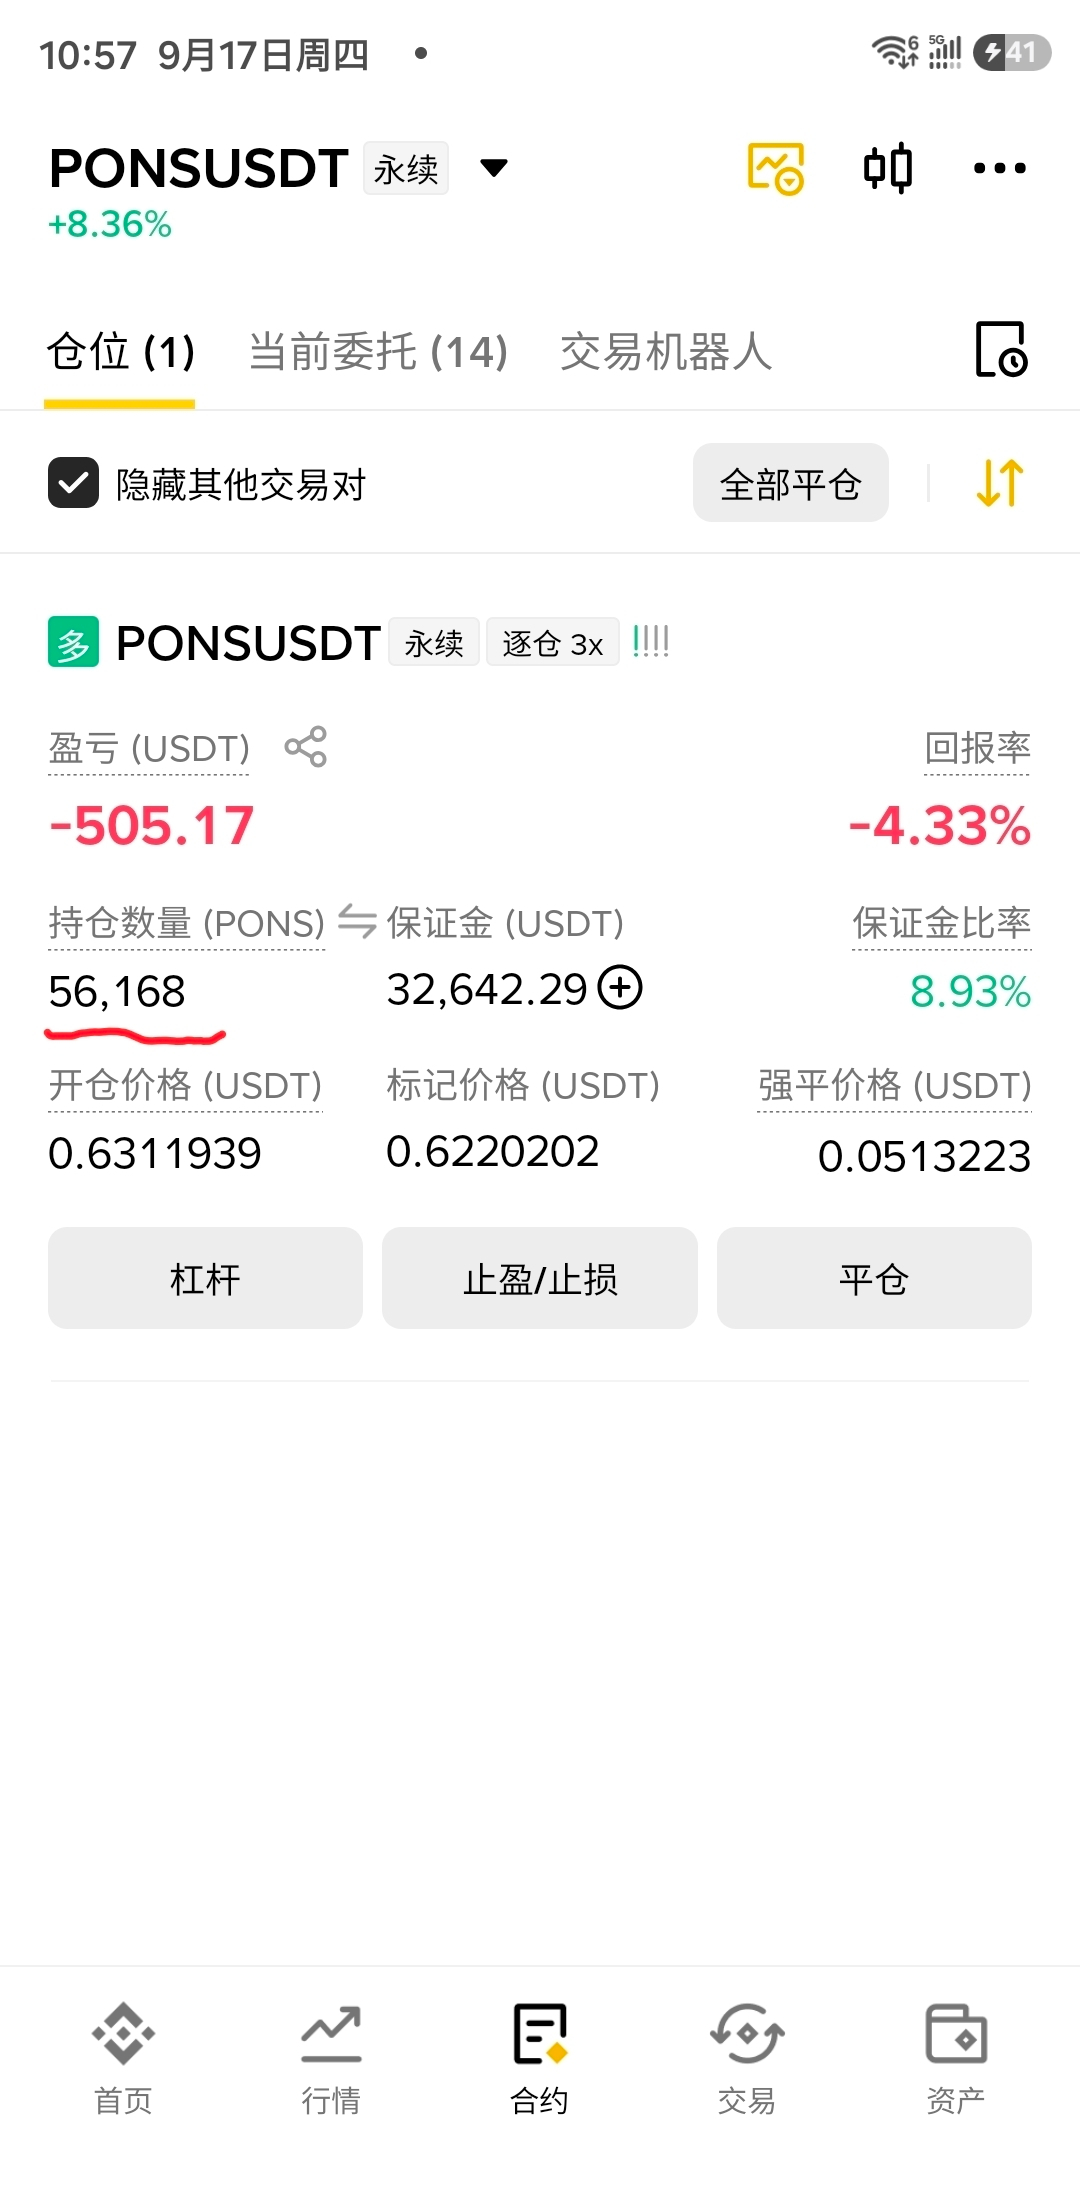
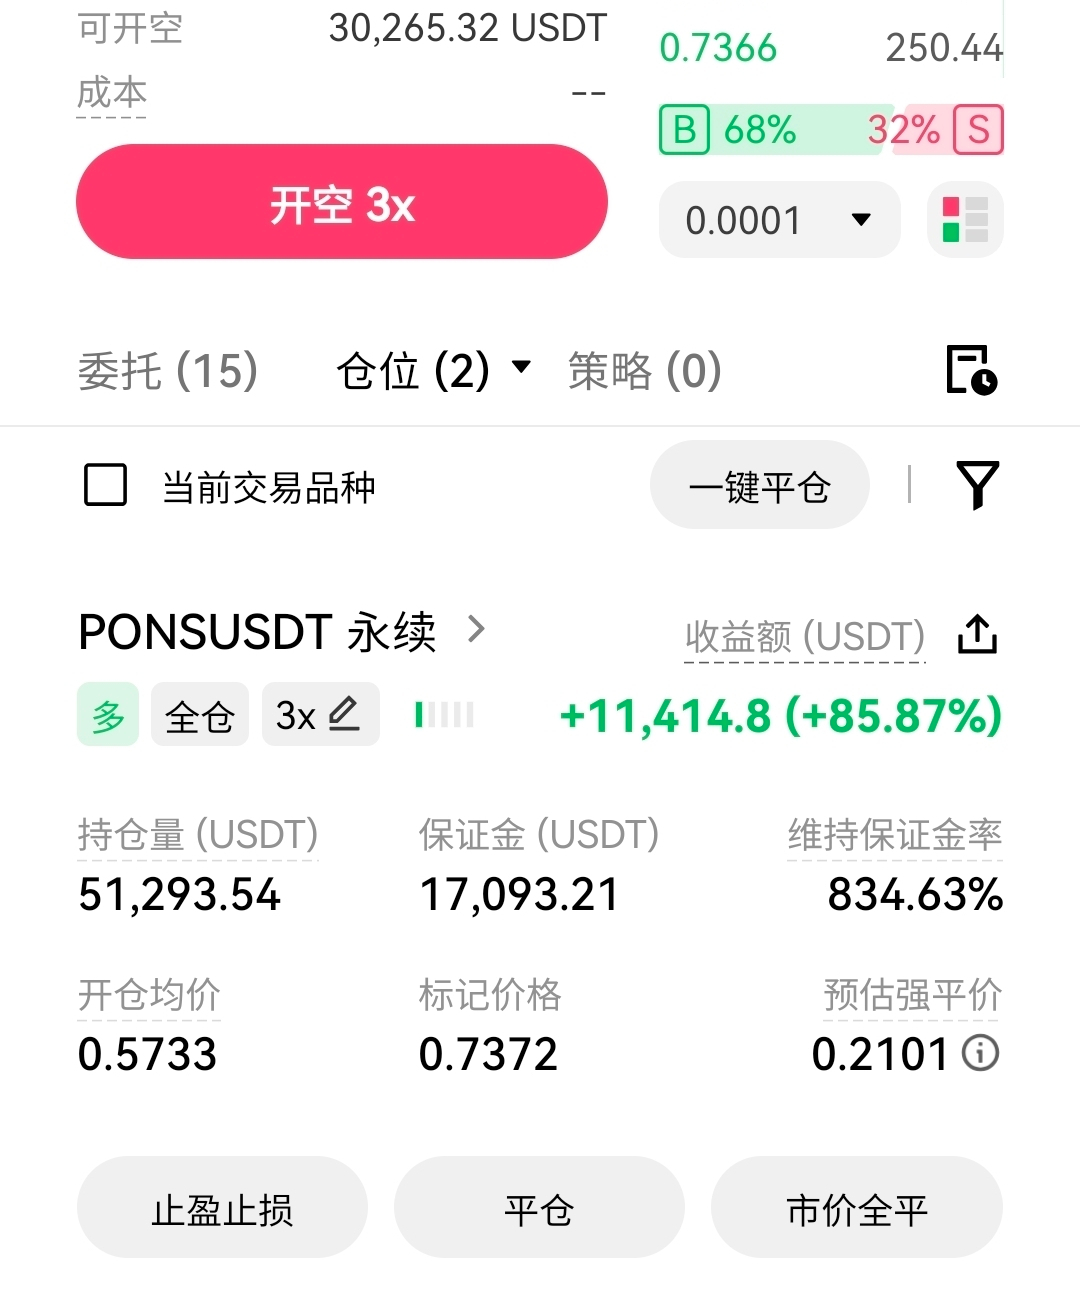
pons contracts: 56,168 coins on Binance at a cost of 0.63 U; 69,560 coins on the neighboring platform at a cost of 0.57 U. Total contract margin is 60,000 U (a little leverage). The pons contract quantity is 125,728, and the average contract cost is 0.59 U
pons spot plus contracts: total holdings 838,000+ (about 837,800), total investment 134,000 U, and the combined average cost is 0.1600 U
marscoin: total holdings 1,035,300, total investment 75,200 U, and the average holding cost is 0.0726 U
Going forward, these two likely won’t make new lows again. The bear-market coin-accumulation phase for these “shanzhai” coins is coming to an end; what remains is to find opportunities to accumulate the mainstream coins.
After the interest rate hike was announced at dawn, it didn’t cause much of a shock to the market. There was only a brief period of volatility, and then it rebounded and pulled back. If there aren’t any major negative developments in the future, it should be hard for it to plunge deeper again.
#pons Last night didn’t set a new low. Spot has no trades, and there were no trades in the orders posted—only about 3,000 U成交 around 0.55 on the contract order book. Binance currently holds 35,000 U, and the neighboring platform holds 40,000+ U in long positions. This morning, I withdrew the 400 U earnings from mining in the two small liquidity pools over the past few days and re-invested the funds into pons.
#marscion These days it has been swinging widely between 0.08 and 0.1. It seems the market maker is carrying out the final round of shakeout. The coin price didn’t make a new low—yesterday it also didn’t have any order-book trades. These two early bottom low points have already been tested and confirmed, and the negative impact from the interest rate hike has passed. Unless there’s some major “black swan” event by the end of the year, the coin price likely won’t make new lows again. In the future, it should gradually digest the trapped sell orders above the market, setting the stage for the next major upswing.
As of now, the results of accumulating coins for long-term positions in this bear market are as follows:
pons spot: total holdings 712,138, total investment 58,700 U, and the average spot cost is 0.0825 U
pons contracts: 56,168 coins on Binance at a cost of 0.63 U; 69,560 coins on the neighboring platform at a cost of 0.57 U. Total contract margin is 60,000 U (a little leverage). The pons contract quantity is 125,728, and the average contract cost is 0.59 U
pons spot plus contracts: total holdings 838,000+ (about 837,800), total investment 134,000 U, and the combined average cost is 0.1600 U
marscoin: total holdings 1,035,300, total investment 75,200 U, and the average holding cost is 0.0726 U
Going forward, these two likely won’t make new lows again. The bear-market coin-accumulation phase for these “shanzhai” coins is coming to an end; what remains is to find opportunities to accumulate the mainstream coins.
#pons Last night didn’t set a new low. Spot has no trades, and there were no trades in the orders posted—only about 3,000 U成交 around 0.55 on the contract order book. Binance currently holds 35,000 U, and the neighboring platform holds 40,000+ U in long positions. This morning, I withdrew the 400 U earnings from mining in the two small liquidity pools over the past few days and re-invested the funds into pons.
#marscion These days it has been swinging widely between 0.08 and 0.1. It seems the market maker is carrying out the final round of shakeout. The coin price didn’t make a new low—yesterday it also didn’t have any order-book trades. These two early bottom low points have already been tested and confirmed, and the negative impact from the interest rate hike has passed. Unless there’s some major “black swan” event by the end of the year, the coin price likely won’t make new lows again. In the future, it should gradually digest the trapped sell orders above the market, setting the stage for the next major upswing.
As of now, the results of accumulating coins for long-term positions in this bear market are as follows:
pons spot: total holdings 712,138, total investment 58,700 U, and the average spot cost is 0.0825 U
pons contracts: 56,168 coins on Binance at a cost of 0.63 U; 69,560 coins on the neighboring platform at a cost of 0.57 U. Total contract margin is 60,000 U (a little leverage). The pons contract quantity is 125,728, and the average contract cost is 0.59 U
pons spot plus contracts: total holdings 838,000+ (about 837,800), total investment 134,000 U, and the combined average cost is 0.1600 U
marscoin: total holdings 1,035,300, total investment 75,200 U, and the average holding cost is 0.0726 U
Going forward, these two likely won’t make new lows again. The bear-market coin-accumulation phase for these “shanzhai” coins is coming to an end; what remains is to find opportunities to accumulate the mainstream coins.
Cyht0527:
有时候急跌急拉不需要情绪
71
35
15.7k

·
--
Bullish
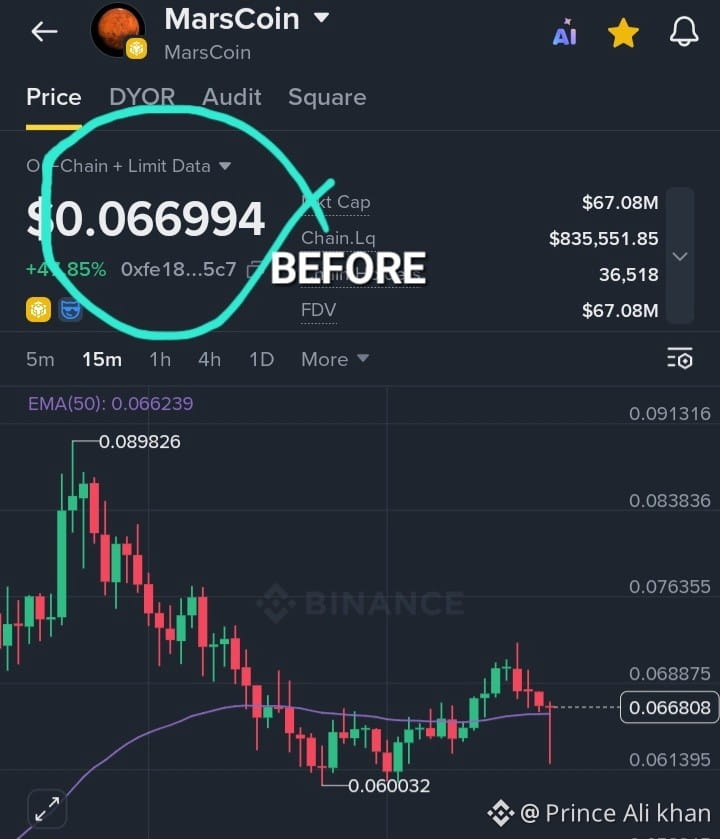
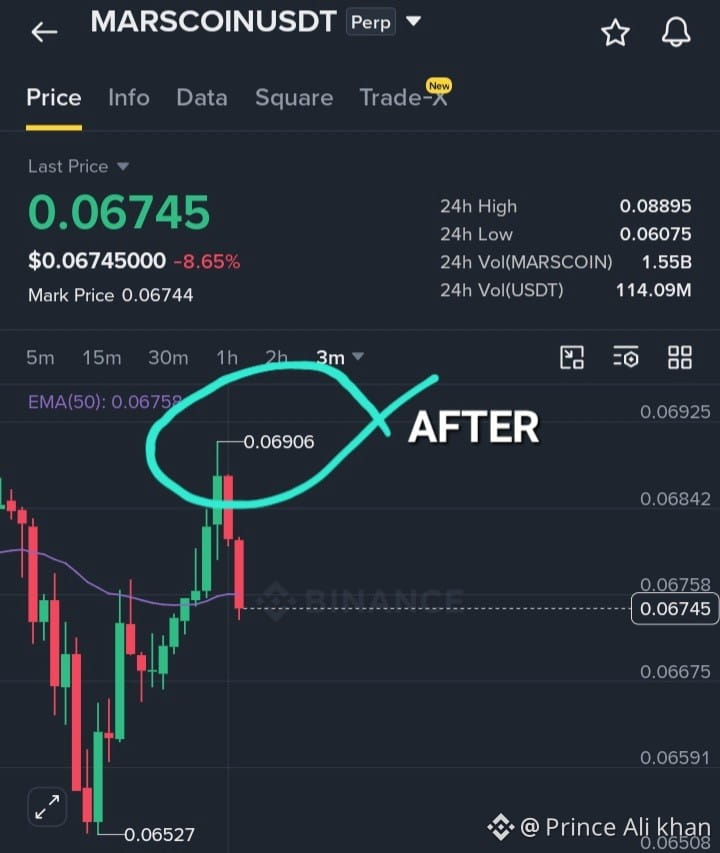
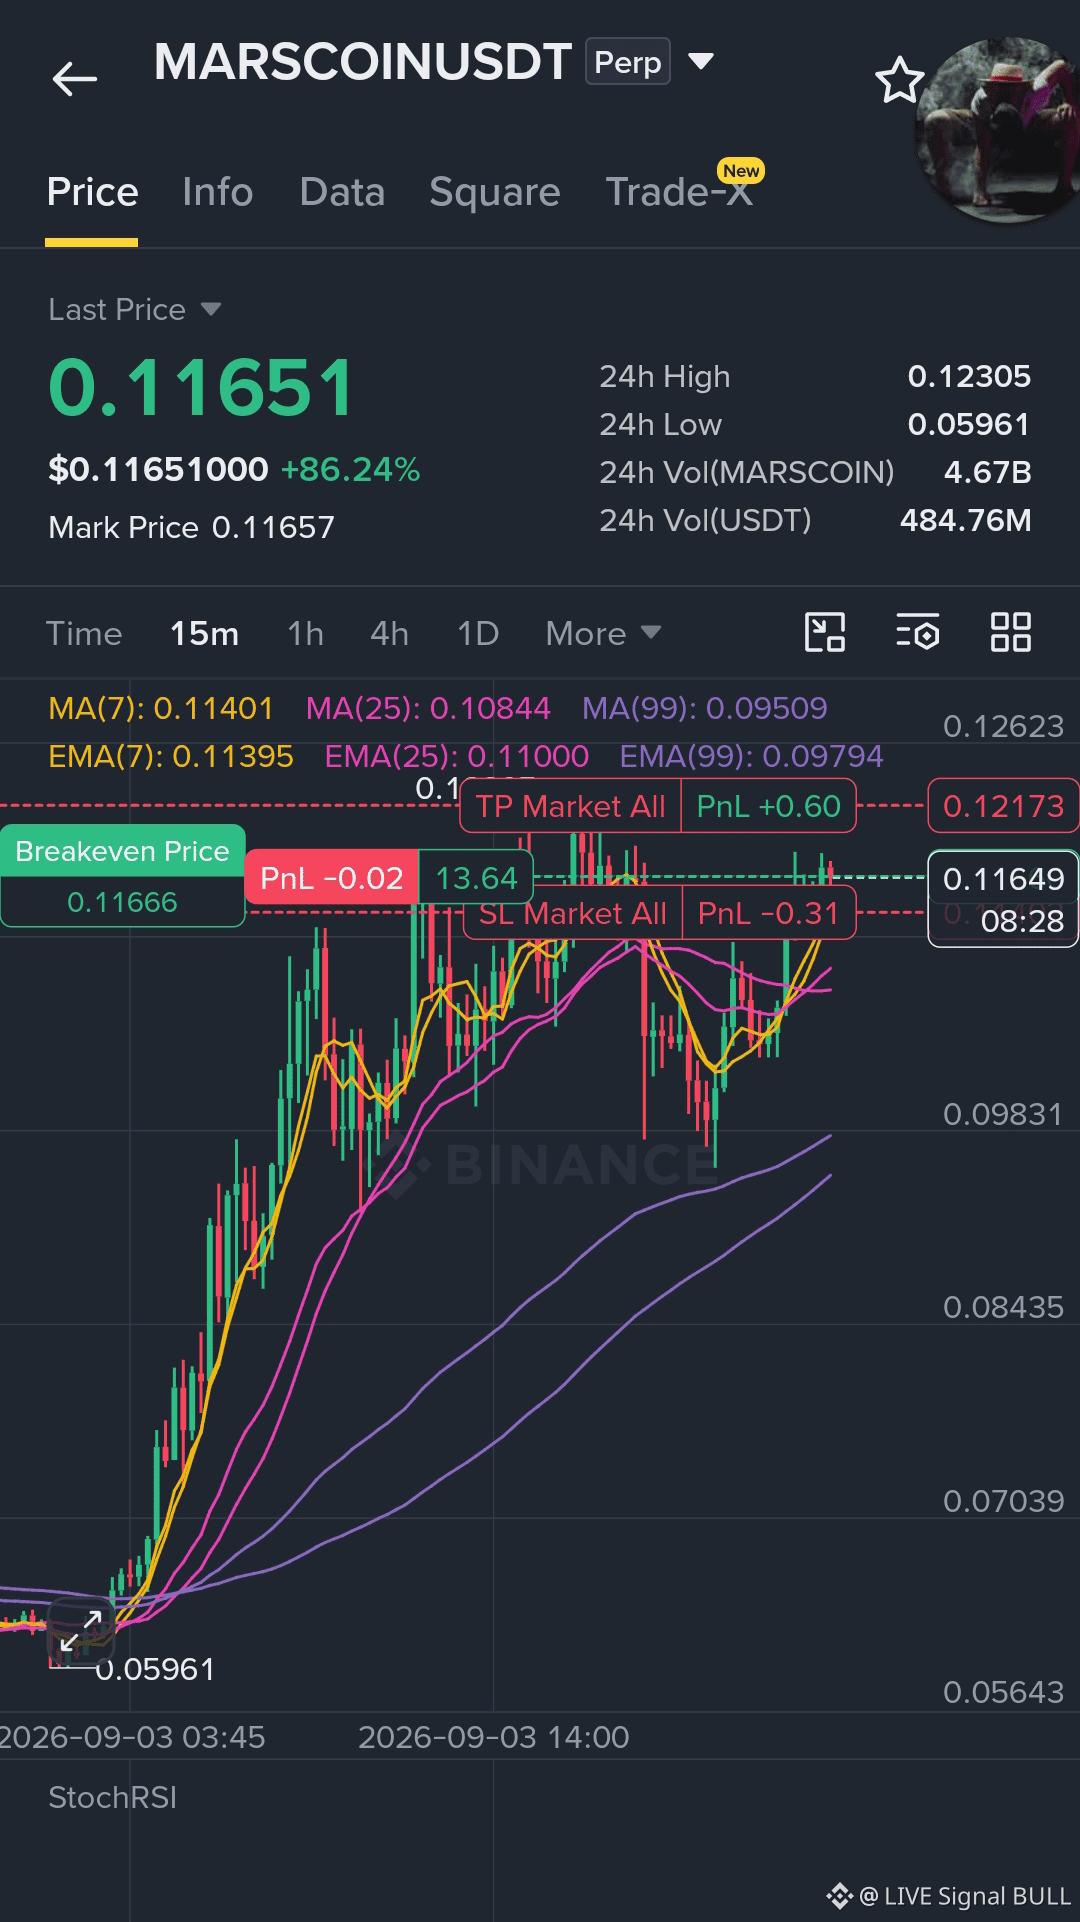
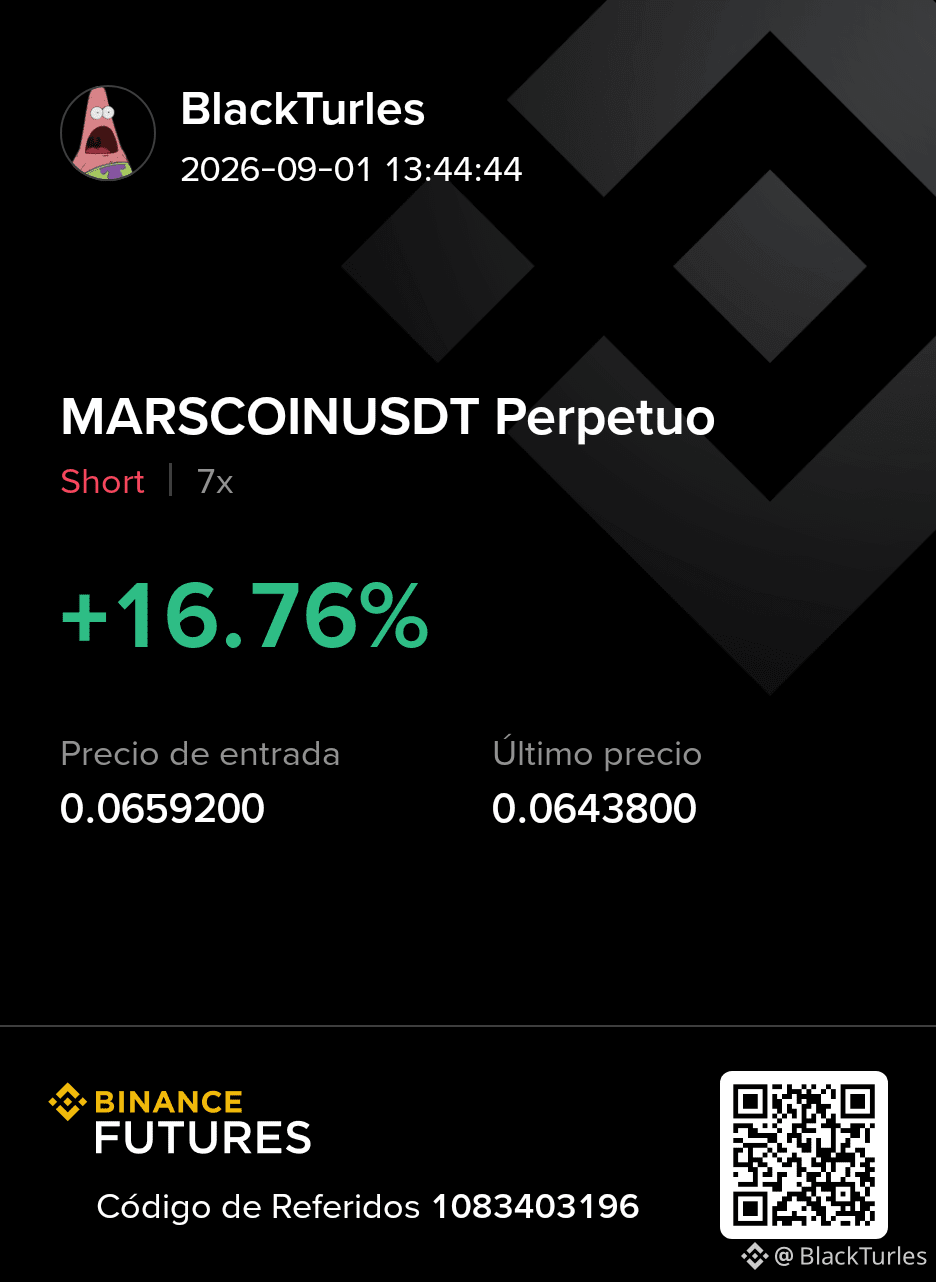
PORTFOLIO DISPATCH: $MARSCOIN TP1 & TP2 SECURED 📟⚡
Asset: #marscion
Fill Duration: 28 Minutes ⏱️
Execution Profile: TP1 & TP2 Vaporized
We don't hold long-term baggage or float open-ended risk. Our methodology relies strictly on systematic liquidity grabs, tight risk parameters, and rapid capital recycling.
📊 Stop gambling on speculative hype. Start executing data-backed setups.
$AKE $STAR
PORTFOLIO DISPATCH: $MARSCOIN TP1 & TP2 SECURED 📟⚡
Asset: #marscion
Fill Duration: 28 Minutes ⏱️
Execution Profile: TP1 & TP2 Vaporized
We don't hold long-term baggage or float open-ended risk. Our methodology relies strictly on systematic liquidity grabs, tight risk parameters, and rapid capital recycling.
📊 Stop gambling on speculative hype. Start executing data-backed setups.
$AKE $STAR
Asset: #marscion
Fill Duration: 28 Minutes ⏱️
Execution Profile: TP1 & TP2 Vaporized
We don't hold long-term baggage or float open-ended risk. Our methodology relies strictly on systematic liquidity grabs, tight risk parameters, and rapid capital recycling.
📊 Stop gambling on speculative hype. Start executing data-backed setups.
$AKE $STAR
417
·
--
After the arc chain went live, it went straight downhill—opening high then sliding lower. The rh chain was briefly hit, but the funds quickly flowed back again. For the rh coins that had already suffered huge early declines, they have all started to surge strongly, including the so-called “leader” Cash Cat—even though it wasn’t held much at the beginning. #pons In this round of correction, the lowest it dipped was around the limit level 0.5 I mentioned earlier—so this pullback-and-bottoming move can basically be declared over. Next, it will still be as I said: a choppy upward grind, slowly digesting the sell-off and trapped positions above, then breaking to new highs and entering the next main upwave. This phase may take some time to complete. After the pons setup is fully positioned, there will basically be no day-to-day operations; you just hold your position and wait for the rise.
#marscion Earlier on, the main forces aggressively kept smashing the market. Especially in the past few days, the wide-range consolidation between 0.08 and 0.10 shook out a lot of supply—these were essentially the final “distribution/cut-off” actions by the main forces. Now that it’s pulled back into the 0.11–0.12 range, it basically means the bottoming move has also been completed. After completing this round of positioning, unless it gets pushed back down to the previous low area again, otherwise there won’t be any more operations.
This month, $PONS and $MARSCOIN both experienced a halving-style pullback. At the peak drawdown, the account value fell by 300k+ U. But even so, we still executed the positioning plan as originally scheduled. During this correction, we ran into rate-hike expectations—arc diverting flows, continued selling pressure from big holders, and other negative factors. The pressure sequence is almost identical to what happened when the 0.03 pons adjustment met competition from the uni chain, the V2 version delay, and big-holder selling pressure. In fact, the worst time when the market is panicking and the retail crowd is cursing the most is often the best time to build positions. If you miss it, then you only get stuck watching from the sidelines, afraid to chase higher all the way.
After the arc chain went live, it went straight downhill—opening high then sliding lower. The rh chain was briefly hit, but the funds quickly flowed back again. For the rh coins that had already suffered huge early declines, they have all started to surge strongly, including the so-called “leader” Cash Cat—even though it wasn’t held much at the beginning. #pons In this round of correction, the lowest it dipped was around the limit level 0.5 I mentioned earlier—so this pullback-and-bottoming move can basically be declared over. Next, it will still be as I said: a choppy upward grind, slowly digesting the sell-off and trapped positions above, then breaking to new highs and entering the next main upwave. This phase may take some time to complete. After the pons setup is fully positioned, there will basically be no day-to-day operations; you just hold your position and wait for the rise.
#marscion Earlier on, the main forces aggressively kept smashing the market. Especially in the past few days, the wide-range consolidation between 0.08 and 0.10 shook out a lot of supply—these were essentially the final “distribution/cut-off” actions by the main forces. Now that it’s pulled back into the 0.11–0.12 range, it basically means the bottoming move has also been completed. After completing this round of positioning, unless it gets pushed back down to the previous low area again, otherwise there won’t be any more operations.
This month, $PONS and $MARSCOIN both experienced a halving-style pullback. At the peak drawdown, the account value fell by 300k+ U. But even so, we still executed the positioning plan as originally scheduled. During this correction, we ran into rate-hike expectations—arc diverting flows, continued selling pressure from big holders, and other negative factors. The pressure sequence is almost identical to what happened when the 0.03 pons adjustment met competition from the uni chain, the V2 version delay, and big-holder selling pressure. In fact, the worst time when the market is panicking and the retail crowd is cursing the most is often the best time to build positions. If you miss it, then you only get stuck watching from the sidelines, afraid to chase higher all the way.
#marscion Earlier on, the main forces aggressively kept smashing the market. Especially in the past few days, the wide-range consolidation between 0.08 and 0.10 shook out a lot of supply—these were essentially the final “distribution/cut-off” actions by the main forces. Now that it’s pulled back into the 0.11–0.12 range, it basically means the bottoming move has also been completed. After completing this round of positioning, unless it gets pushed back down to the previous low area again, otherwise there won’t be any more operations.
This month, $PONS and $MARSCOIN both experienced a halving-style pullback. At the peak drawdown, the account value fell by 300k+ U. But even so, we still executed the positioning plan as originally scheduled. During this correction, we ran into rate-hike expectations—arc diverting flows, continued selling pressure from big holders, and other negative factors. The pressure sequence is almost identical to what happened when the 0.03 pons adjustment met competition from the uni chain, the V2 version delay, and big-holder selling pressure. In fact, the worst time when the market is panicking and the retail crowd is cursing the most is often the best time to build positions. If you miss it, then you only get stuck watching from the sidelines, afraid to chase higher all the way.
盈亏同源_知行合一:
哈哈,我0.53买了1000,也是没拿住,后面想再进只能高位了
58
1
24
25.7k




·
--
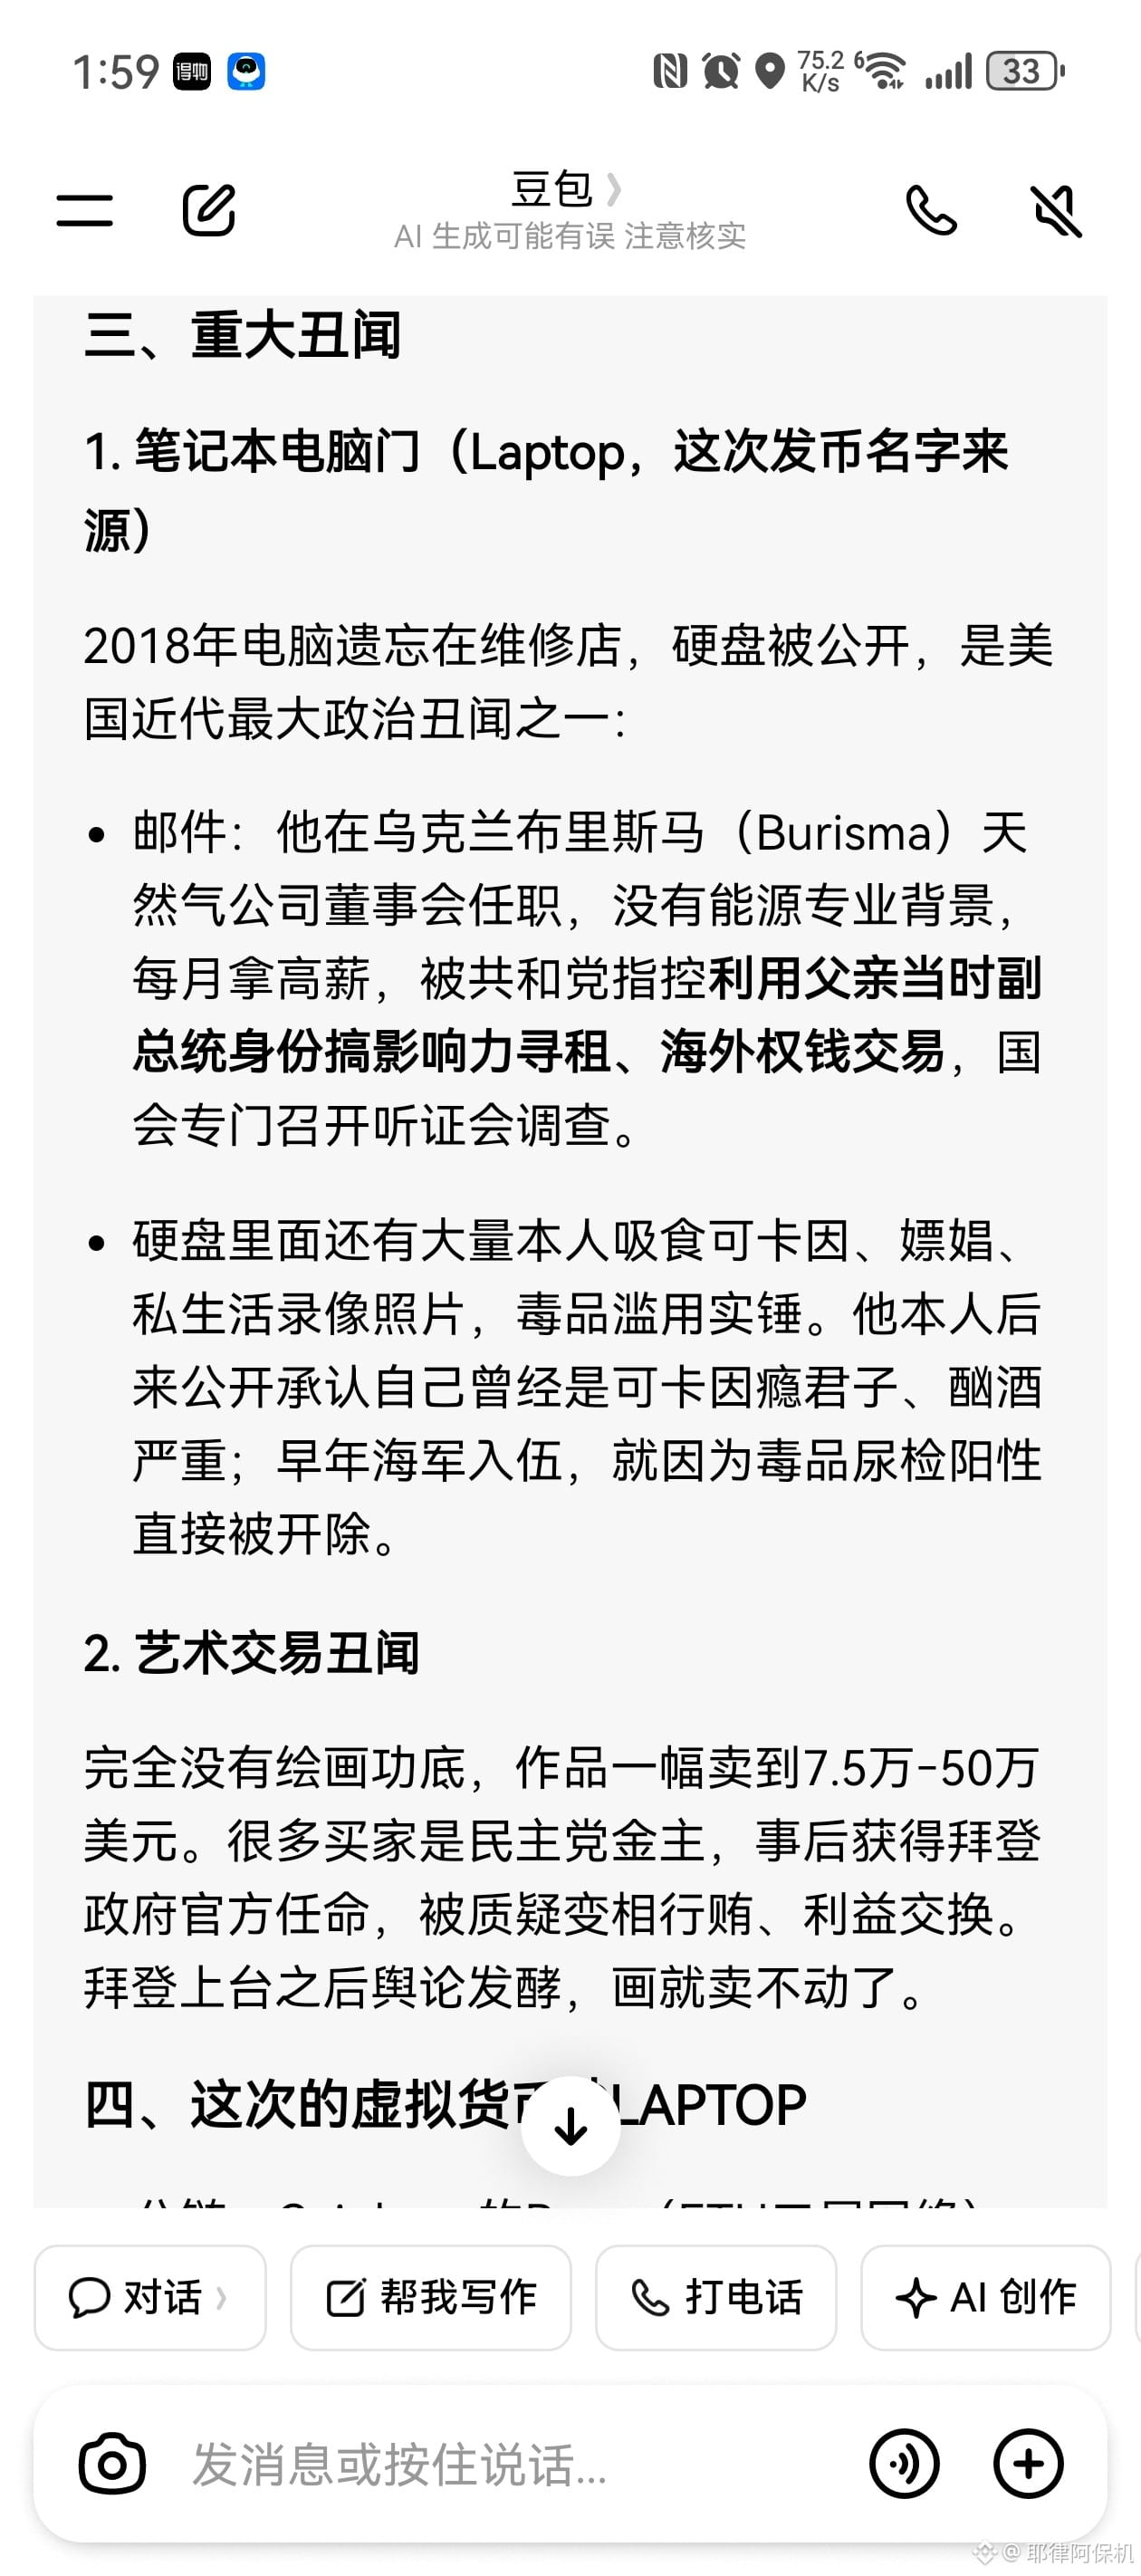
Attention!!!
Do not buy that person's coins
Drugs + paedophilia + sleeps with his sister-in-law
He’s simply short of money, so he’s out here scamming people
Believe me, he will疯狂 dump his coins
#marscion
Attention!!!
Do not buy that person's coins
Drugs + paedophilia + sleeps with his sister-in-law
He’s simply short of money, so he’s out here scamming people
Believe me, he will疯狂 dump his coins
#marscion
Do not buy that person's coins
Drugs + paedophilia + sleeps with his sister-in-law
He’s simply short of money, so he’s out here scamming people
Believe me, he will疯狂 dump his coins
#marscion


7
1
10
8.4k

·
--
Used OI to analyze #marscion , and a bunch of bulls are holding their positions
The imbalance between long and short is huge (severely bearish divergence)
· Long/short ratio: Buy-side accounts for 69.29%, while sell-side is only 30.71%, showing market sentiment is extremely tilted toward bulls.
· OI and price: OI is as high as 172 million USDT, but the coin price plunged -20.93% in a single day. This indicates that a large amount of long capital is trapped, and instead of cutting losses and leaving, they are stubbornly holding on.
2. Net position reveals the real pressure (key)
Total open interest is 172 million, but NV is only 41.3 million. This means that after hedging long and short positions, the market’s net long position is about 41.3 million.
· Implied logic: Although there are many buy orders, the main short side has used less capital (high leverage) to suppress the huge long side. The existing 172 million in long positions is under massive floating losses. If the price keeps falling, it is very likely to trigger a chain liquidation of longs forcing more longs to sell.
3. Order book liquidity trap
· Abnormal order placement: Buy-side orders are extremely thick
· Risk of bullish bait: A thick buy wall is usually a "paper tiger" or retail dip-buying, rather than true support from major players. If the buy wall is broken, there is almost no buffer below, and the price could plunge instantly.
4. Volume verification (is it shrinking on the way down or expanding?)
· Trading volume is 264 million USDT, lower than the 5-day average volume (311 million). This shows the decline did not come with sufficient volume, meaning the previous bulls have not fully capitulated yet (not all have been liquidated), and the downtrend is likely not at its bottom yet.
Conclusion and strategy recommendation:
The current OI structure is extremely unhealthy, a classic continuation pattern in a downtrend with "heavy long positions trapped + net long dominance." The short trend is in absolute control, so bottom-fishing is not recommended.
· Risk to watch: If the price breaks below the 0.1875 buy accumulation zone, it may trigger large-scale forced liquidation of longs, accelerating the drop toward 0.1800 or even lower.
· Trading approach: Until OI (172 million) shows a significant decline (more than 20% reduction), treat any rebound as bullish bait. Following the trend with short positions or staying on the sidelines is preferable. If you want to bet on a rebound, wait for a signal after a sharp drop accompanied by a sharp decrease in OI (indicating longs have been liquidated and cleared out).
Used OI to analyze #marscion , and a bunch of bulls are holding their positions
The imbalance between long and short is huge (severely bearish divergence)
· Long/short ratio: Buy-side accounts for 69.29%, while sell-side is only 30.71%, showing market sentiment is extremely tilted toward bulls.
· OI and price: OI is as high as 172 million USDT, but the coin price plunged -20.93% in a single day. This indicates that a large amount of long capital is trapped, and instead of cutting losses and leaving, they are stubbornly holding on.
2. Net position reveals the real pressure (key)
Total open interest is 172 million, but NV is only 41.3 million. This means that after hedging long and short positions, the market’s net long position is about 41.3 million.
· Implied logic: Although there are many buy orders, the main short side has used less capital (high leverage) to suppress the huge long side. The existing 172 million in long positions is under massive floating losses. If the price keeps falling, it is very likely to trigger a chain liquidation of longs forcing more longs to sell.
3. Order book liquidity trap
· Abnormal order placement: Buy-side orders are extremely thick
· Risk of bullish bait: A thick buy wall is usually a "paper tiger" or retail dip-buying, rather than true support from major players. If the buy wall is broken, there is almost no buffer below, and the price could plunge instantly.
4. Volume verification (is it shrinking on the way down or expanding?)
· Trading volume is 264 million USDT, lower than the 5-day average volume (311 million). This shows the decline did not come with sufficient volume, meaning the previous bulls have not fully capitulated yet (not all have been liquidated), and the downtrend is likely not at its bottom yet.
Conclusion and strategy recommendation:
The current OI structure is extremely unhealthy, a classic continuation pattern in a downtrend with "heavy long positions trapped + net long dominance." The short trend is in absolute control, so bottom-fishing is not recommended.
· Risk to watch: If the price breaks below the 0.1875 buy accumulation zone, it may trigger large-scale forced liquidation of longs, accelerating the drop toward 0.1800 or even lower.
· Trading approach: Until OI (172 million) shows a significant decline (more than 20% reduction), treat any rebound as bullish bait. Following the trend with short positions or staying on the sidelines is preferable. If you want to bet on a rebound, wait for a signal after a sharp drop accompanied by a sharp decrease in OI (indicating longs have been liquidated and cleared out).
The imbalance between long and short is huge (severely bearish divergence)
· Long/short ratio: Buy-side accounts for 69.29%, while sell-side is only 30.71%, showing market sentiment is extremely tilted toward bulls.
· OI and price: OI is as high as 172 million USDT, but the coin price plunged -20.93% in a single day. This indicates that a large amount of long capital is trapped, and instead of cutting losses and leaving, they are stubbornly holding on.
2. Net position reveals the real pressure (key)
Total open interest is 172 million, but NV is only 41.3 million. This means that after hedging long and short positions, the market’s net long position is about 41.3 million.
· Implied logic: Although there are many buy orders, the main short side has used less capital (high leverage) to suppress the huge long side. The existing 172 million in long positions is under massive floating losses. If the price keeps falling, it is very likely to trigger a chain liquidation of longs forcing more longs to sell.
3. Order book liquidity trap
· Abnormal order placement: Buy-side orders are extremely thick
· Risk of bullish bait: A thick buy wall is usually a "paper tiger" or retail dip-buying, rather than true support from major players. If the buy wall is broken, there is almost no buffer below, and the price could plunge instantly.
4. Volume verification (is it shrinking on the way down or expanding?)
· Trading volume is 264 million USDT, lower than the 5-day average volume (311 million). This shows the decline did not come with sufficient volume, meaning the previous bulls have not fully capitulated yet (not all have been liquidated), and the downtrend is likely not at its bottom yet.
Conclusion and strategy recommendation:
The current OI structure is extremely unhealthy, a classic continuation pattern in a downtrend with "heavy long positions trapped + net long dominance." The short trend is in absolute control, so bottom-fishing is not recommended.
· Risk to watch: If the price breaks below the 0.1875 buy accumulation zone, it may trigger large-scale forced liquidation of longs, accelerating the drop toward 0.1800 or even lower.
· Trading approach: Until OI (172 million) shows a significant decline (more than 20% reduction), treat any rebound as bullish bait. Following the trend with short positions or staying on the sidelines is preferable. If you want to bet on a rebound, wait for a signal after a sharp drop accompanied by a sharp decrease in OI (indicating longs have been liquidated and cleared out).
360





·
--
#marscion #fartucoin me have been generated a lot this week I hope it has happened to you too🤑$
#marscion #fartucoin me have been generated a lot this week I hope it has happened to you too🤑$
1
37
Log in to explore more content
Join global crypto users on Binance Square
⚡️ Get latest and useful information about crypto.
💬 Trusted by the world’s largest crypto exchange.
👍 Discover real insights from verified creators.
Email / Phone number
Trending Topics
1
#BinanceWillListHyperliquid(HYPE)
63,715 views
1,560 Discussing
2
#FedOctoberRateHikeOddsRiseTo69.7%
10,550 views
522 Discussing
3
#BitcoinFallsBelow$83,000
2,165 views
20 Discussing
4
#BitcoinFallsToAround$84,600ThisWeek
0 views
0 Discussing
5
#US30YearYieldHighestSince2004
14,059 views
449 Discussing
6
#ETHBreaksAbove$2,700
1,072 views
20 Discussing
7
#USWeighsPromotingDollarStablecoinsAbroad
43,790 views
1,333 Discussing
8
#US10YTreasuryYieldHits19YearHigh
42,940 views
1,048 Discussing
9
#SpotBitcoinETFsInflow$2.31BInFourDays
5,460 views
64 Discussing
10
#BitcoinRejectedAt$87,300Twice
0 views
0 Discussing